

Abstract
A genome-wide association study of 94,674 multi-ethnic Kaiser Permanente members utilizing 478,866 longitudinal untreated serum lipid electronic-health-record-derived measurements (EHRs) empowered multiple novel findings: 121 new SNP associations (46 primary, 15 conditional, 60 in meta-analysis with Global Lipids Genetic Consortium); increase of 33-42% in variance explained with multiple measurements; sex differences in genetic impact (greater in females for LDL, HDL, TC, the opposite for TG); differences in variance explained amongst non-Hispanic whites, Latinos, African Americans, and East Asians; genetic dominance and epistasis, with strong evidence for both at ABOxFUT2 for LDL; and eQTL tissue-enrichment implicating the liver, adipose, and pancreas. Utilizing EHR pharmacy data, both LDL and TG genetic risk scores (477 SNPs) were strongly predictive of age-at-initiation of lipid-lowering treatment. These findings highlight the value of longitudinal EHRs for identifying novel genetic features of cholesterol and lipoprotein metabolism with implications for lipid treatment and risk of coronary heart disease.
Keywords: Serum lipids, genome-wide association study, HDL cholesterol, LDL cholesterol, triglycerides, total cholesterol, statins, electronic health records, liver, pancreas
Plasma lipid concentrations are heritable cardiovascular disease therapeutic intervention targets1,2. Meta-analysis of 23 studies of 94,595 individuals with genome-wide and 93,982 individuals with Metabochip genotype data in the Global Lipids Genetics Consortium (GLGC) identified 157 loci associated with high-density lipoprotein cholesterol (HDL), low-density lipoprotein cholesterol (LDL), triglycerides (TG), and total cholesterol (TC) plasma concentration3, extending4. Subsequent studies found additional associations5–18, totaling approximately 189 loci, plus two founder variants common only in Sardinians19.
Prior large-scale serum lipid genome-wide association studies (GWAS) generally combined many smaller studies3,4, rather than using a single large cohort. Thus direct conditional analyses for additional independent significant SNPs at each locus have been much smaller: 12,834 individuals genome-wide16, 24,894 exome-wide from 16 cohorts20, and earlier fine-mapping of several regions with 6,832 African Americans, 9,449 East Asians, and 10,829 Europeans18. An alternative approach used meta-analysis summary statistics (n=100,184; 46 studies); however, this relies on frequency and LD assumptions21.
Recent estimates of variance explained by previously-detected loci are 12.8% (HDL), 19.5% (LDL), 9.3% (TG), and 18.8% (TC), with ∼1% due to less-common variants (MAF≤0.05)16. These figures are substantially below family-based heritability estimates, e.g., 40% (HDL), 51% (LDL), 33% (TG), and 51% (TC)22. This suggests many more lipid variants remain undiscovered. Previous studies have generally been based on single untreated lipid measurements3,4,16. Longitudinal data, readily obtained from electronic health records (EHRs), has been shown to reduce phenotypic variance, increasing statistical power and variant discovery23,24. We thus reasoned a single large multi-ethnic cohort GWAS of 94,674 individuals, utilizing repeated measurements (n=478,866) from EHRs, would enhance discovery power and enable novel insights.
Results
GERA
We conducted primary discovery in the multi-ethnic Genetic Epidemiology Resource on Adult Health and Aging (GERA) cohort (n=94,674 participants with untreated lipid measurements) Table 1)25–28. On average, the first untreated measurement was at 55.4 years, with 5.0 untreated measurements over 6.9 years follow-up. Non-Hispanic whites were slightly older. Before covariate adjustment, South Asians had lower HDL, LDL, and TC, and African Americans had much lower TG. However, after adjusting for age, sex, and BMI, African Americans had the highest HDL (substantially) and LDL and lowest TC, South Asians the highest TG, and East Asians the highest TC (Supplementary Table 1A).
Table 1.
Descriptive factors for the GERA study population used in the genome-wide association study of serum lipid traits.
| Non-Hispanic white | Latino | East Asian | African American | South Asian | ||||||
|---|---|---|---|---|---|---|---|---|---|---|
| Group | Value | %/SD/IQR | Value | %/SD/IQR | Value | %/SD/IQR | Value | %/SD/IQR | Value | %/SD/IQR |
| N (%) | 76627 | 80.9% | 7795 | 8.2% | 6855 | 7.2% | 2958 | 3.1% | 439 | 0.5% |
|
| ||||||||||
| N Female (%) | 44856 | 58.5% | 4708 | 60.4% | 4013 | 58.5% | 1761 | 59.5% | 177 | 40.3% |
|
| ||||||||||
| Avg # meas | 5.0 | 3.7 | 4.9 | 3.8 | 5.3 | 4.1 | 5.2 | 3.9 | 5.1 | 3.8 |
|
| ||||||||||
| Age (at first meas) | ||||||||||
| Female mean (SE) | 55.4 | 12.1 | 49.2 | 12.6 | 49.4 | 12.5 | 51.5 | 12.1 | 45.2 | 11.1 |
| Male mean (SE) | 57.8 | 11.3 | 53.5 | 12.3 | 53.4 | 12.2 | 55.1 | 10.9 | 48.8 | 12.2 |
|
| ||||||||||
| Follow-up (years) | ||||||||||
| Female mean (SE) | 7.3 | 4.8 | 6.9 | 4.7 | 7.3 | 4.8 | 6.9 | 4.7 | 6.9 | 4.5 |
| Male mean (SE) | 6.6 | 5.0 | 6.3 | 4.8 | 6.4 | 4.9 | 6.4 | 5.0 | 6.0 | 4.7 |
|
| ||||||||||
| BMI (at first meas) | ||||||||||
| Female median [IQR] | 26.5 | 24.5-30.5 | 27.5 | 24.5-32.3 | 24.5 | 21.8-27.5 | 30.5 | 26.5-34.5 | 25.5 | 23.0-27.5 |
| Male median [IQR] | 27.5 | 25.5-30.5 | 28.5 | 26.5-31.5 | 25.5 | 24.5-28.3 | 29.0 | 26.5-32.5 | 26.5 | 24.5-27.9 |
|
| ||||||||||
| HDL (at first meas, mg/dL) | ||||||||||
| Female median [IQR] | 59 | 49-70 | 54 | 46-65 | 59 | 49-69 | 57 | 48-68 | 53 | 45-62 |
| Male median [IQR] | 44 | 37-53 | 43 | 36-51 | 46 | 39-55 | 47 | 40-56 | 41 | 34-48 |
|
| ||||||||||
| LDL (at first meas, mg/dL) | ||||||||||
| Female median [IQR] | 126 | 104-151 | 121 | 100-146 | 118 | 97-143 | 125 | 101-153 | 114 | 93-136 |
| Male median [IQR] | 133 | 111-157 | 134 | 110-158 | 132 | 111-156 | 135 | 112-163 | 128 | 105-152 |
|
| ||||||||||
| TG (at first meas, mg/dL) | ||||||||||
| Female median [IQR] | 111 | 78-163 | 116 | 80-168 | 107 | 76-159 | 91 | 66-128 | 108 | 73-147 |
| Male median [IQR] | 126 | 88-186 | 143 | 99-208 | 137 | 96-207 | 106 | 76-150 | 144 | 101-209 |
|
| ||||||||||
| TC (at first meas, mg/dL) | ||||||||||
| Female median [IQR] | 213 | 187-240 | 205 | 179-234 | 205 | 179-232 | 206 | 179-236 | 196 | 167-220 |
| Male median [IQR] | 209 | 184-235 | 211 | 185-237 | 213 | 189-238 | 210 | 182-237 | 203 | 176-228 |
Meas, measurement(s); SD, standard deviation; IQR, interquartile range.
We further assessed age, sex, BMI, and genetic ancestry effects on lipid phenotypes within each self-reported-ancestral group (Supplementary Table 1B). Female sex predicted higher HDL, with R2 ranging from 11% (non-Hispanic whites) to 23% (South Asians); the sex effect was modest (R2<1%) for the other lipids. Lower BMI predicted higher HDL, with R2 ranging from 8.2% (African Americans) to 24.8% (East Asians); associations were weaker for other lipids. Age explained <0.2% of HDL variance across groups, and 1-10% of LDL, TG, and TC variance. Although statistically significant, ancestry principal components (PCs, estimated and analyzed within each group) explained little variance for any lipid trait (generally <1%).
Novel GERA loci, GLGC meta-analysis
For the discovery GWAS, for each of HDL, LDL, TG, and TC, we analyzed each GERA ancestral group separately29 and then combined via meta-analysis30 (see Methods). Genomic inflation factors (λ) ranged from 1.07-1.09 (Supplementary Figures 1-2; Supplementary Tables 2-6), reasonable for a polygenic trait with this sample size31. We identified 171 genome-wide significant (P≤5×10⁻⁸) loci for at least one lipid trait; of these, 125 replicated previous findings.
We then tested the 46 novel loci's lead SNPs for replication (requiring the same direction) in 94,595 European ancestry GLGC individuals3,4 (HapMap summary statistics extended32; Methods; Table 2; Supplementary Table 3; Supplementary Figure 3), and in 460,088 UK Biobank (UKB) individuals33 self-reporting lipid-lowering medications (Methods). Of the 46 SNPs, 17 Bonferroni-replicated (P<0.05/46=0.0011), and 14 additional were nominally significant (P=0.05); there was a clear distributional enrichment for smaller P-values, e.g., 67% met nominal or better significance, far more than the 2.5% expected by chance (requiring same direction; Supplementary Figure 4). Seven of the 46 SNPs reached genome-wide significance for multiple traits. None of the 46 SNPs had significant heterogeneity34 within GERA (Bonferroni P<0.0011; Table 2).
Table 2.
Novel GERA (n=94,674) lipid loci. SNPs are additively coded according to the number of alleles first mentioned so that the effect size is positive (change per additional lipid-increasing allele in LDL, HDL, TG or TC transformed to a standard normal distribution).
| SNP | Closest Gene |
Candidate Gene(s) | Chr:Pos | Allele | GER A Freq |
GERA Info |
Trait | GERA I2 |
GERA Het. P |
GERA Eff |
GERA P | GLGC P | UKB META P |
GLGC+ UKB P |
GERA/ GERA+ UKB[ GLGC/ UKB] Sign |
Rep | Other Traits |
|---|---|---|---|---|---|---|---|---|---|---|---|---|---|---|---|---|---|
| rs144432213 | FAF1(i) | FAF1(c) | 1:51353720 | C/G | .910 | .962 | TG | 56 | .06 | .039 | 6.1e-9 | .054 | 3.6e-5 | 1.8e-05 | ++[++] | B | |
| rs55878063 | NFIA(i) | NFIA(c) | 1:61671909 | A/G | .066 | .944 | HDL | 27 | .26 | .040 | 1.5e-8 | .52 | .011 | 0.025 | ++[++] | N | |
| rs145882729‡ | DR1(3′) | DR1(pao), RP4-717I23.3(pao),+ | 1:93837780 | AAAAC/A | .380 | .983 | HDL | 0 | .86 | .022 | 6.1e-10 | 6.1e-7 | .69 | 0.0012 | ++[+-] | N | |
| rs7519429* | PIGC(i) | PIGC(o) | 1:172349246 | A/C | .620 | .955 | TG | 0 | .47 | .025 | 1.4e-10 | .14 | 5.7e-5 | 9.7e-05 | ++[++] | B | |
| rs4651135‡ | LAMC1(5′) | LAMC1(ao), RP11-181K3.4(ao) | 1:182970547 | G/A | .500 | .919 | TC | 0 | .44 | .025 | 1.2e-8 | .0029 | .0073 | 6.2e-05 | ++[++] | B | |
| rs6695980 | OPTC(3′) | ATP2B4(o) | 1:203519194 | T/C | .474 | .915 | TG | 53 | .076 | .022 | 2.8e-8 | .0027 | .00031 | 3.1e-06 | ++[++] | B | |
| rs2791547* | RP11-95P13.1(5′) | RP11-392O17.1(o) | 1:219659668 | T/A | .578 | .964 | TG | 0 | .58 | .025 | 3.1e-10 | .0015 | 2.8e-6 | 2.8e-08 | ++[++] | B | |
| rs2706770 | TIA1(i) | PCYOX1(o), FAM136A(o),+ | 2:70471899 | G/A | .409 | .962 | TC | 13 | .33 | .025 | 1.1e-8 | .0016 | .0021 | 1e-05 | ++[++] | B | |
| rs10198423 | TGOLN2(5′) | RETSAT(o), TGOLN2(o),+ | 2:85560562 | C/G | .682 | .915 | HDL | 0 | .55 | .023 | 5.1e-9 | 1.4e-5 | .2 | 0.03 | ++[+-] | N | |
| rs77004761 | AC096670.3(i) | AC096670.3(a),+ | 2:111868691 | T/A | .901 | .968 | TG | 0 | .92 | .039 | 6.7e-10 | .23 | .0017 | 0.0022 | ++[++] | N | |
| rs55709272‡ | IL1RN(i) | IL1RN(o),+ | 2:113867288 | T/C | .590 | .999 | TC | 51 | .083 | .024 | 1.8e-8 | 8.8e-5 | .034 | 1.9e-05 | ++[++] | B | |
| rs72285796 | KPNA1(i) | PARP9(o), KPNA1(o),+ | 3:122176238 | T/TG | .314 | .989 | LDL | 0 | .67 | .032 | 4.3e-12 | 1.9e-5 | .001 | 8.8e-08 | ++[++] | B | TC |
| rs78086267 | RP11-550I24.2(i) | RP11-550I24.2(c) | 3:156915089 | A/G | .847 | .865 | TG | 0 | .71 | .032 | 1.8e-8 | .2 | .55 | 0.18 | ++[++] | ||
| rs112545201† | ETV5(i) | ETV5(o) | 3:185803532 | C/T | .873 | .997 | HDL | 0 | .43 | .046 | 2.5e-19 | .0034 | .34 | 0.16 | ++[+-] | ||
| rs13114070 | TMPRSS11E(i) | UGT2B15(o), UGT2B17(o) | 4:69349893 | T/C | .675 | .831 | TC | 0 | .41 | .028 | 1.6e-8 | .88 | .00023 | 0.013 | ++[-+] | N | |
| rs201330646 | TET2(i) | TET2(c) | 4:106169706 | T/TAAC | .044 | .965 | HDL | 0 | .52 | .050 | 2.2e-9 | .65 | .27 | 0.64 | +-[+-] | ||
| rs62362194 | FCHO2(i) | CTD-2631K10.1(o) | 5:72346125 | C/T | .131 | .898 | HDL | 0 | .5 | .030 | 4.2e-8 | .34 | .007 | 0.22 | ++[-+] | ||
| rs2522061‡ | C5orf56(i) | AC034220.3(vo),+ | 5:131804045 | G/T | .775 | .996 | LDL | 12 | .34 | .034 | 4.4e-11 | .012 | .03 | 0.00094 | ++[++] | B | TC |
| rs1651274 | RP11-32D16.1(3′) | RP11-32D16.1(c) | 5:158020425 | A/G | .737 | .976 | HDL | 2.4 | .39 | .023 | 3e-9 | .00049 | .0027 | 4.4e-06 | ++[++] | B | |
| rs10948059 | GNMT(5′) | PEX6(vpao), GNMT(ao),+ | 6:42928461 | T/C | .445 | .987 | HDL | 10 | .35 | .020 | 8.1e-9 | .013 | .083 | 0.0029 | ++[++] | N | |
| rs12529923 | GSTA5(5′) | GSTA2(vp), TMEM14A(v),+ | 6:52736056 | C/T | .656 | .996 | HDL | 40 | .16 | .021 | 1.4e-8 | .0085 | .91 | 0.052 | ++[++] | ||
| rs181937009 | RP3-332B22.1(5′) | RP3-332B22.1(c) | 6:140385395 | A/G | .755 | .913 | TG | 54 | .069 | .028 | 1.7e-9 | .0041 | .0005 | 7.1e-06 | ++[++] | B | |
| rs1281955* | RGS17(5′) | RGS17(o) | 6:153459444 | A/T | .377 | .982 | HDL | 11 | .34 | .020 | 2.2e-8 | .0081 | .069 | 0.0016 | ++[++] | N | |
| rs2534596 | TRGC2(3′) | TRGC2(o), TRGJP2(o),+ | 7:38277792 | G/A | .383 | .986 | HDL | 0 | .62 | .020 | 2.1e-8 | .0028 | .59 | 0.012 | ++[++] | N | |
| rs2299247 | CALCR(i) | CALCR(c) | 7:93083588 | T/G | .530 | .964 | TG | 0 | .87 | .023 | 1.3e-9 | .26 | .0006 | 0.0013 | ++[++] | N | |
| rs2958557 | SH2D4A(i) | SH2D4A(c) | 8:19251679 | T/C | .010 | .834 | TG | 0 | 1 | .117 | 2.6e-8 | --- | .22 | 0.22 | ++[?+] | ||
| rs13248499‡ | SNTB1(5′) | SNTB1(c) | 8:121860589 | G/A | .340 | .956 | HDL | 0 | .63 | .025 | 1.4e-11 | 2.9e-5 | .021 | 0.19 | ++[+-] | ||
| rs202246180‡ | DENND4C(i) | RPS6(ao), RP11-513M16.8(ao) | 9:19368272 | T/TTTC | .101 | .948 | TC | 51 | .086 | .040 | 3.1e-8 | .0019 | 9.8e-11 | 1.3e-11 | ++[++] | B | |
| rs74551598 | DFNB31(i) | ORM2(o),+ | 9:117177566 | A/C | .767 | .886 | TC | 0 | .76 | .030 | 1.6e-8 | .55 | .41 | 0.87 | +-[+-] | ||
| rs57176252† | OIT3(i) | NUDT13(o),+ | 10:74662593 | C/A | .945 | .989 | LDL | 0 | .42 | .055 | 1.2e-8 | .01 | .36 | 0.014 | ++[++] | N | |
| rs7079858 | RP11-159H3.2(5′) | WDR11(o), FGFR2(a) | 10:122859177 | G/T | .900 | .992 | HDL | 61 | .038 | .031 | 4.9e-8 | .13 | .28 | 0.067 | ++[++] | ||
| rs7935422 | NAP1L4(3′) | NAP1L4(o) | 11:2958538 | T/C | .565 | .942 | HDL | 70 | .0089 | .020 | 1.5e-8 | .00012 | .099 | 0.12 | ++[+-] | ||
| rs11601507 | TRIM5(e) | TRIM5(m) | 11:5701074 | A/C | .067 | .910 | LDL | 0 | .9 | .051 | 6.6e-9 | .025 | 1.4e-10 | 9e-10 | ++[++] | B | |
| rs11231698* | MACROD1(i) | VEGFB(o),+ | 11:63877163 | T/C | .083 | .822 | TG | 0 | .81 | .051 | 5.9e-9 | .005 | 3.2e-9 | 6.9e-10 | ++[++] | B | |
| rs2812208 | DLEU1(i) | DLEU1(c) | 13:50707087 | G/C | .977 | .837 | TG | 0 | .88 | .075 | 2.7e-8 | .032 | .0029 | 0.00029 | ++[++] | B | |
| rs7148864 | PLEXHG3(5′) | HSPA2(o) | 14:65119839 | G/A | .211 | .999 | HDL | 42 | .14 | .025 | 1.1e-8 | .87 | .26 | 0.36 | ++[++] | TG | |
| rs11620731 | COX16(i) | SYNJ2BP(o) | 14:70817141 | C/T | .857 | .994 | LDL | 0 | .89 | .041 | 1e-11 | .0046 | 6.1e-5 | 1.3e-06 | ++[++] | B | TC |
| rs58752567 | TRIP11(i) | TRIP11(vao), RP11-529H20.6(vao),+ | 14:92498829 | A/ATAT | .234 | .966 | HDL | 0 | .95 | .023 | 1.1e-8 | .052 | .23 | 0.026 | ++[++] | N | |
| rs17580 | SERPINA1(e) | SERPINA1(m) | 14:94847262 | A/T | .037 | 1.000 | LDL | 44 | .15 | .073 | 9.4e-11 | .49 | .0015 | 0.0063 | ++[++] | N | TC |
| rs4776342 | SMAD3(i) | SMAD3(c) | 15:67418391 | G/A | .270 | .991 | TG | 0 | .49 | .024 | 4.7e-8 | .52 | .0018 | 0.0077 | ++[++] | N | |
| rs67890964 | RP11-505K9.4(i) | OSGIN1(o) | 16:83979317 | T/C | .603 | 1.000 | LDL | 0 | .91 | .027 | 1.4e-9 | .11 | .0041 | 0.0015 | ++[++] | N | TC |
| rs2645492 | VMP1(i) | AC005702.4(ao),+ | 17:57875554 | G/A | .781 | 1.000 | LDL | 0 | .66 | .029 | 2.2e-8 | .51 | .97 | 0.66 | +-[-+] | ||
| rs59774409 | FCGRT(i) | FCGRT(o),+ | 19:50016748 | T/C | .097 | .914 | TG | 0 | .5 | .040 | 1.8e-9 | .15 | .24 | 0.064 | ++[++] | ||
| rs138331350 | FANCB(3′) | FANCB(c) | 23:14860103 | A/G | .052 | .889 | HDL | 0 | .77 | .049 | 1.2e-12 | --- | .43 | 0.43 | +-[?-] | ||
| rs3859931 | RP5-972B16.2(i) | RP5-972B16.2(c) | 23:37854327 | C/T | .454 | .874 | TG | 0 | .75 | .020 | 4.4e-9 | --- | .21 | 0.21 | ++[?+] | ||
| rs306890 | SPRY3(5′) | SPRY3(c) | 25:154987147 | C/T | .257 | 1.000 | TC | 26 | .25 | .048 | 1.1e-22 | --- | 1.2e-16 | 1.2e-16 | ++[?+] | B | LDL/TG |
Note that 31 of 32 SNPs have same direction of effect in GLGC (n=94,595) versus GERA. In the closest gene column: i, variant is in intron; e, variant is in exon; 3′, variant is 3′ of gene; 5′, variant is 5′ of gene. In the candidate gene column: c, closest gene; v, liver eQTL; p, pancreas eQTL; a, adipose eQTL; o, eQTL in other tissues; +, additional eQTL genes; m, missense variant. The sign column indicates if the respective tests are in the same direction (+) or opposite direction (-); LDL is positively correlated with all traits except weakly negatively correlated with HDL, so in the replication analysis, when the trait was HDL (only), the sign of the UKB (n=460,088) Z-score was reversed before combination with GLGC. The replication (Rep) column indicates whether a variant replicated at a Bonferroni (B) or nominal (N) level of significance in GLGC+UKB (see Methods).
SNP has r2>0.8,
0.8≥r2>0.5,
We suspect our novel hits were generally not previously-identified due to insufficient power; most are near the genome-wide significance threshold, with two exceptions. One exception, rs306890 (GERA P=1.1×10⁻²²), is in the X chromosome pseudo-autosomal region, not as generally studied. Second, rs112545201 had GERA PHDL=2.5×10⁻¹⁹. It's possible this association was missed due to coverage and imputation quality of previous arrays.
We further enhanced discovery by GERA+GLGC meta-analysis (λ=1.07-1.10); 60 additional novel loci reached genome-wide significance for at least one lipid trait (Table 2C, Supplementary Tables 6-7). Testing replication (including same direction) in UKB, 14 met Bonferroni significance (P<0.05/60=0.00083), and 18 additional were nominal (P<0.05). The replication was much stronger for SNPs with LDL as the lead trait; 36%/91% of LDL SNPs met Bonferroni/nominal significance, while 16%/42% TC, 21%/47% TG, and 22%/50% HDL. Nine reached genome-wide significance for multiple traits. None of the 60 SNPs had significant heterogeneity amongst the GERA groups and GLGC (Bonferroni P<0.00083; Table 3).
Table 3.
Novel GERA+GLGC loci. SNPs are additively coded according to the number of alleles first mentioned so that the effect size is positive (change per additional lipid-increasing allele in LDL, HDL, TG or TC transformed to a standard normal distribution).
| SNP | Closest Gene | Candidate Gene(s) | Chr:Pos | Allele | Freq | Info | Trait | GERA+ GLGC I2 |
GERA+ GLGC Het. P |
GERA+ GLGC Eff |
GERA+ GLGC P |
UKB META OR |
UKB META p |
GERA/ GLGC/ UKB Sign |
Rep | Other Traits |
|---|---|---|---|---|---|---|---|---|---|---|---|---|---|---|---|---|
| rs1730859 | PRMT6(3′) | PRMT6(vao) | 1:107617707 | G/A | 0.317 | 0.942 | LDL | 0 | 0.56 | 0.019 | 8.6e-09 | 1.013 | 0.043 | +++ | N | |
| rs333947 | CSF1(i) | CSF1(ao) | 1:110470764 | G/A | 0.829 | 0.868 | HDL | 38 | 0.17 | 0.028 | 1.9e-12 | 0.998 | 0.84 | +++ | ||
| rs6671166 | NUP210L(i) | SLC39A1(o),+ | 1:154093825 | A/G | 0.347 | 0.994 | TG | 0 | 0.71 | 0.018 | 2.1e-09 | 1.001 | 0.9 | +++ | ||
| rs373579 | FCGR2A(i) | FCGR2C(vao), HSPA7(ao),+ | 1:161483484 | G/A | 0.120 | 0.904 | TC | 0 | 0.53 | 0.033 | 1.2e-11 | 1.037 | 8.3e-05 | +++ | B | LDL |
| rs2280334 | MEIS1(i) | MEIS1-AS3(o) | 2:66665146 | T/C | 0.368 | 0.991 | TG | 57 | 0.039 | 0.017 | 4.7e-08 | 1.016 | 0.009 | +++ | N | |
| rs826681 | LIMS1(i) | LIMS1(po), GCC2(ao) | 2:109232075 | T/C | 0.130 | 0.992 | LDL | 18 | 0.3 | 0.025 | 2.7e-08 | 1.010 | 0.23 | +++ | ||
| rs17576323 | AC007319.1(i) | CALCRL(o),+ | 2:188003118 | C/T | 0.187 | 0.987 | HDL | 23 | 0.26 | 0.021 | 2.7e-09 | 0.972 | 0.00014 | +++ | B | |
| rs6792725 | THRB(i) | THRB(v) | 3:24520283 | A/G | 0.339 | 0.905 | TG | 0.38 | 0.41 | 0.018 | 3.8e-08 | 1.014 | 0.033 | +++ | N | |
| rs7614016‡ | ADCY5(i) | ADCY5(c) | 3:123070426 | G/A | 0.790 | 0.987 | HDL | 0 | 0.78 | 0.021 | 1.3e-09 | 1.014 | 0.043 | ++- | TC | |
| rs4683438 | RP11-372E1.4(i) | PAQR9(v) | 3:142652559 | G/T | 0.693 | 0.999 | TG | 0 | 0.5 | 0.018 | 1.4e-08 | 1.019 | 0.002 | +++ | N | |
| rs56394279 | TRIM59(i) | SMC4(ao),+ | 3:160171092 | C/T | 0.510 | 0.992 | TC | 0 | 0.74 | 0.019 | 7.8e-09 | 1.027 | 5.1e-06 | +++ | B | |
| rs2322549 | INPP4B(i) | INPP4B(o) | 4:143317027 | A/G | 0.398 | 0.993 | TG | 59 | 0.031 | 0.018 | 3.7e-09 | 1.024 | 7.6e-05 | +++ | B | |
| rs11727676 | HHIP(e) | HHIP(c) | 4:145659064 | T/C | 0.917 | 0.958 | HDL | 2.5 | 0.38 | 0.028 | 3.8e-08 | 0.972 | 0.0045 | +++ | N | |
| rs1045241 | TNFAIP8(e) | TNFAIP8(o),+ | 5:118729286 | C/T | 0.731 | 1.000 | TG | 0 | 0.87 | 0.019 | 1.9e-08 | 1.036 | 1.1e-07 | +++ | B | |
| rs4244029 | AC005592.2(i) | AC005592.2(c) | 5:141912841 | T/C | 0.180 | 1.000 | LDL | 0 | 0.9 | 0.027 | 3.7e-10 | 1.017 | 0.032 | +++ | N | TC |
| rs6456350 | E2F3(i) | E2F3(c) | 6:20405539 | G/A | 0.651 | 0.973 | TC | 0 | 0.68 | 0.019 | 9.9e-09 | 1.020 | 0.001 | +++ | N | |
| rs17789218 | MCHR2-AS1(3′) | MCHR2-AS1(c) | 6:100600097 | T/C | 0.778 | 0.988 | LDL | 56 | 0.044 | 0.023 | 1.5e-09 | 1.028 | 5.3e-05 | +++ | B | TC |
| rs9371220* | CCDC170(i) | CCDC170(o) | 6:151858598 | T/C | 0.149 | 0.981 | TC | 0 | 0.53 | 0.027 | 6.7e-09 | 1.011 | 0.23 | +++ | ||
| rs314311 | EPHB4(i) | TRIP6(p), ACHE(ao),+ | 7:100422481 | G/T | 0.187 | 0.896 | TC | 0 | 0.81 | 0.023 | 1.2e-08 | 1.006 | 0.36 | +++ | ||
| rs2912054 | AGPAT5(i) | AGPAT5(vao) | 8:6601492 | T/G | 0.674 | 0.994 | LDL | 0 | 0.84 | 0.020 | 1.5e-09 | 1.013 | 0.03 | +++ | N | TC |
| rs10091038 | RP11-486M23.1(5′) | DUSP4(o) | 8:29360305 | A/C | 0.428 | 0.992 | HDL | 0 | 0.5 | 0.016 | 1.6e-08 | 0.986 | 0.013 | +++ | N | |
| rs10504474 | NCOA2(i) | NCOA2(c) | 8:71260460 | G/A | 0.876 | 0.999 | HDL | 0 | 0.84 | 0.025 | 4.4e-09 | 0.992 | 0.41 | +++ | ||
| rs200441621 | RP11-1102P16.1(i) | EYA1(a) | 8:72395582 | AAGCCCT/A | 0.931 | 0.941 | HDL | 0 | 0.94 | 0.036 | 9.9e-10 | 0.946 | 1.8e-06 | +++ | B | |
| rs10087900 | GPIHBP1(3′) | GPIHBP1(ao) | 8:144303418 | G/A | 0.580 | 0.569 | HDL | 0 | 0.83 | 0.027 | 2.1e-09 | 0.993 | 0.22 | +++ | ||
| rs74664507* | BNC2(5′) | BNC2(o) | 9:16913836 | T/A | 0.499 | 0.938 | TG | 39 | 0.16 | 0.018 | 1.9e-09 | 1.024 | 7.5e-05 | +++ | B | |
| rs12784396‡ | CWF19L1(e) | CWF19L1(vpao),+ | 10:102027407 | T/C | 0.378 | 1.000 | TC | 0 | 0.55 | 0.020 | 1.7e-09 | 1.005 | 0.37 | +++ | ||
| rs4619105 | ADRB1(5′) | ADRB1(o) | 10:115795236 | A/G | 0.106 | 0.999 | HDL | 0 | 0.69 | 0.026 | 4.1e-09 | 1.007 | 0.46 | ++- | ||
| rs7902274‡ | FAM24A(5′) | C10orf88(vao), FAM24B(a),+ | 10:124657809 | T/G | 0.544 | 0.990 | LDL | 41 | 0.13 | 0.019 | 3e-09 | 1.019 | 0.0012 | +++ | N | TC |
| rs2896635 | ARNTL(i) | ARNTL(o) | 11:13359745 | A/T | 0.653 | 0.973 | TG | 44 | 0.11 | 0.019 | 1.4e-09 | 1.006 | 0.35 | +++ | ||
| rs331446 | PRR5L(i) | AC009656.11(o) | 11:36446712 | T/C | 0.219 | 0.975 | TG | 0 | 0.88 | 0.020 | 3.5e-08 | 1.018 | 0.014 | +++ | N | |
| rs77403571 | MAPK8IP1(i) | MAPK8IP1(c) | 11:45913607 | A/G | 0.049 | 0.979 | HDL | 19 | 0.29 | 0.039 | 3.3e-09 | 0.996 | 0.72 | +++ | ||
| rs12575459 | OR5B3(3′) | OR5B3(c) | 11:58162382 | A/G | 0.066 | 0.978 | HDL | 0 | 0.69 | 0.033 | 9.7e-09 | 0.962 | 0.00039 | +++ | B | |
| rs10789752‡ | ZC3H12C(i) | ZC3H12C(ao) | 11:109979945 | T/C | 0.292 | 1.000 | HDL | 0 | 0.55 | 0.018 | 3.2e-09 | 1.000 | 0.95 | ++- | ||
| rs4149056‡ | SLCO1B1(e) | SLCO1B1(m) | 12:21331549 | C/T | 0.148 | 1.000 | TG | 0 | 0.65 | 0.024 | 2.1e-09 | 0.993 | 0.41 | ++- | ||
| rs11048456 | RP11-283G6.5(i) | RP11-283G6.5(c) | 12:26463082 | T/C | 0.698 | 0.999 | HDL | 44 | 0.11 | 0.018 | 2.2e-08 | 0.966 | 2.6e-07 | +++ | B | |
| rs1907631 | LRRK2(i) | LRRK2(v) | 12:40606663 | C/T | 0.115 | 0.995 | LDL | 0 | 0.72 | 0.032 | 2.3e-10 | 1.022 | 0.016 | +++ | N | TC |
| rs11170538 | SP1(i) | ESPL1(o) | 12:53796744 | T/C | 0.505 | 0.884 | HDL | 14 | 0.33 | 0.018 | 2.7e-09 | 0.984 | 0.0078 | +++ | N | |
| rs2657880 | SPRYD4(e) | GLS2(mo), SPRYD4(vao),+ | 12:56863770 | C/G | 0.181 | 0.996 | TG | 0 | 0.86 | 0.023 | 4.9e-10 | 0.997 | 0.66 | ++- | ||
| rs7955221* | NR1H4(5′) | NR1H4(c) | 12:100850750 | A/C | 0.576 | 0.958 | TC | 0 | 0.71 | 0.020 | 1.1e-09 | 1.014 | 0.015 | +++ | N | LDL |
| rs10778215 | RP11-328J6.1(i) | RP11-328J6.1(c) | 12:103537266 | T/A | 0.494 | 1.000 | TG | 8.9 | 0.36 | 0.016 | 4.7e-08 | 0.989 | 0.068 | ++- | ||
| rs7968419 | CORO1C(5′) | CORO1C(vao),+ | 12:109137726 | T/C | 0.302 | 0.996 | LDL | 20 | 0.28 | 0.020 | 4.6e-09 | 1.024 | 0.00017 | +++ | B | TC |
| rs9556404 | GPR180(i) | GPR180(vpao) | 13:95254382 | A/G | 0.342 | 0.976 | TG | 0 | 0.93 | 0.018 | 4.7e-09 | 1.003 | 0.64 | +++ | ||
| rs7333748 | COL4A2(i) | COL4A2(c) | 13:111018729 | C/G | 0.591 | 0.999 | TG | 0 | 0.44 | 0.016 | 4.8e-08 | 1.004 | 0.49 | +++ | ||
| rs12588415‡ | YLPM1(i) | RPS6KL1(ao), PROX2(a),+ | 14:75278211 | G/A | 0.537 | 0.996 | TC | 24 | 0.25 | 0.018 | 1.1e-08 | 0.994 | 0.26 | ++- | ||
| rs12431415 | RP11-7F17.5(5′) | CIPC(o) | 14:77503443 | A/G | 0.320 | 0.925 | TG | 0 | 0.58 | 0.018 | 2.3e-08 | 1.002 | 0.81 | +++ | ||
| rs1531140 | JMJD7(i) | MGA(vao), SPTBN5(ao),+ | 15:42125234 | T/C | 0.324 | 0.951 | TG | 0 | 0.49 | 0.018 | 1.5e-08 | 1.015 | 0.016 | +++ | N | |
| rs72731954 | TCF12(i) | LINC009260(o) | 15:57442759 | G/A | 0.072 | 0.975 | TC | 0 | 0.62 | 0.042 | 1.1e-10 | 1.030 | 0.0064 | +++ | N | |
| rs1037116 | PCSK6(5′) | PCSK6(c) | 15:102068904 | T/C | 0.231 | 0.907 | HDL | 0 | 0.57 | 0.020 | 2e-08 | 1.006 | 0.41 | ++- | ||
| rs704‡ | VTN(e) | VTN(m), TMEM97(o),+ | 17:26694861 | A/G | 0.500 | 0.940 | LDL | 41 | 0.13 | 0.018 | 3.7e-08 | 1.013 | 0.025 | +++ | N | |
| rs2854322‡ | NF1(i) | OMG(vao), NF1(v),+ | 17:29699416 | T/C | 0.662 | 0.992 | TC | 50 | 0.076 | 0.020 | 5.3e-09 | 1.011 | 0.086 | +++ | ||
| rs73352129‡ | MIR4738(3′) | GALK1(v),+ | 17:73778609 | C/G | 0.660 | 0.951 | LDL | 0 | 0.76 | 0.019 | 4.7e-08 | 1.034 | 1.3e-07 | +++ | B | |
| rs328996 | RALBP1(i) | RALBP1(o), PPP4R1(o),+ | 18:9526184 | C/T | 0.751 | 0.999 | TC | 0 | 0.7 | 0.021 | 1.7e-08 | 1.011 | 0.12 | +++ | ||
| rs941408 | THOP1(3′) | ZNF554(ao), SGTA(a),+ | 19:2814181 | T/C | 0.284 | 0.867 | TC | 42 | 0.14 | 0.021 | 1.5e-08 | 1.006 | 0.38 | +++ | ||
| rs6059988* | RP11-346K17.4(3′) | MAP1LC3A(ao),+ | 20:33278101 | T/C | 0.555 | 0.968 | HDL | 0.19 | 0.41 | 0.016 | 1.7e-08 | 0.988 | 0.037 | +++ | N | |
| rs6066141 | EYA2(i) | EYA2(c) | 20:45597546 | T/C | 0.760 | 0.979 | TG | 31 | 0.2 | 0.021 | 2.3e-09 | 1.022 | 0.00075 | +++ | B | |
| rs147879509 | NCOA3(e) | NCOA3(m) | 20:46279836 | A/ACAG | 0.385 | 0.936 | HDL | 0 | 0.86 | 0.017 | 6.2e-09 | 1.003 | 0.69 | ++- | ||
| rs6025606 | CTCFL(e) | CTCFL(m) | 20:56098733 | C/T | 0.642 | 0.874 | TG | 0 | 0.99 | 0.020 | 1.7e-10 | 1.009 | 0.13 | +++ | ||
| rs17660708 | SCAF4(i) | SOD1(o) | 21:33059831 | C/T | 0.040 | 0.988 | LDL | 0 | 0.43 | 0.044 | 1.6e-09 | 1.058 | 6.9e-05 | +++ | B | |
| rs235374 | PTTG1IP(5′) | PTTG1IP(vo) | 21:46294986 | G/C | 0.594 | 0.891 | HDL | 0 | 0.87 | 0.017 | 6.5e-09 | 0.996 | 0.48 | +++ | ||
| rs5752792 | HSCB(3′) | XBP1(o) | 22:29153759 | C/T | 0.162 | 0.943 | TG | 43 | 0.12 | 0.022 | 2.8e-08 | 1.009 | 0.25 | +++ |
In the closest gene column: i, variant is in intron; e, variant is in exon; 3′, variant is 3′ of gene; 5′, variant is 5′ of gene. In the candidate gene column: c, closest gene; v, liver eQTL; p, pancreas eQTL; a, adipose eQTL; o, eQTL in other tissues; +, additional eQTL genes; m, missense variant. The replication (Rep) column indicates whether a variant replicated at a Bonferroni (B) or nominal (N) level of significance in the UKB (see Methods). LDL is positively correlated with all traits except weakly negatively correlated with HDL, so in the replication analysis, when the trait was HDL (only), the UKB OR for HDL only was inverted and is displayed as such.
SNP has r2>0.8,
0.8≥r2>0.5,
Previously-identified SNP replication
We tested all previously-identified lipid-associated SNPs for replication in GERA3–5,11–14,16,17 (Supplementary Table 4). Focusing on 189 available lead SNPs,133 (70.4%) were significantly associated with the same previously-identified lead trait (Bonferroni P<0.00026), and 165 (87.3%) were nominally significant (p<0.05; Figure 1B). The strongest replication predictor is the original P-value, e.g., nearly all (40/41) SNPs with GLGC P<10-10 replicated at a Bonferroni level. Four SNPs (2.2%) showed significant heterogeneity amongst GERA groups and/or GLGC (P<0.00026; Supplementary Table 4, Supplementary Figure 5). Seventy-two previously-identified lead SNPs were genome-wide significant (using GERA P-values) for more than one trait.
Figure 1.
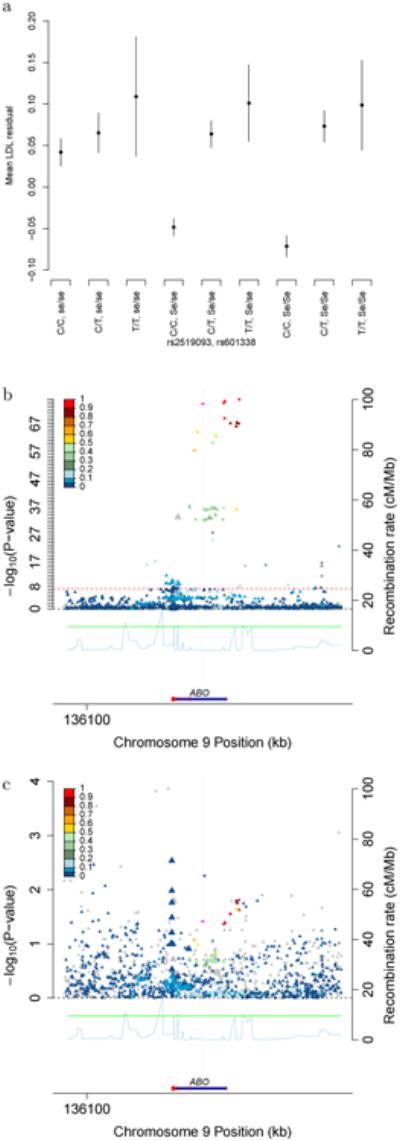
Epistasis between SNPs at FUT2 and ABO (n=94,674). SNP rs601338, determines secretor status; Se/Se and Se/se are secretors (dominant), and se/se are non-secretors. SNP rs2519093 at ABO, C allele is recessive. (A) Residual LDL by genotype combination, where the vertical line represents 95% confidence intervals. (B) ABO locus plot for secretors (Se/Se or Se/se), around rs2519093 (linear regression on LDL). (C) ABO locus plot for non-secretors around rs2519093 (linear regression on LDL). All tests are two-sided.
Conditional analysis
We conducted conditional analyses within the single large GERA cohort on each previously-described or novel GERA locus (Methods). Thirty-three loci contained 74 genome-wide significant conditional variants (step-wise regression, see Methods; Supplementary Table 8-9). To determine if these conditional SNPs were novel we tested each, conditioning on all previously-identified SNPs and all SNPs from previous steps at that locus; 15 remained genome-wide significant (Table 4). All had R2≤0.1 with all previously-identified SNPs.
Table 4.
Novel GERA conditional SNPs.
| SNP | Closest Gene | Candidate Gene(s) | Chr:Pos | Allele | Freq | Info | Trait | GERA I2 | GERA Het. P | GERA Eff | GERA P |
|---|---|---|---|---|---|---|---|---|---|---|---|
| rs10910476 | IRF2BP2(3′) | IRF2BP2(c) | 1:234734956 | T/C | 0.495 | 0.976 | TC | 0 | .57 | 0.024 | 3.2e-08 |
| rs1801696 | APOB(e) | APOB(m) | 2:21232044 | T/C | 0.997 | 0.865 | LDL | 0 | .76 | 0.286 | 1.5e-10 |
| rs55692303 | HMGA1(5′) | HMGA1(c) | 6:34202879 | C/A | 0.961 | 0.967 | HDL | 0 | .84 | 0.059 | 2.4e-10 |
| rs182443492 | SLC22A3(3′) | SLC22A3(c) | 6:160891897 | A/C | 0.988 | 0.878 | LDL | 0 | 1.0 | 0.132 | 8.8e-10 |
| rs330071 | RP11-115J16.1(i) | SGK223(o), ERI1(o),+ | 8:9159895 | G/A | 0.681 | 0.979 | HDL | 0 | .92 | 0.026 | 2.3e-11 |
| rs33918808‡ | ABCA1(e) | ABCA1(m) | 9:107579632 | G/C | 0.968 | 1.000 | HDL | 0 | .48 | 0.069 | 8.5e-12 |
| rs79615973 | TECTB(5′) | GPAM(o), ACSL5(o) | 10:114012078 | A/G | 0.796 | 0.998 | TC | 0 | .97 | 0.041 | 1.1e-14 |
| rs117794084 | AP001891.1(5′) | AP001891.1(c) | 11:116433496 | T/G | 0.985 | 0.849 | TG | 59 | .045 | 0.127 | 1e-13 |
| rs28577594 | SETD8(3′) | ABCB9(vpao), SETD8(pao),+ | 12:123895906 | G/C | 0.312 | 0.914 | HDL | 55 | .065 | 0.022 | 2.7e-08 |
| rs61941677 | SCARB1(i) | SCARB1(o) | 12:125325010 | C/G | 0.903 | 0.814 | HDL | 0 | .42 | 0.036 | 3.8e-08 |
| rs4775086 | ADAM10(i) | ADAM10(o) | 15:58969292 | G/A | 0.703 | 0.991 | HDL | 0 | .52 | 0.026 | 5.6e-11 |
| rs12720897 | CETP(i) | CETP(c) | 16:57010994 | G/T | 0.935 | 0.828 | HDL | 0 | .61 | 0.044 | 9e-09 |
| rs185543515 | PMFBP1(5′) | PMFBP1(c) | 16:72221022 | A/T | 0.975 | 0.925 | LDL | 0 | .95 | 0.089 | 5e-10 |
| rs740516 | ABCA6(i) | ABCA6(c) | 17:67082962 | C/G | 0.824 | 0.976 | LDL | 0 | .83 | 0.046 | 1.4e-15 |
| rs62101773 | LIPG(3′) | LIPG(c) | 18:47207732 | T/C | 0.666 | 0.959 | HDL | 34 | .20 | 0.025 | 4.9e-11 |
SNPs were conditioned on all other previously-identified SNPs in the region (see Supplementary Table 8). SNPs are additively coded according to the number of alleles first mentioned so that the effect size is positive (change per additional lipid-increasing allele in LDL, HDL, TG or TC transformed to a standard normal distribution). In the closest gene column: i, variant is in intron; e, variant is in exon; 3′, variant is 3′ of gene; 5′, variant is 5′ of gene. In the candidate gene column: c, closest gene; v, liver eQTL; p, pancreas eQTL; a, adipose eQTL; o, eQTL in other tissues; +, additional eQTL genes; m, missense variant. GERA Het. P, GERA heterogeneity P-value; GERA Eff, conditional meta-analysis effect size; P, conditional meta-analysis P-value.
SNP has r2>0.8,
0.8≥r2>0.5,
Dominance
We tested the previously- and newly-identified lead and conditional SNPs for dominance effects in GERA non-Hispanic whites. Q-Q plots showed a moderate deviation from a null distribution for LDL (λ=1.54), and TC (λ=1.30), and little to no deviation for HDL (λ=1.15) or TG (λ=1.02) (Supplementary Figure 6), with a few extreme outliers for each trait that were Bonferroni significant: rs1730859 (PRMT6 eQTL, PLDL=2.9×10⁻⁴), rs1800562 (HFE missense mutation for hemochromatosis, C282Y, PLDL=3.7×10⁻⁶, PTC=1.6×10⁻⁵); rs2519093 (ABO eQTL, PLDL=7.5×10⁻⁵); rs1800588 (LIPC eQTL, PHDL=1.0×10⁻⁶); rs7412 (APOEε2 allele, PTC=3.7×10⁻⁶, PTG=1.8×10⁻⁸); rs3764261 (CETP eQTL, PHDL=3.7×10⁻⁴); rs261334 (LIPC eQTL, PHDL=5.1×10⁻⁶); rs58542926 (TM6SF2, PLDL=4.0×10⁻¹¹, PTC=8.8×10⁻¹³); and rs492602 (PLDL=0.00080, FUT2 variant described further below). The APOE ε2 dominance effect is due to very high TG values among ε2 homozygotes, likely due to Type 3 Hyperlipoproteinemia35.
Epistasis
We tested for epistasis in GERA non-Hispanic whites, analyzing all pairwise interactions in the previously- and newly-identified lead and conditional SNPs. Overall, Q-Q plots showed no particular distributional deviation from expectation (λ<1.04 for each trait, Supplementary Figure 7), with the exception of a few extreme LDL points. After Bonferroni correction, one SNP pair was significant, the interaction of rs2519093 (ABO) and rs492602 (FUT2; PLDL=8.1×10⁻¹⁰, PTC=3.9×10⁻⁷, Figure 1, Supplementary Figure 8), both of which showed dominance effects. SNP rs492602 has R2=0.992 with rs601338, a nonsense dominant variant that determines FUT2 non-secretor status. The means of the 9 possible genotype combinations at the two SNPs revealed secretors have lower LDL than non-secretors; rs2519093 is statistically significant among secretors (dominant model P=5.5×10-75, β=0.132, 95% CI=0.118-0.146), but almost not at all among non-secretors (dominant P=0.038, β=0.030, 95% CI=0.002-0.058). We then examined SNP associations around rs2519093 among secretors only (Figure 1, Supplementary Table 10). The high LD in the region made causal variant identification difficult; haplotype fine-mapping was suggestive for rs635634 (Supplementary Table 11), the most significant regional SNP (P=1.6×10-76).
Sex and ancestry effects
We investigated sex differences in SNP effects (heterogeneity test, Supplementary Table 12; coefficient comparison, Supplementary Figure 9). The Q-Q plot of the lead and conditional SNPs showed strong heterogeneity evidence for each trait (1.64≤λ≤2.44, Supplementary Figure 10). After Bonferroni correction, 7 lead SNPs were significantly different between the sexes in non-Hispanic whites at the lead trait, with 6 having stronger effects in women, and one stronger in men (Supplementary Table 12). Five of six significant conditional SNPs were stronger in women, (Supplementary Table 12). Similar relationships were previously-observed near 3 of these loci, KLF14 and APOE, with stronger effects in women4, and ZNF259, with a stronger effect in men36. Overall, 64% of HDL, 64% of LDL, and 56% of TC SNPs showed stronger effects in women, while 66% of TG SNPs showed stronger effects in men.
Q-Q plots showed further distributional differences (Supplementary Figure 11). Pronounced differences were observed for HDL in Latino females (both directions) and East Asian females for HDL and TG (effects greater in East Asians). Moderate differences were seen for TG in Latino males (effects greater in Latinos) and for TC in African American females (effects greater in African Americans).
We then investigated genetic risk score (GRS) mean differences using all previously- and newly-identified lead and conditional SNPs (GERA meta-analysis weights, pairwise R2>0.3 excluded). All GRS were significantly different between sexes (P<10-200) and between all ancestral groups (P<10-8) except non-Hispanic white vs. East Asian females HDL (P=0.088). Differences were generally small, but African Americans had the highest mean HDL GRS and lowest mean LDL-, TG-, and TC-GRS; while the East Asians had the lowest mean HDL-GRS, and highest mean LDL-, TG-, and TC-GRS (Table 3).
Variance explained, conditional SNP impact
The variances explained by the GRS in GERA using the previously-identified lead plus conditional (R2<0.3) SNPs was 16.6%/18.5%/16.5%/12.9% for HDL/LDL/TG/TC in non-Hispanic white females, and 1.4%-2.6% lower in non-Hispanic white males, except TG was 1.1% higher in males (Table 3). Including the new GERA- and GERA+GLGC-identified lead plus conditional SNPs increased variance explained 1.5%-3.5% to a total of 18.5%/20.1%/18.2%/14.4% in non-Hispanic white females. The top 10 loci, containing many of the conditional SNPs (included), made up nearly half at 8.7%/9.8%/7.5%/6.8%.
Ancestral groups showed differences from non-Hispanic whites. Specifically, East Asians (13.9%/14.8%, females/males) and African Americans (14.7%/13.5%) were lower for HDL, East Asians were dramatically lower for LDL (6.5%/7.0%) and TC (8.7%/8.0%), and African Americans were lower for TG (8.8%/9.3%). These differences may reflect in part the divergence in allele frequencies for SNPs at the same loci in different ancestral groups; we see an overall trend towards lower minor-allele frequencies (and thus lower variance) in East Asians and African Americans independent of direction of effect (Supplementary Figure 12). In addition, pairwise lipid GRSs differed by sex, but less by ancestry group (Supplementary Table 13).
Multiple measurement gain
We tested the benefit of multiple lipid measurements in an analysis restricted to individuals with ≥5 measurements, using a GRS of the previously-identified lead SNPs. Using all measurements, compared to just one, reduced the regression coefficient standard error 15.1% on average over the four traits (Supplementary Table 14, Supplementary Figure 13); the regression coefficient estimate itself did not change significantly. With a large number of measurements, the variance explained by the GRS increased an average of 34% for HDL, LDL and TC, but more (42%) for TG.
Heritability from all SNPs
Array heritability estimates in non-Hispanic whites derived from the genotyped SNPs using PC-Relate kinship estimates37, which account for population stratification, and GEAR38 for heritability estimation, ranged from 17.2% (LDL, 95% CI=15.4%-19.0%) to 27.1% (HDL, 95% CI=25.3%-28.9%), increasing modestly when adding imputed SNPs, ranging from 23.3% (LDL, 95% CI=21.4%-25.2%) to 32.8% (HDL, 95% CI=31.0%-34.7%) (Supplementary Table 15). Estimates were smaller than those not accounting for population stratification in the kinship estimate, when only adjusting for PC covariates in the phenotype model using GCTA39 (Methods).
Tissue eQTL enrichment analysis
We examined eQTLs from 44 Genotype-Tissues Expression (GTEx) tissues40 to test for co-localization of Expression Quantitative Trait Loci (eQTLs). For each tissue, we determined whether the proportion of eQTLs that were lead genome-wide significant SNPs was greater than expected, using a random sampling of SNPs (Methods). The liver was significantly different from the median tissue expression over all tissues (p=6.8×10⁻¹¹, Bonferroni correction for 44 tissues α=0.0011; Figure 2; Table 2). Pancreas was near Bonferroni significance (P=0.0014). After excluding any liver eQTL SNP, subcutaneous adipose was significant (P=0.0010; Figure 2).
Figure 2.
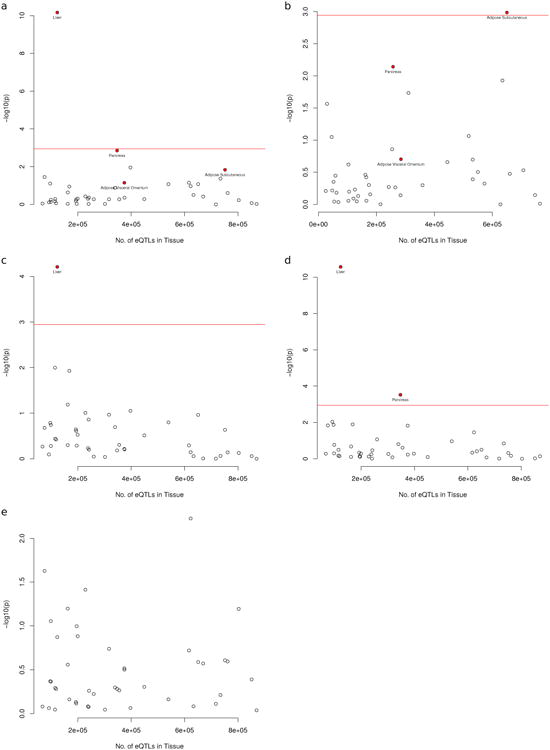
Tissue specific expression quantitative trait locus (eQTL) analysis in the 44 GTEx tissues. An upper-tailed p-value for enrichment of the count was calculated with a Z-score using the overall median tissue proportion and the standard deviation of the null distribution of that tissue. Tissues with P<0.05 are labeled, and the red line indicates the P-value threshold for Bonferroni significance. (A) All SNPs (N=284). (B) All SNPs removing liver eQTLs and rerunning the analysis in 43 GTEx tissues. (C) Exclusive HDL SNPs only (N=63). (D) Exclusive LDL SNPs only (N=61). (E) Exclusive TG SNPs only (N=39). All tests are two-sided.
We subsequently stratified the lead genome-wide significant SNPs into 3 groups: P<10-7 for HDL-only; LDL-only; and TG-only. There were no associations among the TG-only SNPs. The strongest signal occurred for LDL-only SNPs, for liver (P=2.7×10⁻¹¹) and pancreas (P=3.0×10⁻⁴), with a weaker but significant signal for liver for HDL-only SNPs (P=6.17×10⁻⁵) (Figure 2). Thus, it appears that the tissue-specific eQTL enrichment in liver and pancreas occurs primarily for LDL-associated variants.
Treatment time-to-initiation
We assessed each lipid trait's GRS predictive value, a measure establishable at birth, with the clinical endpoint of time-to-lipid-treatment (90.4% statins) independent of all other risk factors (Kaplan-Meier curves Figure 3, Supplementary Figure 14; Cox models Supplementary Table 16). Time-to-initiation of treatment was most strongly associated with the LDL-GRS, stronger in females than males, with a joint independent TG-GRS effect stronger in males than females (female HRLDL-GRS=2.297, PLDL-GRS=10-497, HRTG-GRS=1.332, PTG-GRS=10-38, non-Hispanic white concordance-index=0.614; male HRLDL-GRS=2.099, PLDL-GRS=10-360, HRTG-GRS=1.398, PTG-GRS=10-64, non-Hispanic white concordance-index=0.596; test females vs. males, PLDL=0.0.00027, PTG=0.10). The concordance-index (sex average=0.61) shows moderate predictive value41. Although the HDL-GRS was significant in univariate analysis, the significance was greatly diminished and did not increase the non-Hispanic white concordance-index when modeled jointly with TG and LDL. Utilizing a model combining the two GRS, for those in the top quintile, the probability of initiating lipid treatment for non-Hispanic white females by age 50 was 1.66 times higher than the bottom quintile, and 1.80 times higher by age 60; in males, 3.04 and 2.37, respectively.
Figure 3.
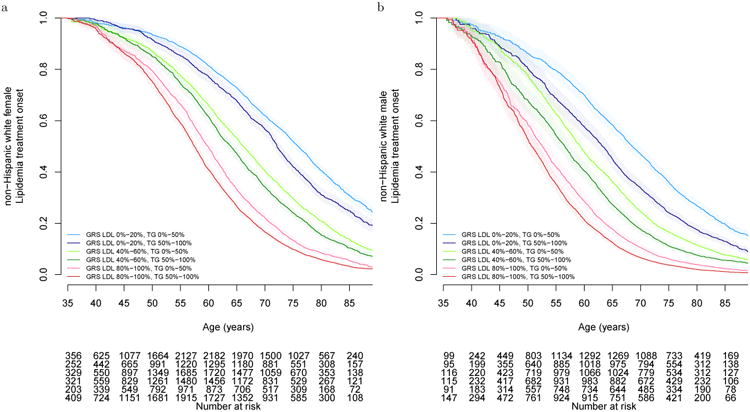
Time-to-initiation of lipid-lowering treatment by LDL and TG genetic risk score quintiles. Kaplan Meier curves for (A) non-Hispanic while females (n=44,856), (B) non-Hispanic white males (n=31,771). Other groups are in the Supplementary material. The shaded areas represent the 95% CIs around the estimated curves. All tests are two-sided.
Discussion
A large single cohort with clinical-laboratory-based phenotypes from longitudinal EHRs resulted in increased discovery (46 novel lead and 15 conditional SNPs in GERA, another 60 in GERA+GLGC), improved conditional analysis, and a novel longitudinal analysis of treatment initiation. Our multi-ethnic cohort within a single health-provider system elucidated sex and ancestral differences and a substantial prediction of time-to-initiation of lipid-lowering medication based only on SNP data. We were able to elucidate biological insight, demonstrating lipid SNPs were not only strongly enriched in liver eQTLs, but adipose and pancreas.
There was biological support for our novel SNPs. Most were associated with liver and other tissue gene expression levels, and several changed amino acids likely impacting protein function. As one example, the nonsynonymous variant, rs4149056 (SLCO1B1), associated with TG in GERA+GLGC, was previously-reported associated with statin-induced myopathy42 and blood metabolites43,44. SLCO1B1 encodes OATP1B1 which transports various drugs and endogenous ligands45, including bile acids46,47, into the liver. In addition, in vivo eQTL analyses of several variants were in the same direction. For example, rs2896635 A, associated with higher TG in GERA+GLGC, was associated with lower expression of the AHR nuclear translocator-like gene (ARTNL/BMAL1), which encodes a core molecular clock component essential for maintaining circadian function48. Arntl knockout mice have increased plasma TG49 with marked differences in triglycerides containing polyunsaturated fatty-acids50.
At some loci, the closest gene was the most biologically plausible. For example, rs7955221, associated with TC and LDL (GERA+GLGC), is just upstream of NR1H4, which encodes FXR, a bile acid receptor and transcription factor for bile acid synthesis and transport genes51. Some loci had more than one biologically plausible candidate, and may require functional studies to determine causality. For example, rs13114070, associated with TC (GERA), was an eQTL for UGT2B17 and UGT2B15 in lymphoblastoid cell lines, with some liver eQTL GTEx evidence for UGT2B17 (P=0.004)40. UGT2B1552 and UGT2B17 metabolize steroid hormones and a variety of lipid-soluble xenobiotic compounds53,54. Another example, rs10948059, associated with HDL (GERA), is an eQTL for PEX6 and GNMT in numerous tissues. Gnmt knockout mice have increased serum total and LDL cholesterol55,56 and hepatic cholesterol accumulation55. In vitro peroxisomal protein PEX6 knockdown impacts intracellular cholesterol transport, reducing plasma membrane cholesterol, and causing lysosomal cholesterol accumulation57.
Previous work implicated lipid-associated SNP expression in liver tissue; specifically, lipid-associated variants might be primarily associated with functional changes in liver cells58. In addition, specific liver cell enrichment tested in ENCODE regions found the strongest enrichment of GWAS lipid variants in regions with strong enhancer activities3. We also found that liver tissue was the strongest outlier in our novel eQTL tissue-enrichment analysis. However, we noted enrichment in the pancreas for LDL-associated SNPs, which, to our knowledge, has not been previously reported. Although a role for the pancreas in LDL-metabolism has not been established, glucagon, a hormone synthesized in pancreatic islet alpha cells, has been reported to decrease intestinal cholesterol absorption59. Finding subcutaneous adipose enrichment was unsurprising, as visceral and subcutaneous fat amounts have been associated with plasma lipid levels60,61. However, the GTEx results should be interpreted with some caution due to very different sample sizes (and hence power) in different tissues.
Our use of a single large cohort allowed for direct conditional analysis, in a cohort much larger than previous16, and discovery of 15 additional novel SNPs. All conditional SNPs identified were at loci previously-identified from other GWAS with very small lead P-values (possibly due to power limitations at other loci). Our genome-wide significance for conditional SNPs is likely conservative because the prior chance of additional functional SNPs in these same regions is high; therefore, we may have underestimated the contribution of these important loci to the total heritability, which may further address the “missing heritability” question62. Many of these loci include genes known to cause Mendelian lipid disorders, and have been shown, both historically and recently (exome sequencing) to harbor rare, high-impact mutations63. Eleven of fifteen well-known Mendelian hyper- and hypo-lipidemia syndrome genes (Table S17) had multiple conditional lipid-associated SNPs, totaling 34 additional conditional SNPs (3 were novel).
We demonstrated a global difference in SNP effects between sexes. While significant differences occurred in both directions, the majority favored a larger effect in females for HDL, LDL, and TC, mirroring a similar phenomenon for blood pressure recently reported24, and is consistent with higher overall heritability of these traits in females compared to males. In contrast, males had higher TG effect sizes and variance explained. While overall SNP effects were greater in females, there was a general lack of consistent directionality. Thus, female-male mean differences in GRS were small and inconsistent with observed trait mean differences. Specifically, the mean differences between non-Hispanic white females and males in the GRS were 1.34/1.58/-0.59/1.54 for HDL/LDL/TG/TC, compared to a large female increase in mean HDL and decrease in LDL and TG. Thus, it is unlikely that these SNPs contribute in any significant way to the observed trait sex differences.
Another advantage of our analysis was having multiple ancestral groups within the same cohort; notably, we saw substantial replication of variants previously-identified in groups other than non-Hispanic whites. The HDL- and TC-GRS tracked closest with covariate-adjusted lipid comparisons, with African Americans having the highest HDL-GRS and covariate-adjusted mean, and South Asians and East Asians having values towards the lower end. TG was generally similar, with East Asians, Latinos, and South Asians in the higher end of both. There was more contrast in LDL, with African Americans having the highest covariate-adjusted LDL, but lowest GRS. Additionally, when testing replication of SNPs previously identified in groups other than non-Hispanic whites, we generally found that the meta-analysis of all GERA groups provided consistent evidence of replication, and performed better than using the much smaller ancestry-matched group. In the GERA meta-analysis, 2/2 lead SNPs first identified in African Americans7,12 replicated, 4/5 Japanese11 and Chinese64 SNPs replicated, and 26/34 SNPs in Mexicans10/Hispanics5 replicated.
A single large cohort allowed us to comprehensively examine dominance and epistasis among discovered SNPs, the latter not previously possible with summary statistics. While we found modest overall evidence, we discovered one striking example of dominance and epistasis between ABO and FUT2 (secretor). Epistasis between these loci has been previously-documented for blood group presentation, but never before for LDL, although each locus individually has been previously-associated with LDL. While it's highly likely secretor status explains FUT2, the ABO causal SNP(s) was more challenging to determine given strong regional LD. We also had strong evidence of dominance for the ApoE ε2 allele, due to the well-known ε2 homozygosity association with Type 3 Hyperlipoproteinemia and elevated TG-levels.
We saw a modest increase in variance explained from our enhanced discovery. The overall variance explained by the genome-wide significant loci ranged from 14.4%-20.1% in non-Hispanic whites, slightly larger than previously-reported: 9.3%-18.8% in 5,119 Finnish16, and 12%-14% in 7,132 Framingham individuals3. We usedi the same cohort for discovery/test, which may slightly inflate our estimates. Our array-based heritability estimates ranged from 17.2%-27.1%, similar to 19%-27% in the Finnish. The LDL variance explained is very close to the array estimate, is 4% lower for TC, and ∼10% lower for both HDL and TG. Thus, much of the LDL genetic variance currently attributed to GWAS arrays is explained by currently-found variants, and slightly less so for TC. Neither dominance nor epistasis had measureable overall statistical impact on variance explained.
LDL variance explained was substantially less in East Asians (less than half of that in non-Hispanic whites or Latinos), and also lower in African Americans; variance explained for other lipids was reduced (but less so) in East Asians and African Americans. The likely explanation is an ascertainment bias in which these variants were predominantly detected in European cohorts, with a bias towards common variants due to power, and these variants tend to have lower minor-allele frequencies in East Asians and African Americans. This would explain why the difference is seen predominantly in the variance explained (which depends on allele frequencies but in a non-directional way), unlike the mean GRS, which did not show strong differences.
Longitudinal data, including full EHR pharmacy prescription information, allowed us to identify a striking LDL-GRS and independent TG-GRS effect on lipid-lowering treatment initiation. Because genetic information could be available decades prior (i.e., at birth) to the development of significant risk for coronary heart disease and other adverse clinical endpoints, this information could provide a useful baseline estimate for clinical applications targeting high-risk individuals for screening regarding use of lipid-lowering medications and lifestyle modifications. However, guidelines for statin and other lipid-lowering medication use have changed over the past 16 years, and so GRS evaluation will need to account for those factors.
While we captured several lower-frequency variants, a well-known GWAS limitation is testing very rare variants, which have been implicated in lipid changes63. However, larger reference samples will enhance rare variant imputation.
After completion of our analysis and the paper was under re-review, two additional large-scale exome-wide lipid analyses were published online as companion papers65,66, including hundreds of thousands of individuals. The first reported 444 variants at 240 loci65, with 26 additional variants in the second66. Using a broad overlap definition (r2>0.3 in 1000 Genomes Project European ancestry individuals; a handful of nearby variants were not in reference panels, and could not be examined, these were generally very rare), 26 of these variants overlap with our 121 novel variant associations (12 lead and 1 conditional from GERA; 13 from GERA+GLGC). These studies, along with ours, demonstrate enhanced gene discovery from expanded sample sizes.
In summary, our results demonstrate numerous strengths of leveraging large, single cohorts in which longitudinal EHRs with independent measurements are linked to genome-wide data, and provide insights into the underlying genetic architecture of plasma lipids to guide future research and clinical care.
Online Methods
All statistical tests were two-sided.
Participants, Phenotype, and Genotyping
Our primary analysis used data from the Kaiser Permanente RPGEH GERA cohort, as previously described25,26. Kaiser Permanente performs guideline-specified screening for cardiovascular and metabolic risk factors, including a standard lipid panel with results automatically recorded in the EHR. A large number of test results are available on GERA cohort members (average age at cohort entry 63 years) and many individuals have multiple test results prior to being placed on lipid-lowering medication (ordered and filled prescriptions are recorded in the EHR). Longitudinal serum lipid measurements were obtained from EHRs from 1/1/1995-12/31/2013. All serum lipid fraction data were derived from the routine lipid panel tests performed at Kaiser Permanente for clinical purposes. All samples are processed and tested in a single laboratory using strict quality control procedures. The lipid panel includes HDL-Cholesterol, LDL-Cholesterol, Triglycerides, and Total Cholesterol. Because triglyceride levels are sensitive to recent dietary intake, all lipid panel tests (including HDL, LDL, TG and TC) are subject to patient fasting 12-14 hours (liquid intake limited to water) prior to venipuncture. Blood samples for testing are derived from routine venipuncture into a 10 mL red top SSTM tube. The tube is gently inverted 5 times after drawing. The blood is allowed to clot for 30 minutes at room temperature in a vertical position. After a dense clot is observed, the sample is centrifuged at 1000-1100 × g relative centrifugal force for 10 minutes. A barrier is formed, separating the serum from the clot. The serum is then refrigerated prior to transport to the central lab for further processing. A 1 mL serum sample is then used for assaying HDL-Cholesterol with the Accelerator selective Detergent Cholesterol method; triglyceride is assayed with the glycerol phosphate oxidase method; and total cholesterol is determined with the enzymatic Aminoantipyrene/Pheno/Peroxidase method. LDL cholesterol measurements were calculated using the Friedewald formula67 unless the TG>400, in which case it was measured directly (1.4% of all LDL measurements).
We included 94,674 individuals with a total of 478,866 of each of the four serum lipid measurements obtained prior to prescription of any lipid-reducing treatments, which was assessed via EHR prescription filling information.
Individuals were all genotyped at over 650,000 SNPs on four Axiom arrays optimized for European (EUR), Latino (LAT), East Asian (EAS), and African American (AFR) ancestry27,28. South Asians were run on the EUR array. The Kaiser Permanente and University of California Institutional Review Boards approved this project. Written informed consent was obtained from all subjects.
Pre-imputation quality controls
Genotype quality control (QC) procedures for the GERA cohort assays were performed on an array-wise basis, as has been described26, resulting in 665,350, 802,186, 708,373, and 878,176 SNPs on the EUR, LAT, EAS, and AFR arrays, respectively. In addition we removed a small fraction of SNPs with call rate (CR)<90% resulting in 665,350, 777,927, 704,105, 864,905, and 663,783 SNPs in non-Hispanic whites, Latinos, East Asians, African Americans, and South Asians, respectively. We then analyzed the SNPs that had a minor-allele count of at least 20, resulting in MAFs of 0.0001, 0.001, 0.001, 0.003, and 0.02, in non-Hispanic whites, Latinos, East Asians, African Americans, and South Asians, and a total of 662,517, 758,681, 700,291, 855,429, and 568,707 SNPs, respectively, used in the GWAS analysis.
Genomic Imputation
Imputation was performed on an array-wise basis. We first pre-phased the genotypes with Shape-it v2.r72768. Variants were then imputed from the 1000 Genomes Project (phase I integrated release, March 2012, with Aug 2012 chromosome X update, with singletons removed) as a cosmopolitan reference panel with Impute2 v2.3.069–71. The estimated quality control rinfo2 metric we present here is the info metric from Impute2, which is an estimate of the correlation of the imputed genotype to the true genotype72. After excluding variants with rinfo2<0.8 and restricting to SNPs that had a minimum minor allele count of 20, a total of 11,196,893; 14,559,157; 8,776,374; 17,383,190; and 7,091,467 variants in non-Hispanic whites, Latinos, East Asians, African Americans, and South Asians (20,325,759 unique SNPs) remained for analysis.
GERA GWAS analysis and covariate adjustment
We first analyzed each of the five GERA groups (non-Hispanic white, Latino, East Asian, African American, and South Asian) separately. Each SNP was modeled using additive dosages to account for the uncertainty in imputation, which has been shown to work well in practice73. Lipid values were transformed for HDL (by square root) and TG (by log) to make them more normally distributed; LDL and TC were normally distributed and not transformed. For comparison purposes with other cohorts, we additionally standardized phenotypes by dividing by their standard deviation. For computational efficiency, we first ran a mixed model of the transformed lipid value adjusting for sex, age to the third power, and BMI to the third power. We then constructed a long-term average residual for each individual23 and ran a linear mixed model using estimated kinship matrices with leave-one-chromosome-out (LOCO) to account for population substructure and cryptic relatedness with Bolt-LMM29. We considered as novel loci those that were at a physical distance >0.5Mb from any previously-described locus, visually inspecting for longer LD stretches (e.g., ends of chromosomes and centromeres) and combining such regions into a larger physical window size. Finally, we undertook a fixed-effects meta-analysis to combine the results of the five groups using the software Metasoft v2.030. We also test for heterogeneity with Cochran's Q, and report the I2 statistic34.
To find additional independent (i.e. conditional) genome-wide SNPs at each previously-described and novel locus, we ran a step-wise regression analysis using all SNPs with Rinfo2>0.8 within a 1Mb window (±0.5Mb, or an expanded window size for regions with longer LD stretches as described above) of the lead SNP. In these analyses we adjusted for ancestry PCs (see below) instead of the mixed model approach, for simplicity and computational efficiency.
To adjust for genetic ancestry/population stratification in other tests we conducted (described below, e.g., risk scores), we performed principal components (PCs) analysis, as previously described25. The top ten eigenvectors for non-Hispanic whites and the top six eigenvectors for all other groups were included as covariates in the regression model described above.
Replication of novel SNPs
To test the novel genome-wide significant results from the GERA cohort for replication, we evaluated the associations between these variants and the lipid traits in the Global Lipids Genetics Consortium (GLGC)3,4 and independently in the UKB. To test the GERA+GLGC-identified SNPs for replication, we used the UKB.
GLGC
As the GLGC has been imputed to HapMap v22, a smaller reference panel than used here for GERA, we used ImpG v1.0.132 to estimate summary statistics for the 1000 Genomes Project reference panel SNPs used for the GERA imputation, using individuals of European ancestry only in both the GLGC and 1000 Genomes Project (a key assumption in the method). We utilized summary statistics from 127,059 SNPs genotyped on 93,982 individuals on the Metabochip array, combined with 2,569,922 SNPs (not on the Metabochip array) from 94,595 individuals from 23 studies genotyped with GWAS arrays and imputed to HapMap. After removing all SNPs with <80,000 subjects, similar to32, but including the Metabochip array, 2,329,454 (HDL), 2,255,280 (LDL), 2,328,073 (TC), and 2,281,857 (TG) SNPs remained for the imputation backbone. Utilizing ImpG, we expanded our summary statistics to 21,691,899 SNPs in 1000 Genomes with MAF≥0.01 (the approach does not perform well for lower frequency variants). Note that using ImpG assumes all HapMap SNPs were imputed without error; such error likely dampens the results. We solved for the effect sizes with allele frequency and Hardy-Weinberg assumptions as has been previously described24.
UKB
The multi-ethnic UKB has been previously-described33. Imputation to the Haplotype Reference Consortium (HRC) has been described (www.ukbiobank.ac.uk); imputation at non-HRC sites (indels, etc.) was done pre-phasing with Eagle v2.374, and imputing with a patched Minimac3 v2.0.175 using the same 1000 Genomes reference panel as GERA. Self-reported lipid-lowering medication use (records 6153 and 6177) was adjusted for age, age2, BMI (record 21001), and ancestry components. After excluding first-degree relatives, we analyzed 460,088 individuals: 76,661/355,079 case/control whites with global ancestry PC1≤70 and PC2≥-80, in addition to 2,434/6,841 South Asian, 1,293/6,966 African British, 1288/5862 Mixed/other British, 213/1,609 East Asian cases/controls, based on self-report. Ancestry PCs for whites were re-calculated using 50,000 random white individuals with the remaining subjects projected in, as has been shown to work well25, and for all subjects within the other groups. Results were combined with a fixed-effects meta-analysis.
Joint consideration of GLGC and UKB
Since the GLGC trait is continuous (lipid levels, as in GERA), but the UKB a very different dichotomous phenotype (self-reported treatment), we combined the z-scores (Z=β/SE(β), the standardized coefficients from each model's SNP regressions) via Stouffer's Z-score method (i.e., (ZGLGC+ZUKB)/sqrt(2), which follows a standard normal distribution because each individual Z-score does). Since all traits except HDL were positively correlated with lipid treatment in UKB (i.e. decreased HDL is associated with increased risk of treatment), for HDL, we flipped the sign of ZUKB. For replication, we required the resulting p-value to be significant at p≤0.05/46=0.0011, and the combined z-score to have the same direction as the GERA β coefficient.
GERA meta-analysis with GLGC
We performed a meta-analysis of the GERA and GLGC results together for genome-wide discovery using a fixed-effects model with Metasoft v2.030, testing for replication in UKB (described above). We generally determined that a SNP was from an independent locus by non-overlapping 1Mb windows, but with some collapsing of windows in regions of stronger LD (as described above). For this collapsing, we checked if these SNPs were independent first within the GERA analysis, where we had individual level data. We required that the reduction in p-values from univariate to joint in the GERA+GLGC meta-analysis be less than 10-fold, and additionally that translating an equivalent reduction in p-values to the GERA+GLGC meta-analysis still led to a genome-wide significant result (i.e., if we assumed that Pjoint,GERA+GLGC/Punivariate,GERA+GLGC=Pjoint,GERA/Punivariate,GERA, the approximated Pjoint,GERA+GLGC would still need to be genome-wide significant). This may have been slightly conservative.
Replication analysis of loci previously-identified
For replication of previously-reported loci, we first considered the loci from GLGC3,4, but favoring the refinements from20 (when exome-wide significant) and16,18 plus additional novel loci from several studies5–10,12–15,17, for a total of 189 loci (defined here as non-overlapping 1Mb windows, using the most significant p-value for the lead SNP, and collapsing 1Mb windows with R2>0.3, which merged only one window). Of these, 185 were available to test. Note that we included genome-wide significant SNPs found in meta-analyses that had not yet been tested for replication. We report the proportion of these SNPs that meet a Bonferroni-corrected significance level for the number of lead SNPs (α=0.00027) in GERA at the lead GLGC trait, as well as suggestive nominal significance (p≤0.05). We also report on all SNPs previously-reported at each locus.
SNP and eQTL Annotation
SNPs were annotated using GENCODE v1376, HaploReg v4.177, and Annovar v2015June1778. Individual SNP eQTL associations were determined in GTex v640, which has genome-wide genotype data imputed to the same reference panel as GERA, in addition to other larger cohorts with data for specific tissues but with genotype data not as closely matched to the SNP data here, including others incorporated into HaploReg77: liver eQTLs from the NCBI eQTL Browser79, whole blood eQTLs80, eQTLs from European and Yoruban ancestry LCLs81; and liver and adipose tissue from patients undergoing Rouk-en-Y gastric bypass (RYGB)82.
Testing for Dominance
We tested for dominance deviation from additivity in the previously- and newly-identified lead and conditional SNPs that were genome-wide significant in GERA or GERA+GLGC (for each trait) and had MAF>0.05 (for power reasons) by fitting a linear model similar to above, with an additive term for the genotype, plus an additional term for dominance, coded as 1 for the two homozygote genotypes and -2 for the heterozygote. Statistical test was based on the dominance term. Bonferroni correction for 130/97/98/132 HDL/LDL/TG/TC SNPs are 0.00038/0.00052/0.00051/0.00038.
Testing for Epistasis
We tested epistasis by looking at all pairwise sets of previously- and newly-identified lead and conditional SNPs that were genome-wide significant in GERA or GERA+GLGC (for each trait). For each pair of SNPs, we tested epistasis by fitting a linear model similar to above, with a coefficient for both genotypes (each coded additively), plus an interaction term of the two, which formed the basis for the statistical test. Bonferroni correction for all 11,026/6,105/6,555/11,026 pairwise interactions of the 149/111/115/149 SNPs are 4.5×10⁻⁶/8.1×10-6/7.6×10-6/4.5×10-6. We confirmed any interactions that were still significant when also modeled with a coefficient for each genotyped allele to also allow for dominance (ABO×FUT2 was actually slightly more significant this way).
To fine-map the ABO-related SNP in the FUT2 interaction, we took best guess imputed genotypes from the top 5 associated SNPs, phased them with Shape-IT, and tested all haplotype pairs with counts≥50.
GRS
For each lipid trait in GERA, we constructed a genetic risk score (GRS) for each individual as follows. We performed a multivariate linear regression model within each GERA ancestry group using all SNPs jointly. Then, for each SNP, we meta-analyzed the coefficients across ancestry groups. We then constructed the GRS using these coefficients to weight the additive coding of each SNP.
Variance explained
Variance explained was calculated by the R2 of the GRS according to the age, sex, and ancestry PC adjusted residuals.
Multiple Measures
To assess the benefit of having multiple lipid measurements, we compared the P-values, effect size estimates, and GRS variance explained for the previously-described lead GWAS significant SNPs using one, two, three, four, and all measurements from each individual. We used a subset of 34,936 non-Hispanic white individuals, all of whom had at least five lipid measurements available for this analysis, to keep the sample size identical among the comparisons. We also estimated the variance due to measurement error and GRS variance explained in the absence of measurement error by the regression equation 1/Vk = α + β(1/k), where Vk is the variance explained by k measures, and the resulting α estimates the inverse of variance explained with no measurement error, as has been described24.
GWAS Array Heritability
We estimated the additive array heritability of each individual's long-term covariate-adjusted average lipid trait (see GWAS covariates above) using GEAR v0.7.738. Array heritability estimates may be more sensitive to artifacts than GWAS results83, so we restricted our analysis to the largest group of individuals, non-Hispanic whites, that were run with the same reagent kit and type of microarray (n=73,060)26. We included only the autosomal data, common practice in heritability estimation, and also LD-filtered our data so that no two pairwise SNPs had r2>0.8 with a standard greedy algorithm in PLINK v1.0784. This resulted in 547,922 genotyped SNPs, and 3,796,606 imputed SNPs restricted to rinfo2>0.8. Because of population stratification, we used PC-Relate v137 to estimate kinship coefficients rather than standard GCTA estimates39 which assume a homogeneous population; we also compared the results to those obtained using the standard GCTA v1.24.7 kinship estimates with PC adjustment. We used GEAR rather than GCTA to estimate heritability since the PC-Relate kinship estimate matrix was not positive definite; this happens because the matrix entries are computed based on different allele frequencies, i.e., those depending on ancestry using PCs. In all analyses we removed individuals so that no two remaining individuals had a kinship estimate >0.025; sample size was maximized using a greedy algorithm in PLINK v1.985, leaving 55,389 individuals.
Tissue eQTL enrichment
We used 44 tissue types with at least 70 samples available from GTEx40, which has genome-wide data imputed to the same reference panel used for GERA. We used all lead SNPs from previously- and newly-identified loci. Next, 200 sets of random frequency matched (±0.5%) SNPs (to the lead SNP) were selected, without replacement within each set, and excluding all variants within ±0.5Mb of all previously- and newly-identified SNPs. For each tissue, we calculated the proportion of eQTL SNPs that were lead genome-wide significant SNPs to eliminate bias due to varying numbers of eQTLs in each tissue (a reflection of different tissue sample sizes), motivated by, but using a statistic different from prior studies24,86. An upper-tailed p-value for enrichment of the count was calculated with a Z-score using the overall median tissue proportion and the standard deviation of the null distribution of that tissue.
Treatment time-to-initiation
Lipid prescription information was derived from the EHRs over the same timeframe as the lipid panels (see above). The large majority of prescriptions were for statins (90.4%), while the remaining prescriptions were for fibrates (3.8%) or other medications (3.3% niacin, 1.7% cholestyramine, 0.6% colestipol, 0.1% ezetimibe, and others totaling altogether<0.1%). We modeled the time-to-occurrence of the first prescription as a function of LDL-GRS and TG-GRS (discussed above, the full 477 lead and conditional previously and newly-identified SNPs) via Kaplan-Meier curves for display, and Cox proportional-hazards models for HR inference. Individuals were left-censored at the earliest known EHR or age 35, whichever was later, and right-censored at the latest known EHR. The left censoring was done to allow for an individual's date of entry into KP or the introduction of EHR data, whichever was later, and right censoring was done to allow for loss to follow-up either due to termination of membership or death. The age 35 cutoff was chosen because the number of individuals with follow up time before that age was tiny and caused very poor estimates early in the curve impacting the later curve. We additionally present the concordance-index, measuring the goodness-of-fit of the model, equal to the area under the ROC curve; values closer to 1 (perfect model) indicate better fits than those closer to 0.541.
Data availability
Data, including all genotype data and information on dyslipidemia status, are available on approximately 78% of GERA participants from dbGaP under accession code phs000674.v1.p1. This includes individuals who consented to having their data shared with dbGaP. The complete GERA data are available upon application to the KP Research Bank Portal, http://researchbank.kaiserpermanente.org/for-researchers/. The UK Biobank data are available upon application to the UK Biobank, www.biobank.ac.uk.
Supplementary Material
Table 5.
Variance explained (R2) by and mean (SD) genetic risk scores (GRS) in GERA groups.
| P-L (189 SNPs) | P-LC (356 SNPs) | P-LC, G-L (402 SNPs) | P-LC, G-LC (417 SNPs) | P-LC, G-LC, GG-L (477 SNPs) | P-LC, G-LC, GG-L (477 SNPs) | P-LC, G-LC, GG-L (477 SNPs) | P-LC, G-LC, GG-L (477 SNPs) | P-LC, G-LC, GG-L (477 SNPs) | Top 10-LC (101 SNPs) | |||
|---|---|---|---|---|---|---|---|---|---|---|---|---|
| Group | Trait | Sex | R2 | R2 | R2 | R2 | Mean | SD | Eff | P | R2 | R2 |
| non-Hispanic white | HDL | F | .107 | .166 | .175 | .179 | 9.567 | .337 | 1.010 | 10-2219 | .185 | .087 |
| non-Hispanic white | HDL | M | .096 | .152 | .162 | .166 | 8.215 | .305 | 1.003 | 10-1426 | .171 | .089 |
| Latino | HDL | F | .097 | .167 | .176 | .181 | 9.533 | .341 | .975 | 10-240 | .189 | .084 |
| Latino | HDL | M | .106 | .179 | .182 | .186 | 8.175 | .310 | .985 | 10-159 | .191 | .108 |
| East Asian | HDL | F | .079 | .128 | .131 | .136 | 9.446 | .305 | .922 | 10-142 | .139 | .083 |
| East Asian | HDL | M | .074 | .141 | .146 | .149 | 8.045 | .270 | 1.014 | 10-108 | .148 | .088 |
| African American | HDL | F | .068 | .120 | .128 | .138 | 9.677 | .358 | .867 | 10-67 | .147 | .064 |
| African American | HDL | M | .039 | .127 | .133 | .131 | 8.222 | .317 | .838 | 10-42 | .135 | .076 |
| non-Hispanic white | LDL | F | .140 | .185 | .191 | .195 | 14.037 | .414 | 1.011 | 10-2458 | .201 | .098 |
| non-Hispanic white | LDL | M | .123 | .159 | .167 | .169 | 12.459 | .393 | 1.002 | 10-1472 | .176 | .077 |
| Latino | LDL | F | .118 | .158 | .163 | .167 | 14.064 | .397 | .966 | 10-215 | .173 | .092 |
| Latino | LDL | M | .101 | .137 | .143 | .146 | 12.460 | .376 | 1.018 | 10-119 | .149 | .070 |
| East Asian | LDL | F | .033 | .056 | .059 | .062 | 14.250 | .287 | .788 | 10-62 | .065 | .021 |
| East Asian | LDL | M | .046 | .054 | .062 | .066 | 12.635 | .280 | .873 | 10-48 | .070 | .015 |
| African American | LDL | F | .097 | .143 | .144 | .148 | 13.681 | .445 | .925 | 10-70 | .153 | .102 |
| African American | LDL | M | .084 | .122 | .123 | .126 | 12.264 | .450 | .861 | 10-39 | .127 | .083 |
| non-Hispanic white | TC | F | .121 | .165 | .171 | .175 | 14.073 | .386 | 1.012 | 10-2162 | .182 | .075 |
| non-Hispanic white | TC | M | .106 | .147 | .156 | .158 | 12.535 | .376 | .998 | 10-1359 | .164 | .062 |
| Latino | TC | F | .107 | .149 | .155 | .159 | 14.120 | .382 | .968 | 10-200 | .162 | .073 |
| Latino | TC | M | .101 | .145 | .153 | .155 | 12.560 | .369 | 1.049 | 10-128 | .158 | .067 |
| East Asian | TC | F | .043 | .077 | .081 | .085 | 14.315 | .306 | .828 | 10-85 | .087 | .036 |
| East Asian | TC | M | .043 | .060 | .071 | .075 | 12.740 | .300 | .835 | 10-55 | .080 | .020 |
| African American | TC | F | .069 | .113 | .116 | .122 | 13.762 | .402 | .887 | 10-57 | .126 | .068 |
| African American | TC | M | .062 | .103 | .101 | .105 | 12.358 | .424 | .826 | 10-33 | .108 | .065 |
| non-Hispanic white | TG | F | .092 | .129 | .136 | .137 | 8.570 | .308 | 1.005 | 10-1644 | .144 | .068 |
| non-Hispanic white | TG | M | .096 | .140 | .148 | .149 | 9.160 | .347 | .996 | 10-1276 | .156 | .074 |
| Latino | TG | F | .100 | .151 | .154 | .156 | 8.684 | .322 | 1.009 | 10-190 | .156 | .080 |
| Latino | TG | M | .103 | .149 | .156 | .156 | 9.266 | .349 | 1.023 | 10-128 | .158 | .081 |
| East Asian | TG | F | .080 | .126 | .130 | .131 | 8.875 | .298 | 1.003 | 10-136 | .133 | .100 |
| East Asian | TG | M | .071 | .131 | .134 | .135 | 9.488 | .325 | 1.010 | 10-101 | .139 | .082 |
| African American | TG | F | .036 | .082 | .081 | .084 | 8.450 | .306 | .749 | 10-38 | .088 | .038 |
| African American | TG | M | .058 | .091 | .089 | .091 | 9.140 | .349 | .745 | 10-28 | .093 | .067 |
GRS SNP coefficients are from the GERA meta-analysis. Lipid values were transformed to standard normal distributions. P, previously-identified SNPs; G, GERA-identified SNPs; GG, GERA+GLGC-identified SNPs; Top 10, top 10 most-significant loci; -L, only lead SNPs at loci; -LC, lead and conditional SNPs (R2<0.3) at loci; Eff, effect size of the GRS; F, female; M, male.
Acknowledgments
We are grateful to the Kaiser Permanente Northern California members who have generously agreed to participate in the Kaiser Permanente Research Program on Genes, Environment, and Health. This work was supported by NIH P50GM115318 to RMK, which partially supported T Haldar, ET, MWM, CI, CS, EJ, RMK, and NR. This work was supported by grants R21 AG046616 and K01 DC013300 to TJH from the National Institutes of Health for imputation. Support for participant enrollment, survey completion, and biospecimen collection for the RPGEH was provided by the Robert Wood Johnson Foundation, the Wayne and Gladys Valley Foundation, the Ellison Medical Foundation, and Kaiser Permanente National and Regional Community Benefit programs. Genotyping of the GERA cohort was funded by a grant from the National Institute on Aging, National Institute of Mental Health, and the National Institute of Health Common Fund (RC2 AG036607 to CS and NR). The funders had no role in study design, data collection and analysis, decision to publish, or preparation of the manuscript. We would like to thank Radu Dobrin for his contribution of the liver and adipose eQTL results table from the RYGB cohort.
Footnotes
Conflict of interest: No potential conflicts of interest were disclosed.
URL section. UK Biobank, www.biobank.ac.uk; KP Research Bank Portal, http://researchbank.kaiserpermanente.org/for-researchers
Accession codes. GERA dbGaP, phs000674.v1.p1
Author contributions. T.J.H., E.T., T.H., E.J., M.W.M., C.S., R.M.K., C.I., and N.R. conceived and designed the study. P.-Y.K. supervised the creation of genotype data. D.K.R., in collaboration with C.I., C.S., N.R., and T.J.H., extracted phenotype data from the EHR. T.J.H., E.T., T.H., D.K.R., and N.R. performed the statistical analysis. T.J.H., E.T., T.H., D.K.R., E.J., M.W.M., C.S., R.M.K., C.I., and N.R. interpreted the results of analysis. T.J.H., E.T., T.H., D.K.R., E.J., M.W.M., M.N.K., P.-Y.K., C.S., R.M.K., C.I., and N.R. contributed to the drafting and critical review of the manuscript.
References for main text
- 1.Castelli WP. Cholesterol and lipids in the risk of coronary artery disease--the Framingham Heart Study. Can J Cardiol. 1988;4(A):5A–10A. [PubMed] [Google Scholar]
- 2.Kannel WB, Dawber TR, Kagan A, Revotskie N, Stokes J. Factors of risk in the development of coronary heart disease--six year follow-up experience The Framingham Study. Ann Intern Med. 1961;55:33–50. doi: 10.7326/0003-4819-55-1-33. [DOI] [PubMed] [Google Scholar]
- 3.Global Lipids Genetics Consortium. Discovery and refinement of loci associated with lipid levels. Nat Genet. 2013;45:1274–1283. doi: 10.1038/ng.2797. [DOI] [PMC free article] [PubMed] [Google Scholar]
- 4.Teslovich TM, et al. Biological, clinical and population relevance of 95 loci for blood lipids. Nature. 2010;466:707–713. doi: 10.1038/nature09270. [DOI] [PMC free article] [PubMed] [Google Scholar]
- 5.Below JE, et al. Meta-analysis of lipid-traits in Hispanics identifies novel loci, population-specific effects, and tissue-specific enrichment of eQTLs. Sci Rep. 2016;6:19429. doi: 10.1038/srep19429. [DOI] [PMC free article] [PubMed] [Google Scholar]
- 6.Buyske S, et al. Evaluation of the Metabochip Genotyping Array in African Americans and Implications for Fine Mapping of GWAS-Identified Loci: The PAGE Study. PLOS ONE. 2012;7:e35651. doi: 10.1371/journal.pone.0035651. [DOI] [PMC free article] [PubMed] [Google Scholar]
- 7.Coram MA, et al. Genome-wide Characterization of Shared and Distinct Genetic Components that Influence Blood Lipid Levels in Ethnically Diverse Human Populations. Am J Hum Genet. 2013;92:904–916. doi: 10.1016/j.ajhg.2013.04.025. [DOI] [PMC free article] [PubMed] [Google Scholar]
- 8.Elbers CC, et al. Gene-Centric Meta-Analysis of Lipid Traits in African, East Asian and Hispanic Populations. PLoS ONE. 2012;7 doi: 10.1371/journal.pone.0050198. [DOI] [PMC free article] [PubMed] [Google Scholar]
- 9.Keller M, et al. THOC5: a novel gene involved in HDL-cholesterol metabolism. J Lipid Res. 2013;54:3170–3176. doi: 10.1194/jlr.M039420. [DOI] [PMC free article] [PubMed] [Google Scholar]
- 10.Ko A, et al. Amerindian-specific regions under positive selection harbour new lipid variants in Latinos. Nat Commun. 2014;5 doi: 10.1038/ncomms4983. [DOI] [PMC free article] [PubMed] [Google Scholar]
- 11.Kurano M, et al. Genome-wide association study of serum lipids confirms previously reported associations as well as new associations of common SNPs within PCSK7 gene with triglyceride. J Hum Genet. 2016;61:427–433. doi: 10.1038/jhg.2015.170. [DOI] [PubMed] [Google Scholar]
- 12.Lanktree MB, et al. Genetic meta-analysis of 15,901 African Americans identifies variation in EXOC3L1 is associated with HDL concentration. J Lipid Res jlr. 2015:P059477. doi: 10.1194/jlr.P059477. [DOI] [PMC free article] [PubMed] [Google Scholar]
- 13.Leeuwen EM, van, et al. Meta-analysis of 49 549 individuals imputed with the 1000 Genomes Project reveals an exonic damaging variant in ANGPTL4 determining fasting TG levels. J Med Genet. 2016;53:441–449. doi: 10.1136/jmedgenet-2015-103439. [DOI] [PMC free article] [PubMed] [Google Scholar]
- 14.Lu X, et al. Genetic Susceptibility to Lipid Levels and Lipid Change Over Time and Risk of Incident Hyperlipidemia in Chinese Populations. Circ Cardiovasc Genet. 2016;9:37–44. doi: 10.1161/CIRCGENETICS.115.001096. [DOI] [PubMed] [Google Scholar]
- 15.Musunuru K, et al. Multi-Ethnic Analysis of Lipid-Associated Loci: The NHLBI CARe Project. PLOS ONE. 2012;7:e36473. doi: 10.1371/journal.pone.0036473. [DOI] [PMC free article] [PubMed] [Google Scholar]
- 16.Surakka I, et al. The impact of low-frequency and rare variants on lipid levels. Nat Genet. 2015;47:589–597. doi: 10.1038/ng.3300. [DOI] [PMC free article] [PubMed] [Google Scholar]
- 17.The UK10K Consortium. The UK10K project identifies rare variants in health and disease. Nature. 2015;526:82–90. doi: 10.1038/nature14962. [DOI] [PMC free article] [PubMed] [Google Scholar]
- 18.Wu Y, et al. Trans-Ethnic Fine-Mapping of Lipid Loci Identifies Population-Specific Signals and Allelic Heterogeneity That Increases the Trait Variance Explained. PLOS Genet. 2013;9:e1003379. doi: 10.1371/journal.pgen.1003379. [DOI] [PMC free article] [PubMed] [Google Scholar]
- 19.Sidore C, et al. Genome sequencing elucidates Sardinian genetic architecture and augments association analyses for lipid and blood inflammatory markers. Nat Genet. 2015;47:1272–1281. doi: 10.1038/ng.3368. [DOI] [PMC free article] [PubMed] [Google Scholar]
- 20.Kanoni S, et al. Analysis with the exome array identifies multiple new independent variants in lipid loci. Hum Mol Genet. doi: 10.1093/hmg/ddw227. [DOI] [PMC free article] [PubMed] [Google Scholar]
- 21.Tada H, et al. Multiple Associated Variants Increase the Heritability Explained for Plasma Lipids and Coronary Artery Disease. Circ Cardiovasc Genet. 2014;7:583–587. doi: 10.1161/CIRCGENETICS.113.000420. [DOI] [PMC free article] [PubMed] [Google Scholar]
- 22.Dongen J van, Willemsen G, Chen WM, Geus EJC de, Boomsma DI. Heritability of metabolic syndrome traits in a large population-based sample. J Lipid Res. 2013;54:2914–2923. doi: 10.1194/jlr.P041673. [DOI] [PMC free article] [PubMed] [Google Scholar]
- 23.Ganesh SK, et al. Effects of Long-Term Averaging of Quantitative Blood Pressure Traits on the Detection of Genetic Associations. Am J Hum Genet. 2014;95:49–65. doi: 10.1016/j.ajhg.2014.06.002. [DOI] [PMC free article] [PubMed] [Google Scholar]
- 24.Hoffmann TJ, et al. Genome-wide association analyses using electronic health records identify new loci influencing blood pressure variation. Nat Genet. 2017;49:54–64. doi: 10.1038/ng.3715. [DOI] [PMC free article] [PubMed] [Google Scholar]
- 25.Banda Y, et al. Characterizing Race/Ethnicity and Genetic Ancestry for 100,000 Subjects in the Genetic Epidemiology Research on Adult Health and Aging (GERA) Cohort. Genetics. 2015;200:1285–1295. doi: 10.1534/genetics.115.178616. [DOI] [PMC free article] [PubMed] [Google Scholar]
- 26.Kvale MN, et al. Genotyping Informatics and Quality Control for 100,000 Subjects in the Genetic Epidemiology Research on Adult Health and Aging (GERA) Cohort. Genetics. 2015;200:1051–1060. doi: 10.1534/genetics.115.178905. [DOI] [PMC free article] [PubMed] [Google Scholar]
- 27.Hoffmann TJ, et al. Design and coverage of high throughput genotyping arrays optimized for individuals of East Asian, African American, and Latino race/ethnicity using imputation and a novel hybrid SNP selection algorithm. Genomics. 2011;98:422–430. doi: 10.1016/j.ygeno.2011.08.007. [DOI] [PMC free article] [PubMed] [Google Scholar]
- 28.Hoffmann TJ, et al. Next generation genome-wide association tool: Design and coverage of a high-throughput European-optimized SNP array. Genomics. 2011;98:79–89. doi: 10.1016/j.ygeno.2011.04.005. [DOI] [PMC free article] [PubMed] [Google Scholar]
- 29.Loh PR, et al. Efficient Bayesian mixed-model analysis increases association power in large cohorts. Nat Genet. 2015;47:284–290. doi: 10.1038/ng.3190. [DOI] [PMC free article] [PubMed] [Google Scholar]
- 30.Han B, Eskin E. Random-Effects Model Aimed at Discovering Associations in Meta-Analysis of Genome-wide Association Studies. Am J Hum Genet. 2011;88:586–598. doi: 10.1016/j.ajhg.2011.04.014. [DOI] [PMC free article] [PubMed] [Google Scholar]
- 31.Yang J, et al. Genomic inflation factors under polygenic inheritance. Eur J Hum Genet. 2011;19:807–812. doi: 10.1038/ejhg.2011.39. [DOI] [PMC free article] [PubMed] [Google Scholar]
- 32.Pasaniuc B, et al. Fast and accurate imputation of summary statistics enhances evidence of functional enrichment. Bioinformatics. 2014;30:2906–2914. doi: 10.1093/bioinformatics/btu416. [DOI] [PMC free article] [PubMed] [Google Scholar]
- 33.Sudlow C, et al. UK Biobank: An Open Access Resource for Identifying the Causes of a Wide Range of Complex Diseases of Middle and Old Age. PLOS Med. 2015;12:e1001779. doi: 10.1371/journal.pmed.1001779. [DOI] [PMC free article] [PubMed] [Google Scholar]
- 34.Huedo-Medina TB, Sánchez-Meca J, Marín-Martínez F, Botella J. Assessing heterogeneity in meta-analysis: Q statistic or I2 index? Psychol Methods. 2006;11:193–206. doi: 10.1037/1082-989X.11.2.193. [DOI] [PubMed] [Google Scholar]
- 35.Sijbrands EJG, et al. Severe Hyperlipidemia in Apolipoprotein E2 Homozygotes Due to a Combined Effect of Hyperinsulinemia and an SstI Polymorphism. Arterioscler Thromb Vasc Biol. 1999;19:2722–2729. doi: 10.1161/01.atv.19.11.2722. [DOI] [PubMed] [Google Scholar]
- 36.Aung LHH, et al. Sex-specific Association of the Zinc Finger Protein 259 rs2075290 Polymorphism and Serum Lipid Levels. Int J Med Sci. 2014;11:471–478. doi: 10.7150/ijms.8489. [DOI] [PMC free article] [PubMed] [Google Scholar]
- 37.Conomos MP, Reiner AP, Weir BS, Thornton TA. Model-free Estimation of Recent Genetic Relatedness. Am J Hum Genet. 2016;98:127–148. doi: 10.1016/j.ajhg.2015.11.022. [DOI] [PMC free article] [PubMed] [Google Scholar]
- 38.Chen GB. Estimating heritability of complex traits from genome-wide association studies using IBS-based Haseman–Elston regression. Stat Genet Methodol. 2014;5:107. doi: 10.3389/fgene.2014.00107. [DOI] [PMC free article] [PubMed] [Google Scholar]
- 39.Yang J, Lee SH, Goddard ME, Visscher PM. GCTA: A Tool for Genome-wide Complex Trait Analysis. Am J Hum Genet. 2011;88:76–82. doi: 10.1016/j.ajhg.2010.11.011. [DOI] [PMC free article] [PubMed] [Google Scholar]
- 40.Consortium TGte. The Genotype-Tissue Expression (GTEx) pilot analysis: Multitissue gene regulation in humans. Science. 2015;348:648–660. doi: 10.1126/science.1262110. [DOI] [PMC free article] [PubMed] [Google Scholar]
- 41.Hosmer D, Lemeshow S. Applied survival analysis: Regression modeling of time to event data. Wiley; 2008. [Google Scholar]
- 42.Group TSC. SLCO1B1 Variants and Statin-Induced Myopathy — A Genomewide Study. N Engl J Med. 2008;359:789–799. doi: 10.1056/NEJMoa0801936. [DOI] [PubMed] [Google Scholar]
- 43.Coviello AD, et al. A Genome-Wide Association Meta-Analysis of Circulating Sex Hormone–Binding Globulin Reveals Multiple Loci Implicated in Sex Steroid Hormone Regulation. PLOS Genet. 2012;8:e1002805. doi: 10.1371/journal.pgen.1002805. [DOI] [PMC free article] [PubMed] [Google Scholar]
- 44.Johnson AD, et al. Genome-wide association meta-analysis for total serum bilirubin levels. Hum Mol Genet. 2009;18:2700–2710. doi: 10.1093/hmg/ddp202. [DOI] [PMC free article] [PubMed] [Google Scholar]
- 45.Oshiro C, Mangravite L, Klein T, Altman R. PharmGKB very important pharmacogene: SLCO1B1. Pharmacogenet Genomics. 2010;20:211–216. doi: 10.1097/FPC.0b013e328333b99c. [DOI] [PMC free article] [PubMed] [Google Scholar]
- 46.Abe T, et al. Identification of a Novel Gene Family Encoding Human Liver-specific Organic Anion Transporter LST-1. J Biol Chem. 1999;274:17159–17163. doi: 10.1074/jbc.274.24.17159. [DOI] [PubMed] [Google Scholar]
- 47.Hsiang B, et al. A Novel Human Hepatic Organic Anion Transporting Polypeptide (OATP2) Identification of a Liver-specific Human Organic Anion Transporting Polypeptide and Identification of Rat and Human Hydroxymethylglutaryl-CoA Reductase Inhibitor Transporters. J Biol Chem. 1999;274:37161–37168. doi: 10.1074/jbc.274.52.37161. [DOI] [PubMed] [Google Scholar]
- 48.Yu EA, Weaver DR. Disrupting the circadian clock: Gene-specific effects on aging, cancer, and other phenotypes. Aging. 2011;3:479–493. doi: 10.18632/aging.100323. [DOI] [PMC free article] [PubMed] [Google Scholar]
- 49.Shimba S, et al. Deficient of a Clock Gene, Brain and Muscle Arnt-Like Protein-1 (BMAL1), Induces Dyslipidemia and Ectopic Fat Formation. PLOS ONE. 2011;6:e25231. doi: 10.1371/journal.pone.0025231. [DOI] [PMC free article] [PubMed] [Google Scholar]
- 50.Castro C, Briggs W, Paschos GK, FitzGerald GA, Griffin JL. A metabolomic study of adipose tissue in mice with a disruption of the circadian system. Mol Biosyst. 2015;11:1897–1906. doi: 10.1039/c5mb00032g. [DOI] [PMC free article] [PubMed] [Google Scholar]
- 51.Parks DJ, et al. Bile Acids: Natural Ligands for an Orphan Nuclear Receptor. Science. 1999;284:1365–1368. doi: 10.1126/science.284.5418.1365. [DOI] [PubMed] [Google Scholar]
- 52.Green MD, Oturu EM, Tephly TR. Stable expression of a human liver UDP-glucuronosyltransferase (UGT2B15) with activity toward steroid and xenobiotic substrates. Drug Metab Dispos. 1994;22:799–805. [PubMed] [Google Scholar]
- 53.Beaulieu M, Lévesque E, Hum DW, Bélanger A. Isolation and Characterization of a Novel cDNA Encoding a Human UDP-Glucuronosyltransferase Active on C19 Steroids. J Biol Chem. 1996;271:22855–22862. doi: 10.1074/jbc.271.37.22855. [DOI] [PubMed] [Google Scholar]
- 54.Turgeon D, Carrier JS, Chouinard S, Bélanger A. Glucuronidation Activity of the UGT2B17 Enzyme toward Xenobiotics. Drug Metab Dispos. 2003;31:670–676. doi: 10.1124/dmd.31.5.670. [DOI] [PubMed] [Google Scholar]
- 55.Liao YJ, et al. Glycine N-methyltransferase deficiency affects Niemann-Pick type C2 protein stability and regulates hepatic cholesterol homeostasis. Mol Med Camb Mass. 2012;18:412–422. doi: 10.2119/molmed.2011.00258. [DOI] [PMC free article] [PubMed] [Google Scholar]
- 56.Liu SP, et al. Glycine N-methyltransferase-/- mice develop chronic hepatitis and glycogen storage disease in the liver. Hepatol Baltim Md. 2007;46:1413–1425. doi: 10.1002/hep.21863. [DOI] [PubMed] [Google Scholar]
- 57.Chu BB, et al. Cholesterol transport through lysosome-peroxisome membrane contacts. Cell. 2015;161:291–306. doi: 10.1016/j.cell.2015.02.019. [DOI] [PubMed] [Google Scholar]
- 58.Ernst J, et al. Mapping and analysis of chromatin state dynamics in nine human cell types. Nature. 2011;473:43–49. doi: 10.1038/nature09906. [DOI] [PMC free article] [PubMed] [Google Scholar]
- 59.Guan HP, et al. Glucagon receptor antagonism induces increased cholesterol absorption. J Lipid Res. 2015;56:2183–2195. doi: 10.1194/jlr.M060897. [DOI] [PMC free article] [PubMed] [Google Scholar]
- 60.Ebbert JO, Jensen MD. Fat Depots, Free Fatty Acids, and Dyslipidemia. Nutrients. 2013;5:498–508. doi: 10.3390/nu5020498. [DOI] [PMC free article] [PubMed] [Google Scholar]
- 61.Hoenig MR, Cowin G, Buckley R, McHenery C, Coulthard A. Low density lipoprotein cholesterol is inversely correlated with abdominal visceral fat area: a magnetic resonance imaging study. Lipids Health Dis. 2011;10:12. doi: 10.1186/1476-511X-10-12. [DOI] [PMC free article] [PubMed] [Google Scholar]
- 62.Maher B. Personal genomes: The case of the missing heritability. Nat News. 2008;456:18–21. doi: 10.1038/456018a. [DOI] [PubMed] [Google Scholar]
- 63.Dewey FE, et al. Distribution and clinical impact of functional variants in 50,726 whole-exome sequences from the DiscovEHR study. Science. 2016;354(aaf6814) doi: 10.1126/science.aaf6814. [DOI] [PubMed] [Google Scholar]
- 64.Lu X, et al. Genome-wide association study in Chinese identifies novel loci for blood pressure and hypertension. Hum Mol Genet. 2015;24:865–874. doi: 10.1093/hmg/ddu478. [DOI] [PMC free article] [PubMed] [Google Scholar]
- 65.Liu DJ, et al. Exome-wide association study of plasma lipids in ≥300,000 individuals. Nat Genet ng. 2017;3977 doi: 10.1038/ng.3977. [DOI] [PMC free article] [PubMed] [Google Scholar]
- 66.Lu X, et al. Exome chip meta-analysis identifies novel loci and East Asian–specific coding variants that contribute to lipid levels and coronary artery disease. Nat Genet ng. 2017;3978 doi: 10.1038/ng.3978. [DOI] [PMC free article] [PubMed] [Google Scholar]
- 67.Friedewald WT, Levy RI, Fredrickson DS. Estimation of the Concentration of Low-Density Lipoprotein Cholesterol in Plasma, Without Use of the Preparative Ultracentrifuge. Clin Chem. 1972;18:499–502. [PubMed] [Google Scholar]
- 68.Delaneau O, Marchini J, Zagury JF. A linear complexity phasing method for thousands of genomes. Nat Methods. 2012;9:179–181. doi: 10.1038/nmeth.1785. [DOI] [PubMed] [Google Scholar]
- 69.Howie B, Marchini J, Stephens M. Genotype Imputation with Thousands of Genomes. G3 Genes Genomes Genet. 2011;1:457–470. doi: 10.1534/g3.111.001198. [DOI] [PMC free article] [PubMed] [Google Scholar]
- 70.Howie B, Fuchsberger C, Stephens M, Marchini J, Abecasis GR. Fast and accurate genotype imputation in genome-wide association studies through pre-phasing. Nat Genet. 2012;44:955–959. doi: 10.1038/ng.2354. [DOI] [PMC free article] [PubMed] [Google Scholar]
- 71.Howie BN, Donnelly P, Marchini J. A Flexible and Accurate Genotype Imputation Method for the Next Generation of Genome-Wide Association Studies. PLoS Genet. 2009;5:e1000529. doi: 10.1371/journal.pgen.1000529. [DOI] [PMC free article] [PubMed] [Google Scholar]
- 72.Marchini J, Howie B. Genotype imputation for genome-wide association studies. Nat Rev Genet. 2010;11:499–511. doi: 10.1038/nrg2796. [DOI] [PubMed] [Google Scholar]
- 73.Huang L, et al. Genotype-Imputation Accuracy across Worldwide Human Populations. Am J Hum Genet. 2009;84:235–250. doi: 10.1016/j.ajhg.2009.01.013. [DOI] [PMC free article] [PubMed] [Google Scholar]
- 74.Loh PR, et al. Reference-based phasing using the Haplotype Reference Consortium panel. Nat Genet. 2016;48:1443–1448. doi: 10.1038/ng.3679. [DOI] [PMC free article] [PubMed] [Google Scholar]
- 75.Das S, et al. Next-generation genotype imputation service and methods. Nat Genet. 2016;48:1284–1287. doi: 10.1038/ng.3656. [DOI] [PMC free article] [PubMed] [Google Scholar]
- 76.Harrow J, et al. GENCODE: The reference human genome annotation for The ENCODE Project. Genome Res. 2012;22:1760–1774. doi: 10.1101/gr.135350.111. [DOI] [PMC free article] [PubMed] [Google Scholar]
- 77.Ward LD, Kellis M. HaploReg: a resource for exploring chromatin states, conservation, and regulatory motif alterations within sets of genetically linked variants. Nucleic Acids Res. 2012;40:D930–D934. doi: 10.1093/nar/gkr917. [DOI] [PMC free article] [PubMed] [Google Scholar]
- 78.Wang K, Li M, Hakonarson H. ANNOVAR: functional annotation of genetic variants from high-throughput sequencing data. Nucleic Acids Res. 2010;38:e164–e164. doi: 10.1093/nar/gkq603. [DOI] [PMC free article] [PubMed] [Google Scholar]
- 79.Schadt EE, et al. Mapping the Genetic Architecture of Gene Expression in Human Liver. PLOS Biol. 2008;6:e107. doi: 10.1371/journal.pbio.0060107. [DOI] [PMC free article] [PubMed] [Google Scholar]
- 80.Westra HJ, et al. Systematic identification of trans eQTLs as putative drivers of known disease associations. Nat Genet. 2013;45:1238–1243. doi: 10.1038/ng.2756. [DOI] [PMC free article] [PubMed] [Google Scholar]
- 81.Lappalainen T, et al. Transcriptome and genome sequencing uncovers functional variation in humans. Nature. 2013;501:506–511. doi: 10.1038/nature12531. [DOI] [PMC free article] [PubMed] [Google Scholar]
- 82.Greenawalt DM, et al. A survey of the genetics of stomach, liver, and adipose gene expression from a morbidly obese cohort. Genome Res. 2011;21:1008–1016. doi: 10.1101/gr.112821.110. [DOI] [PMC free article] [PubMed] [Google Scholar]
- 83.Lee SH, Wray NR, Goddard ME, Visscher PM. Estimating Missing Heritability for Disease from Genome-wide Association Studies. Am J Hum Genet. 2011;88:294–305. doi: 10.1016/j.ajhg.2011.02.002. [DOI] [PMC free article] [PubMed] [Google Scholar]
- 84.Purcell S, et al. PLINK: A Tool Set for Whole-Genome Association and Population-Based Linkage Analyses. Am J Hum Genet. 2007;81:559–575. doi: 10.1086/519795. [DOI] [PMC free article] [PubMed] [Google Scholar]
- 85.Chang CC, et al. Second-generation PLINK: rising to the challenge of larger and richer datasets. GigaScience. 2015;4 doi: 10.1186/s13742-015-0047-8. [DOI] [PMC free article] [PubMed] [Google Scholar]
- 86.Nicolae DL, et al. Trait-Associated SNPs Are More Likely to Be eQTLs: Annotation to Enhance Discovery from GWAS. PLOS Genet. 2010;6:e1000888. doi: 10.1371/journal.pgen.1000888. [DOI] [PMC free article] [PubMed] [Google Scholar]
Associated Data
This section collects any data citations, data availability statements, or supplementary materials included in this article.
Supplementary Materials
Data Availability Statement
Data, including all genotype data and information on dyslipidemia status, are available on approximately 78% of GERA participants from dbGaP under accession code phs000674.v1.p1. This includes individuals who consented to having their data shared with dbGaP. The complete GERA data are available upon application to the KP Research Bank Portal, http://researchbank.kaiserpermanente.org/for-researchers/. The UK Biobank data are available upon application to the UK Biobank, www.biobank.ac.uk.