Abstract
Optical coherence tomography (OCT) can demonstrate early deterioration of the photoreceptor integrity caused by inherited retinal degeneration diseases (IRD). A machine learning method based on random forests was developed to automatically detect continuous areas of preserved ellipsoid zone structure (an easily recognizable part of the photoreceptors on OCT) in sixteen eyes of patients with choroideremia (a type of IRD). Pseudopodial extensions protruding from the preserved ellipsoid zone areas are detected separately by a local active contour routine. The algorithm is implemented on en face images with minimum segmentation requirements, only needing delineation of the Bruch’s membrane, thus evading the inaccuracies and technical challenges associated with automatic segmentation of the ellipsoid zone in eyes with severe retinal degeneration.
Keywords: optical coherence tomography, medical and biomedical imaging, ophthalmology, image reconstruction, photoreceptor, ellipsoid zone, choroideremia, machine learning
1. Introduction
Choroideremia (OMIM 303100) is an X-linked recessive degenerative inherited chorioretinopathy resulting from mutations in the CHM gene. It typically presents with childhood onset nyctalopia in males, followed by a progressive loss of peripheral vision and ultimately deterioration of central vision starting in the fourth decade of life.1, 2 Female carriers are mildly affected, although some can manifest severe disease due to skewed X-chromosome inactivation.3 Early studies reported the choriocapillaris/choroid to be the first site of degeneration, resulting in the death of retinal pigmented epithelial (RPE) cells and photoreceptors.4, 5 However, subsequent investigations suggested that the choriocapillaris was not the primary site of degeneration and revealed that death of the photoreceptors6 or RPE cells7–11 might occur first. To better study the timing and progression of cell death in choroideremia, we sought to develop image processing methods based on multimodal imaging technologies to visualize the damage on the different tissue simultaneously and non-invasively.
Multiple imaging technologies including fundus photography,12 fundus autofluorescence,13 fluorescein angiography14, 15 and optical coherence tomography (OCT) 16–19 have been used to study choroideremia. The most advantageous one is OCT, which can achieve high axial and lateral resolution and can provide a three-dimensional map of retinal layer and choroidal reflectance in a few seconds. Used together with OCT angiography (OCTA)20 this imaging modality can characterize abnormalities in retinal morphology and circulation simultaneously in a single scan.11, 21, 22
Photoreceptor integrity is often evaluated by the second hyperreflective layer of the outer retina observed in cross-sectional OCT images, which has been identified as either the inner segment/outer segment junction or as the ellipsoid zone (EZ).23–25 It is very challenging to segment the EZ layer in this disease, since it is usually not discernible in large areas. To the best of our knowledge, no fully-automated algorithm has been validated to identify EZ region in choroideremia. This fundamental limitation has hindered accurate quantification of the EZ loss area, a parameter that can be useful in the assessment of disease evolution.
In this paper, we present and validate an automated algorithm based on a random forest classification method to identify the preserved EZ area in choroideremia. An additional post-processing step based on local active contour is incorporated to detect outer retinal tubulations (ORT). Detection of EZ loss is performed using en face information produced with segmentation of the Bruch’s membrane interface only, significantly simplifying the complexity of pathological EZ segmentation and reducing the associated errors. This method can be used simultaneously with another algorithm previously developed by us for automatic assessment of choriocapillaris integrity22 to better evaluate the evolution of choroideremia patients.
2. Materials and methods
2.1. Patient selection and data acquisition
Sixteen eyes from nine patients with choroideremia and five healthy participants were recruited from the Ophthalmic Genetics clinic at the Casey Eye Institute of Oregon Health & Science University. All patients had clinical manifestations of choroideremia and seven have been genetically confirmed. All of the diseased subjects had EZ defects and preserved EZ areas. The study was approved by the Institutional Review Board and was in compliance with the Declaration of Helsinki.
OCT/OCTA data was acquired by the RTVue-XR Avanti OCT instrument (Optovue Inc., CA, USA), which operates at a center wavelength of 840 nm with an axial scan rate of 70 kHz. Each scan covered a 6×6 mm2 area with a 2 mm depth. B-scans in the fast-scanning direction consisted of 304 axial scans and were repeated two times at 304 lateral positions. A volume consisting of 608 B-scans was completed in 2.9 seconds. Another volumetric scan on the orthogonal fast-scanning direction was acquired and a motion correction technology algorithm26 registered and merged them into a single volume to reduce the effect of motion artifacts.27 Structural OCT images were obtained by averaging the repeated B-scans at each position and OCTA images were acquired by the split-spectrum amplitude decorrelation angiography (SSADA) algorithm.28
2.2. Algorithm overview
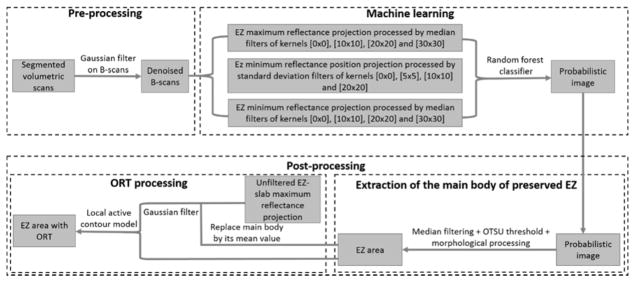
The flow chart of the algorithm is shown (Figure 1). A pre-processing step consisted of Bruch’s membrane segmentation and denoising of B-scans using Gaussian filters. A random forest classification method detected “islands” of partially/completely preserved EZ. However, it is known from previous studies that ORT with the appearance of pseudopodial extensions protrude from the main preserved EZ area. These pseudopods are formed by scrolled outer retina due to RPE/choriocapillaris’ inability to sustain it11 and they are not detected by the random forest routine. A post-processing step extracted the region of EZ loss and added the ORT undetected by the random forest using a local active contour routine. The algorithm was implemented with custom software written in Matlab 2013a (Mathworks, MA, USA).
Figure 1.
Flow chart of the preserved ellipsoid zone detection algorithm. A pre-processing step takes the Bruch’s membrane segmentation and denoises by B-scans by application of a Gaussian filter. Then, a random forest classifier formed by 50 decision trees, which has been trained on 12 features of a population of 15 choroideremia eyes and 5 healthy eyes is applied on the scan under scrutiny. A probabilistic map of the main body of preserved ellipsoid zone (EZ) region is generated by the random forest classifier. Outer retinal tubulations (ORT) with the form of pseudopodial extensions protruding from the main body region are not detected by the random forest. To identify them, the main body of preserved EZ is extracted by a filtering step followed by Otsu thresholding. Then, the main body of preserved EZ is identified in the unfiltered maximum reflectance projection and substituted by its mean reflectance value. This image is then filtered and fed into a local active contour routine that extracts the ORT.
2.3. Pre-processing
The Bruch’s membrane interface was first segmented automatically using the custom processing software developed for the Center for Ophthalmic Optics & Lasers-Angiography Reading Toolkit (COOL-ART).29 The EZ slab was approximated between 8 to 16 voxels above the Bruch’s membrane.11, 21 A denoising step, consisting of a Gaussian filter of 10 pixels kernel, smoothed the B-scans before generating the en face images used to detect EZ loss.
2.4. Machine learning with random forest classifier
2.4.1. Random forest classifier
Supervised machine learning methods for classification and regression comprise boosting, Bootstrap aggregating (Bagging) and random forests. Random forests30 are a fast alternative that reduces classification errors by Bagging and overfitting of noisy datasets by boosting. Briefly, a random forest classifier is generated by an ensemble of multiple, non-associated decision trees. Each tree is built from a randomly-chosen subset of the training data. At each node, the tree receives a randomly-chosen subset of the available features and chooses the one that maximizes the information gained, based on the Gini index. Then, nodes are split and a new subset of features is evaluated for the following node. The output of the forest for each input value is the most popular class voted by the trees as
| (1) |
where N is the number of decision trees, pn the classification probabilities for data point v falling in class c. Random forests are robust tools for classification tasks in images with low-quality features.
We generated a random forest classifier with 50 decision trees from manually-segmented training data of retinal images from fifteen eyes affected by choroideremia and five healthy eyes. To train the trees, four features out of a total of twelve were evaluated by their Gini index at each level. The features were obtained from en face images and will be defined in section 2.4.3. Pixels forming the training set images were manually classified into two classes: preserved EZ and disrupted EZ. After the trees in the forest voted for the pixel’s probability to belong to the preserved EZ class, the main area of preserved EZ was mapped.
2.4.2. Manual grading
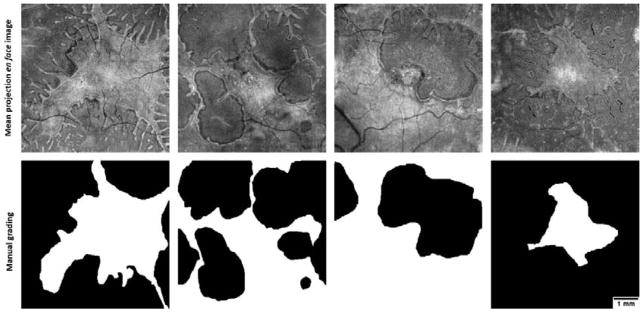
To train the trees, an experienced grader manually segmented the preserved EZ area in each image, generated by mean reflectance projection of the unfiltered EZ slab (Figure 2). The grader used the freehand area selection tool in ImageJ for manual segmentation and was instructed to select the main EZ region, excluding the ORT extensions. A post-processing step to detect the ORTs (section 2.5) followed the pixel classification step by random forest.
Figure 2.
The ellipsoid zone (EZ) mean projection en face image (top) and the corresponding manual grading (bottom) of preserved EZ area in four choroideremia eyes. In the graded images, white color represents the preserved EZ region selected. The grader was instructed to overlook the outer retinal tubulations. Scale bar represents 1 mm.
2.4.3. Feature selection
Based on our definition of the approximated EZ slab from section 2.3, each pixel within a given region could be categorized by a decision tree as preserved EZ or disrupted EZ. The category of preserved EZ comprises completely preserved and partially preserved EZ (Figure 3A–B), with the second exhibiting some damage but still containing functioning photoreceptors. Since the EZ slab is hyper-reflective in preserved EZ areas, en face images formed by projection of the maximum reflectance contain relevant information useful in tree training (Figure 3C). On the other hand, the areas of partially preserved EZ typically surround the areas of completely preserved EZ and exhibit sharp boundaries with completely disrupted EZ. To train for areas of partially preserved EZ, we calculated the minimum reflectance position within the slab by assigning a value of 1 to the A-lines whose minimum reflectance is located at the innermost position in the slab and a value of 9 if it is located at the outermost position. Projection of the minimum reflectance position led to dark appearance of the partially preserved regions and a random specked appearance (both bright and dark) in areas of completely preserved and completely disrupted EZ (Figure 3D). Since the completely preserved and completely disrupted regions are not distinguishable by the second feature, a third feature generated by projecting the minimum reflectance value within the slab is generated to emphasize the completely preserved EZ area (yellow arrow, Figure 3E).
Figure 3.
Three en face images utilized as features in the detection of preserved ellipsoid zone (EZ). (A) A representative B-scan. The green dotted line is the Bruch membrane interface. The EZ slab used for en face projection is defined between the blue and the red dotted lines. (B) Enlargement of the region enclosed in a blue rectangle in (A). The green arrow represents region of disrupted EZ; the yellow arrows represent completely preserved EZ and the blue arrow represents partially preserved EZ. (C) En face image generated by projection of the maximum reflectance within the EZ slab. (D) En face image generated by projection of the minimum-reflectance position within the EZ slab. (E) En face image generated by projection of the minimum reflectance value within the EZ slab. Scale bar represents 1 mm.
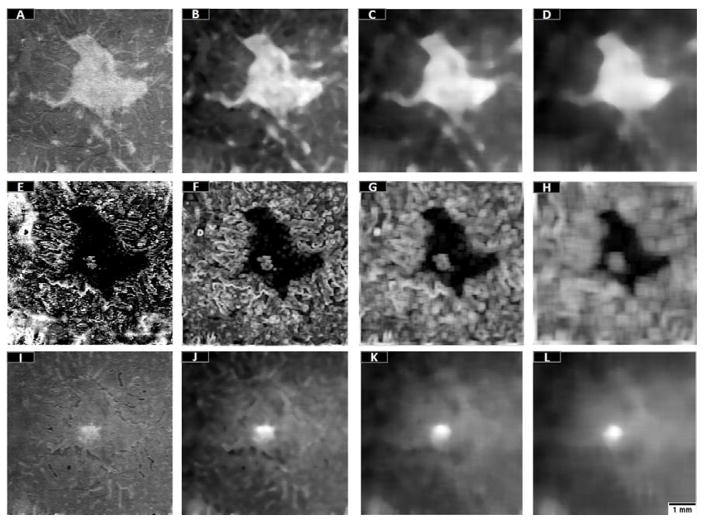
Nine additional features were derived from the maximum reflectance projection, minimum reflectance position projection and minimum reflectance projection en face images in Fig. 3. Three median filters with progressively larger kernel size were used in maximum reflectance and minimum reflectance projections (Figure 4). The median filter calculates the median value within the specified kernel, attenuating the effects of blood vessel shadows and noise on classification. Progressively larger kernel filtering has been typically used to strengthen the classification competence of random forests.22, 31–34 Regarding the minimum reflectance position projections, three standard deviation filters were used to distinguish regular from irregular regions (Figure 4F–H). This filter was chosen over median or Gaussian filter because it retains the boundaries of the preserved EZ area.
Figure 4.
The 12 features used to train the trees forming the random forest classifier. (A) Maximum reflectance en face projection. (B–D) Maximum reflectance en face projection after median filtering with kernels 10×10 pixels (B), 20×20 pixels (C), 30×30 pixels (D). (E) The minimum reflectance position en face projection. (F–H) The minimum reflectance position en face projection after standard deviation filters with kernels 5 × 5 pixels (F), 10 × 10 pixels (G), and 20 × 20 pixels (H). (I) Minimum reflectance en face projection. (J–L) The minimum reflectance en face projection after median filtering with kernels 10×10 pixels (J), 20×20 pixels (K), 30×30 pixels (L). Scale bar represents 1 mm.
In summary, the twelve features used by the random forest classifier were three en face projections (mean reflectance, minimum reflectance and minimum reflectance position) and their corresponding filtered images for three different kernel sizes.
2.5. Post-processing
2.5.1. Region extraction
After the random forest was generated, a case that was not used in the training step was processed and an en face probability map of preserved EZ zones was generated. A median filter was applied to remove noise, Otsu thresholding35 was used to convert the probability map into a binary image and morphological processing to remove abnormally isolated small areas. Next ORTs were identified using a separate post-processing step and added to the area detected above.
2.5.2. ORT processing
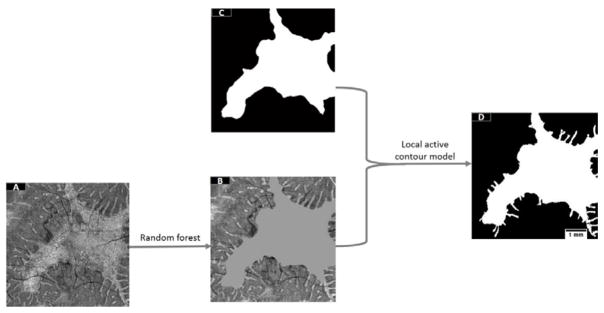
A local active contour model known as uniform modeling energy36 was applied on the unfiltered maximum reflectance en face projection of the EZ slab (Figure 5A) to detect ORT. Local active contour is a robust and accurate model that has been successfully applied on segmentation of a variety of biomedical images.36–38 Here, we first averaged the values at all locations of the preserved EZ region detected by the random forest (Figure 5B). Then, a small Gaussian filter (2×2 pixel) was applied to reduce gray value fluctuations around the ORT with minimal blurring of its boundaries. Then, the active contour routine detected the preserved EZ region (Figure 5D).
Figure 5.
ORT detection by an active local contour routine. (A) is the maximum reflectance projection; (B) is the result of finding the average of the whole area detected by the random forest in (C) and application of the Gaussian filter; (D) is the final preserved EZ region including the ORT. Scale bar represents 1 mm.
3. Results
To compare the automatic machine learning results with the manual delineation, we used the Jaccard similarity index:
| (2) |
where SR is the EZ region from the random forest classifier, SM is the manual delineation results. Large similarity results in Jaccard indices close to 1.
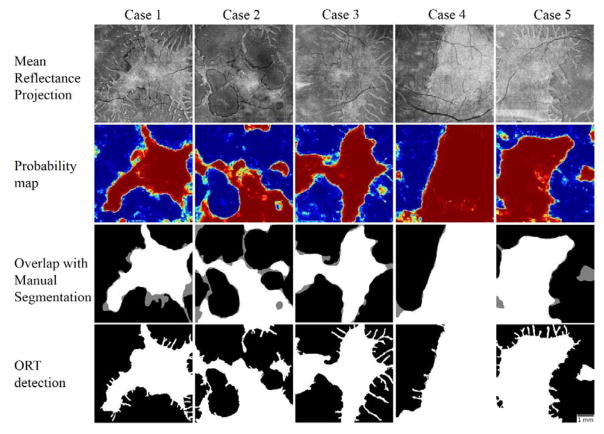
A total of 16 eyes with choroideremia and 5 healthy eyes were evaluated in a leave-one-out fashion and the similarity of the area detected automatically to the area obtained from manual grading was 0.845±0.089 (mean ± standard deviation) before post-processing and 0.876±0.066 after post-processing. Healthy eyes were added to the training data to balance the classification problem. The random forest was trained in approximately 19 minutes and the average time to test the scan left out, detect ORTs and post-process it was 76 seconds. Qualitatively, the results from the machine leaning algorithm closely matched manual delineation (Figure 6). Although detection of the ORT could not be assessed by the Jaccard similarity metric, visual inspection of their similarity to en face mean projection images of the EZ slab exhibited a reasonable qualitative agreement.
Figure 6.
Processing results in 5 cases with choroideremia. The en face images generated by mean projection of reflectance values show the preserved vs disrupted EZ regions. Color-coded probability maps generated by the random forest classifier show preserved regions in red and disrupted regions in blue. The overlap of automatically detected areas with manual segmentation show white areas detected by both (agreement) and gray areas detected by only one of them (disagreement). The images generated after post-processing with a local active contour routine shows reasonable retrieval of ORT. Scale bar represents 1 mm.
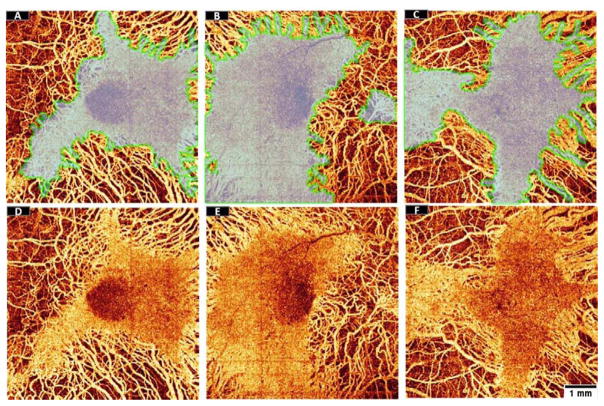
The regions of EZ defect appeared to be spatially correlated with regions of choroidal flow loss (Figure 7). On the other hand, the ORTs were found in areas devoid of underlying choriocapillaris (Figure 7). It has been hypothesized that ORT formation may be a survival mechanism adapted by photoreceptors after losing trophic support from the underlying RPE and choriocapillaris.
Figure 7.
Visual inspection of the preserved EZ area detected by the random forest classifier from three choroideremia eyes (transparent region outlined by a green line) overlaid (A–C) on en face angiograms of choroidal flow (D–F). The structural data used to identify preserved EZ area and the flow data used to identify choroidal loss were acquired simultaneously in a single scan. Scale bar represents 1 mm.
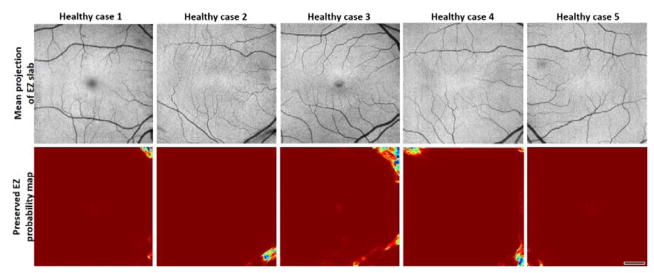
Five healthy cases were investigated to evaluate the prevalence of false negative pixels, mostly found on corners and caused by shadow artifacts (Figure 8). The percentage of pixels incorrectly categorized as EZ defect was 0.86% ± 0.67% (mean ± standard deviation) for the healthy population.
Figure 8.
Pixel classification by the random forest on five healthy cases. Red areas represent healthy tissue while blue areas represent tissue mistakenly classified as EZ defect. Scale bar represents 1 mm.
4. Discussion and conclusion
We have developed a machine learning algorithm integrated with a local active contour routine to automatically detect the preserved EZ area in choroideremia. Twelve features based on maximum reflectance, minimum reflectance and minimum reflectance position projections were used for classification. The classifier was trained on 20 datasets containing scans of diseased and healthy eyes and tested on the dataset left out. A local active contour model was used to detect the ORTs protruding from the main preserved EZ area detected by the random forest. Good agreement with manual grading results was observed.
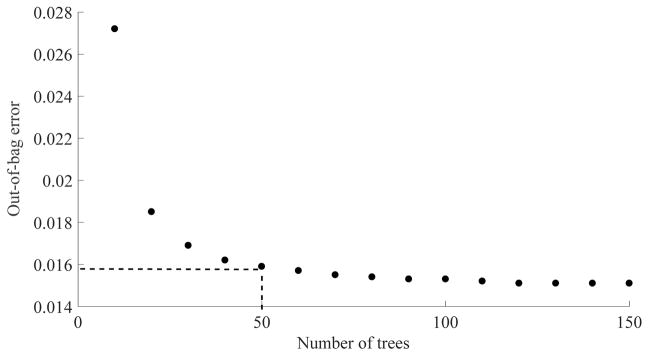
Random forest classifiers are robust tools that have been widely used in OCT image processing applications such as choriocapillaris evaluation in choroideremia,22 segmentation of microcystic macular edema,33 retinal layer segmentation39 and multimodal segmentation of the optic disc.34 Whereas a larger number of trees reduces the variability of the classification, it also results in longer running time. In general, it is not desirable to increase the computational cost for the sake of a marginal classification improvement. For a small number of attributes, forests with no more than 128 trees have been recommended40 and values between 50–100 have been used in previous OCT image processing implementations.22, 33 Here, the out-of-bag error and running times were investigated for variable forest sizes at a fixed tree depth and a compromise was made for 50 trees and 20 minutes training time (Figure 9). Doubling the forest size would result in 3% improvement of the out-of-bag error but a 147% increase in training time. If computational expense were not a concern, further improvement could be achieved if a smaller portion of the training data was sampled during tree definition and the number of trees was increased. Such configuration would be slower to converge but would result in less correlated trees and hence, can reach a lower out-of-bag error.
Figure 9.
Relationship between number of trees in the random forest classifier and the out-of-bag error performance.
Selection of relevant features is a critical part of machine learning. In this study, we used 12 features that can be roughly divided into three groups: maximum reflectance projection, minimum reflectance position projection and minimum reflectance projection. The features based on minimum reflectance and minimum reflectance position complemented each other to recognize the either partially preserved or completely preserved EZ areas. When the features based on maximum reflectance projection were removed (Figure 10A–C) the mean Jaccard similarity index of the population dropped by a 4%. On the other hand, if the features based on minimum reflectance and minimum position projections were removed (Figure 10D), classification based on maximum reflectance projections alone would result in a 21% drop of the similarity index.
Figure 10.
Variations in the accuracy of EZ detection of one representative scan by removing certain features from the random forest classifier. (A) The mean projection en face image of the EZ slab. (B) Classification using the twelve features, Jaccard similarity index for this scan is 0.829. (C) Classification without features obtained from maximum reflectance projection, Jaccard similarity index is 0.769. (C) Classification without the eight features obtained from minimum reflectance and minimum reflectance position projections, Jaccard similarity index is 0.490. Scale bar represents 1 mm.
The main feature that helped the categorization of either partially or completely preserved EZ pixels were the brightness in the images generated from reflectance value projections and the darkness in the images generated from minimum position projection. Due to the characteristics of these features, shadows caused by large vessels in the inner retina, vitreous floaters or pupil vignetting might act as confounding factors, as evidenced by the occasional errors observed on healthy retinas. Although inaccuracies due to shadowing are inevitable, Gaussian filtering the maximum reflectance and minimum reflectance projections with progressively larger kernels helped minimize the effect of dark shadow pixels in the decision making.
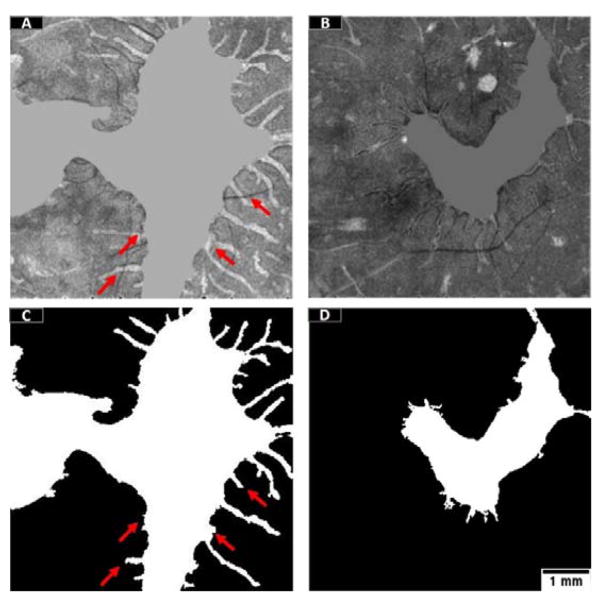
Retrieval of ORT was achieved by a local active contour routine after random forest classification, however, in some occasions the ORT were only partially detectable. Since local active contour is strongly dependent on the initial contours and the intensity of the object, the ORTs could be missed if cut by vessel shadows (Figure 11A, C, red arrows). Other ORT were filled with dark pixels (Figure 11B, D) and contours could not grow either.
Figure 11.
Example of the ORT processing errors. The maximum reflectance projections after replacement of the mean value and Gaussian filtering are shown in (A) and (B). ORT detection is represented in (C) and (D). The red arrows show the effects of blood vessel shadows intercepting ORTs. Scale bar represents 1 mm.
Although it is known that choroideremia causes progressive degeneration of the RPE, photoreceptors, and choroid, the primary location of pathology remains controversial. Accurate assessment of these layers along the course of the disease could provide a better understanding of the natural history and pathophysiology of choroideremia. OCTA has the potential to be useful for simultaneously investigating the structural and vascular22 alterations in chorio-retinal diseases. Moreover, the method proposed in this paper can provide subjective quantitative parameters for monitoring disease progression and the response to investigational gene therapy.41, 42
In summary, we developed an automated algorithm to detect the preserved and disrupted EZ areas in choroideremia. The algorithm uses a random forest classifier method and twelve features to automatically separate pixels into EZ defect and EZ preserved categories. A post-processing step allowed to partially retrieve the outer-retinal pseudopodial extensions protruding from the main preserved EZ area. The results showed good agreement with manual segmentation by an expert grader. This tool evaluates disruption in the EZ layer and can be used in tandem with an algorithm previously developed in our group using OCTA information for choroidal flow assessment22 in order to provide a more comprehensive description of disease progression.
Acknowledgments
This work was supported by grants R01EY027833, DP3 DK104397, R01 EY024544, P30 EY010572 from the National Institutes of Health (Bethesda, MD), National Natural Science Foundation of China (grant no.: 61471226), Natural Science Foundation for Distinguished Young Scholars of Shandong Province (grant no.: JQ201516), China Scholarship Council, China (grant no.: 201608370080), the Choroideremia Research Foundation, the Foundation Fighting Blindness Enhanced Career Development Award (grant no.: CD-NMT-0914-0659-OHSU) and an unrestricted departmental funding grant as well as William & Mary Greve Special Scholar Award from Research to Prevent Blindness (New York, NY). The authors also thank the support from Taishan scholar project of Shandong Province.
Footnotes
Conflict of interest statement:
Oregon Health & Science University (OHSU), Yali Jia, and David Huang have a significant financial interest in Optovue, Inc. These potential conflicts of interest have been reviewed and managed by OHSU.
References
- 1.Sanchez-Alcudia R, Garcia-Hoyos M, Lopez-Martinez MA, Sanchez-Bolivar N, Zurita O, Gimenez A, Villaverde C, Rodrigues-Jacy da Silva L, Corton M, Perez-Carro R, Torriano S, Kalatzis V, Rivolta C, Avila-Fernandez A, Lorda I, Trujillo-Tiebas MJ, Garcia-Sandoval B, Lopez-Molina MI, Blanco-Kelly F, Riveiro-Alvarez R, Ayuso C. PLOS ONE. 2016;11:e0151943. doi: 10.1371/journal.pone.0151943. [DOI] [PMC free article] [PubMed] [Google Scholar]
- 2.Khan KN, Islam F, Moore AT, Michaelides M. Ophthalmology. 2016;123:2158–2165. doi: 10.1016/j.ophtha.2016.06.051. [DOI] [PubMed] [Google Scholar]
- 3.Coussa RG, Kim J, Traboulsi EI. Ophthalmic Genet. 2012;33:66–73. doi: 10.3109/13816810.2011.623261. [DOI] [PubMed] [Google Scholar]
- 4.Mc CJ. Trans Am Acad Ophthalmol Otolaryngol. 1950;54:565–572. [PubMed] [Google Scholar]
- 5.Cameron JD, Fine BS, Shapiro I. Ophthalmology. 1987;94:187–196. doi: 10.1016/s0161-6420(87)33479-7. [DOI] [PubMed] [Google Scholar]
- 6.Syed N, Smith JE, John SK, Seabra MC, Aguirre GD, Milam AH. Ophthalmology. 2001;108:711–720. doi: 10.1016/s0161-6420(00)00643-6. [DOI] [PubMed] [Google Scholar]
- 7.Tolmachova T, Wavre-Shapton ST, Barnard AR, MacLaren RE, Futter CE, Seabra MC. Invest Ophthalmol Vis Sci. 2010;51:4913–4920. doi: 10.1167/iovs.09-4892. [DOI] [PMC free article] [PubMed] [Google Scholar]
- 8.MacDonald IM, Russell L, Chan CC. Survey of ophthalmology. 2009;54:401–407. doi: 10.1016/j.survophthal.2009.02.008. [DOI] [PMC free article] [PubMed] [Google Scholar]
- 9.Flannery JG, Bird AC, Farber DB, Weleber RG, Bok D. Invest Ophthalmol Vis Sci. 1990;31:229–236. [PubMed] [Google Scholar]
- 10.Rodrigues MM, Ballintine EJ, Wiggert BN, Lee L, Fletcher RT, Chader GJ. Ophthalmology. 1984;91:873–883. [PubMed] [Google Scholar]
- 11.Jain N, Jia Y, Gao SS, Zhang X, Weleber RG, Huang D, Pennesi ME. JAMA Ophthalmol. 2016;134:697–702. doi: 10.1001/jamaophthalmol.2016.0874. [DOI] [PMC free article] [PubMed] [Google Scholar]
- 12.Pichi F, Morara M, Veronese C, Nucci P, Ciardella AP. Journal of Ophthalmology. 2013;2013:11. doi: 10.1155/2013/634351. [DOI] [PMC free article] [PubMed] [Google Scholar]
- 13.Renner AB, Fiebig BS, Cropp E, Weber BF, Kellner U. Archives of Ophthalmology. 2009;127:907–912. doi: 10.1001/archophthalmol.2009.123. [DOI] [PubMed] [Google Scholar]
- 14.van Dorp DB, van Balen AT. Ophthalmic Paediatr Genet. 1985;5:25–30. doi: 10.3109/13816818509007852. [DOI] [PubMed] [Google Scholar]
- 15.Noble KG, Carr RE, Siegel IM. Br J Ophthalmol. 1977;61:43–53. doi: 10.1136/bjo.61.1.43. [DOI] [PMC free article] [PubMed] [Google Scholar]
- 16.Dugel PU, Zimmer CN, Shahidi AM. American Journal of Ophthalmology Case Reports. 2016;2:18–22. doi: 10.1016/j.ajoc.2016.04.003. [DOI] [PMC free article] [PubMed] [Google Scholar]
- 17.Xue K, Oldani M, Jolly JK, Edwards TL, Groppe M, Downes SM, MacLaren RE. Invest Ophthalmol Vis Sci. 2016;57:3674–3684. doi: 10.1167/iovs.15-18364. [DOI] [PMC free article] [PubMed] [Google Scholar]
- 18.Syed R, Sundquist SM, Ratnam K, Zayit-Soudry S, Zhang Y, Crawford JB, MacDonald IM, Godara P, Rha J, Carroll J, Roorda A, Stepien KE, Duncan JL. Invest Ophthalmol Vis Sci. 2013;54:950–961. doi: 10.1167/iovs.12-10707. [DOI] [PMC free article] [PubMed] [Google Scholar]
- 19.Kato M, Maruko I, Koizumi H, Iida T. BMJ Case Reports. 2017;2017 doi: 10.1136/bcr-2016-217682. [DOI] [PMC free article] [PubMed] [Google Scholar]
- 20.Jia Y, Bailey ST, Hwang TS, McClintic SM, Gao SS, Pennesi ME, Flaxel CJ, Lauer AK, Wilson DJ, Hornegger J, Fujimoto JG, Huang D. Proceedings of the National Academy of Sciences. 2015;112:E2395–E2402. doi: 10.1073/pnas.1500185112. [DOI] [PMC free article] [PubMed] [Google Scholar]
- 21.Boese EA, Jain N, Jia Y, Schlechter CL, Harding CO, Gao SS, Patel RC, Huang D, Weleber RG, Gillingham MB, Pennesi ME. Ophthalmology. 2016;123:2183–2195. doi: 10.1016/j.ophtha.2016.06.048. [DOI] [PMC free article] [PubMed] [Google Scholar]
- 22.Gao SS, Patel RC, Jain N, Zhang M, Weleber RG, Huang D, Pennesi ME, Jia Y. Biomed Opt Express. 2017;8:48–56. doi: 10.1364/BOE.8.000048. [DOI] [PMC free article] [PubMed] [Google Scholar]
- 23.Spaide RF, Curcio CA. Retina. 2011;31:1609–1619. doi: 10.1097/IAE.0b013e3182247535. [DOI] [PMC free article] [PubMed] [Google Scholar]
- 24.Jonnal RS, Kocaoglu OP, Zawadzki RJ, Lee SH, Werner JS, Miller DT. Invest Ophthalmol Vis Sci. 2014;55:7904–7918. doi: 10.1167/iovs.14-14907. [DOI] [PMC free article] [PubMed] [Google Scholar]
- 25.Staurenghi G, Sadda S, Chakravarthy U, Spaide RF. Ophthalmology. 2014;121:1572–1578. doi: 10.1016/j.ophtha.2014.02.023. [DOI] [PubMed] [Google Scholar]
- 26.Kraus MF, Potsaid B, Mayer MA, Bock R, Baumann B, Liu JJ, Hornegger J, Fujimoto JG. Biomed Opt Express. 2012;3:1182–1199. doi: 10.1364/BOE.3.001182. [DOI] [PMC free article] [PubMed] [Google Scholar]
- 27.Camino A, Zhang M, Gao SS, Hwang TS, Sharma U, Wilson DJ, Huang D, Jia Y. Biomed Opt Express. 2016;7:3905–3915. doi: 10.1364/BOE.7.003905. [DOI] [PMC free article] [PubMed] [Google Scholar]
- 28.Jia Y, Tan O, Tokayer J, Potsaid B, Wang Y, Liu JJ, Kraus MF, Subhash H, Fujimoto JG, Hornegger J, Huang D. Opt Express. 2012;20:4710–4725. doi: 10.1364/OE.20.004710. [DOI] [PMC free article] [PubMed] [Google Scholar]
- 29.Zhang M, Wang J, Pechauer AD, Hwang TS, Gao SS, Liu L, Liu L, Bailey ST, Wilson DJ, Huang D, Jia Y. Biomed Opt Express. 2015;6:4661–4675. doi: 10.1364/BOE.6.004661. [DOI] [PMC free article] [PubMed] [Google Scholar]
- 30.Breiman L. Machine Learning. 2001;45:5–32. [Google Scholar]
- 31.Miri MS, Abràmoff MD, Lee K, Niemeijer M, Wang JK, Kwon YH, Garvin MK. IEEE Transactions on Medical Imaging. 2015;34:1854–1866. doi: 10.1109/TMI.2015.2412881. [DOI] [PMC free article] [PubMed] [Google Scholar]
- 32.Lang A, Carass A, Sotirchos E, Calabresi P, Prince JL. Proceedings of SPIE. 2013;8669:1667494. doi: 10.1117/12.2006649. [DOI] [PMC free article] [PubMed] [Google Scholar]
- 33.Lang A, Carass A, Swingle EK, Al-Louzi O, Bhargava P, Saidha S, Ying HS, Calabresi PA, Prince JL. Biomed Opt Express. 2015;6:155–169. doi: 10.1364/BOE.6.000155. [DOI] [PMC free article] [PubMed] [Google Scholar]
- 34.Miri MS, Abràmoff MD, Lee K, Niemeijer M, Wang JK, Kwon YH, Garvin MK. IEEE transactions on medical imaging. 2015;34:1854–1866. doi: 10.1109/TMI.2015.2412881. [DOI] [PMC free article] [PubMed] [Google Scholar]
- 35.Otsu N. IEEE Transactions on Systems, Man, and Cybernetics. 1979;9:62–66. doi: 10.1109/tsmc.1979.4310068. [DOI] [PubMed] [Google Scholar]
- 36.Lankton S, Tannenbaum A. IEEE Transactions on Image Processing. 2008;17:2029–2039. doi: 10.1109/TIP.2008.2004611. [DOI] [PMC free article] [PubMed] [Google Scholar]
- 37.Qian X, Wang J, Guo S, Li Q. Medical Physics. 2013;40:021911. doi: 10.1118/1.4774359. [DOI] [PMC free article] [PubMed] [Google Scholar]
- 38.Wang L, Chang Y, Wang H, Wu Z, Pu J, Yang X. Information Sciences. 2017;418:61–73. doi: 10.1016/j.ins.2017.06.042. [DOI] [PMC free article] [PubMed] [Google Scholar]
- 39.Lang A, Carass A, Hauser M, Sotirchos ES, Calabresi PA, Ying HS, Prince JL. Biomed Opt Express. 2013;4:1133–1152. doi: 10.1364/BOE.4.001133. [DOI] [PMC free article] [PubMed] [Google Scholar]
- 40.Oshiro TM, Perez PS, Baranauskas JA. In: How Many Trees in a Random Forest?, Vol. Perner P, editor. Springer; Berlin Heidelberg, Berlin, Heidelberg: 2012. pp. 154–168. [Google Scholar]
- 41.MacLaren RE, Groppe M, Barnard AR, Cottriall CL, Tolmachova T, Seymour L, Clark KR, During MJ, Cremers FP, Black GC, Lotery AJ, Downes SM, Webster AR, Seabra MC. Lancet. 2014;383:1129–1137. doi: 10.1016/S0140-6736(13)62117-0. [DOI] [PMC free article] [PubMed] [Google Scholar]
- 42.Edwards TL, Jolly JK, Groppe M, Barnard AR, Cottriall CL, Tolmachova T, Black GC, Webster AR, Lotery AJ, Holder GE, Xue K, Downes SM, Simunovic MP, Seabra MC, MacLaren RE. N Engl J Med. 2016;374:1996–1998. doi: 10.1056/NEJMc1509501. [DOI] [PMC free article] [PubMed] [Google Scholar]


