

Summary
Endogenous and exogenous stresses elicit transcriptional responses that limit damage and promote cell/organismal survival. Like its mammalian counterparts, hepatocyte nuclear factor 4 (HNF4) and peroxisome proliferator‐activated receptor α (PPARα), Caenorhabditis elegans NHR‐49 is a well‐established regulator of lipid metabolism. Here, we reveal that NHR‐49 is essential to activate a transcriptional response common to organic peroxide and fasting, which includes the pro‐longevity gene fmo‐2/flavin‐containing monooxygenase. These NHR‐49‐dependent, stress‐responsive genes are also upregulated in long‐lived glp‐1/notch receptor mutants, with two of them making critical contributions to the oxidative stress resistance of wild‐type and long‐lived glp‐1 mutants worms. Similar to its role in lipid metabolism, NHR‐49 requires the mediator subunit mdt‐15 to promote stress‐induced gene expression. However, NHR‐49 acts independently from the transcription factor hlh‐30/TFEB that also promotes fmo‐2 expression. We show that activation of the p38 MAPK, PMK‐1, which is important for adaptation to a variety of stresses, is also important for peroxide‐induced expression of a subset of NHR‐49‐dependent genes that includes fmo‐2. However, organic peroxide increases NHR‐49 protein levels, by a posttranscriptional mechanism that does not require PMK‐1 activation. Together, these findings establish a new role for the HNF4/PPARα‐related NHR‐49 as a stress‐activated regulator of cytoprotective gene expression.
Keywords: fasting, FMO, HNF4, oxidative stress, PPAR, ROS
1. INTRODUCTION
The ability to respond to acute stress conditions is vital to prevent or limit organismal damage. For instance, transcriptional responses promote adaptation and survival under stress conditions. Impaired stress responses contribute to human age‐related diseases such as diabetes and neurodegenerative disorders (Hetz, Chevet & Harding, 2013; Lin & Beal, 2006), and likely also contribute to aging (Hekimi, Lapointe & Wen, 2011; Shore & Ruvkun, 2013). However, these adaptive responses also protect pathogens and cancer cells against cytotoxic drugs and the immune system (Leprivier, Rotblat, Khan, Jan & Sorensen, 2015; Rankin & Giaccia, 2016). Accordingly, there is widespread interest in defining the mechanisms involved in coordinating these transcriptional responses.
Transcription factors of the nuclear factor (erythroid‐derived 2)‐like 2 (Nrf2) family are required to activate many cytoprotective genes in animals. In the nematode Caenorhabditis elegans, the Nrf2 ortholog SKiNhead (SKN‐1) implements a wide range of homeostatic and stress responses in response to internal and external stimuli (Blackwell, Steinbaugh, Hourihan, Ewald & Isik, 2015). Although the transcription factors DAF‐16, HSF‐1, HLH‐30, and HIF‐1 activate a variety of stress/pathogen‐protective responses, SKN‐1 is especially important to maintain redox balance and defend against oxidative stress caused by xenobiotics that target GSH and cause protein unfolding (Blackwell et al., 2015; Miranda‐Vizuete & Veal, 2016). Nevertheless, distinct responses are initiated in response to different oxidants (Blackwell et al., 2015; Wu, Deonarine, Przybysz, Strange & Choe, 2016). For example, the organic peroxide tert‐butyl‐hydroperoxide (tBOOH) elicits a transcriptional response that is largely skn‐1‐independent (Oliveira et al., 2009). Notably, mdt‐15, a subunit of the mediator transcriptional coregulator that is required for skn‐1‐dependent stress responses, is also required for the skn‐1‐independent transcriptional response to tBOOH (Goh et al., 2014; Taubert, Hansen, Van Gilst, Cooper & Yamamoto, 2008). One of the most highly tBOOH‐induced, mdt‐15‐dependent, skn‐1‐independent genes is the flavin‐containing monooxygenase fmo‐2, whose HIF‐1‐dependent induction in response to hypoxia and dietary restriction (DR) is important for the associated increase in lifespan. Indeed, fmo‐2 is induced in several C. elegans longevity paradigms (Bennett et al., 2017; Leiser et al., 2015). Elucidating how fmo‐2 and other genes induced under these conditions are regulated is important to understand how these responses become defective during aging or in disease (Hekimi et al., 2011; Hetz et al., 2013; Lin & Beal, 2006; Shore & Ruvkun, 2013).
Here, we have used fmo‐2 as a marker to investigate SKN‐1‐independent stress response mechanisms by determining how this pro‐longevity gene is activated in response to organic peroxide and fasting. We found that the nuclear hormone receptor (NHR)‐49, an HNF4/PPARα ortholog and established regulator of C. elegans lipid metabolism and longevity (Pathare, Lin, Bornfeldt, Taubert & Van Gilst, 2012; Ratnappan et al., 2014; Van Gilst, Hadjivassiliou, Jolly & Yamamoto, 2005; Van Gilst, Hadjivassiliou & Yamamoto, 2005), is also activated by and required for oxidative stress resistance. We show that NHR‐49 and MDT‐15 are both required for the increased expression of fmo‐2 as part of a stress response program activated by organic peroxide, fasting, and in long‐lived, germline‐less glp‐1 mutants. Together, our data suggest that the function of NHR‐49 is not confined to regulating lipid metabolism, but also involves activation of a stress‐protective transcriptional program.
2. RESULTS
2.1. nhr‐49 is required to induce an oxidative stress and fasting response program
To screen for factors cooperating with MDT‐15 in the tBOOH‐induced expression of fmo‐2, we generated a transgenic strain expressing a transcriptional fmo‐2p::gfp reporter (Figure S1a). This reporter was constitutively expressed in some neurons and weakly active in the intestine of well‐fed animals, but strongly induced in the intestine, hypodermis, and pharynx following exposure to tBOOH (Figure 1a,b). The fmo‐2p::gfp reporter was also activated by DTT and H2O2, but not by arsenite and cadmium (Figure S1b). Thus, consistent with other studies, our transcriptional reporter was strongly activated by tBOOH but not by stimuli that activate SKN‐1‐dependent gene expression (Goh et al., 2014; Oliveira et al., 2009).
Figure 1.
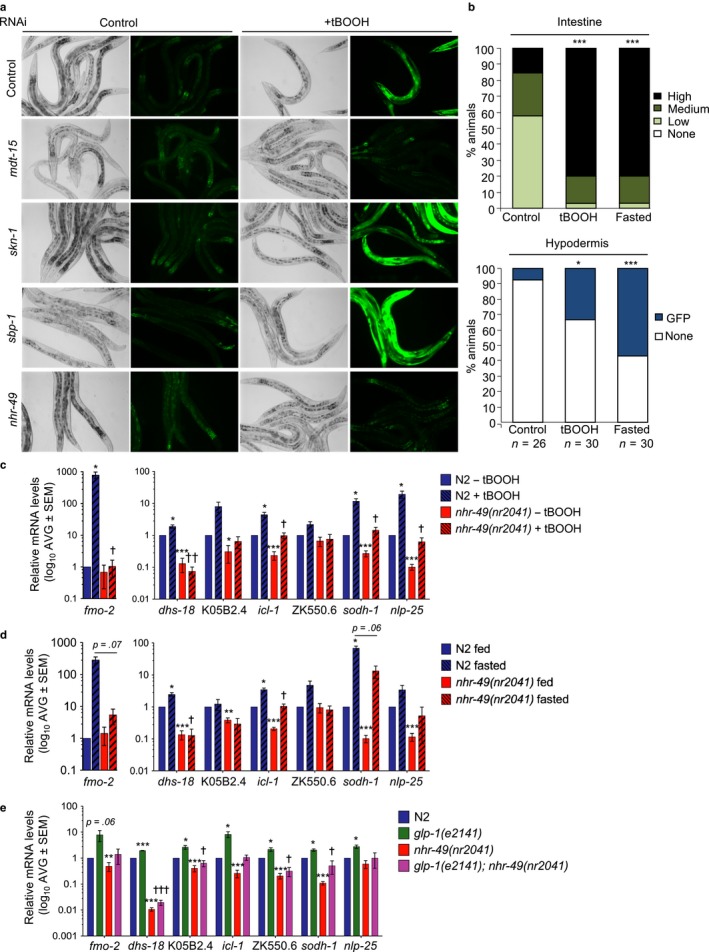
nhr‐49 is required for a stress response program activated by organic peroxide, fasting, and glp‐1 mutation. (a) Micrographs show fmo‐2p::gfp worms grown on control, mdt‐15, skn‐1, sbp‐1, and nhr‐49 RNAi after 3 hr on 10 mm tBOOH. See also Tables S1 and S2 and Figure S1. (b) Quantification of GFP levels in fmo‐2p::gfp worms in the intestine and hypodermis after 3 hr on 10 mm tBOOH or 12 hr of fasting. (c) Fold changes of mRNA levels (relative to untreated wild‐type N2) in L4 N2 and nhr‐49(nr2041) worms treated with 7.5 mm tBOOH for 4 hr (n = 5). *,**,*** p < .05, .01, or .001 vs. N2 untreated worms. †,†† p < .05 or .01 vs. N2‐treated worms (unpaired Student's t test corrected for multiple comparisons using the Holm–Sidak method). (d) Same as (c), but with 8 hr of fasting (n = 3). (e) Fold changes of mRNA levels (relative to N2 wild‐type) in L4 N2, glp‐1(e2141), nhr‐49(nr2041), and nhr‐49(nr2041); glp‐1(e2141) worms. *,**,*** p < .05, .01, or .001 vs. N2 worms. †,††† p < .05 or .001 vs. glp‐1(e2141) worms
To identify genes required for tBOOH‐induced expression of fmo‐2p::gfp, we used RNA interference (RNAi) to deplete 25 candidate transcription factors that bind either MDT‐15 or the fmo‐2 promoter (Tables S1 and S2). As expected, mdt‐15 RNAi completely abrogated tBOOH‐induced fmo‐2 expression, whereas neither skn‐1/Nrf nor sbp‐1/SREBP were required (Figure 1a; Tables S1). Of the tested candidates, nhr‐49 was the only RNAi clone that consistently blocked fmo‐2 induction by tBOOH (Figure 1a; Tables S1 and S2).
nhr‐49 encodes an NHR that binds MDT‐15 and is required for tBOOH resistance (Goh et al., 2014; Taubert, Van Gilst, Hansen & Yamamoto, 2006). NHR‐49 and MDT‐15 regulate lipid metabolism and are needed to induce several lipid metabolism genes in fasted worms (Taubert et al., 2006; Van Gilst et al., 2005; Van Gilst, Hadjivassiliou & Yamamoto, 2005). As fmo‐2 is also induced by fasting (Leiser et al., 2015), we tested whether nhr‐49 is required for fmo‐2 induction in fasted worms. Real‐time quantitative PCR (qPCR) analysis showed that fmo‐2 mRNA levels are strongly induced by tBOOH and by fasting, and this induction was blocked in nhr‐49(nr2041) null mutants (Figure 1c,d).
The discovery that nhr‐49 was required to induce fmo‐2 in response to either tBOOH or fasting raised the possibility that these stresses activate a common biological response. Indeed, meta‐analysis revealed a significant overlap between genes upregulated by tBOOH and by fasting (Figure 2a), with qPCR analysis confirming that 20 of these genes are upregulated in response to either stress (Figure 1c,d, data not shown). Notably, the tBOOH‐ and fasting‐induced expression of seven of these genes was impaired in nhr‐49(nr2041) worms, indicating that NHR‐49 is important for the shared transcriptional response to these stresses (Figure 1c,d). nhr‐49 is also required for metabolic remodeling and increased lifespan due to loss of glp‐1/notch receptor activity in a glp‐1(e2141) mutant (Ratnappan et al., 2014). Notably, meta‐analysis of transcriptome data revealed significant overlaps between genes induced in glp‐1(bn18) mutants (Steinbaugh et al., 2015) and induced by either tBOOH or fasting (Figure 2a). Notably, qPCR analysis showed that the expression of fmo‐2 and other tBOOH‐ and fasting‐induced genes was also increased in long‐lived glp‐1(e2141) mutants and that this was abrogated by loss of NHR‐49 (Figure 1e).
Figure 2.
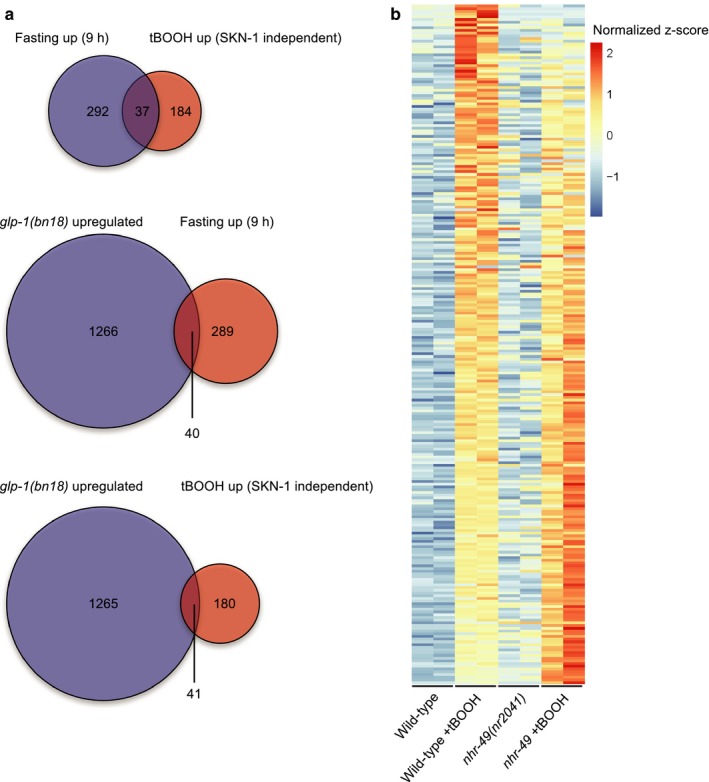
nhr‐49 is required for tBOOH response. (a) Venn diagrams show the overlaps between genes upregulated by tBOOH in a SKN‐1‐independent manner (Oliveira et al., 2009), upregulated after 9 hr of fasting (Uno et al., 2013), and upregulated in the glp‐1(bn18) mutant (Steinbaugh et al., 2015). p < 2.2 × 10⁻¹⁶, p = .0001892, and p = 1.598 × 10−09, respectively (Fisher's exact test). (b) The heat map shows the z‐score transformed expression values of the 250 genes that are induced more than fourfold and with FDR <0.05 in wild‐type worms by tBOOH. These genes are arranged from highest to lowest difference in z‐score in wild‐type +tBOOH vs. nhr‐49 + tBOOH. Genes are colored based on their z‐score normalized to the average across all four conditions (untreated wild‐type worms, tBOOH‐treated wild‐type worms, untreated nhr‐49(nr2041) mutants, and tBOOH‐treated nhr‐49(nr2041) mutant). Note, for each condition, two biological replicates are shown. See also Tables [Link], [Link], [Link]
We also used RNA‐seq to compare the transcriptomes of wild‐type and nhr‐49(nr2041) worms before and following exposure to tBOOH (Figure 2b;Tables S3 and S4). We found that tBOOH induced 250 genes more than fourfold in wild‐type. Consistent with our meta‐analysis with published datasets (Figure 2a), there was a significant overlap between these 250 tBOOH‐responsive genes and previously published tBOOH, fasting, and glp‐1‐regulated genes (Table S5). Notably, of the 250 genes, the induction of 75 was compromised by loss of nhr‐49, including fmo‐2 and nlp‐25 (FDR > 0.05 and >twofold reduced induction in nhr‐49 mutants vs. wild‐type); in contrast, these genes were not significantly (FDR < 0.05) deregulated by loss of nhr‐49 in the absence of tBOOH (Table S4). Together, these data suggest that nhr‐49 is required for increased expression of a shared set of genes following oxidative stress, fasting, and in at least one long‐lived mutant.
2.2. Active nhr‐49 and its coactivator mdt‐15 are sufficient for increased expression of stress‐responsive genes
NHR‐49 dimerizes with NHR‐13, NHR‐66, and NHR‐80 to regulate genes involved in lipid metabolism (Folick et al., 2015; Pathare et al., 2012). However, the tBOOH‐induced expression of fmo‐2, K05B2.4, and icl‐1 was largely unchanged in nhr‐13(ok796), nhr‐66(ok940), and nhr‐80(tm1011) null mutants (Figure S2a). This suggests that NHR‐49 does not partner with these NHRs in the tBOOH response.
To test whether increased NHR‐49 activity alone is sufficient to activate these stress‐responsive genes, we crossed the fmo‐2p::gfp reporter into the nhr‐49(et13) gain‐of‐function (gof) mutant (Lee, Goh, Wong, Klassen & Taubert, 2016). We observed constitutive intestinal and pharyngeal fluorescence in the fmo‐2p::gfp; nhr‐49(et13) strain, which was ablated by nhr‐49 RNAi, suggesting that increased NHR‐49 activity is sufficient to activate fmo‐2 in these tissues (Figure 3a). qPCR analysis of nhr‐49(et13) worms also revealed higher levels of fmo‐2 and K05B2.4 mRNA, although other tested tBOOH‐ and fasting‐induced genes were only modestly induced (Figure 3b, data not shown). In contrast, the expression of arsenite‐responsive genes (gst‐4, gcs‐1, gst‐6, ptps‐1), which require skn‐1 and mdt‐15 for activation (Goh et al., 2014; Oliveira et al., 2009), was not increased in nhr‐49 gof mutants (Figure S2b). Thus, our data suggest that NHR‐49‐dependent oxidative stress gene activation is distinct from the SKN‐1‐dependent response to arsenite.
Figure 3.
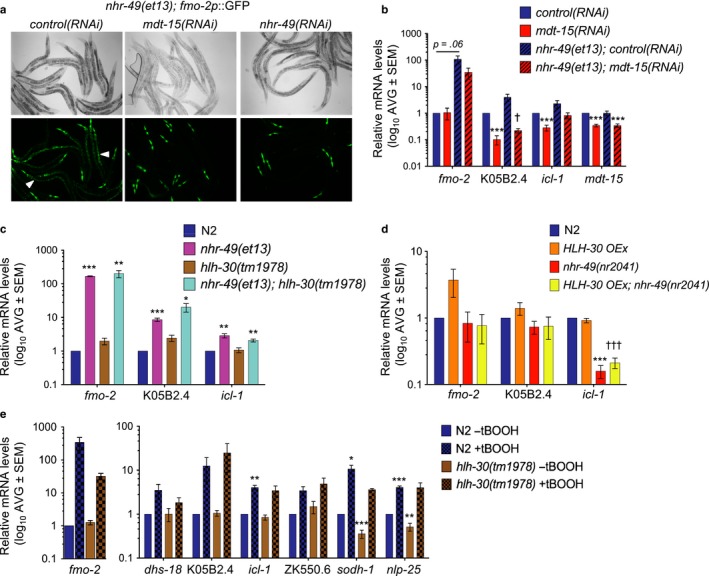
Stress response gene induction by nhr‐49 requires mdt‐15 but not hlh‐30. (a) Micrographs of nhr‐49(et13); fmo‐2p::gfp worms grown on control, mdt‐15, and nhr‐49 RNAi. Arrowheads indicate intestinal GFP. (b) Fold changes of mRNA levels (relative to N2 control(RNAi) worms) in L4 N2 and nhr‐49(et13) worms treated with control and mdt‐15 RNAi (n = 5). *** p < .001 vs. N2 control(RNAi) worms, † p < .05 vs. nhr‐49(et13) control(RNAi) worms (unpaired Student's t test corrected for multiple comparisons using the Holm–Sidak method). (c) Fold changes of mRNA levels (relative to wild‐type N2 worms) in L4 N2, nhr‐49(et13), hlh‐30(tm1978), and hlh‐30(tm1978); nhr‐49(et13) worms (n ≥ 3). *,**,*** p < .05, .01, or .001 vs. N2 worms (unpaired Student's t test corrected for multiple comparisons using the Holm–Sidak method). (d) Fold changes of mRNA levels (relative to wild‐type N2 worms) in L4 N2 worms, N2 worms overexpressing hlh‐30p::hlh‐30::gfp, nhr‐49(nr2041) mutants, and nhr‐49(nr2041) mutants overexpressing hlh‐30p::hlh‐30::gfp (n ≥ 3). *** p < .001 vs. N2 worms, ††† p < .05 vs. N2 worms overexpressing hlh‐30p::hlh‐30::gfp (unpaired Student's t test corrected for multiple comparisons using the Holm‐Sidak method). (e) Fold changes of mRNA levels (relative to wild‐type N2‐untreated worms) in L4 N2 and hlh‐30(tm1978) worms treated with 7.5 mm tBOOH for 4 hr (n = 5). Statistics as in (b). **,*** p < .01, or .001 vs. N2 untreated worms. See also Figure S3
mdt‐15 is an essential coactivator for SKN‐1 in the arsenite response and for NHR‐49 in the regulation of lipid metabolism genes (Goh et al., 2014; Taubert et al., 2006). Hence, we tested whether MDT‐15's role as an NHR‐49 coactivator might underlie its role in tBOOH‐induced, SKN‐1‐independent gene expression. Indeed, mdt‐15 RNAi abolished the intestinal fluorescence in fmo‐2p::gfp; nhr‐49(et13) worms and the increased K05B2.4 mRNA levels in nhr‐49(et13) worms (Figure 3a,b). Elevated pharyngeal expression of fmo‐2p::gfp was unaffected by either mdt‐15 or nhr‐49 RNAi, likely reflecting RNAi resistance of this tissue and possibly explaining the limited effect of mdt‐15 RNAi on whole‐worm fmo‐2 mRNA levels (Figure 3b). Altogether, these data suggest that, in the presence of MDT‐15, active NHR‐49 is sufficient to induce fmo‐2 and K05B2.4, consistent with MDT‐15 acting as a coactivator for NHR‐49‐driven, tBOOH‐induced gene expression.
2.3. nhr‐49 acts independently of hlh‐30 to activate fmo‐2 and other stress‐responsive genes
The intestinal induction of fmo‐2 by fasting or hypoxia requires the transcription factors hlh‐30/TFEB and hif‐1/HIF (Leiser et al., 2015), master regulators of C. elegans autophagy, and hypoxia gene programs, respectively (Lapierre et al., 2013; O'Rourke & Ruvkun, 2013; Powell‐Coffman, 2010). Moreover, hlh‐30 is required for the long lifespan of glp‐1(e2141) mutants (Nakamura et al., 2016). hif‐1 RNAi did not prevent tBOOH‐induced expression of fmo‐2p::gfp (data not shown). However, reminiscent of its activation following fasting (O'Rourke & Ruvkun, 2013), we observed a transient increase in nuclear levels of a HLH‐30::GFP fusion protein in response to tBOOH (Figure S3a). Thus, we examined whether hlh‐30 and nhr‐49 might function in the same stress response pathway. However, qPCR analysis revealed that three genes were induced similarly in the nhr‐49(et13) single and the hlh‐30(tm1978); nhr‐49(et13) double mutant, suggesting that hlh‐30 is dispensable for the activation of these genes by NHR‐49 (Figure 3c). Moreover, these genes were not significantly upregulated by transgenically overexpressing hlh‐30, either in the presence or in the absence of NHR‐49 (Figure 3d). Lastly, hlh‐30(tm1978) mutation only weakly reduced fmo‐2 induction by tBOOH (statistically not significant, Figures 3e and S3b–d). In contrast, hlh‐30 was partially required for fmo‐2 induction by fasting, as reported (Leiser et al., 2015), and for sodh‐1 expression, under both stress and non‐stress conditions (Figures 3e and S3b–d). These data suggest that NHR‐49 and HLH‐30 act in parallel, or that NHR‐49 acts downstream of HLH‐30, to promote the transcriptional response to organic peroxide. Indeed, our inability to obtain an nhr‐49(nr2041); hlh‐30(tm1978) double mutant (see Experimental Procedures) suggests that these genes act nonredundantly in parallel pathways.
2.4. NHR‐49 levels increase following oxidative stress
Next, we examined whether NHR‐49 is activated by oxidative stress. NHR‐49 levels are increased in glp‐1 mutants due to DAF‐16‐ and TCER‐1‐driven increases in nhr‐49 mRNA levels (Ratnappan et al., 2014). Hence, we used an Pnhr‐49::nhr‐49::GFP transgene that encodes all known nhr‐49 isoforms (Figure S4a; Ratnappan et al., 2014) to test whether levels or localization of NHR‐49::GFP fusion proteins also change in response to tBOOH or fasting. The high basal levels of nuclear NHR‐49::GFP made stress‐induced changes difficult to detect by microscopy (Figure 4a). However, Western blot analysis of whole‐worm lysates showed that bands with mobilities of ~100 kDa and ~70 kDa, absent from animals lacking the transgene, were reduced by nhr‐49 RNAi and increased upon exposure to tBOOH (Figures 4b and S4c). Notably, nhr‐49 mRNA levels were not induced by this exposure to tBOOH (Figure S4d), suggesting that NHR‐49 levels are posttranscriptionally raised in response to tBOOH. Intriguingly, further electrophoretic separation of proteins revealed the presence of a less mobile ~100kD NHR‐49::GFP isoform following tBOOH treatment (Figures 4b and S4c). This could reflect specific tBOOH‐induced increased levels of one of the larger NHR‐49::GFP isoforms (Figure S4a), but is also consistent with the predominant isoform(s) becoming posttranslationally modified, for example, by phosphorylation.
Figure 4.
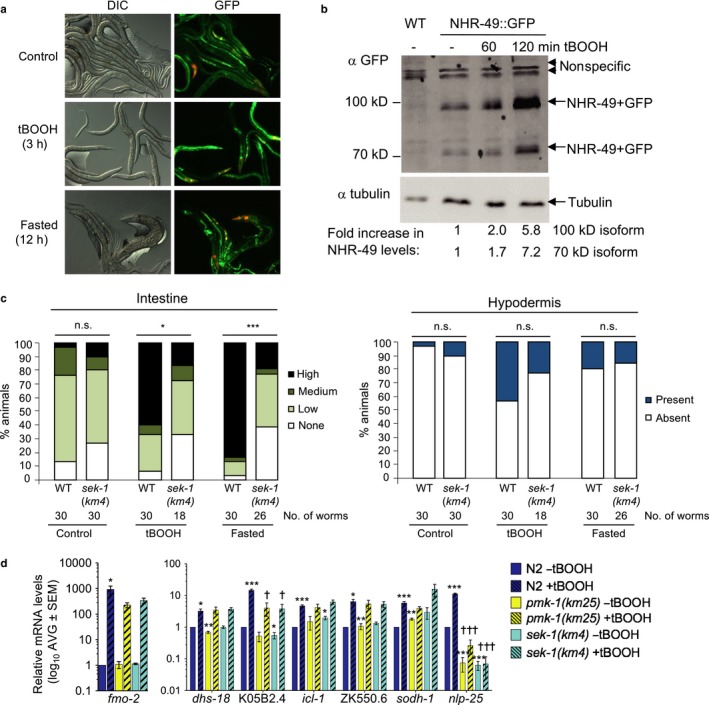
Regulation of NHR‐49 protein levels by tBOOH is sek‐1‐dependent. (a) Micrographs show Pnhr‐49::nhr‐49::gfp worms in normal and stress conditions. (b) Immunoblots on lysates of wild‐type (WT) and Pnhr‐49::nhr‐49::gfp (NHR‐49::GFP) worms, untreated or treated with 10 mm tBOOH. Two bands (~100 and ~70 kDa) are detected in worms expressing NHR‐49::GFP fusion proteins; arrowhead indicates nonspecific bands also detected in WT worms. Tubulin = loading control. Fold increases in NHR‐49::GFP levels (normalized to tubulin), relative to the levels of each isoform in untreated animals, are indicated. (c) Quantification of intestinal and hypodermal GFP intensity in fmo‐2p::gfp and sek‐1(km4); fmo‐2p::gfp worms following exposure to tBOOH and fasting. (d) Fold changes of mRNA levels (relative to untreated N2 wild‐type) in L4 N2, pmk‐1(km25), and sek‐1(km4) worms treated with 7.5 mm tBOOH for 4 hr (n = 4). *,**,*** p < .05, .01, or .001 vs. N2 untreated worms. †,††† p < .05 or .001 vs. wild‐type treated worms (unpaired Student's t test corrected for multiple comparisons using the Holm–Sidak method). See also Figure S4
2.5. Stress activation of the p38 MAPK, PMK‐1, is required for the tBOOH‐induced expression of some NHR‐49‐dependent genes but dispensable for increase in NHR‐49 protein levels
The conserved p38 mitogen‐activated protein kinase (MAPK) PMK‐1 is activated by phosphorylation by the SEK‐1 MAPKK in response to many stresses, including tBOOH. PMK‐1‐dependent phosphorylation of SKN‐1 is vital for stress‐induced increases in its activity (Blackwell et al., 2015; Inoue et al., 2005). Hence, we hypothesized that these kinases might be required for tBOOH‐induced increases in NHR‐49 levels and/or fmo‐2 expression. Indeed, although loss of sek‐1 had little effect on hypodermal fmo‐2p::gfp expression, it limited the intestinal induction of fmo‐2p::gfp by tBOOH and fasting (Figure 4c). Moreover, qPCR analysis revealed that, although the expression of some tBOOH‐induced genes was unaffected, loss of sek‐1 or downstream pmk‐1 prevented the full induction of fmo‐2, nlp‐25, and K05B2.4 mRNA by tBOOH (Figure 4d). However, although sek‐1 is vital for tBOOH‐induced increases in PMK‐1 phosphorylation (Inoue et al., 2005) (Figure S4e), loss of sek‐1 did not have a significant impact on tBOOH‐induced increases in the levels or decreased mobility of NHR‐49::GFP (Figure S4f). These data suggest that PMK‐1 activity plays a minor role in the tBOOH‐induced activation of some NHR‐49‐dependent genes, but is not required for tBOOH‐induced increases in NHR‐49.
2.6. nhr‐49 and two NHR‐49‐regulated genes increase stress resistance of wild‐type and long‐lived glp‐1 mutant worms
Finally, we tested whether NHR‐49's role in promoting the expression of stress‐responsive genes might be important for survival in stress conditions. We have previously shown that the loss of nhr‐49 reduces the ability of animals to survive exposure to toxic levels of tBOOH (Goh et al., 2014) (Figure 5a; Table S6). Furthermore, although fmo‐2 mutant animals were, unexpectedly, more resistant to tBOOH than wild‐type animals (Figure 5a), both nhr‐49 and fmo‐2 null mutant L1 larvae were less able to survive and recover from fasting (Figure 5b). Next, we tested whether the elevated basal expression of tBOOH‐responsive genes in the nhr‐49(et13) and long‐lived glp‐1(e2141) mutants might be sufficient to increase stress resistance. Indeed, a small, but statistically significant increase was observed in the survival of both NHR‐49 overexpressing (Pnhr‐49::nhr‐49::GFP) and nhr‐49(et13) gof worms exposed to tBOOH (Figures 5c and S5a, Tables S7 and S8). Moreover, long‐lived glp‐1 mutant worms displayed a substantially increased resistance to tBOOH (Figure 5d) (Steinbaugh et al., 2015), which was abrogated in nhr‐49(nr2041); glp‐1(e2141) double mutants (Figure 5d; Table S9). It is likely that multiple genes contribute to NHR‐49‐dependent increases in stress resistance. Indeed, surprisingly, loss of fmo‐2 actually increased tBOOH resistance, suggesting that in its absence, other stress‐protective genes may be upregulated (Figure 5a). However, RNAi depletion of two other NHR‐49‐upregulated, tBOOH‐responsive genes (K05B2.4, sodh‐1) consistently increased the tBOOH sensitivity of both wild‐type and germline‐less glp‐1 mutant worms (Figure 5e,f; Tables S10 and S11). In contrast, and in line with our gene expression data (Figure 3), hlh‐30 mutants were not sensitive to tBOOH (Figure S5b, Table S12). Together, these data suggest that nhr‐49 plays an important role in promoting the survival of C. elegans exposed to organic peroxide or experiencing fasting and identify three NHR‐49‐upregulated genes that are important for resistance to at least one of these conditions.
Figure 5.
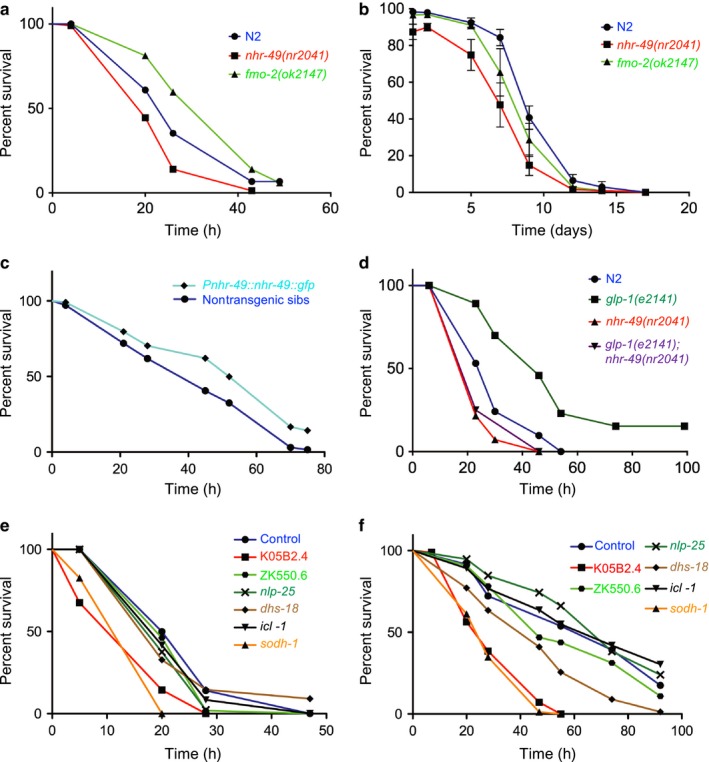
nhr‐49 is required and sufficient for stress resistance. (a) Survival plots of wild‐type N2, nhr‐49(nr2041), and fmo‐2(ok2147) worms on 6 mm tBOOH. Table S6 shows statistics and replicates. (b) Survival of wild‐type N2, nhr‐49(nr2041), and fmo‐2(ok2147) worms after L1 fasting over time (p < .05 vs. N2 for both genotypes, determined by calculating area under the curve). (c) Survival plots of NHR‐49 overexpressing worms (Pnhr‐49::nhr‐49::gfp) and nontransgenic siblings, on 6 mm tBOOH. Table S7 shows statistics and replicates. (d) Survival plots of wild‐type N2, glp‐1(e2141), nhr‐49(nr2041), and nhr‐49(nr2041); glp‐1(e2141) worms on 6 mm tBOOH. Tables S9 shows statistics and replicates. (e, f) Survival plots of wild‐type (e) and glp‐1(e2141) (f) worms grown on control RNAi or RNAi clones targeting six different NHR‐49‐regulated genes while exposed to 6 mm tBOOH. Tables S10 and S11 show statistics and replicates
3. DISCUSSION
NHR‐49 is a critical regulator of lipid metabolism and longevity (Burkewitz et al., 2015; Chamoli, Singh, Malik & Mukhopadhyay, 2014; Folick et al., 2015; Khan et al., 2013; Ratnappan et al., 2014; Seah et al., 2016), while related nuclear receptors, HNF4 and PPARα, are therapeutic targets that share at least some of these functions in mammals. Here, we show that NHR‐49 is also vital for an adaptive transcriptional response to the organic peroxide tBOOH. This response includes the induction of the flavin‐containing monooxygenase fmo‐2, which is important for dietary restriction‐induced longevity and resistance to several stresses (Leiser et al., 2015), and two other genes, K05B2.4 and sodh‐1, that we reveal here to be important for resistance to organic peroxide. Moreover, we find that nhr‐49 is also required for the induction of tBOOH‐induced genes by acute fasting. Collectively, our data suggest that, in addition to its role in regulating lipid metabolism, NHR‐49 participates in a cytoprotective acute stress response program that functions parallel to and independently of SKN‐1/Nrf2 and HLH‐30/TFEB signaling (Blackwell et al., 2015; Lapierre et al., 2013). This raises the possibility that NHR‐49's pro‐longevity function, for example in glp‐1 mutants (Ratnappan et al., 2014), may involve modulating both lipid metabolism and stress defenses (Figure 6).
Figure 6.
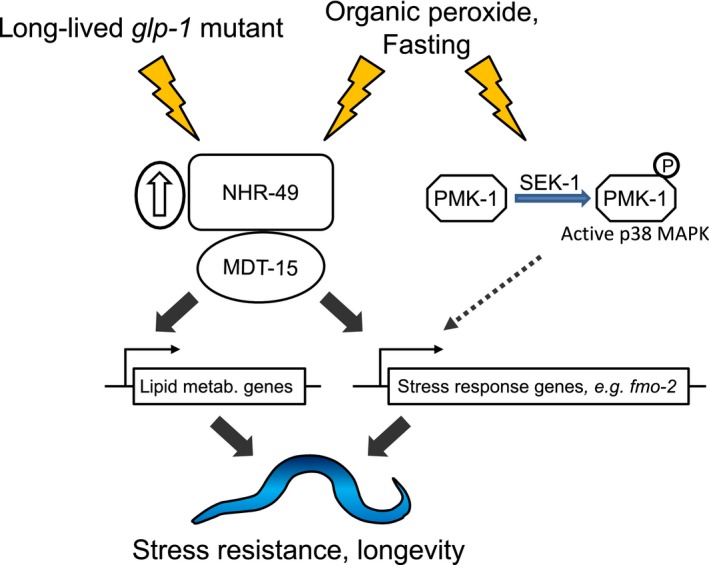
Model for NHR‐49 action in stress defense and longevity
NHR‐49 regulates transcription in response to fasting, to drive changes in lipid metabolism (Van Gilst, Hadjivassiliou & Yamamoto, 2005). Here, we report nhr‐49‐dependent expression of several fasting‐induced genes with pro‐survival/longevity functions that are not involved in lipid metabolism, including the glyoxylate cycle enzyme icl‐1, the oxidoreductase sodh‐1, and the flavin‐containing monooxygenase fmo‐2. Consistent with these findings, nhr‐49‐dependent induction of predicted detoxification genes was observed in another long‐lived state (Chamoli et al., 2014). This was ascribed to NHR‐49‐driven lipid metabolic reprogramming, but our findings suggest that these genes may contribute to NHR‐49's stress‐protective function. Indeed, we show that an NHR‐49‐dependently induced gene, K05B2.4, orthologous to important lipid metabolic enzymes, bile acid‐CoA: amino acid N‐acyltransferase (BAAT) and acyl‐CoA thioesterases (ACOT), is required for resistance to organic peroxide. Thus, by coordinately rewiring lipid and nonlipid metabolic processes, NHR‐49 and MDT‐15 may simultaneously allow robust fasting adaptation and promote stress resistance. If these dual functions are conserved, this has important implications for how metabolic changes, in response to diet, could affect cell/tissue stress defenses in mammals.
Transcriptome profiling showed that NHR‐49 regulates a substantial fraction, but not all of the genes induced by tBOOH in wild‐type; thus, other transcription factors are likely also important for tBOOH‐induced gene expression. Surprisingly, our analysis further revealed a large set of genes that is only weakly induced by tBOOH in wild‐type, but is hyperactivated in nhr‐49 mutants, suggesting a compensatory response in this strain incapable of mounting a normal tBOOH response (Figure 2b). In the future, it will be interesting to further dissect this response.
MDT‐15 is required as a coactivator for SKN‐1, promoting SKN‐1‐dependent gene expression and/or longevity in several contexts, for example in long‐lived glp‐1 mutants (Goh et al., 2014; Rogers et al., 2011; Wei & Kenyon, 2016). Thus, mdt‐15 may promote both NHR‐49 and SKN‐1‐dependent gene expression in germline‐deficient glp‐1 mutant animals, including different subsets of lipid metabolic and cytoprotective genes. Notably, although both transcription factors require MDT‐15, nhr‐49 does not activate arsenite‐responsive genes (Figure S2b) and skn‐1 is dispensable for most tBOOH‐induced gene expression (Oliveira et al., 2009). Thus, NHR‐49 and SKN‐1 are both important in stress conditions and in long‐lived glp‐1 mutants, but partner with MDT‐15 to coordinate expression of distinct gene sets that may be more important under particular conditions. For example, in long‐lived daf‐2/insulin receptor mutants, where skn‐1 is important, but nhr‐49 dispensable for the increase in lifespan (Ratnappan et al., 2014; Tullet et al., 2008), the requirement for mdt‐15 may exclusively reflect MDT‐15's function as a SKN‐1 coregulator (Goh et al., 2014).
Although NHR‐13, NHR‐66, and NHR‐80 heterodimerize with NHR‐49 (Pathare et al., 2012), these three NHRs were not required for tBOOH‐induced gene activation (Figure S2a). In the tBOOH and fasting response, NHR‐49 may instead homodimerize or partner with other NHRs. One candidate is NHR‐62, which is important for lifespan extension in the eat‐2 model of DR (Heestand et al., 2013). However, although fmo‐2 is induced by some DR feeding regimens (Leiser et al., 2015), it is not upregulated in eat‐2 mutants, and nhr‐49 is dispensable for the increased longevity of this mutant (Heestand et al., 2013). These studies suggest that NHR‐62 and NHR‐49 may act in parallel pro‐longevity pathways that are both regulated by nutrient availability and provide further evidence that different fasting/DR regimes evoke different pro‐longevity transcriptional responses involving different transcriptional regulators to extend lifespan (Greer & Brunet, 2009).
Our discovery that fasting and peroxide stresses activate a similar, NHR‐49‐dependent transcriptional response raised the possibility that in both cases, NHR‐49 might be regulated by a reactive oxygen metabolite. Hydrogen peroxide is likely increased upon fasting, potentially as a by‐product of increased fatty acid oxidation. Although it may cause oxidative damage, peroxide is also an established signaling molecule, regulating the activity of target proteins by oxidizing specific redox‐sensitive protein thiols (Veal, Day & Morgan, 2007). However, using the oxidation status of the peroxide‐sensitive peroxiredoxin‐2 as a readout (Oláhová et al., 2008), we could find no evidence that fasting increases peroxide levels (data not shown). Alternatively, lipid‐derived ligand(s), including oxidized molecules, may increase NHR‐49 activity, with exposure to organic peroxide or fasting both increasing the levels of such a lipid. A recent paper showed that linolenic acid, and an oxidized derivative thereof, regulate lifespan and gene expression in an nhr‐49‐dependent fashion (Qi et al., 2017). Although we note that fmo‐2 was not among the responsive genes (Qi et al., 2017), this nevertheless raises the possibility that similar molecules may be involved in the nhr‐49‐dependent stress adaptation mechanisms identified here.
Notably, our data suggest that NHR‐49 activity is increased in response to tBOOH by increasing NHR‐49 protein levels. In contrast to the increased NHR‐49 levels in glp‐1 mutants, which reflect DAF‐16‐ and TCER‐1‐dependent upregulation of nhr‐49 mRNA (Ratnappan et al., 2014), our data suggest that this increase does not reflect tBOOH‐induced increases in nhr‐49 mRNA levels (Figure S4d). It remains to be determined whether this is due to a general increase in NHR‐49 protein stability or specific increases in a particular isoform. However, the tBOOH‐induced increase in levels of a lower mobility NHR‐49 isoform suggests that increases in NHR‐49 levels/activity may involve tBOOH‐induced posttranslational modification(s). We note that NHR‐49 contains several candidate phosphorylation sites, some of which are phosphorylated in vivo (Bodenmiller et al., 2008). Moreover, phosphorylation regulates the activity of functionally related mammalian NHRs, for example PPARα (Burns & Vanden Heuvel, 2007). Hence, it is possible that tBOOH‐induced phosphorylation might stabilize NHR‐49 or direct its activity toward activating the expression of fmo‐2 and other stress‐induced genes. The p38 MAPK, PMK‐1, plays an important role in defending against oxidative stress and infectious microbes. For example, PMK‐1‐dependent phosphorylation is vital for the stress‐induced nuclear accumulation of SKN‐1 and activation of SKN‐1‐dependent gene expression (Inoue et al., 2005). Moreover, PMK‐1 is rapidly activated by phosphorylation by the SEK‐1 MAPKK in response to tBOOH (Inoue et al., 2005). However, although loss of sek‐1 and pmk‐1 reduced the tBOOH‐induced expression of fmo‐2 and two other nhr‐49‐dependent genes, tBOOH‐induced increases in NHR‐49 levels occurred in the absence of sek‐1. This suggests that, although SEK‐1 and PMK‐1 may act in parallel with NHR‐49 to promote tBOOH‐induced gene expression, other mechanisms, potentially involving other kinases, are responsible for increases in NHR‐49 levels.
In summary, we show that NHR‐49 acts with MDT‐15 to implement a stress‐protective transcriptional program in response to organic peroxide, fasting, and in long‐lived glp‐1 mutant worms. Future experiments will determine how fasting and oxidative stress regulate NHR‐49 and/or MDT‐15 to coordinate both changes in lipid metabolism and other protective adaptive changes in host metabolism. If related NHRs, PPARα and HNF4, play similar roles in protecting mammalian cells under stress conditions, then this may have implications for efforts to therapeutically target these NHRs to treat age‐related diseases such as metabolic diseases and cancer.
4. EXPERIMENTAL PROCEDURES
4.1. Nematode strains and growth conditions
We cultured C. elegans strains using standard techniques. To avoid background effects, each mutant was crossed into our N2 strain; original mutants were backcrossed to N2 at least six times. E. coli OP50 was the food source in all qPCR and RNA‐seq experiments except in Figure 3b, all population stress resistance experiments (tBOOH and starvation assays; Figure 5), and for the initial characterization of the fmo‐2p::gfp reporter (Figures 1b and S1b); for all other experiments, we used E. coli HT115 as food source. All experiments were carried out at 20°C, except experiments with strains harboring the glp‐1(e2141) mutation; these strains and pertinent controls were grown at 25°C until the L4 stage to induce germline loss, and then downshifted to 20°C. Worm strains used in this study are listed in Table S13.
We used standard genetic crossing techniques to attempt to construct the nhr‐49(nr2041); hlh‐30(tm1978) double mutant; genotyping the clonal progeny of 100 individual candidate F2 worms did not reveal any homozygous double mutants, suggesting that these null mutations cause synthetic lethality.
For experiments on media containing exogenous stressors, sodium meta‐arsenite (Sigma 71287) and tert‐butyl hydroperoxide solution (tBOOH; Sigma 458139), DTT, and H2O2 were added at indicated concentrations. Plates containing tBOOH were made fresh on the day of use. For the RNAi candidate screen, we used 10 mm tBOOH and a 3‐hr exposure as these conditions resulted in strong and uniform GFP induction throughout the worm population. For qPCR and RNA‐seq experiments, we used 7.5 mm tBOOH exposure for 4 hr, consistent with our previous study (Goh et al., 2014). For stress resistance assays, we found that resolution of population death events was improved using 6 mm tBOOH and hence used this concentration.
For synchronized worm growths, bleached embryos were hatched overnight on unseeded NGM plates, or 20–25 L4 stage worms were transferred and maintained on feeding plates until the population reached a synchronized halted development at L1 stage via short‐term fasting (12–24 hr). Synchronized L1 stage larvae were subsequently transferred to feeding plates, seeded with OP50 or HT115 containing the indicated RNAi vector, and then grown to the desired stage.
4.2. Feeding RNA interference
RNAi was performed on nematode growth media (NGM) plates supplemented with either 25 μg/ml carbenicillin or 100 μg/ml ampicillin, 1 mm IPTG, and 12.5 μg/ml tetracycline and seeded with appropriate HT115 RNAi bacteria. The RNAi clones were from the Ahringer (Source BioScience) or Vidal library except those listed in Table S14.
4.3. Construction of the fmo‐2p::gfp transgenic reporter strain
A 1584‐bp genomic fragment of the putative fmo‐2 promoter was PCR‐amplified with the primers (Pfmo‐2Fwd = 5′CCCATGACTGCAGGTGCAGAAGTAAGATATTGCA and Pfmo‐2Rev = 5′CCCGCTACCCGGGACGGTAATCCAGAAGCACCA, pPD95.67 + Pfmo‐2 Rev = 5′CGGTACCTCCCTCCAAGGGTCCTC; Pst1 and Cfr91 sites used for cloning underlined), sequenced, and cloned into pPD95.67 using Pst1 and Cfr91 sites. This generates a transgene containing 1,536 bp of DNA upstream of the fmo‐2 ORF and the first 16 codons of FMO‐2 fused in frame to GFP containing a nuclear localization signal (pPD95.67 + fmo‐2p). We then microinjected into N2 worms 50 ng/μl pPD95.67 + fmo‐2p, 100 ng/μl of pRF4 rol‐6(su1006) co‐injection marker, and 50 ng/μl pBluescript carrier DNA. Two independently generated lines were selected using the roller phenotype. Both lines showed similar expression patterns and induction by tBOOH (data not shown).
4.4. RNA isolation and qPCR analysis
RNA isolation was performed essentially as described (Goh et al., 2014). 2 μg total RNA were used to generate cDNA with Superscript II reverse transcriptase (Invitrogen 18064‐014), random primers (Invitrogen 48190‐011), dNTPs (Fermentas R0186), and RNAseOUT (Invitrogen 10777‐019). qPCR was performed in 30 μl reactions using Fast SYBR Master Mix (Life Technologies 4385612) and an Applied Biosystems StepOnePlus machine. We analyzed data with the ΔΔCt method. For each sample, we calculated normalization factors by averaging the (sample expression)/(reference expression) ratios of three normalization genes, act‐1, tba‐1, and ubc‐2 (except without tba‐1 in glp‐1 mutants, which display inherently low tba‐1 levels). The reference sample was control(RNAi), WT, or untreated, as appropriate, and all data are represented as mean ± SEM. We used unpaired Student's t tests to calculate statistical significance of gene expression changes and corrected for multiple comparisons using the Holm–Sidak method. Primers were tested on serial cDNA dilutions and analyzed for PCR efficiency prior to use. All data originate from three or more independent biological repeats, and each experiment was conducted in technical triplicate. Sequences of primers used are listed in Table S15.
4.5. Analysis of gene expression overlaps
Gene expression overlaps were identified using the Microsoft Excel 2011 ISNA (MATCH(lookup_value, lookup_array, [match_type])) function. Statistical significance was calculated using Fisher's exact test from the R Stats Package in RStudio version 0.98. We compared sets of genes regulated in fasted worms (Uno et al., 2013), tBOOH‐treated worms (Oliveira et al., 2009), and glp‐1(bn18) mutants (Steinbaugh et al., 2015).
4.6. RNA‐seq
L4 stage N2 and nhr‐49(nr2041) worms were exposed to 7.5 mm tBOOH for 4 hr. RNA was extracted with TRIzol and ribosomal RNA removed using the RiboGone–Mammalian—Low Input Ribosomal RNA Removal Kit for Human, Mouse and Rat Samples (Takara #634847). Ribosomal RNA depletion and RNA integrity were verified on a Bioanalyzer with the RNA 6000 Pico Kit (Agilent #5067‐1513). We constructed cDNA libraries with the SMARTer Universal Low Input RNA Kit (Takara #634900) and measured adapter‐ligated concentrations with the High Sensitivity DNA Analysis Kit (Agilent #5067‐4626) and by qPCR standard‐curve quantitation using the KAPA Library Quantification Kit Illumina Platforms (KK4824). Next‐generation sequencing was performed on an Illumina NextSeq 500 using 76 bp x2 paired‐end reads, using the NextSeq 500/550 High Output Kit v2 (150 cycles). Single‐end reads were aligned to the C. elegans UCSC ce10 reference genome using an RNA‐seq alignment app from Illumina, which uses STAR aligner to map reads. Then, we used edgeR (Robinson, McCarthy & Smyth, 2010) to convert raw gene counts into counts per million (CPM) and log2‐counts per million (log‐CPM). Weakly expressed genes were removed by only including genes with counts per million (CPM) >1 across two libraries. Gene expression distributions were normalized by the method of trimmed mean of M‐values (TMM) (Robinson & Oshlack, 2010). We used the edgeR exact test to test for differential expression between different conditions. We searched for differentially expressed genes using Top Tags in edgeR with log‐fold change of (+2) and FDR <0.05 cutoffs and identified 250 genes that were induced by tBOOH in wild‐type worms. We then obtained log‐CPM values for genes in this set from all eight libraries, corresponding to two replicates of wild‐type worms and nhr‐49(nr2041) mutants −/+ tBOOH (Tables S3 and S4), and used FDR <0.05 cutoffs to define NHR‐49‐dependent genes within this set (Tables S3 and S4). We used the heatmap.2 function to generate a heatmap of these 250 genes using log‐CPM values. Expression across each gene was scaled to generate a z‐score. In Figure 2b, genes were ordered from highest to lowest difference in z‐score between N2 + tBOOH and nhr‐49 + tBOOH samples. RNA‐seq raw data have been deposited at Gene Expression Omnibus (GSE107799).
4.7. DIC and fluorescence microscopy
Worms were transferred onto M9 buffer containing 0.06% levamisole (Sigma L9756) or sodium azide for immobilization on 2%–2.5% (w/v) agarose pads for microscopy. We captured images either on a CoolSnap HQ camera (Photometrics) attached to a Zeiss Axioplan 2 compound microscope, followed by MetaMorph Imaging Software with Autoquant 3D digital deconvolution; or using a Zeiss Axioskop 2 compound microscope, an Axiocam, and AxioVision software (version 3.1.2.1).
4.8. Stress resistance assays
To quantify tBOOH resistance in a population, animals were grown to the late L4 stage and then transferred to plates containing 6 mm tBOOH seeded with heat‐inactivated OP50. Animals that crawled off the plate or died due to rupturing or internal hatching were censored. We used GraphPad Prism 6 to generate survival curves and calculated statistical significance using the log‐rank (Mantel–Cox) test. For each individual experiment, we performed three to four independent biological replicates, and one repeat is shown in a figure panel; for this and all other repeats, experimental parameters and statistics are listed in the Supplementary information, as indicated in figure legends. For experiments with nhr‐49p::nhr‐49::gfp and nhr‐49(et13) worms, we additionally performed Cox's regression analysis to test the statistical significance of differences between the survival of transgenic/mutant and control worms across all biological repeats (Tables S7 and S8).
Starvation survival assays were adapted from (Lee & Ashrafi, 2008). Worms were maintained for at least two generations in a nonstarved state and synchronized to obtain day 1 adults. Adults were then bleached to obtain embryos that were hatched in S‐basal medium without cholesterol overnight on a rotator. Synchronized L1s were transferred to S‐basal medium without cholesterol containing an antibiotic–antimycotic mix (Gibco 15240062) at a concentration of ~1 worm/μl. To assess viability, 200–300 animals were transferred to seeded NGM plates every 2–3 days and assessed for growth to the L4 stage after 48 hr. Average survival and standard error of four independent biological repeats are shown in Figure 5b; statistical significance was calculated using area under the curve and Student's t test.
4.9. SDS–PAGE and immunoblotting
4.9.1. Analysis of NHR‐49 + GFP levels
A total of 2,000–3,000 synchronized young adult worms, maintained on E. coli HT115‐seeded plates, were washed off (Figures 4b and S4b,c), or 50 synchronized RFP+ or control young adult worms were picked off (Figure S4e,f) E. coli HT115‐seeded plates into M9 or M9 containing the indicated stress agent (Figures 4 and S4e,f). After the indicated time, an equal volume of ice‐cold 20% (v/v) tri‐chloro acetic acid (TCA; Sigma T6399) was added to precipitate proteins. Pelleted proteins were washed with ice‐cold acetone before being air‐dried and resuspended in TCA buffer (1.0% SDS (v/v), 100 mm Tris–HCl pH 8.0, 1.0 mm EDTA (Sigma E6758) + 20 mm N‐ethylmaleimide (Sigma E3876)). The suspension was then incubated for 30 min at 25°C followed by 5 min at 30°C. Insoluble materials were pelleted by centrifugation. The concentration of denatured proteins in the supernatant was determined using the BCA Protein Assay Kit (Thermo Scientific 23225), and equal amounts of protein were separated by SDS–PAGE and immunoblotted using the appropriate antibodies in conjunction with the ECL Plus Western Blotting Substrate (Thermo Scientific 32132) and a Typhoon Phosphoimager. NHR‐49::GFP levels were determined relative to tubulin to account for any differences in loading.
4.9.2. Analysis of PMK‐1 phosphorylation
A total of 3,000 synchronized late L4 animals were washed from plates with M9 or M9 containing 10 mm tBOOH, incubated for 10 min with gentle agitation, and then harvested by centrifugation and levels of PMK‐1 phosphorylation determined as described previously (Oláhová et al., 2008).
4.10. Antibodies
All antibodies were diluted in 1× Tris buffer saline Tween 20 (TBST; 20.0 mm Tris–HCl pH 7.6, 137 mm NaCl, 0.1% Tween 20 (v/v) containing 5% bovine serum album). Anti‐GFP (A6455, Life Technologies), anti‐phosphop38 antibodies (New England Biolabs), and anti‐β‐tubulin (E7, Developmental Studies Hybridoma Bank University of Iowa) antibodies were used at 1:1,000 dilutions. Horseradish peroxidase (HRP)‐conjugated secondary anti‐mouse IgG and anti‐rabbit IgG antibodies were used at 1:2,000.
CONFLICT OF INTEREST
None declared.
AUTHORS' CONTRIBUTION
EAV and ST conceptualized the study; GYSG, JJW, EAV, KRSD, FB, RL, and KL investigated the study; ST and EAV wrote the original draft; ST, EAV, GG, and JJW wrote the manuscript and helped in reviewing and editing the manuscript; EAV and ST acquired funding; EAV and ST supervised the experiments.
Supporting information
ACKNOWLEDGMENTS
Some strains were provided by the CGC, which is funded by NIH Office of Research Infrastructure Programs (P40 OD010440). We thank the Taubert laboratory, Frédéric Picard (Universite Laval), and Antonio Miranda‐Vizuete (Instituto de Biomedicina de Sevilla) for comments, and Michelle Wray for technical assistance. We also thank Michelle Ying Ya Lee, Emma Graham, and Sara Mostafavi (UBC) for help with RNA‐seq data analysis. Grant support was from CIHR (PJT‐153199 to ST), NSERC (RGPIN 386398‐13 to ST), MRC (to EAV), and the NIHR Newcastle Biomedical Research Centre (JJW). GYSG was supported by BCCHR and UBC Scholarships, KL and KRSD by NSERC CGS‐M Scholarships, RL by an NSERC‐USRA Studentship, and ST by a Canada Research Chair.
Goh GYS, Winter JJ, Bhanshali F, et al. NHR‐49/HNF4 integrates regulation of fatty acid metabolism with a protective transcriptional response to oxidative stress and fasting. Aging Cell. 2018;17:e12743 10.1111/acel.12743
Contributor Information
Elizabeth A. Veal, Email: e.a.veal@ncl.ac.uk.
Stefan Taubert, Email: taubert@cmmt.ubc.ca.
REFERENCES
- Bennett, C. F. , Kwon, J. J. , Chen, C. , Russell, J. , Acosta, K. , Burnaevskiy, N. , … Kaeberlein, M. (2017). Transaldolase inhibition impairs mitochondrial respiration and induces a starvation‐like longevity response in Caenorhabditis elegans. C. T. Murphy, ed. PLoS Genetics, 13, e1006695 10.1371/journal.pgen.1006695 [DOI] [PMC free article] [PubMed] [Google Scholar]
- Blackwell, T. K. , Steinbaugh, M. J. , Hourihan, J. M. , Ewald, C. Y. , & Isik, M. (2015). SKN‐1/Nrf, stress responses, and aging in Caenorhabditis elegans . Free Radical Biology and Medicine, 88, 290–301. 10.1016/j.freeradbiomed.2015.06.008 [DOI] [PMC free article] [PubMed] [Google Scholar]
- Bodenmiller, B. , Campbell, D. , Gerrits, B. , Lam, H. , Jovanovic, M. , Picotti, P. , … Aebersold, R. (2008). PhosphoPep–a database of protein phosphorylation sites in model organisms. Nature Biotechnology, 26, 1339–1340. 10.1038/nbt1208-1339 [DOI] [PMC free article] [PubMed] [Google Scholar]
- Burkewitz, K. , Morantte, I. , Weir, H. J. M. , Yeo, R. , Zhang, Y. , Huynh, F. K. , … Mair, W. B. (2015). Neuronal CRTC‐1 governs systemic mitochondrial metabolism and lifespan via a catecholamine signal. Cell, 160, 842–855. 10.1016/j.cell.2015.02.004 [DOI] [PMC free article] [PubMed] [Google Scholar]
- Burns, K. A. , & Vanden Heuvel, J. P. (2007). Modulation of PPAR activity via phosphorylation. Biochimica et Biophysica Acta, 1771, 952–960. 10.1016/j.bbalip.2007.04.018 [DOI] [PMC free article] [PubMed] [Google Scholar]
- Chamoli, M. , Singh, A. , Malik, Y. , & Mukhopadhyay, A. (2014). A novel kinase regulates dietary restriction‐mediated longevity in Caenorhabditis elegans . Aging Cell, 13, 641–655. 10.1111/acel.12218 [DOI] [PMC free article] [PubMed] [Google Scholar]
- Folick, A. , Oakley, H. D. , Yu, Y. , Armstrong, E. H. , Kumari, M. , Sanor, L. , … Wang, M. C. (2015). Aging. Lysosomal signaling molecules regulate longevity in Caenorhabditis elegans . Science, 347, 83–86. 10.1126/science.1258857 [DOI] [PMC free article] [PubMed] [Google Scholar]
- Goh, G. Y. S. , Martelli, K. L. , Parhar, K. S. , Kwong, A. W. L. , Wong, M. A. , Mah, A. , … Taubert, S. (2014). The conserved mediator subunit MDT‐15 is required for oxidative stress responses in Caenorhabditis elegans . Aging Cell, 13, 70–79. 10.1111/acel.12154 [DOI] [PMC free article] [PubMed] [Google Scholar]
- Greer, E. L. , & Brunet, A. (2009). Different dietary restriction regimens extend lifespan by both independent and overlapping genetic pathways in Caenorhabditis elegans . Aging Cell, 8, 113–127. 10.1111/j.1474-9726.2009.00459.x [DOI] [PMC free article] [PubMed] [Google Scholar]
- Heestand, B. N. , Shen, Y. , Liu, W. , Magner, D. B. , Storm, N. , Meharg, C. , … Antebi, A. (2013). Dietary restriction induced longevity is mediated by nuclear receptor NHR‐62 in Caenorhabditis elegans . PLoS Genetics, 9, e1003651 10.1371/journal.pgen.1003651 [DOI] [PMC free article] [PubMed] [Google Scholar]
- Hekimi, S. , Lapointe, J. , & Wen, Y. (2011). Taking a “good look” at free radicals in the aging process. Trends in Cell Biology, 21, 569–576. 10.1016/j.tcb.2011.06.008 [DOI] [PMC free article] [PubMed] [Google Scholar]
- Hetz, C. , Chevet, E. , & Harding, H. P. (2013). Targeting the unfolded protein response in disease. Nature Reviews. Drug Discovery, 12, 703–719. 10.1038/nrd3976 [DOI] [PubMed] [Google Scholar]
- Inoue, H. , Hisamoto, N. , An, J. H. , Oliveira, R. P. , Nishida, E. , Blackwell, T. K. , & Matsumoto, K. (2005). The Caenorhabditis elegans p38 MAPK pathway regulates nuclear localization of the transcription factor SKN‐1 in oxidative stress response. Genes & Development, 19, 2278–2283. 10.1101/gad.1324805 [DOI] [PMC free article] [PubMed] [Google Scholar]
- Khan, M. H. , Ligon, M. , Hussey, L. R. , Hufnal, B. , Farber, R. , Munkácsy, E. , … Rea, S. L. (2013). TAF‐4 is required for the life extension of isp‐1, clk‐1 and tpk‐1 Mit mutants. Aging, 5, 741–758. https://doi.org/10.18632/aging.100604 [DOI] [PMC free article] [PubMed] [Google Scholar]
- Lapierre, L. R. , De Magalhaes Filho, C. D. , McQuary, P. R. , Chu, C.‐C. , Visvikis, O. , Chang, J. T. , … Hansen, M. (2013). The TFEB orthologue HLH‐30 regulates autophagy and modulates longevity in Caenorhabditis elegans . Nature Communications, 4, 2267. [DOI] [PMC free article] [PubMed] [Google Scholar]
- Lee, B. H. , & Ashrafi, K. (2008). A TRPV channel modulates Caenorhabditis elegans neurosecretion, larval starvation survival, and adult lifespan. PLoS Genetics, 4, e1000213. [DOI] [PMC free article] [PubMed] [Google Scholar]
- Lee, K. , Goh, G. Y. S. , Wong, M. A. , Klassen, T. L. , & Taubert, S. (2016). Gain‐of‐function alleles in Caenorhabditis elegans nuclear hormone receptor nhr‐49 are functionally distinct. PLoS ONE, 11, e0162708 10.1371/journal.pone.0162708 [DOI] [PMC free article] [PubMed] [Google Scholar]
- Leiser, S. F. , Miller, H. , Rossner, R. , Fletcher, M. , Leonard, A. , Primitivo, M. , … Kaeberlein, M. (2015). Cell nonautonomous activation of flavin‐containing monooxygenase promotes longevity and health span. Science, 350, 1375–1378. 10.1126/science.aac9257 [DOI] [PMC free article] [PubMed] [Google Scholar]
- Leprivier, G. , Rotblat, B. , Khan, D. , Jan, E. , & Sorensen, P. H. (2015). Stress‐mediated translational control in cancer cells. Biochimica et Biophysica Acta, 1849, 845–860. 10.1016/j.bbagrm.2014.11.002 [DOI] [PubMed] [Google Scholar]
- Lin, M. T. , & Beal, M. F. (2006). Mitochondrial dysfunction and oxidative stress in neurodegenerative diseases. Nature, 443, 787–795. 10.1038/nature05292 [DOI] [PubMed] [Google Scholar]
- Miranda‐Vizuete, A. , & Veal, E. A. (2016). Caenorhabditis elegans as a model for understanding ROS function in physiology and disease. Redox Biology, 11, 708–714. [DOI] [PMC free article] [PubMed] [Google Scholar]
- Nakamura, S. , Karalay, Ö. , Jäger, P. S. , Horikawa, M. , Klein, C. , Nakamura, K. , … Antebi, A. (2016). Mondo complexes regulate TFEB via TOR inhibition to promote longevity in response to gonadal signals. Nature Communications, 7, 10944 10.1038/ncomms10944 [DOI] [PMC free article] [PubMed] [Google Scholar]
- Oláhová, M. , Taylor, S. R. , Khazaipoul, S. , Wang, J. , Morgan, B. A. , Matsumoto, K. , … Veal, E. A. (2008). A redox‐sensitive peroxiredoxin that is important for longevity has tissue‐ and stress‐specific roles in stress resistance. Proceedings of the National Academy of Sciences of the United States of America, 105, 19839–19844. 10.1073/pnas.0805507105 [DOI] [PMC free article] [PubMed] [Google Scholar]
- Oliveira, R. P. , Abate, J. P. , Dilks, K. , Landis, J. , Ashraf, J. , Murphy, C. T. , & Blackwell, T. K. (2009). Condition‐adapted stress and longevity gene regulation by Caenorhabditis elegans SKN‐1/Nrf. Aging Cell, 8, 524–541. 10.1111/j.1474-9726.2009.00501.x [DOI] [PMC free article] [PubMed] [Google Scholar]
- O'Rourke, E. J. , & Ruvkun, G. (2013). MXL‐3 and HLH‐30 transcriptionally link lipolysis and autophagy to nutrient availability. Nature Cell Biology, 15, 668–676. 10.1038/ncb2741 [DOI] [PMC free article] [PubMed] [Google Scholar]
- Pathare, P. P. , Lin, A. , Bornfeldt, K. E. , Taubert, S. , & Van Gilst, M. R. (2012). Coordinate regulation of lipid metabolism by novel nuclear receptor partnerships K. Ashrafi, ed. PLoS Genetics, 8, e1002645 10.1371/journal.pgen.1002645 [DOI] [PMC free article] [PubMed] [Google Scholar]
- Powell‐Coffman, J. A. (2010). Hypoxia signaling and resistance in Caenorhabditis elegans . Trends in Endocrinology and Metabolism, 21, 435–440. 10.1016/j.tem.2010.02.006 [DOI] [PubMed] [Google Scholar]
- Qi, W. , Gutierrez, G. E. , Gao, X. , Dixon, H. , McDonough, J. A. , Marini, A. M. , & Fisher, A. L. (2017). The ω‐3 fatty acid α‐linolenic acid extends Caenorhabditis elegans lifespan via NHR‐49/PPARα and oxidation to oxylipins. Aging Cell, 16, 1125–1135. 10.1111/acel.12651 [DOI] [PMC free article] [PubMed] [Google Scholar]
- Rankin, E. B. , & Giaccia, A. J. (2016). Hypoxic control of metastasis. Science, 352, 175–180. 10.1126/science.aaf4405 [DOI] [PMC free article] [PubMed] [Google Scholar]
- Ratnappan, R. , Amrit, F. R. G. , Chen, S.‐W. , Gill, H. , Holden, K. , Ward, J. , … Ghazi, A. (2014). Germline signals deploy NHR‐49 to modulate fatty‐acid β‐oxidation and desaturation in somatic tissues of Caenorhabditis elegans . PLoS Genetics, 10, e1004829 10.1371/journal.pgen.1004829 [DOI] [PMC free article] [PubMed] [Google Scholar]
- Robinson, M. D. , McCarthy, D. J. , & Smyth, G. K. (2010). edgeR: A Bioconductor package for differential expression analysis of digital gene expression data. Bioinformatics, 26, 139–140. 10.1093/bioinformatics/btp616 [DOI] [PMC free article] [PubMed] [Google Scholar]
- Robinson, M. D. , & Oshlack, A. (2010). A scaling normalization method for differential expression analysis of RNA‐seq data. Genome Biology, 11, R25 10.1186/gb-2010-11-3-r25 [DOI] [PMC free article] [PubMed] [Google Scholar]
- Rogers, A. N. , Chen, D. , Mccoll, G. , Czerwieniec, G. , Felkey, K. , Gibson, B. W. , … Kapahi, P. (2011). Life span extension via eIF4G inhibition is mediated by posttranscriptional remodeling of stress response gene expression in Caenorhabditis elegans . Cell Metabolism, 14, 55–66. 10.1016/j.cmet.2011.05.010 [DOI] [PMC free article] [PubMed] [Google Scholar]
- Seah, N. E. , De Magalhaes Filho, C. D. , Petrashen, A. P. , Henderson, H. R. , Laguer, J. , Gonzalez, J. , … Lapierre, L. R. (2016). Autophagy‐mediated longevity is modulated by lipoprotein biogenesis. Autophagy, 12, 261–272. 10.1080/15548627.2015.1127464 [DOI] [PMC free article] [PubMed] [Google Scholar]
- Shore, D. E. , & Ruvkun, G. (2013). A cytoprotective perspective on longevity regulation. Trends in Cell Biology, 23, 409–420. 10.1016/j.tcb.2013.04.007 [DOI] [PMC free article] [PubMed] [Google Scholar]
- Steinbaugh, M. J. , Narasimhan, S. D. , Robida‐Stubbs, S. , Moronetti Mazzeo, L. E. , Dreyfuss, J. M. , Hourihan, J. M. , … Blackwell, T. K. (2015). Lipid‐mediated regulation of SKN‐1/Nrf in response to germ cell absence. Elife, 4, e07836. [DOI] [PMC free article] [PubMed] [Google Scholar]
- Taubert, S. , Hansen, M. , Van Gilst, M. R. , Cooper, S. B. , & Yamamoto, K. R. (2008). The mediator subunit MDT‐15 confers metabolic adaptation to ingested material. PLoS Genetics, 4, e1000021. [DOI] [PMC free article] [PubMed] [Google Scholar]
- Taubert, S. , Van Gilst, M. R. , Hansen, M. , & Yamamoto, K. R. (2006). A mediator subunit, MDT‐15, integrates regulation of fatty acid metabolism by NHR‐49‐dependent and ‐independent pathways in Caenorhabditis elegans . Genes & Development, 20, 1137–1149. 10.1101/gad.1395406 [DOI] [PMC free article] [PubMed] [Google Scholar]
- Tullet, J. M. A. , Hertweck, M. , An, J. H. , Baker, J. , Hwang, J. Y. , Liu, S. , … Blackwell, T. K. (2008). Direct inhibition of the longevity‐promoting factor SKN‐1 by insulin‐like signaling in Caenorhabditis elegans . Cell, 132, 1025–1038. 10.1016/j.cell.2008.01.030 [DOI] [PMC free article] [PubMed] [Google Scholar]
- Uno, M. , Honjoh, S. , Matsuda, M. , Hoshikawa, H. , Kishimoto, S. , Yamamoto, T. , … Nishida, E. (2013). A fasting‐responsive signaling pathway that extends life span in Caenorhabditis elegans . Cell Reports, 3, 79–91. 10.1016/j.celrep.2012.12.018 [DOI] [PubMed] [Google Scholar]
- Van Gilst, M. R. , Hadjivassiliou, H. , Jolly, A. , & Yamamoto, K. R. (2005). Nuclear hormone receptor NHR‐49 controls fat consumption and fatty acid composition in Caenorhabditis elegans . PLoS Biology, 3, e53 10.1371/journal.pbio.0030053 [DOI] [PMC free article] [PubMed] [Google Scholar]
- Van Gilst, M. R. , Hadjivassiliou, H. , & Yamamoto, K. R. (2005). A Caenorhabditis elegans nutrient response system partially dependent on nuclear receptor NHR‐49. Proceedings of the National Academy of Sciences of the United States of America, 102, 13496–13501. 10.1073/pnas.0506234102 [DOI] [PMC free article] [PubMed] [Google Scholar]
- Veal, E. A. , Day, A. M. , & Morgan, B. A. (2007). Hydrogen peroxide sensing and signaling. Molecular Cell, 26, 1–14. 10.1016/j.molcel.2007.03.016 [DOI] [PubMed] [Google Scholar]
- Wei, Y. , & Kenyon, C. (2016). Roles for ROS and hydrogen sulfide in the longevity response to germline loss in Caenorhabditis elegans . Proceedings of the National Academy of Sciences of the United States of America, 113, E2832–E2841. 10.1073/pnas.1524727113 [DOI] [PMC free article] [PubMed] [Google Scholar]
- Wu, C.‐W. , Deonarine, A. , Przybysz, A. , Strange, K. , & Choe, K. P. (2016). The Skp1 homologs SKR‐1/2 are required for the Caenorhabditis elegans SKN‐1 antioxidant/detoxification response independently of p38 MAPK. PLoS Genetics, 12, e1006361 10.1371/journal.pgen.1006361 [DOI] [PMC free article] [PubMed] [Google Scholar]
Associated Data
This section collects any data citations, data availability statements, or supplementary materials included in this article.
Supplementary Materials