Abstract
Tuberculosis (Tb) is an airborne infectious disease caused by Mycobacterium tuberculosis. Beta-carbonic anhydrase 1 (β-CA1) has emerged as one of the potential targets for new antitubercular drug development. In this work, three-dimensional quantitative structure–activity relationships (3D-QSAR), molecular docking, and molecular dynamics (MD) simulation approaches were performed on a series of natural and synthetic phenol-based β-CA1 inhibitors. The developed 3D-QSAR model (r2 = 0.94, q2 = 0.86, and pred_r2 = 0.74) indicated that the steric and electrostatic factors are important parameters to modulate the bioactivity of phenolic compounds. Based on this indication, we designed 72 new phenolic inhibitors, out of which two compounds (D25 and D50) effectively stabilized β-CA1 receptor and, thus, are potential candidates for new generation antitubercular drug discovery program.
Electronic supplementary material
The online version of this article (10.1007/s13205-018-1278-z) contains supplementary material, which is available to authorized users.
Keywords: β-Carbonic anhydrase 1, Docking, QSAR, MD simulation, M. Tuberculosis
Introduction
Tuberculosis (Tb) is a highly contagious bacterial disease caused by Mycobacterium Tuberculosis (M.tb) (Clark-Curtiss and Haydel 2003; Smith 2003). The lung is the primary target of M.tb; however, other parts of the human body, viz., bones, brain, urinary tracts, and lymph nodes are also being hit and affected by this bacterium (Ahamad et al. 2017). Even though medical science has made an enormous advancement and many chemotherapeutic agents are available along with palliative care; this disease is still causing a significant number of mortality and morbidity across the globe, especially in the developing and under-developed countries. For example, approximately 10.4 million people infected while 1.8 million people died worldwide in 2017 from this infectious disease (Centis et al. 2017; Becerra et al. 2011). Adding to this, one out of four persons is infected with the one or more forms of Tb, such as multidrug-resistant Tb (MDR-Tb) and extensive drug-resistant Tb (XDR-Tb), which is caused due to incorrect treatment or by genetic mutation (Caminero et al. 2010; Gandhi et al. 2010). These issues prompted researchers to develop new drugs with unique and effective mechanism of action.
Beta-carbonic anhydrase 1 (β-CA1, EC 4.2.1.1, Rv1284) is a Zn2+ containing metalloenzyme that catalyses the reversible hydration of carbon dioxide (CO2) to produce bicarbonate (HCO3−) and a proton (H+) and helps in intermediary metabolism/respiration (Davis et al. 2011). The active site of β-CA1 is composed of Cys35, Asp37, His88, and Cys91 residue coordinated to a zinc ion. It has been demonstrated that β-CA1 is often up-regulated in pathogenic organisms (viz., such as bacteria and fungi) and serve as an excellent biomarker/target (Innocenti et al. 2009). Therefore, β-CA1 emerged as a potential target to circumvent and control the casualties caused by different strains of M.tb. In the literature, several classes of molecules, viz., sulfanilamides, benzolamides, carbamates, dithiocarbamates, phenolics, etc. have been reported with β-CA1 inhibitory activity (Aspatwar et al. 2017; Maresca et al. 2013; Buchieri et al. 2013). Among these, phenolics have attracted a particular interest due its rich availability in nature (such as in turmeric, cinnamon, tea leaves, fruits, vegetables, etc.) (Huang et al. 2009) and easy laboratory synthesis (Hoarau and Pettus 2003; Sweeney 1997). Furthermore, unique biological propensity and diverse biological activities such as antioxidant, antibacterial, antifungal, anticancer, etc. of phenolic compounds are also note worthy (Ambriz-Pérez et al. 2016; Anantharaju et al. 2016; George and Mabon 2000; Hanson et al. 2002). These features are inarguably due to the presence of one or more hydroxyl functionality, which has potential to donate hydrogen, and abstract-free radical, coordinate with metal ions and amino acids (Del Prete et al. 2017; Hoffmann et al. 2014; Duthie et al. 2000; Umar Lule and Xia 2005). In the context of β-CA1 inhibitory activity, it has been demonstrated that a subtle change in the core structure of phenolic compound leads to a significant change in the activity of β-CA1 enzyme (Davis et al. 2011; Buchieri et al. 2013). Davis and co-workers investigated a number of phenol-based β-CAs inhibitors (Davis et al. 2011). Some of the compounds displayed high selectivity for β-CAs over α-CA enzyme, which is very rare among non-sulfonamides. This work strongly supported the fact that phenolic compounds could serve as an excellent fragment/starting point for the development of selective β-CA1 inhibitors. However, synthesis and biological screening of compounds in lab are a tedious, time-consuming and cost-ineffective job, and require a sound coordination between medicinal chemists and biologists. Therefore, it is highly desirable and demanding to develop alternate method/technique to screen newly designed drugs in cost and time effective way. In this quest, computational techniques have emerged as excellent methods are being used worldwide, especially in the areas of drug designing (Faizi et al. 2018; Haque et al. 2017a). Recently, Cau and co-workers employed MD simulation techniques to investigate the structural features/requirement important for the inhibition of β-CAs by phenolic acids and related esters (Cau et al. 2016). They showed that some of the compounds inhibit the activity of CA by interfering with the nucleophilic attack of the metal ion on the substrate.
Inspired from these, we decided to carry out three-dimensional quantitative structure activity relationships (3D-QSAR), molecular docking, and MD simulation studies of 22 phenolics compounds endowed with activity against Rv1284 of β-CA1. The developed 3D-QSAR model (r2 = 0.94, q2 = 0.86 and pred_r2 = 0.74) indicated the importance of steric and electrostatic factors required for the activity, leading to the designing of 72 new phenolic inhibitors. Results of the docking studies and MD simulations corroborate each other. Two new derivatives (D25 and D50) were found to be most potent inhibitor that effectively stabilized β-CA1 receptor. The results of the study are presented herein.
Materials and methods
Compounds selection and structure preparation
Compounds used in this study shown in (Chart S1) along with their biological data (Table 1) were taken from earlier published work (Davis et al. 2011), whereas 1–13 (Chat S1) was of natural origin, compounds 14–21 (Chart S1) were of synthetic origin. The 2D chemical structure of the compounds was drawn and converted to 3D using ChemDBS module within software package VLife_MDS 3.5(VLife).
Table 1.
Library of natural and synthetic phenolic compounds used in this study along with its antibacterial activities
| Compound s. no. | Ki (µM)* | pKi | Predicted value | Residual value |
|---|---|---|---|---|
| 1a | 0.85 | 0.071 | 0.014 | − 0.057 |
| 2 | 10.8 | − 1.033 | − 1.106 | − 0.073 |
| 3 | 0.85 | 0.071 | 0.244 | 0.173 |
| 4a | 10.3 | − 1.013 | − 0.617 | 0.396 |
| 5 | 10.5 | − 1.021 | − 0.882 | 0.139 |
| 6a | 0.84 | 0.076 | − 0.065 | − 0.141 |
| 6b | 0.71 | 0.149 | − 0.109 | − 0.258 |
| 7a | 11.8 | − 1.072 | − 0.737 | 0.335 |
| 8 | 0.91 | 0.041 | 0.06 | 0.019 |
| 9 | 10.5 | − 1.021 | − 1.119 | − 0.098 |
| 10a | 0.99 | 0.004 | − 0.373 | − 0.377 |
| 11 | 0.82 | 0.086 | 0.055 | − 0.031 |
| 12 | 0.80 | 0.097 | 0.199 | 0.102 |
| 13 | 0.85 | 0.071 | 0.14 | 0.069 |
| 14 | 12.2 | − 1.086 | − 0.968 | 0.118 |
| 15 | 0.80 | 0.097 | − 0.016 | − 0.113 |
| 16a | 1.27 | − 0.104 | − 0.124 | − 0.02 |
| 17 | 1.78 | − 0.25 | − 0.375 | − 0.125 |
| 18 | 1.16 | − 0.064 | 0.035 | 0.099 |
| 19a | 11.0 | − 1.041 | − 1.218 | − 0.177 |
| 20 | 12.3 | − 1.09 | − 0.964 | 0.126 |
| 21 | 11.6 | − 1.064 | − 1.069 | − 0.005 |
a = compounds values taken in the training and test set of 3D-MLR QSAR model
*Against Rv1284
aTest set compound of the 3D-QSAR model
Biological activity (Ki = 0.71–12.2 µM) of the compounds was converted into logarithmic pKi using the equation pKi = log1/Ki (Sharma et al. 2013).
Energy minimization and geometry optimization were performed using Merck molecular force field (MMF) under the following conditions: a distance-dependent dielectric constant of 1.0, convergence criterion, or root-mean-square (RMS) gradient set at 0.01 kcal/mol Å with iteration limit set at 10,000. After assigning charges (partial) to the atoms, the energy minimization was carried out by steepest descent method 1000 steps and conjugate gradient method. Among all generated molecular conformers, one with lowest energy was used for the calculations. To generate a validated 3D-QSAR model, the library was divided into training set and a test set comprising 16 and 6 compounds, respectively.
Molecular alignment
Molecular alignment gives an idea about the shape variation and is an essential task for any 3D QSAR model development. In the present study, we used VLife_MD software-based alignment module, which requires 3D structure and template core structure of the compounds (VLife 2008). For this study, 2D structure of all compounds was converted to 3D, followed by energy and geometry optimization and alignment into a separate folder (Bhatia et al. 2009; Sharma et al. 2013). All aligned compounds were further utilized for molecular descriptors calculation.
Molecular descriptor calculation and QSAR model building steps
The molecular descriptor calculation is an important task in building any 3D QSAR model. Building of any 3D QSAR model is evaluating the required descriptors for the set of molecules under consideration. To establish the relationship between molecular shape and biological activity, molecules were opened in QSAR module worksheet and biological activity was inserted in a separate column to calculate the relationship between molecules local shape and the biological activity.
3D field descriptor values were calculated using Tripos force field with electrostatic and steric cutoffs set at 10.0 and 30.0 kcal/mol, respectively. The charge type was selected as by Gasteiger and Marsilli with dielectric constant set to 1.0.
Since some of the descriptors have constant value, they were removed from the descriptor sheet to generate a robust QSAR model. A total of 2888 descriptors were placed in the separate column for each compound. Further step is the selection of ‘training’ and ‘test set’; the training and test sets were created manually and composed of 16 and 6 compounds respectively. During selection of training and test set compounds, care should be taken such as biological activities values of test set compound (six compounds) must lie within the minimum (min) and maximum (max) value range (biological activities) of training set (16 compounds) compounds. To ensure that the selection of training and test compounds is correct or not, it was verified by Uni-Column statistics values (Table S1). The min and max values of the training and test set have been performed under conditions: (1). The max value of predicted inhibition constant ‘pKi’ (µM) of test set will be less than or equal to a max value of pKi (µM) of the training set, and (2). The min value of predicted inhibition constant ‘pKi’ (µM) of test set will be higher than or equal to a min value of pKi (µM) of the training set (Sharma et al. 2013). These observations indicated that the test set values estimated and derived within the min–max range of the training set. Hence, the mean and standard deviation (SD) of pKi values of both sets (training and test) provided useful information of the relative difference between mean and point density distribution (PDD) by two sets. Finally, QSAR model was necessary to select the variable selection by which we can build the model, so that we selected forward–backward model building wizard as well as stepwise parameter cross correlation limit fixed as 0.5. The Ftest values set to be In, 4; out is 3.99 that is a default parameter. Furthermore, the number of max neighbour choose as 5 or min neighbour as 2 and distance-based weighted average (DBWA) method selected.
Molecular docking and drug-likeness studies
In this study, we employed both the Linux based Autodock4 (version 4.2.6) and AutoDock vina (version 1.1.2) software’s (Trott and Olson 2010; Mushtaque et al. 2017; Haque et al. 2017b; Ali et al. 2014, 2013). Initially, required input files of the ligands (compounds) and receptor (4YF4) were prepared by converting .pdb to .pdbqt format. Blind docking was performed the grid dimensions of 116 × 112 × 112 Å and grid space of 0.375 Å. Default parameters for Lamarckian Genetic Algorithm (LGA) were used to generate the best molecular conformation of the ligands (Kumari et al. 2016; Nasreen et al. 2017; Morris et al. 1998). After completion of run, output files (.dlg format) were analyzed with PyMol (DeLano 2002). 2D plot of the most suitable docked conformation was constructed using discovery studio Visualizer (version 2.5) (Studio 2009). The physico-chemical properties (Lipinski parameters) of the compounds were predicted using online swiss admet server (https://preadmet.bmdrc.kr) (Daina et al. 2017) and pkCSM (http://biosig.unimelb.edu.au/pkcsm/).
Molecular dynamics simulation
MD simulation was carried out using GROMACS 4.6.5 software package (Pronk et al. 2013; Hess et al. 2008). Native β-CA1 and most suitable docked conformations (i.e., with lowest binding energy) were selected for the simulation. Among 22 selected and 72 designed compounds, we selected four (6A, 6B, 12, and 15) and two (D25 and D50) compounds, respectively. Isoniazid (INH) was used as standard. The crystal structure of β-CA1 (PDB-ID: 4YF4) complexed with H2O, Mg2+, and Zn2+ (as cofactor) at resolution 1.80 Å was selected. Except to the water molecule required for β-CA1 activity, all other water molecules and metal ions were removed from chain A (2-163 amino acids) for the simulation (Rowlett 2010). The native protein topology parameter files were created using GROMOS96 43a1 force field. The intermolecular (non-bonded) potential, represented as the sum of Lennard-Jones (LJ) force and pairwise Coulomb interaction and the long-range electrostatic force, were determined by particle mesh Ewald approach. The velocity Verlet algorithm was used for the numerical integrations and the initial atomic velocities were generated with a Maxwellian distribution at the given absolute temperature. Then, the system immersed with SPC/E water model, and protein was placed at the centre of cubic grid box (1.0 nm). The neutralization was performed by adding three Na+ counter ions into the grid box. The neutralized system was then subjected to energy minimization using the steepest descent and conjugate gradient (CG) algorithms utilizing a convergence criterion i.e. 0.005 kcal mol−1 Å−1. The two-standard equilibration phase was carried out separately NVT and NPT ensemble conditions such as constant volume and constant pressure for each complex similar time scale. We applied Berendsen thermostat and Parinello–Rahman barostat to maintain the temperature and the pressure of the system were constant at (1 bar and 300 K) with a coupling times of τP = 2 ps, and τT = 0.1 ps, respectively.
The periodic boundary condition (PBC) used for the integrating the equation of motion by applying the leap-frog algorithm with 2 fs time step. Finally, to make the system ready for production, the fixing of constraints is achieved with the relaxation of grid box with water along with the counter ions.
PRODRG server was used for the generation of topologies-coordinate files of the selected compounds (SchuÈttelkopf and Van Aalten 2004). After successful topology generation, all docked β-CA1-phenolic complexes (i.e., β-CA1-6A/6B/12/15/D25/D50/INH) were used in MD production. In addition, all the simulation performed at 60,000 ps (60 ns) totalling of 480 ns in this study.
Results and discussion
3D-QSAR statistical analysis
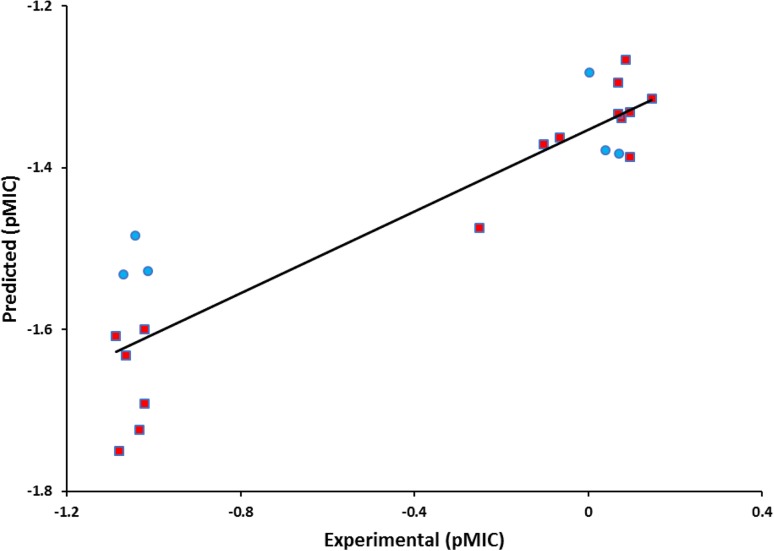
A backward–forward stepwise variable selection method was used for 3D-MLR QSAR model generation (Liu et al. 2002). A QSAR model is considered best when the residual value (difference between theoretical and experimental biological activities) is not more than one (Jain et al. 2012). After attempting a number of models with different compound combinations, a statistically significant model was achieved. As can be seen from (Table 1), the residual values lie between 0.396 and − 0.377 indicating quite good nature of the developed model. The QSAR fitness plot was constructed to compare experimental versus (vs) predicted activity and is shown in (Fig. 1).
Fig. 1.
3D-QSAR Models, Fitness plot comparison between experimental vs predicted activity for training (red balls) and test set (blue balls) compounds
We selected three parameters, i.e., q2 (internal predictive ability of the model/cross-validation), r2 (correlation coefficient of the model), and pred_r2 conformed (quality/ability of the model can be predicted by the activity of external test set); the model selection criterion is correct or not. Considering the values of these three parameters, (r2 = 0.94, q2 = 0.86, pred_r2 = 0.74) that identify the statistically most significant model was found for anti-Tb activity. The correlation coefficient gives indication about the model reliability and its accuracy is given in Table 2. The optimizations of electrostatic and static requirements of the phenolic nucleus responsible for anti-Tb activity and phenolic pharmacophore generated from 3D data points were used.
Table 2.
3D-QSAR backward–forward stepwise variable selection by MLR model equation generated and for contributing descriptors statistical results shown in table
| S. no. | Statistical parameter | 3D-QSAR results by MLR |
|---|---|---|
| 1 | r 2 | 0.94 |
| 2 | q 2 | 0.86 |
| 3 | pred_r2 | 0.74 |
| 4 | r_ 2 se | 0.14 |
| 5 | q2_se | 0.23 |
| 6 | pred_r2se | 0.29 |
| 7 | F test | 50.79 |
| 8 | N | 16 |
| 9 | Degree of freedom | 11 |
| 10 | Contributing descriptors | E_854, E_877,S_118, and S_567 |
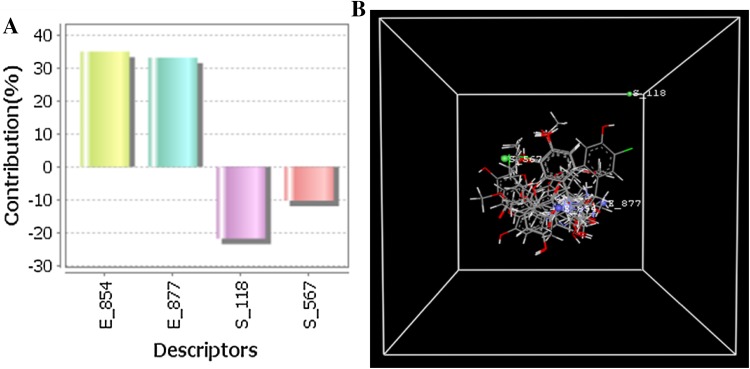
The contribution plot represent descriptor participated in model building as shown in (Fig. 2a) and the similarity between of training and test set by the experimental and predicted set is shown in (Figure S1). These data points were used most active compound and its nearest neighbours used for validation of the field values. 3D-QSAR data points are electrostatic E_854 (0.0736253, 2.74616e−006), E_877 (0.0815714, 5.09489e−006), static interaction field S_118 (− 516.532, 75.4965), and S_567 (− 0.0147166, 6.84306e−007) at lattice points shown in the (Fig. 2b).
Fig. 2.
Contribution plot of the E_854, E_877, S_118, and S_567 descriptor participated in the model (a), stereo view of molecular grid around the superposed molecular units of phenols series of compounds using 3D-MLR method (b)
These data points indicated the significance of steric and electrostatic properties (mentioned in parenthesis) for structural activity relationship (SAR) of the phenols derivatives. 3D-QSAR model suggests that the descriptors like electrostatic effects of E_854 and E_877 with positive values as well as negative steric S_118 and S_567 controlled the activity of the molecule. Best 3D-QSAR regression model by MLR method is represented by the following equation:
| 1 |
The cross-validated correlation coefficient (q2) indicated about the model reliability and accuracy. The structural properties of compounds that lead to experimental biological activity usually determined by non-covalent forces like steric and electrostatic that produced by the compound data set of the model (Patel et al. 2014). The steric (S_118, S_567) and electrostatic (E_854, E_877) descriptors signify the SAR properties and maximum biological activities of 4-(2-hydroxyethyl) phenol derivatives. The steric and electrostatic field energy and interactions are shown at their corresponding spatial grid box; on the other hand, all four descriptors values of S_118, S_567, E_854, and E_877 are mention in Table S2 (Sharma et al. 2013). The electrostatic E_854 and E_877 with positive values suggested that electrostatic substituent’s are favourable at this site, the most potent compounds (compounds 6A, 6B and 12) with greater activity causing by electronegative substitution (Cl) atom at the phenolic ring strongly support the above statement. As we know steric and electrostatic (S_118, S_567, E_854 and E_877) field’s effects on the compounds could be enhance activity of phenolic compound.
On the basis of above-discussed results, total of 72 new phenolic compounds was designed as β-CA1 inhibitors (Chart 1). The designed compounds possess functionality like hydroxy, nitro, amino, esters, etc. All these heteroatomic fragments are responsible for producing polarity, resulting in the enhancement of electrostatic factors. To introduce hydrophobicity and steric hinderance, alkyl groups as well as four and five membered rings were incorporated. In addition, polar groups also increase the solubility in aqueous medium, while aliphatic and an aromatic fragment enhances the lipid affinity.
Chart 1.
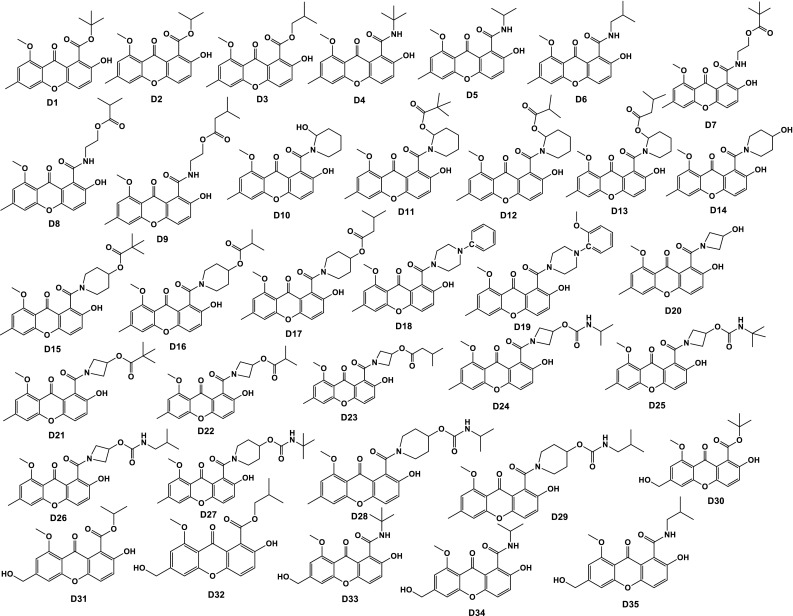
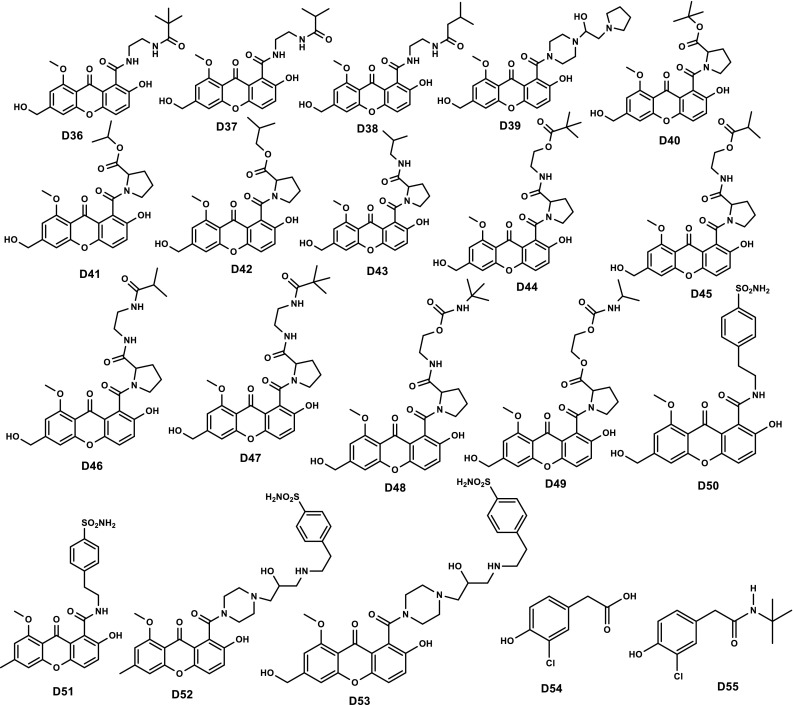
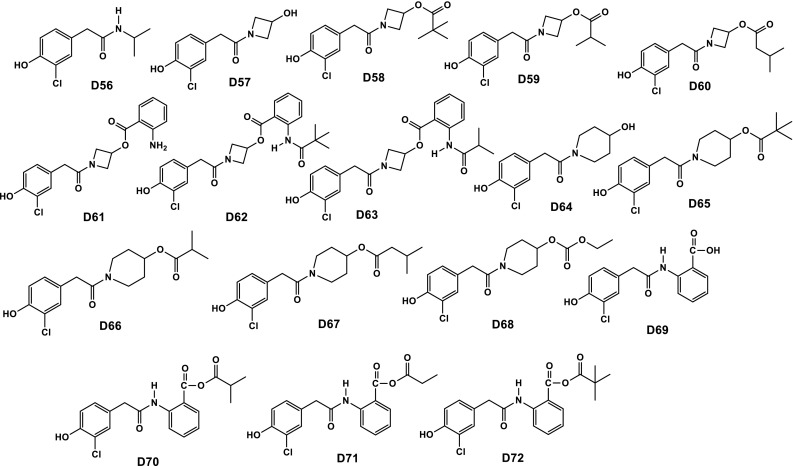
Chemical structures of 72 newly designed phenolic compounds with the help of QSAR study
Our study revealed that, out of 72 designed compounds, D25 and D50 displayed enhanced theoretical properties compared to parent INH. Both D25 and D50 have basic core of coumarin with alkyl group attached through amide and carbamate bonds. In compound D25, both carbamate and amide bonds are present which are responsible for hydrophilicity, and tertiary butyl group and cyclobutyl ring are responsible for producing steric hinderance and hydrophobicity. Probably, due to the presence of these, compound D25 displayed comparable/similar properties to the standard. However, in case of compound D50 electrostatic groups, sulphonamide and amide are present which are responsible for hydrophilicity, and benzene ring and ethyl groups are steric hinderance producing groups and responsible for hydrophobicity, resulting the potential candidature to be a drug candidate like standard INH. Out of these, two compounds D25 and D50, compound D50 is more potent than compound D25, due to probably the presence of free sulphonamide group and aromatic ring.
Docking studies
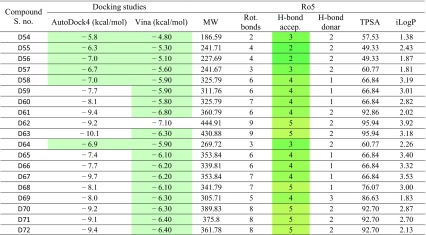
Phenolic compounds used in this study were based on both the natural (1–13, Chart S1) and synthetic (14–21, Chart S1) sources. We investigated both electron donor and acceptors embedded phenolic cores. In addition, phenolic systems separated by cyclic or acyclic linkers have also been included. The results of autodock 4 and autodock vina are almost the same, so we have used autodock 4 results for further study; Audtodock 4 and autodock vina results in terms of binding energy mention in (Table 3 and S3). In addition to the docking tools, we also used CASTp server to predict the preferred binding site of protein (Fig. 3). Interestingly, we noted that both tools give same result and predicted same binding site for the compounds (Dundas et al. 2006). Docking analysis revealed that almost all compounds bind at the active pocket A* and few of them bind into another pocket B*. On the basis of binding energy profile, we selected 4 out of 22 compounds with lowest energy profile, i.e., compound 6A, 6B, and 12, 15, and INH drug interact and predict binding energy profile − 7.59, − 7.54, − 5.70, − 6.50 and − 6.94 kcal/mol reported in (Table S3). The results of docking study indicated that all these compounds fit nicely and interacted with the receptor (β-CA1 isozyme) via expected polar and non-polar interactions. This study also provides a few important clues/features which might affect/control the biological activity: (a) the presence of a chlorine atom ortho to phenolic hydroxyl group, (b) the presence of methylene spaced carboxamides moiety at para position, and (c) the presence of methoxy group (except 15). It is also interesting to note that a change in stereochemistry did not show any appreciable affect the binding energy as well as mode.
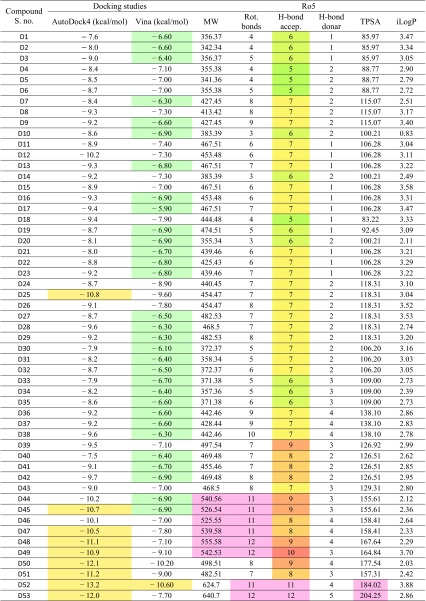
Table 3.
Docking results of β-CA1 with newly phenolic designed derivatives gives binding energy and Ro5
The selected compounds for the MD simulation are D25- and D50-binding energy − 10.8 and − 12.1 from Table 3, and compounds 6A, 6B, 12, 15, and INH along the binding energy − 7.59, − 7.55, − 5.7, 7.5, and − 6.94 from table S3 (ΔG in kcal/mol), respectively
Fig. 3.
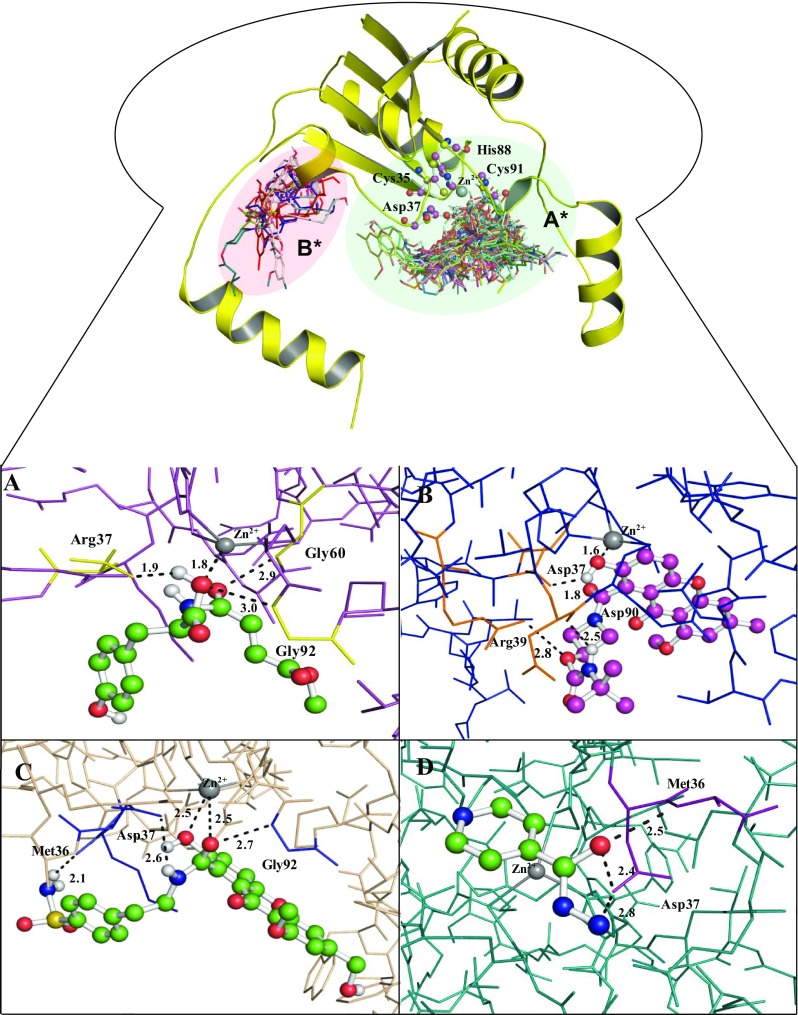
Interaction of phenolic inhibitors with β-CA1. The binding mode of β-CA1 (line model) with compound 6B (green ball and stick model) (a), compound D25 (purple ball and stick model) (b), compound D50 (green ball and stick model) (c), and INH drug (green ball and stick model) interact with the active site residues of β-CA1 (d)
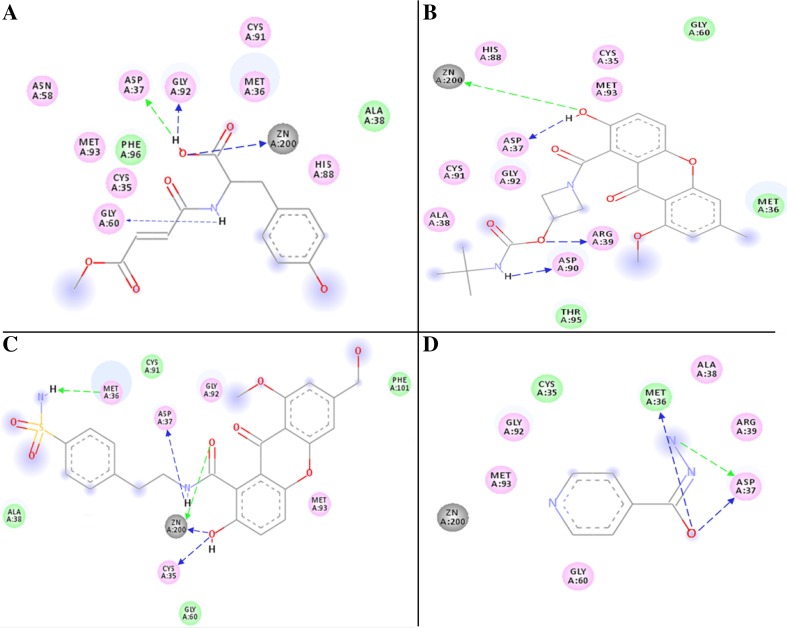
For example, compound 6A and 6B which are stereoisomers of each other, 6B had slightly higher binding energy than 6A (binding energy = − 7.79 kcal/mol for 6B vs − 7.54 kcal/mol for 6A). Both ligands fit intimately into the active site and coordinated with Zn2+ while forming three hydrogen bonds (H-bonds) between Gly60, Gly92, and Arg37 with β-CA1 and secondary alcohol groups of compound 6B and supported by hydrophobic side chains of surrounding residues (Fig. 3a, 2D plot of same complex, as shown in Fig. 4a). The binding energy of compound 12 and 15 is −5.70 and −7.50 kcal/mol, but they interacted through less number of polar bonds. For instance, in addition to the coordination with Zn2+, compound 12 formed two H-bond with Met36 and Asp37. Similarly, compound 15 formed two H-bonds with Asp37 and Gly92 as shown in (Figure S2 B, C and 2D plot of same complex E and F respectively).
Fig. 4.
2D plot of the docked complexes of β-CA1 with compound 6B, D25, D50, and drug INH as shown in a, b, c, and d respectively. The 2D plot constructed by discovery studio 2.5
In this way, we found improved binding energy as well as expected polar and non-polar interactions are enhanced (Table 3; Fig. 3). As we can see, binding mode of interaction predicted for compound D25 (binding energy − 10.8 kcal/mol) which interact with active site residues and coordinated Asp37, Arg39, and Asp90 H-bonds and Zn2+ bond along with 1.8, 2.8, 2.5 Å distance respectively (Figs. 3b, 4b). Similarly, predicted compound number D50 which have least binding energy − 12.1 kcal/mol is coordinated with three H-bonds Arg36, Asp37, and Asp92 and Zn2+ 2.1, 2.6, 2.7, and 2.5 Å distance, respectively (Figs. 3c, 4c). Therefore, compound D25 and D50 are the most stable conformation also proved from MD simulation. On the other hand, the standard drug INH interacted with the receptor via two H-bonds Met36 and Asp37 binding energies − 6.94 kcal/mol (Figs. 3d, 4d, respectively). The docking result of another binding pocket did not effectively bind to the β-CA1, the binding interaction of compound D17 interact with Arg44 which carried binding energy − 9.4 kcal/mol along distance 3.4 Å, which is quite higher, as shown in (Figure S3 A and C), whereas another compound D27 interacts with Gly51 and Tyr43 that has binding energy − 8.7 kcal/mol and calculated distance 3.4 and 3.1 Å, respectively, as shown in (Figure S3 B and D). Therefore, newly designed compound D25 and D50 are the most stable conformation also proved from MD simulation as well as Ro5.
Drug-likeness
Despite organic and organometallic chemists develop plethora of pharmacophore every year, it fails to enter into clinical use (Kobak et al. 2007). This is mainly attributed to the poor pharmacokinetic performance, solubility, and physico-chemical properties of the molecules (Amiri-Kordestani and Fojo 2012). To circumvent these issues, researchers employ computational tools to determine possible fate of a molecule. Such studies help in screening of the ideal drug candidate and thus significantly reduce the burden of clinical trials (Ferreira and Andricopulo 2017). The drug-likeness study of a compound gives its physico-chemical properties and hints towards whether it could act as oral drug or not (Leeson 2012). Ideally, an orally active drug/molecule should not possess more than one violation; however, exception exists too (Lipinski 2004). Here, we found that all the compounds obeyed this rule fairly well (Table S3).
Three compounds (6A, 6B, and 13) violated one rule (number of rotatable bonds 11, 11, and 13, respectively), which is still acceptable to consider them as drug. Similarly, compound 7 has a very large PSA, possibly due to the presence of more electronegative atoms. Compounds 15–17, which were found to interact moderately with the receptors in docking studies, also showed a slightly higher logP value, though it is under the set limit.
The designed compounds also followed the rule very well, but few of them did not follow (break out the barrier) such as increase in M.W of compound D44–D49 is greater than 500. Similarly, compound D44 to D49, D52, and D53 rotatable bond more than ten it means these compound not following the criteria for the drug candidate. The compound D52 and D53 H-bond acceptor, donor, and topological polar surface area are beyond the normal condition. Overall, study indicated that the compounds D25 and D50 have potential to pass all the criteria follow the rule very well, as well as have lowest binding energy from docking results as shown in (Table 3).
MD simulation analysis
The MD simulation of the trajectory analysis by monitoring the root-mean-square deviation (RMSD), radius of gyration (Rg), solvent-accessible surface area (SASA), root-mean-square fluctuation (RMSF), and secondary structural changes were performed with one native protein and in the presence of four selected, and two newly designed compounds as well as INH. Moreover, essential dynamics analysis to find the atomic movement of native β-CA1 and each complex through covariance matrix and eigenvector build by g_covar and g_anaeig modules. These analysis values will decipher the conformational changes induced by the compounds.
Comparable root-mean-square deviation
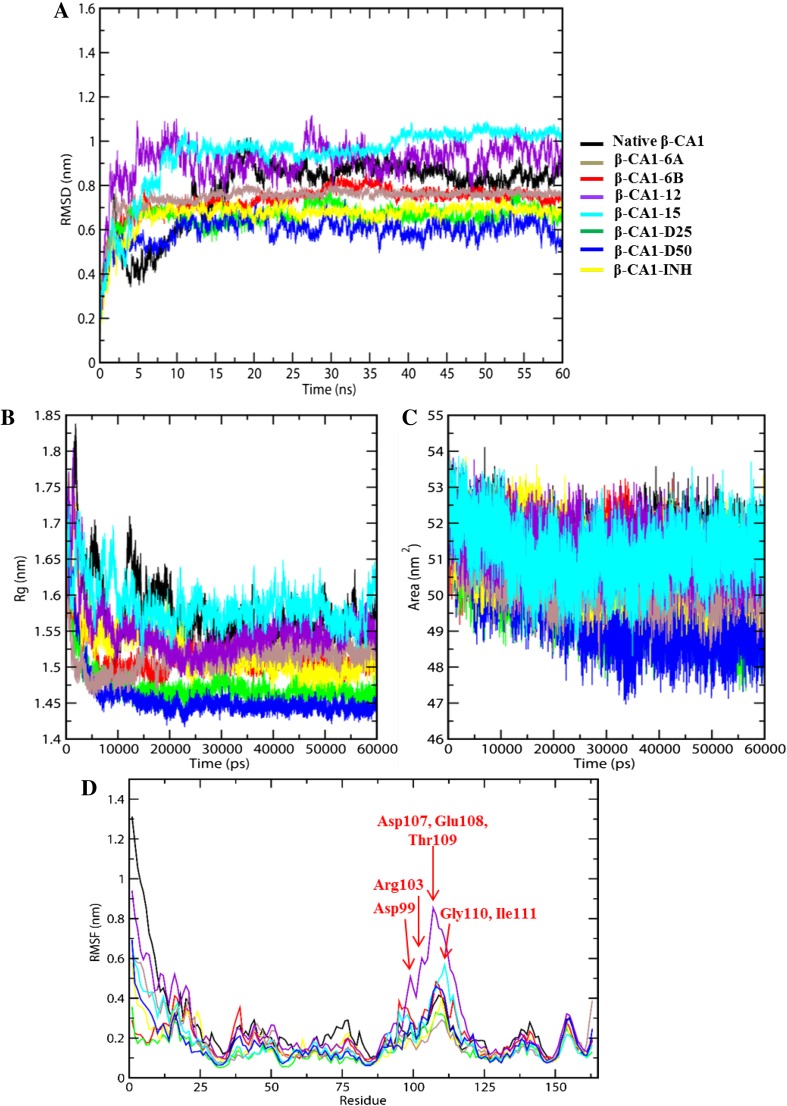
We observed that the RMSD value for native β-CA1 increases till ~ 18 ns and then achieves the equilibrium and remain stable during the 60 ns simulation. This indicated that β-CA1 remains stable during the MD simulation. In comparison to native protein, β-CA1 compounds’ complex achieved equilibrium quickly (within ~ 2 ns) except compound 12 and 15 well equilibrated at the 10 ns of the simulation. The magnitude of fluctuations of compound 12 and 15 is quite higher than native and all other compounds complexes; the average RMSD values are reported in (Table 4).
Table 4.
Average values of RMSD, Rg, and SASA
| β-CA1-complex | Average RMSD (nm) | Average Rg (nm) | Average SASA (nm2) |
|---|---|---|---|
| Native protein | 0.77 ± 0.02 | 1.57 ± 0.02 | 51.32 ± 0.02 |
| 6A | 0.74 ± 0.01 | 1.51 ± 0.01 | 50.67 ± 0.01 |
| 6B | 0.73 ± 0.01 | 1.51 ± 0.01 | 50.93 ± 0.01 |
| 12 | 0.91 ± 0.02 | 1.55 ± 0.01 | 51.20 ± 0.01 |
| 15 | 0.94 ± 0.02 | 1.44 ± 0.02 | 50.60 ± 0.02 |
| D25 | 0.66 ± 0.01 | 1.47 ± 0.01 | 49.91 ± 0.01 |
| D50 | 0.59 ± 0.01 | 1.46 ± 0.01 | 49.61 ± 0.01 |
| INH | 0.66 ± 0.01 | 1.52 ± 0.01 | 51.03 ± 0.01 |
Values measured from Fig. 5
±Error
Interesting to note that, compounds 12 and 15 displayed a large RMSD with the average value of 0.91 and 0.94 nm causing the destabilization of the protein; however, all other compounds have lower average RMSD value than native protein; indicating the stabilization of the protein by during inhibitor binding. The maximum stabilization is observed for newly designed compound D25 and D50 which has average RMSD of ~ 0.66 and ~ 0.59 nm, respectively (Fig. 5a; Table 4). The average RMSD of complex with compound 6B is ~ 0.73 nm that carries least biological activity 0.71 µM and inhibition profile of pathogenic M.tb. The designed compound D25 and D50 average RMSD are less than compound 6B and INH drug. In this regards, the average RMSD value and fluctuation peaks of compound D25 and INH drug are almost the same, which is the evidence of compounds effectiveness. Therefore, compounds D25 and D50 are the most potent compounds which could be considered as drug candidates.
Fig. 5.
MD simulation of native β-CA1 and β-CA1-inhibitor complexes. Root-mean-square deviation plot (a), radius of gyration plot (b), solvent-accessible surface area plot (c), and root-mean-square fluctuations plot (d). The colors of all curves are indicated in the figure
Radius of gyration (Rg)
The radius of gyration (Rg) measures the protein compactness/stability and the results are shown in (Fig. 5b; Table 4). The value of Rg was found to be lower for compounds D25 (Rg = 1.47 nm) and D50 (Rg = 1.46 nm) than the control used in this study (INH, Rg = 1.52 nm). A closer analysis of Fig. 5b indicates that the studied compounds endowed more compactness and rigidity to the protein than the control, leading to overall stabilization of protein complex. The Rg values of native and all complexes variation trend similar pattern of RMSD.
Comparable hydrophobic burial
In Table 4, we have also compiled the solvent accessible surface area (SASA) of native β-CA1 as well as its complex with the studied compounds. As can be seen, SASA value of native protein (51.32 nm2) decreases upon complexation with 6A (50.67 nm2), 6B (50.93 nm2), 12 (51.20 nm2), 15 (50.60 nm2), D25 (49.91 nm2), and D50 (49.61 nm2). Furthermore, the lowering of SASA was more pronounced in cases of the designed compounds than the control (INH, 51.03 nm2). Overall, this study indicated that the overall protein stability and dynamics gets modulated in the presence of designed compounds D25 and D50 (Fig. 5c).
Residual fluctuation
The mobility of β-CA1 amino acids residues (1–163) was examined through root-mean-square fluctuation (RMSF), which is the measure of flexibility/stability of individual residue of a protein. We found that the throughout the simulation studies, complexes of D25 and D50 showed less fluctuation compared to 12 and 15 (Fig. 5d).
The residues in complex with compounds 12 and 15 showed fever fluctuation at Asp99, Arg103, Asp107, Glu108, Thr109, Gly110, and Ile111, these residues not involved in molecular docking studies. The binding pocket and Zn2+ metal are coordinating residues Cys35, Asp37, His88, and Cys91 indicating stable conformation; it means phenolic compounds not interrupting in stability and providing strength to β-CA1. However, in comparison of all the complexes RMSF fluctuation peaks compound 12 and 15 showed quit higher fluctuation, than all other complexes, which are indicating satisfactory stability during the MD simulation. These results suggesting that the designed compounds D25 and D50 make β-CA1 stabilized throughout the MD simulations (Fig. 5d).
Secondary structure changes
Average secondary structure fluctuations values are given in the Table S4. The secondary structure of protein assignments such as (α-helix, β-sheet, turn, bend, and coil) were broken down into individual residues for each provided time step, i.e., pico-second (ps) to quantifying the data in meaningful result. The observed changes in the secondary structure of native protein and its all complexes are shown in Figure S4. A pronounced change is seen in the presence of compound 6B, D25, and D50 increase in the α-helix, β-sheet, and decrease in coil, bend, and turn like content as compare to all other complexes (Figure S4 F and G).
Whereas, compound 12 and 15 increases the coil and bend-like structure, and decrease α-helix and β-sheet structure, suggesting that secondary structures are lost. Furthermore, the presence of compound 6A and INH drug with proteins did not underwent any significant changes in secondary structure. Overall results suggest that secondary and tertiary structures are minimally perturbed in the presence of compounds 12 and 15. Furthermore, newly designed compounds D25 and D50 displayed an increase in secondary structure as compared to other complexes, which are also validated RMSD, Rg, and SASA analysis.
Principal component (PCA) analysis
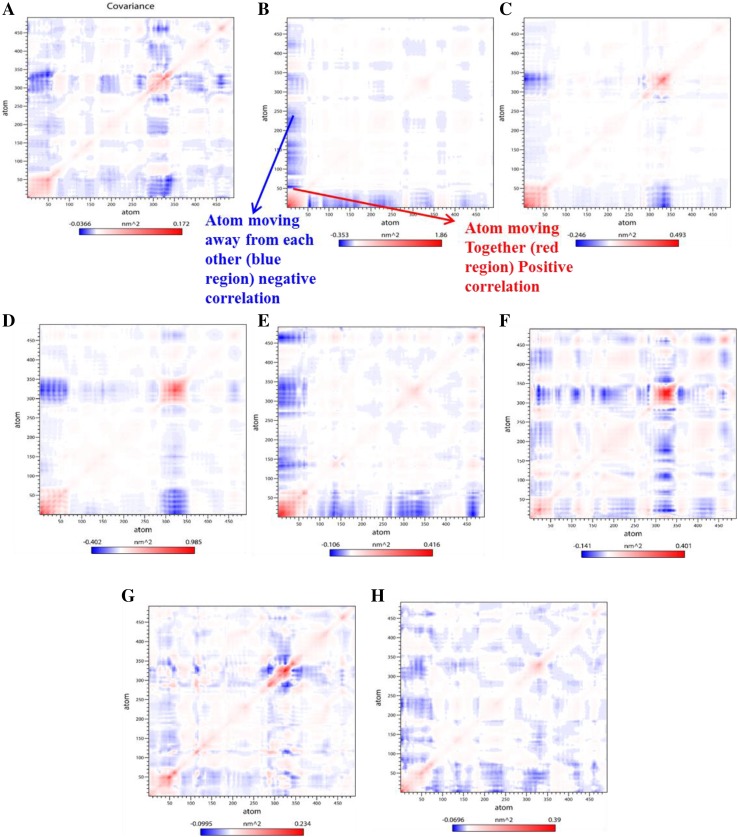
Principal component analysis (PCA) was performed to monitor the conformational changes over the backbone atoms of protein and in the presence of compounds. The g_covar module employed and diagonalizes the covariance matrix using atomic fluctuation in Cartesian coordinate space. This module also provides a set of eigenvectors and corresponding eigenvalues that define a vectorial depiction of every single atom’s collective motions along directions. The purpose of covariance matrix analysis is to find whether the pair of atoms behaving level of dominant correlated and anti-correlated motion. This matrix represents red and blue color; red-colored region means residues moving together as well as blue colored region showing residues moving in opposite order. Here, we have constructed covariance matrices and analyzed all trajectories that provide an idea about the correlated and anti-correlated conformational motion of the native β-CA1 and complexes with total seven phenols inhibitor along with Mtb first-line drugs INH used as a control. In this study, we observed the reduction of negative correlation largely found in compound D25 and D50 complexes as compared to native protein and other complex trajectories such as compounds 6A, 6B, 12, 15, and INH, as shown in (Fig. 6a–h) respectively.
Fig. 6.
Diagonalized covariance matrix depicted the correlated and anti-correlation motions of the β-CA1 and β-CA1-complexes within the residues. The matrix representing red-colored means residues moving together along with blue colored showing residues moving in opposite order. Matrix arranged native β-CA1 (a), β-CA1-6A complex (b), β-CA1-6B complex (c), β-CA1-12 complex (d), β-CA1-15 complex (e), β-CA1-D25 complex (f), β-CA1-D50 complex (g), and β-CA1-INH complex (h)
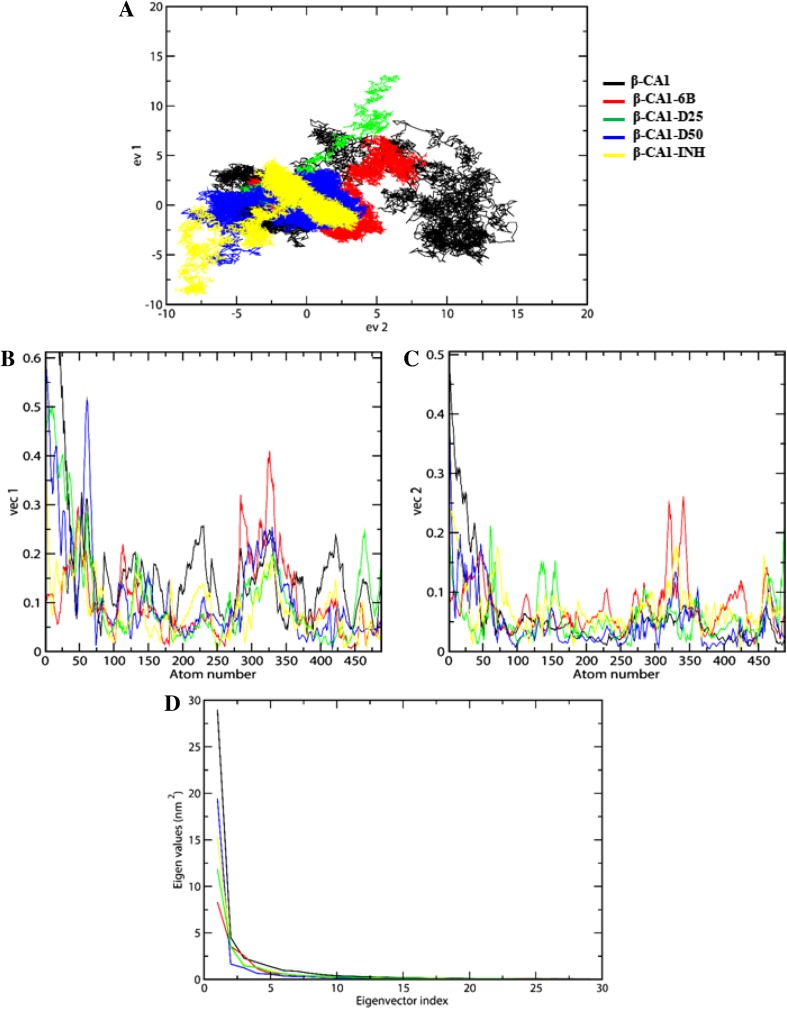
The significance of covariance matrix has been analyzed by the set of projection on eigenvectors 1 (ev1) and eigenvectors 2 (ev2). Each eigenvector has a corresponding eigenvalue that described the energetic involvement of each component to the motion. The protein and the compounds cover a well-stable cluster spanning in the range between − 10 and 5 nm2 (Fig. 7a).
Fig. 7.
2D projection graph plotted between eigenvector 1 vs eigenvector 2 for the conformational space through the covariance matrix (a), graph plotted for the comparison between vec 1 and vec 2 vs atomic fluctuations (c and b), comparison of eigenvalues (nm2) plotted against the corresponding eigenvector index of the backbone by covariance matrix for the β-CA1 and its complexes (d). Same color scheme is applicable to all figures
We can see that all the studied compounds explore a small conformational space as compared to the native protein. The compound D25 and D50 covers more restricted phase space among all the compounds (Fig. 7a). We have identified reasons of anti-correlated motion appeared in covariance matrix by the conformation deportment by atom-wise level of motion. The two principal eigenvector ev1 and ev2 showed the displacement region of each atom fluctuation confirmed the behavior of motion. These observations mainly focus on the difference in flexibility of protein residues. This accumulating evidence concluded that complexes with compound D25 and D50 structures observed least fluctuation behaviors as compared to the native protein (Fig. 7b, c), and the clear comparison shown in the Figure S5 B and C. The steep curves of eigenvalues were obtained after plotting eigenvalues against the eigenvectors of native β-CA1 and all the complexes are shown in Fig. 7d and S5 D, which suggest that more than 70% of eigenvalues covered in first two eigenvectors.
Conclusions
In this work, we have studied the potential of phenol derivatives as β-CA1 inhibitors for next generation tuberculosis treatment. We employed ligand-based QSAR method to screen a library of compounds and found that the activity of a phenolic compound could be modulated via steric and electrostatic modifications. Based on this notion, we designed 72 new phenolic compounds. Among these, two compounds (D25 and D50) showed interesting results with improved predicted activity and drug like properties. These two molecules have strong affinity and ability to stabilize β-CA1 conformation. Overall, compounds D25 and D50 are two promising candidates and should be assessed clinically.
Electronic supplementary material
Below is the link to the electronic supplementary material.
Figure S1. Test set of radar plot describing closeness between the actual and predicted activity of the test set compounds (A), training set of radar plot describing closeness between the actual and predicted activity of the compounds for the training set (B). Figure S2. Molecular docking interaction β-CA1 compound 6A (A), complex of compound 12 and compound 15 (B and C), same complexes 2D plot of H-bond representing (D, E and F) respectively. Figure S3. The docking result of another binding pocket of β-CA1 that carried least binding energy, i.e., compound D17 (A) and compound D27 (B) along with 2D plot ( C and D), respectively. Figure S4. Secondary structural changes were calculated as native β-CA1 (A), β-CA1-6A complex (B), β-CA1-6B complex (C), β-CA1-12 complex (D), β-CA1-15 complex (E), β-CA1-D25 complex (F), β-CA1-D50 complex (G), and β-CA1-INH complex (H). Figure S5. 2D projection graph plotted between eigenvector 1 vs eigen vector 2 for the conformational space through the covariance matrix (A), graph plotted between comparison vec 1 and vec 2 vs atomic fluctuations (B and C), and comparison of eigen values (nm2) plotted against the corresponding eigen vector index of the backbone by covariance matrix for the β-CA1 and its complexes (D). Same color scheme is applicable to all figures (PPTX 6788 KB)
Acknowledgements
Authors acknowledge to Bioinformatics Resources and Applications Facility (BRAF) for providing server.
Author contributions
SA performed all the computational techniques such as QSAR, Docking, MD simulation, and wrote the paper. ND supervised the project, while MIH provided computational support. All authors read and approved the final manuscript.
Compliance with ethical standards
Conflict of interest
There is no conflict of interests regarding the publication of this paper.
Footnotes
Electronic supplementary material
The online version of this article (10.1007/s13205-018-1278-z) contains supplementary material, which is available to authorized users.
Contributor Information
Md. Imtaiyaz Hassan, Email: mihassan@jmi.ac.in.
Neeraja Dwivedi, Email: drneerajadwivedi@iftmuniversity.ac.in.
References
- Ahamad S, Rahman S, Khan FI, Dwivedi N, Ali S, Kim J, Imtaiyaz Hassan M. QSAR based therapeutic management of M. tuberculosis. Arch Pharm Res. 2017 doi: 10.1007/s12272-017-0914-1. [DOI] [PubMed] [Google Scholar]
- Ali I, Haque A, Saleem K, Hsieh MF. Curcumin-I Knoevenagel’s condensates and their Schiff’s bases as anticancer agents: synthesis, pharmacological and simulation studies. Bioorg Med Chem. 2013;21(13):3808–3820. doi: 10.1016/j.bmc.2013.04.018. [DOI] [PubMed] [Google Scholar]
- Ali I, Haque A, Al Ajmi F, Hussain M, Marsin Sanagi A, Hussain M, Aboul-Enein IY. Supramolecular chiro-biomedical aspect of β-blockers in drug development. Curr Drug Targets. 2014;15(7):729–741. doi: 10.2174/1389450115666140429104516. [DOI] [PubMed] [Google Scholar]
- Ambriz-Pérez DL, Leyva-López N, Gutierrez-Grijalva EP, Heredia JB. Phenolic compounds: natural alternative in inflammation treatment. Rev Cogent Food Agric. 2016;2(1):1131412. [Google Scholar]
- Amiri-Kordestani L, Fojo T. Why do phase III clinical trials in oncology fail so often? J Natl Cancer Inst. 2012;104(8):568–569. doi: 10.1093/jnci/djs180. [DOI] [PubMed] [Google Scholar]
- Anantharaju PG, Gowda PC, Vimalambike MG, Madhunapantula SV. An overview on the role of dietary phenolics for the treatment of cancers. Nutr J. 2016;15(1):99. doi: 10.1186/s12937-016-0217-2. [DOI] [PMC free article] [PubMed] [Google Scholar]
- Aspatwar A, Hammarén M, Koskinen S, Luukinen B, Barker H, Carta F, Supuran CT, Parikka M, Parkkila S. β-CA-specific inhibitor dithiocarbamate Fc14–584B: a novel antimycobacterial agent with potential to treat drug-resistant tuberculosis. J Enzyme Inhib Med Chem. 2017;32(1):832–840. doi: 10.1080/14756366.2017.1332056. [DOI] [PMC free article] [PubMed] [Google Scholar]
- Becerra MC, Appleton SC, Franke MF, Chalco K, Arteaga F, Bayona J, Murray M, Atwood SS, Mitnick CD. Tuberculosis burden in households of patients with multidrug-resistant and extensively drug-resistant tuberculosis: a retrospective cohort study. Lancet. 2011;377(9760):147–152. doi: 10.1016/S0140-6736(10)61972-1. [DOI] [PubMed] [Google Scholar]
- Bhatia MS, Choudhari PB, Ingale KB, Bhatia NM, Zarekar BE, Sangale DB. 3D QSAR analysis of 2, 4-disubstituted 1, 5-benzodiazepine derivatives as CNS depressants. Dig J Nanomat Bios. 2009;4:579–585. [Google Scholar]
- Buchieri MV, Riafrecha LE, Rodríguez OM, Vullo D, Morbidoni HR, Supuran CT, Colinas PA. Inhibition of the β-carbonic anhydrases from Mycobacterium tuberculosis with C-cinnamoyl glycosides: identification of the first inhibitor with anti-mycobacterial activity. Bioorg Med Chem Lett. 2013;23(3):740–743. doi: 10.1016/j.bmcl.2012.11.085. [DOI] [PubMed] [Google Scholar]
- Caminero JA, Sotgiu G, Zumla A, Migliori GB. Best drug treatment for multidrug-resistant and extensively drug-resistant tuberculosis. Lancet Infect Dis. 2010;10(9):621–629. doi: 10.1016/S1473-3099(10)70139-0. [DOI] [PubMed] [Google Scholar]
- Cau Y, Mori M, Supuran CT, Botta M. Mycobacterial carbonic anhydrase inhibition with phenolic acids and esters: kinetic and computational investigations. Org Biomol Chem. 2016;14(35):8322–8330. doi: 10.1039/C6OB01477A. [DOI] [PubMed] [Google Scholar]
- Centis R, D’Ambrosio L, Zumla A, Migliori GB. Shifting from tuberculosis control to elimination: where are we? What are the variables and limitations? Is it achievable? Int J Infect Dis. 2017;56:30–33. doi: 10.1016/j.ijid.2016.11.416. [DOI] [PubMed] [Google Scholar]
- Clark-Curtiss JE, Haydel SE. Molecular genetics of Mycobacterium tuberculosis pathogenesis. Annu Rev Microbiol. 2003;57:517–549. doi: 10.1146/annurev.micro.57.030502.090903. [DOI] [PubMed] [Google Scholar]
- Daina A, Michielin O, Zoete V. SwissADME: a free web tool to evaluate pharmacokinetics, drug-likeness and medicinal chemistry friendliness of small molecules. Sci Rep. 2017;7:42717. doi: 10.1038/srep42717. [DOI] [PMC free article] [PubMed] [Google Scholar]
- Davis RA, Hofmann A, Osman A, Hall RA, Mühlschlegel FA, Vullo D, Innocenti A, Supuran CT, Poulsen S-A. Natural product-based phenols as novel probes for mycobacterial and fungal carbonic anhydrases. J Med Chem. 2011;54(6):1682–1692. doi: 10.1021/jm1013242. [DOI] [PubMed] [Google Scholar]
- Del Prete S, Vullo D, Osman SM, AlOthman Z, Supuran CT, Capasso C. Sulfonamide inhibition profiles of the beta-carbonic anhydrase from the pathogenic bacterium Francisella tularensis responsible of the febrile illness tularemia. Bioorg Med Chem. 2017;25(13):3555–3561. doi: 10.1016/j.bmc.2017.05.007. [DOI] [PubMed] [Google Scholar]
- DeLano WL. The PyMOL user’s manual. San Carlos, CA: DeLano Scientific; 2002. p. 452. [Google Scholar]
- Dundas J, Ouyang Z, Tseng J, Binkowski A, Turpaz Y, Liang J. CASTp: computed atlas of surface topography of proteins with structural and topographical mapping of functionally annotated residues. Nucleic Acids Res. 2006;34(suppl_2):W116–W118. doi: 10.1093/nar/gkl282. [DOI] [PMC free article] [PubMed] [Google Scholar]
- Duthie GG, Duthie SJ, Kyle JA. Plant polyphenols in cancer and heart disease: implications as nutritional antioxidants. Nutr Res Rev. 2000;13(1):79–106. doi: 10.1079/095442200108729016. [DOI] [PubMed] [Google Scholar]
- Faizi MSH, Alam MJ, Haque A, Ahmad S, Shahid M, Ahmad M. Experimental and theoretical characterization of organic salt: 2-((4-bromophenyl) amino) pyrido [1, 2-a] quinoxalin-11-ium bromide monohydrate synthesized via oxidative cyclization. J Mol Struct. 2018;1156:457–464. doi: 10.1016/j.molstruc.2017.12.014. [DOI] [Google Scholar]
- Ferreira LG, Andricopulo AD. Targeting cysteine proteases in trypanosomatid disease drug discovery. Pharmacol Ther. 2017;180:49–61. doi: 10.1016/j.pharmthera.2017.06.004. [DOI] [PubMed] [Google Scholar]
- Gandhi NR, Nunn P, Dheda K, Schaaf HS, Zignol M, van Soolingen D, Jensen P, Bayona J. Multidrug-resistant and extensively drug-resistant tuberculosis: a threat to global control of tuberculosis. Lancet. 2010;375(9728):1830–1843. doi: 10.1016/S0140-6736(10)60410-2. [DOI] [PubMed] [Google Scholar]
- George T, Mabon R. G. 55 Sweeney, BJ Sweeney and A. Tavassoli. J Chem Soc Perkin Trans. 2000;1(1):2529. doi: 10.1039/a808133f. [DOI] [Google Scholar]
- Hanson P, Jones JR, Taylor AB, Walton PH, Timms AW. Sandmeyer reactions. Part 7. 1 An investigation into the reduction steps of Sandmeyer hydroxylation and chlorination reactions. J Chem Soc Perkin Trans. 2002;2(6):1135–1150. doi: 10.1039/b200748g. [DOI] [Google Scholar]
- Haque A, Hsieh M-F, Hassan SI, Faizi MSH, Saha A, Dege N, Rather JA, Khan MS. Synthesis, characterization, and pharmacological studies of ferrocene-1H-1, 2, 3-triazole hybrids. J Mol Struct. 2017;1146:536–545. doi: 10.1016/j.molstruc.2017.06.027. [DOI] [Google Scholar]
- Haque A, Khan I, Hassan SI, Khan MS. Interaction studies of cholinium-based ionic liquids with calf thymus DNA: spectrophotometric and computational methods. J Mol Liq. 2017;237:201–207. doi: 10.1016/j.molliq.2017.04.068. [DOI] [Google Scholar]
- Hess B, Kutzner C, Van Der Spoel D, Lindahl E. GROMACS 4: algorithms for highly efficient, load-balanced, and scalable molecular simulation. J Chem Theor Comput. 2008;4(3):435–447. doi: 10.1021/ct700301q. [DOI] [PubMed] [Google Scholar]
- Hoarau C, Pettus TR. Strategies for the preparation of differentially protected ortho-Prenylated Phenols. Synlett Acc Rapid Commun Synth Org Chem. 2003;1:127. doi: 10.1055/s-2003-36234. [DOI] [PMC free article] [PubMed] [Google Scholar]
- Hoffmann KM, Wood KM, Labrum AD, Lee DK, Bolinger IM, Konis ME, Blount AG, Prussia GA, Schroll MM, Watson JM. Surface histidine mutations for the metal affinity purification of a beta-carbonic anhydrase. Anal Biochem. 2014;458:66–68. doi: 10.1016/j.ab.2014.04.020. [DOI] [PubMed] [Google Scholar]
- Huang W-Y, Cai Y-Z, Zhang Y. Natural phenolic compounds from medicinal herbs and dietary plants: potential use for cancer prevention. Nutr Cancer. 2009;62(1):1–20. doi: 10.1080/01635580903191585. [DOI] [PubMed] [Google Scholar]
- Innocenti A, Winum J-Y, Hall RA, Mühlschlegel FA, Scozzafava A, Supuran CT. Carbonic anhydrase inhibitors. Inhibition of the fungal β-carbonic anhydrases from Candida albicans and Cryptococcus neoformans with boronic acids. Bioorg Med Chem Lett. 2009;19(10):2642–2645. doi: 10.1016/j.bmcl.2009.03.147. [DOI] [PubMed] [Google Scholar]
- Jain SV, Ghate M, Bhadoriya KS, Bari SB, Chaudhari A, Borse JS. 2D, 3D-QSAR and docking studies of 1, 2, 3-thiadiazole thioacetanilides analogues as potent HIV-1 non-nucleoside reverse transcriptase inhibitors. Org Med Chem Lett. 2012;2(1):22. doi: 10.1186/2191-2858-2-22. [DOI] [PMC free article] [PubMed] [Google Scholar]
- Kobak KA, Kane JM, Thase ME, Nierenberg AA. Why do clinical trials fail? The problem of measurement error in clinical trials: time to test new paradigms? J Clin Psychopharmacol. 2007;27(1):1–5. doi: 10.1097/JCP.0b013e31802eb4b7. [DOI] [PubMed] [Google Scholar]
- Kumari S, Idrees D, Mishra CB, Prakash A, Ahmad F, Hassan MI, Tiwari M. Design and synthesis of a novel class of carbonic anhydrase-IX inhibitor 1-(3-(phenyl/4-fluorophenyl)-7-imino-3H-[1, 2, 3] triazolo [4, 5d] pyrimidin 6 (7H) yl) urea. J Mol Graph Model. 2016;64:101–109. doi: 10.1016/j.jmgm.2016.01.006. [DOI] [PubMed] [Google Scholar]
- Leeson P. Drug discovery: chemical beauty contest. Nature. 2012;481(7382):455–456. doi: 10.1038/481455a. [DOI] [PubMed] [Google Scholar]
- Lipinski CA. Lead-and drug-like compounds: the rule-of-five revolution. Drug Discov Today Technol. 2004;1(4):337–341. doi: 10.1016/j.ddtec.2004.11.007. [DOI] [PubMed] [Google Scholar]
- Liu SS, Yin CS, Wang LS. Combined MEDV-GA-MLR method for QSAR of three panels of steroids, dipeptides, and COX-2 inhibitors. J Chem Inf Comput Sci. 2002;42(3):749–756. doi: 10.1021/ci010245a. [DOI] [PubMed] [Google Scholar]
- Maresca A, Scozzafava A, Vullo D, Supuran CT. Dihalogenated sulfanilamides and benzolamides are effective inhibitors of the three β-class carbonic anhydrases from Mycobacterium tuberculosis. J Enzyme Inhib Med Chem. 2013;28(2):384–387. doi: 10.3109/14756366.2011.645539. [DOI] [PubMed] [Google Scholar]
- Morris GM, Goodsell DS, Halliday RS, Huey R, Hart WE, Belew RK, Olson AJ. Automated docking using a Lamarckian genetic algorithm and an empirical binding free energy function. J Comput Chem. 1998;19(14):1639–1662. doi: 10.1002/(SICI)1096-987X(19981115)19:14<1639::AID-JCC10>3.0.CO;2-B. [DOI] [Google Scholar]
- Mushtaque M, Avecilla F, Haque A, Perwez A, Khan MS, Rizvi MMA. Experimental and theoretical studies of a pyrazole-thiazolidin-2, 4-di-one hybrid. J Mol Struct. 2017;1141:417–427. doi: 10.1016/j.molstruc.2017.03.100. [DOI] [Google Scholar]
- Nasreen K, Ahamad S, Ahmad F, Hassan MI, Islam A. Macromolecular crowding induces molten globule state in the native myoglobin at physiological pH. Int J Biol Macromol. 2017;106:130–139. doi: 10.1016/j.ijbiomac.2017.08.014. [DOI] [PubMed] [Google Scholar]
- Patel HM, Noolvi MN, Sharma P, Jaiswal V, Bansal S, Lohan S, Kumar SS, Abbot V, Dhiman S, Bhardwaj V. Quantitative structure–activity relationship (QSAR) studies as strategic approach in drug discovery. Med Chem Res. 2014;23(12):4991–5007. doi: 10.1007/s00044-014-1072-3. [DOI] [Google Scholar]
- Pronk S, Páll S, Schulz R, Larsson P, Bjelkmar P, Apostolov R, Shirts MR, Smith JC, Kasson PM, van der Spoel D. GROMACS 4.5: a high-throughput and highly parallel open source molecular simulation toolkit. Bioinformatics. 2013;29:845–854. doi: 10.1093/bioinformatics/btt055. [DOI] [PMC free article] [PubMed] [Google Scholar]
- Rowlett RS. Structure and catalytic mechanism of the β-carbonic anhydrases. Biochim Biophys Acta (BBA) Proteins Proteom. 2010;1804(2):362–373. doi: 10.1016/j.bbapap.2009.08.002. [DOI] [PubMed] [Google Scholar]
- SchuÈttelkopf AW, Van Aalten DM. PRODRG: a tool for high-throughput crystallography of protein–ligand complexes. Acta Crystallogr Sect D Biol Crystallogr. 2004;60(8):1355–1363. doi: 10.1107/S0907444904011679. [DOI] [PubMed] [Google Scholar]
- Sharma MC, Sharma S, Sharma P, Kumar A. Molecular modeling and pharmacophore approach for structural requirements of some 2-substituted-1-naphthols derivatives as potent 5-lipoxygenase inhibitors. Med Chem Res. 2013;22(11):5390–5407. doi: 10.1007/s00044-013-0499-2. [DOI] [Google Scholar]
- Smith I. Mycobacterium tuberculosis pathogenesis and molecular determinants of virulence. Clin Microbiol Rev. 2003;16(3):463–496. doi: 10.1128/CMR.16.3.463-496.2003. [DOI] [PMC free article] [PubMed] [Google Scholar]
- Studio D. version 2.5. San Diego: Accelrys Inc; 2009. [Google Scholar]
- Sweeney JB. Alcohols, ethers and phenols. Contemp Org Syn. 1997;4(6):435–453. doi: 10.1039/co9970400435. [DOI] [Google Scholar]
- Trott O, Olson AJ. AutoDock Vina: improving the speed and accuracy of docking with a new scoring function, efficient optimization, and multithreading. J Comput Chem. 2010;31(2):455–461. doi: 10.1002/jcc.21334. [DOI] [PMC free article] [PubMed] [Google Scholar]
- Umar Lule S, Xia W. Food phenolics, pros and cons: a review. Food Rev Int. 2005;21(4):367–388. doi: 10.1080/87559120500222862. [DOI] [Google Scholar]
- VLife M 3.5 . Molecular design suite. Pune: Vlife Sciences Technologies Pvt. Ltd.; 2008. [Google Scholar]
Associated Data
This section collects any data citations, data availability statements, or supplementary materials included in this article.
Supplementary Materials
Figure S1. Test set of radar plot describing closeness between the actual and predicted activity of the test set compounds (A), training set of radar plot describing closeness between the actual and predicted activity of the compounds for the training set (B). Figure S2. Molecular docking interaction β-CA1 compound 6A (A), complex of compound 12 and compound 15 (B and C), same complexes 2D plot of H-bond representing (D, E and F) respectively. Figure S3. The docking result of another binding pocket of β-CA1 that carried least binding energy, i.e., compound D17 (A) and compound D27 (B) along with 2D plot ( C and D), respectively. Figure S4. Secondary structural changes were calculated as native β-CA1 (A), β-CA1-6A complex (B), β-CA1-6B complex (C), β-CA1-12 complex (D), β-CA1-15 complex (E), β-CA1-D25 complex (F), β-CA1-D50 complex (G), and β-CA1-INH complex (H). Figure S5. 2D projection graph plotted between eigenvector 1 vs eigen vector 2 for the conformational space through the covariance matrix (A), graph plotted between comparison vec 1 and vec 2 vs atomic fluctuations (B and C), and comparison of eigen values (nm2) plotted against the corresponding eigen vector index of the backbone by covariance matrix for the β-CA1 and its complexes (D). Same color scheme is applicable to all figures (PPTX 6788 KB)


