Abstract
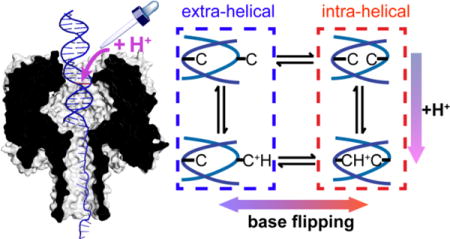
Measurement of single-molecule reactions can elucidate microscopic mechanisms that are often hidden from ensemble analysis. Herein, we report the acid-base titration of a single DNA duplex confined within the α-hemolysin (α-HL) nanopore for up to 3 h, while monitoring the ionic current through the nanopore. Modulation between two states in the current-time trace for duplexes containing the C:C mismatch in proximity to the latch constriction of α-HL is attributed to the base flipping of the C:C mismatch. As the pH is lowered, the rate for the C:C mismatch to flip from the intra-helical state to the extra-helical state (kintra-extra) decreases, while the rate for base flipping from the extra-helical state to the intra-helical state (kextra-intra) remains unchanged. Both kintra-extra and kextra-intra are on the order of 10−2 s−1 to 10−1 s−1 and remain stable over the timescale of the measurement (several hours). Analysis of the pH-dependent kinetics of base flipping using a hidden Markov kinetic model demonstrates that protonation/deprotonation occurs while the base pair is in the intra-helical state. We also demonstrate that the rate of protonation is limited by transport of H+ into the α-HL nanopore. Single-molecule kinetic isotope experiments exhibit a large kinetic isotope effect (KIE) for kintra-extra (kH/kD ~ 5) but a limited KIE for kextra-intra (kH/kD ~ 1.2), supporting our model. Our experiments correspond to the longest single-molecule measurements performed using a nanopore, and demonstrate its application in interrogating mechanisms of single-molecule reactions in confined geometries.
TOC image
INTRODUCTION
Herein, we report single-molecule acid-base titration of dsDNA inside an α-HL nanopore as a means to probe the mechanism and kinetics of base protonation. Acid-base reactions are important in DNA replication, modification, and repair.1–3 Computational studies and bulk solution NMR experiments have been used to study energetics and dynamics of proton transfer reactions involving DNA.4–5 However, in its natural state, DNA is often present in a highly confined and complex environment, where acid-base reactions may proceed by different mechanisms and at different rates than those observed in bulk solution. The physical behavior of DNA and how it is recognized by proteins is also altered under confinement (i.e., crowding).6–7 These observations highlight that analyses of DNA under confined conditions may provide insights that are not accessible by bulk solution experimental methods.
One key mechanism in protein-DNA interactions is base flipping, i.e., extrusion of a base out of the helix of dsDNA. Base flipping may be affected by the acid-base chemistry of the base. For instance, a cytosine:cytosine (C:C) mismatch in a DNA duplex can undergo protonation/deprotonation during base flipping, as shown in Scheme 1. The acid-base chemistry of the base in the confinement of the protein environment is of great significance in base recognition, modification, and repair,1–2, 8–10 especially whether protonation/deprotonation of the base requires the base to flip out of helix.
Scheme 1.
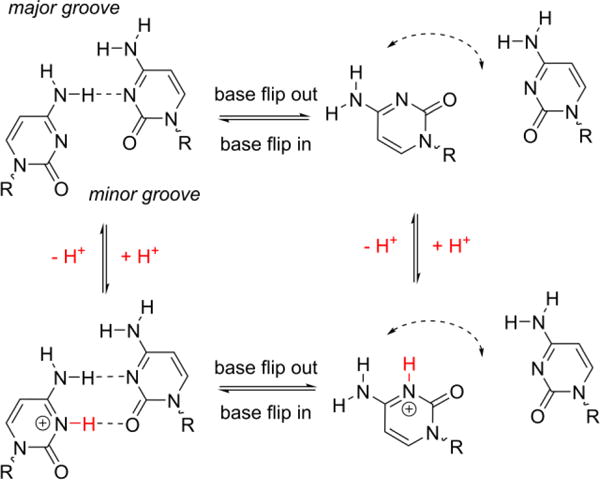
Base flipping and protonation/deprotonation of a C:C mismatch in DNA.
Single-molecule measurements provide an attractive way to measure reaction dynamics and confinement effects. Measurement at the single-molecule level can reveal hidden intermediates and pathways of reactions that are often averaged out in ensemble measurements.11 However, the stochastic nature of single-molecule measurements require extensive sampling for accurate quantification. Therefore, interrogating the dynamics of a single molecule for an extended period inside a nanoreactor is highly desirable in order to accurately study the effect of confinement.
Protein nanopores, such as α-HL, have been utilized for single-molecule analysis of DNA because of their highly reproducible structures having a pore dimension comparable to a DNA molecule.12–14 The timescales of interaction of a DNA molecule with a nanopore in ion channel measurements are typically between ~10−4 to several seconds and are associated with fast translocation of ssDNA and slower unzipping or escape via thermal motion of dsDNA and hairpin DNA.15–18 During the past year, we have developed methods to capture and hold a single dsDNA molecule inside the α-HL nanopore for extended periods of time, up to several hours. Such long observations of a single dsDNA molecule allow systematic investigations of its reactivity in a confined geometry.
Herein, we investigate the acid-base chemistry during base flipping of a C:C mismatch in a single DNA duplex in a confined environment. Spontaneous base flipping is measured from the two-state modulation of ionic currents when the DNA is captured inside the α-HL protein nanopore. From the kinetics of base flipping as a function of pH, the protonation rate of DNA inside the protein can be obtained based on a proposed hidden Markov model. These measurements reveal whether protonation occurs within the intra-helical or extra-helical state, an unanswered question from ensemble measurements. To the best of our knowledge, the experimental methodology reported here allows for the longest nanopore measurements on a single DNA molecule, and thus provide significant advantages for probing single-molecule reactions in confinement. Our results also demonstrate the power of single-molecule trapping in discovering hidden reaction mechanisms.
RESULTS AND DISCUSSION
Current fluctuation reveals base flipping of C:C mismatch
The 23-bp DNA duplex we studied is a section of the KRAS containing the mutation prone codon 12 that underlies in many diseases.19 A 24-nt poly-dT tail is attached to one strand of the duplex, which facilitates the electrophoretic capture and positioning of the DNA inside the protein channel. The duplex part of the DNA is fully complementary except for a C:C mismatch at the 9th position counting from the 3’ end of the shorter strand of the duplex (see Figure 1 for the DNA sequence).
Figure 1.
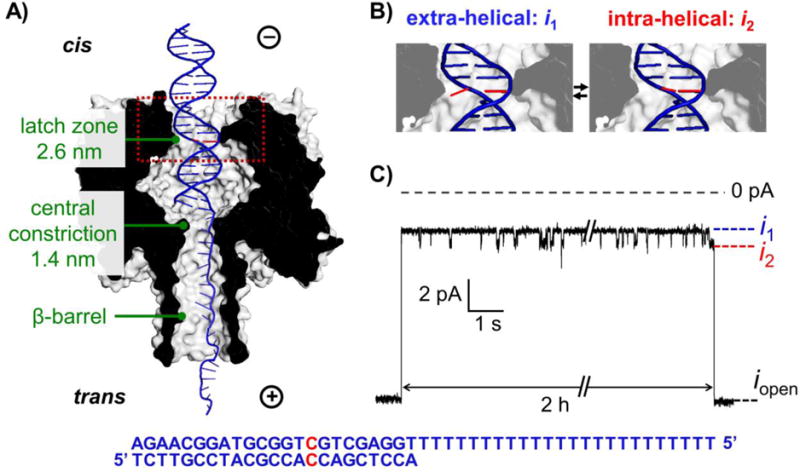
A) Schematic of dsDNA with a C:C mismatch captured in α-HL. The C:C mismatch is shown in red. B) Zoomed view of the C:C mismatch at the extra-helical (i1) and intra-helical (i2) states within the cavity of α-HL. C) The initial and terminating segments of a 2-hour long i-t trace corresponding to a single dsDNA molecule inside the protein channel. iopen corresponds to the open channel state; i1 and i2 correspond to dsDNA with the C:C mismatch in the extra-helical and intra-helical states, respectively. The sequence of the dsDNA is shown at the bottom.
The α-HL nanopore possesses a latch zone (2.6 nm diameter) on the cis side, which allows the entrance of both ssDNA and dsDNA. The constriction zone at the center of the channel (1.4 nm in diameter), however, only allows ssDNA but not dsDNA to translocate. Therefore, the poly-dT tail of the DNA can be threaded through the β-barrel of the protein, while the duplex part of the DNA is positioned in the vestibule above the central constriction zone, aligning the C:C mismatch located 9 bases from the 3’ end of the short complementary strand in proximity to the latch zone (Figure 1A).20 The latch zone of α-HL is very sensitive to modification of the DNA bases and can be utilized for measuring the conformational changes of the base (e.g., base flipping).21–23
For a typical experiment, an open channel current (iopen) is first observed once the protein channel is reconstituted into the lipid bilayer. A dsDNA molecule with a tail is electrophoretically driven into the pore at an applied voltage of -70 to -120 mV (cis to trans). Once captured, the blockade current for DNA with a C:C mismatch at the latch zone exhibits two states, i1 and i2, as shown in Figure 1C, which we have previously assigned to base flipping. This assignment of the two-state current response to base flipping is supported by the observation that the average lifetime of each state does not change with variations in the applied voltage (Figure S1), indicating that the fluctuation between i1 and i2 is not due to vertical motion of the molecule inside the pore. Additionally, the timescales of the current switching between the two states (10 to 100 ms) are consistent to kinetic measurements of base flipping probed by fluorescence and NMR methods.5, 24 Finally, the two-state current response is not observed when the C:C mismatch is moved away from position 9.23
The deeper blocking state (i1/iopen ~0.28) was previously determined to correspond to the extra-helical state of the C:C mismatch, which is consistent with this conformation occupying a larger volume, resulting in a lower ionic current.23 The less blocking state (i2/iopen ~0.33) was attributed to the intra-helical state by analogy (see Figures 1B and 1C).10 By measuring the distribution of the durations of intra-helical and extra-helical states, the kinetics of base flipping can be obtained from the single-molecule experiment.
The assignment of the current levels i1 and i2 to the extra- and intra-helical states is supported by several additional lines of evidence. First, when a fully complementary sequence is captured in the pore (C:G instead of C:C at the 9th position) such that the intra-helical state is strongly favored, only one current level is observed with a blockage level (iblock/iopen ~0.33); this value is very close to that of the i2 state for a C:C mismatch.23 This finding indicates that modulation in the current results from the base pairs, and the i2 state for a C:C base pair is likely to take a conformation similar to a C:G base pair, as previously noted in the literature.23 Second, a positive ΔS for the transition from i2 to i1 is observed from the temperature-dependent single-molecule kinetics (Figure S2 and Table S1), as expected if i2 corresponds to a more ordered intra-helical state.
Prolonged single-molecule trapping allows accurate measurement of pH-dependent base-flipping
A C:C mismatch can be singly protonated at near physiological pH (hemiprotonated C:C, pKa ~ 6.95),25 which stabilizes the intra-helical state via formation of an additional hydrogen bond (see Scheme 1). Therefore, a duplex with a C:C mismatch can serve as a model molecule to probe the acid-base chemistry within the nanopore. In order to perform an acid-base titration on a single molecule, it is necessary to trap the target molecule for extended periods. Prolonged measurements can not only decrease the “noise” from the stochastic nature of the single-molecule reaction, but also extend the timescale for measuring slow reactions and for the addition of reagents to perform reactions on the trapped dsDNA.
Typical measurements of a single DNA duplex inside the nanopore last between tens of millisecond to a few seconds.17, 26 This dwell time of DNA inside the pore is controlled by two processes: DNA can either diffuse from the cis side back into the bulk solution or unzip and translocate to the trans side. Both processes are affected by the electric force on the DNA; escape by diffusion increases at lower voltages, while unzipping rates increase at higher voltage.15 Therefore, we optimized the applied voltage for prolonged measurements. When the voltage decreases from -120 to -70 mV (cis vs trans), the dwell time of the DNA duplex inside the protein channel increases by three orders of magnitude (from seconds to hours) due to a decrease in the unzipping rates, as shown in Figure S3. At voltages lower than -70 mV, the dwell time of DNA decreases due to diffusion back to the cis side solution. Therefore, -70 mV was chosen as the optimal voltage for prolonged measurement of a C:C mismatch. Note that the kinetics of base flipping of a C:C mismatch are unaffected by the different applied voltages (Figure S1).
A sample i-t trace for a single molecule captured in the protein channel for ~2.8 h is shown in Figure 2A. Once the DNA is inside the pore, the ionic current fluctuates between two distinct levels, reflecting the spontaneous base flipping of a C:C mismatch as depicted in Figure 1B. The dwell time distributions for both the intra-helical and extra-helical states are well fitted by mono-exponential distributions, indicating apparent first-order transitions between the two states (Figures 2B and 2C). Note that the histogram is log-binned, which is superior in displaying and fitting of mono- and multi-exponential distributions.27 Also, note that the distributions comprise 81,657 and 81,658 observations, respectively, of intra-helical and extra-helical state transitions of a single dsDNA molecule. The peak positions in the log-binned histogram for a multi-exponential distributions coincide with the lifetimes (τ) of the intra-helical and extra-helical states (see Figure S4 and discussion in supporting information). As demonstrated in Figure 2D, base flipping is continuously observed and stable over the whole 2.8 h period during which i-t data are recorded.
Figure 2.
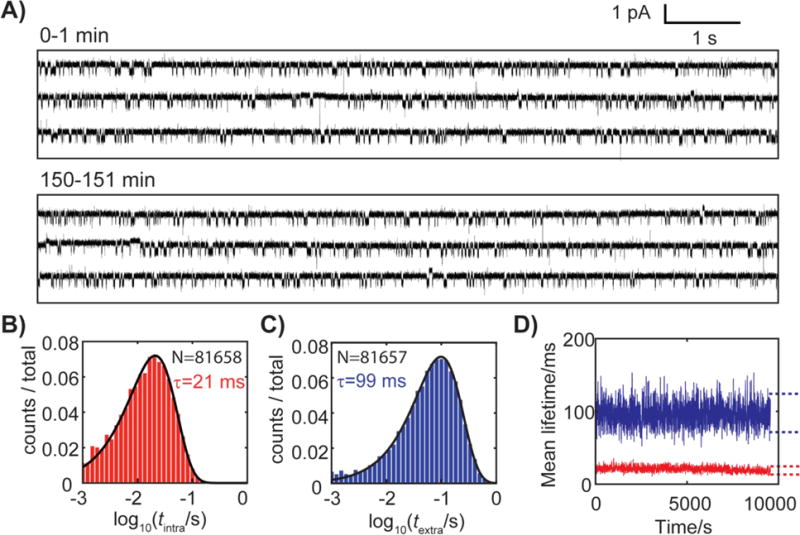
A) i-t trace for a dsDNA with a C:C mismatch captured in the α-HL nanopore at -70 mV and 20 °C. The molecule was held in the nanopore for ~2.8 h. Representative 1-minute traces recorded at the beginning and at 150 min of the experiment are shown. The electrolyte solution contains 250 mM KCl and 10 mM PB (pH 7.0). Log-binned dwell time histograms for B) intra-helical and C) extra-helical states of a C:C mismatch, from which state lifetimes (τ) are extracted. The black lines are best fits assuming mono-exponential distributions. D) Stability of the lifetimes of the extra-helical (blue) and intra-helical (red) state for a single dsDNA molecule captured for ~2.8 h. Each τ point in Figure 2D (not resolvable on the figure scale) is an average of 100 consecutive events (~15 s). Dashed lines are 99% confidence intervals for the average of 100 exponential random variables.
The same trapping experiment was performed on different DNA molecules in solutions in which the pH was adjusted from 6.0 to 7.5. As shown in Figure 3A, the lifetime of intra-helical states becomes significantly longer as the pH decreases. Moreover, both the intra-helical and extra-helical states exhibit single characteristic lifetimes (i.e., durations obey mono-exponential distributions), indicating apparent first-order transitions between intra-helical and extra-helical states at all pH values (Figure S5). The lifetime of the intra-helical states ( intra) increased ~5 times as the pH decreased from 7.5 to 6.0, while the lifetime of the extra-helical states ( extra) remained essentially unchanged (Figure 3B). At each pH, the kinetics of base flipping are stable over the time period (hours) that the duplex DNA spent inside the channel (Figure S6). Note that the dwell time of the DNA (i.e., hours) inside the channel sets the slowest measurable kinetic rate for a single molecule at ~1×10⁻⁴ s−1, approximately 5-orders of magnitude slower than that for base flipping kinetics.
Figure 3.
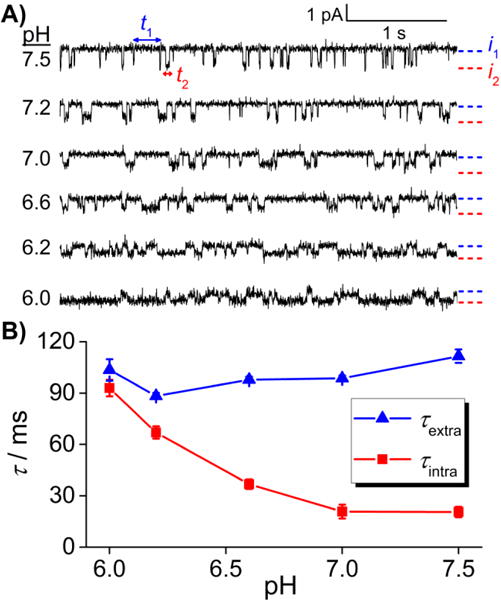
Effect of pH on the intra-helical and extra-helical lifetimes. A) Sample i-t traces for different single molecules of dsDNA in the α-HL nanopore as a function of pH (6.0 – 7.5). Data were recorded at -70 mV and 20 °C. The solution contains 250 mM KCl and 10 mM phosphate buffer. B) Intra-helical (red) and extra-helical (blue) lifetimes of a C:C mismatch as a function of pH.
The increase in the intra-helical lifetime at lower pH is explained by the formation of a protonated C:C mismatch (Scheme 1), which stabilizes the intra-helical state by forming a second hydrogen bond. The fact that the distribution of the intra-helical duration at each pH is described by a single characteristic lifetime, as opposed to multiple lifetimes, while the lifetime is affected by pH provides hints about the kinetics of the protonation reaction. If the protonation/deprotonation reactions were slow and the measurement was long enough, two characteristic lifetimes would be expected in the dwell time distribution of the intra-helical states, with the longer one reflecting the protonated C:C mismatch and the shorter one reflecting the deprotonated C:C mismatch. In other words, the dwell time distribution would be the sum of two mono-exponential distributions, with the weight of each distribution determined by the pH and the pKa of the C:C mismatch. However, we do not observe two lifetimes for the intra-helical states at all pH values studied, indicating the rates for the protonation and deprotonation reactions are fast compared to the base flipping kinetics.
Titration of single captured molecule
While the above nanopore measurement at different pH conditions clearly demonstrates the dependence of base flipping on protonation/deprotonation (Figure 3), it is not apparent whether the proton exchange occurs inside the nanopore or in bulk solution, especially given the limited space for proton access when a DNA occupies the pore. To address this question, we performed an acid-base titration on a single molecule of DNA with a C:C mismatch while it is captured inside the nanoreactor. In agreement with the measurement at different pH values using different dsDNA molecules (Figure 3), the titration of a single molecule indicates that the intra-helical lifetime of an individual molecule held in confinement also increases at lower pH; similarly, the extra-helical lifetime remains unchanged with dsDNA in confinement (Figure 4). Such a pH response from the single-molecule titration immediately confirms that protons can enter the pore even when the presence of dsDNA is obstructing the entrance into the channel. The change in base flipping kinetics is most significant when the pH changes from 6.5 to 6.0, and these pH-induced changes are reversible on the same molecule. During the titration, we do observe a delay (several minutes) between the addition of titrant and the change in base flipping kinetics resulting from the time required for solution mixing (see Figure S7 for the raw i-t traces during the titration). The pH-dependent base flipping kinetics have been observed in three independent single-molecule titration experiments.
Figure 4.
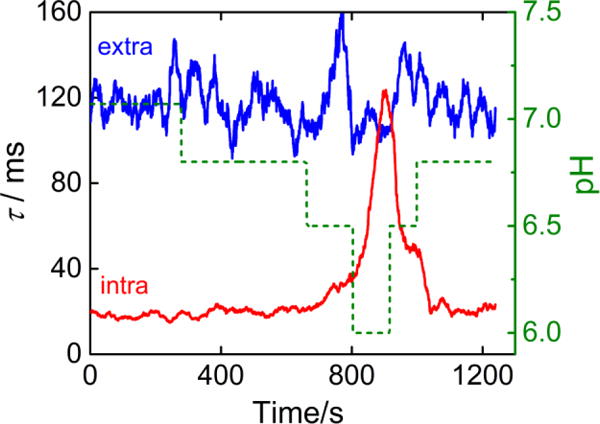
Lifetimes of the extra-helical (blue) and intra-helical (red) states during the titration of a single captured dsDNA molecule in the α-HL nanopore. Lifetimes are obtained every 15 s. The solution pH is indicated by the green dashed line (right axis).
Simulation of protonation/deprotonation kinetics using a hidden Markov model
A hidden Markov model was used to analyze the pH-dependent kinetics of the base flipping (Figure 5A), in order to determine which state (extra- vs intra-helical, or both) undergoes base protonation/deprotonation and to extract quantitative protonation and deprotonation rates. This model contains four states as the C:C mismatch can be protonated or deprotonated at either the intra-helical or extra-helical states. Experimentally, we observe two distinguishable states, indicating that some states in the 4-state model are “hidden”. In our model, transitions between intra-helical and extra-helical states (horizontal transitions in Figure 5A) are associated with transitions in the current blockade between i1 and i2, while the protonation and deprotonation reactions (vertical transitions in Figure 5A) displays no changes in the current level. This result suggests that base flipping and a corresponding large change in conformation of the dsDNA molecule at the latch zone of αHL has a larger influence on the observable ion current than the protonation of a base pair. Based on this model, we performed Monte Carlo simulations to first generate a state-time trace with all four “hidden” states, which are then grouped based on the configuration of the C:C mismatch (intra-helical vs extra-helical) to generate simulated i-t traces (Figure 5B). The details of the model and simulation methods are outlined in the supporting information.
Figure 5.
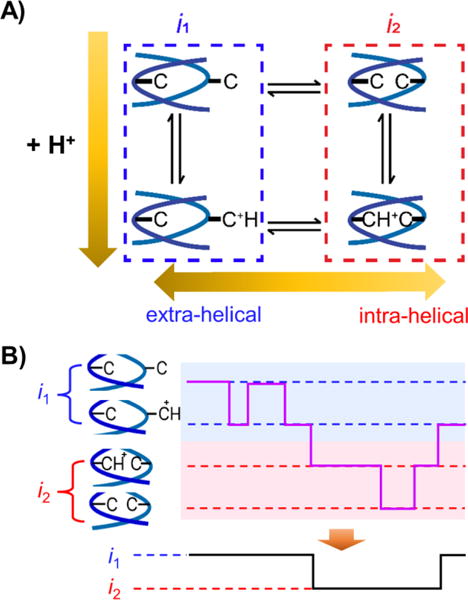
A) Hidden Markov kinetic model proposed for the pH-dependent base flipping of a C:C mismatch. B) Illustration of generating a 2-state current from the hidden Markov model.
Kinetic parameters for base flipping and protonation/deprotonation are obtained by comparing the dwell time histograms between simulation and experiment at all pH values (Table 1, see details of optimization in supporting information). The simulated i-t traces with optimized parameters at different pH values are shown in Figure 6A; except for the absence of noise, these closely resemble the experimental traces and pH dependence shown in Figure 4A. The histograms of the intra-helical and extra-helical durations from the simulation also match those from experiments (Figure 6B). The simulated i-t traces and corresponding dwell time histograms at other pH values are shown in Figures S9 and S10.
Table 1.
Optimized kinetic parameters for base flipping of C:C mismatch based on the proposed 4-state model.
| Parameter | Value | |
|---|---|---|
|
|
<0.1 s−1 | |
|
|
10 s−1 | |
|
|
63 s−1 | |
|
|
10 s−1 | |
|
|
>2×10⁸ M−1 s−1 | |
|
|
<5.5 | |
|
|
>2 ×10⁸ M−1 s−1 | |
|
|
6.7 |
Figure 6.
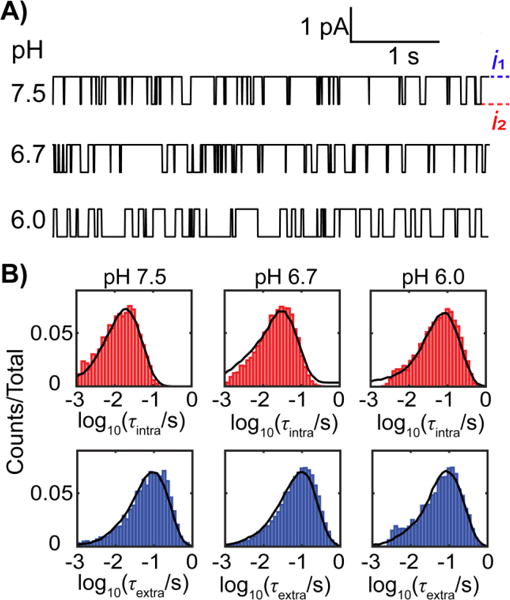
A) Sample simulated i-t traces over a 10-s period for base flipping at different pH. B) Comparison of dwell time distribution between experiment (bars) and simulation (black lines) for the intra-helical state (top red) and the extra-helical state (bottom blue).
Although the above method involves the fitting of 7 independent parameters (the 8th is determined by the constraint of the square scheme), the number of parameters can be reduced to 4 by simplifying the model, as described here. From the parameters obtained in the 4-state model (Table 1), it is realized that the protonated extra-helical state in our 4-state model (Figure 5A) is not important because this state is rarely visited. One route to the protonated extra-helical state involves flipping-out of the protonated base, the kinetics of which is relatively slow (< 0.1 s−1), which is expected from the stabilizing effect of the additional H-bond after protonation (Scheme 1). The other route involves protonation of the extra-helical states, but this process also is unlikely to occur in the pH ranges investigated (6.0 – 7.5) given the low pKa of the extra-helical C:C ( <5.5). Indeed, we can also fit the experimental data using a 3-state model involving only 4 parameters (Figure S11), and best-fit estimates of the kinetic parameters from the simplified 3-state model (Table S4) are in good agreement with those in Table 1 for the complete 4-state model.
To further validate our model and probe the mechanism of protonation/deprotonation, we performed single-molecule kinetic isotope experiments. Example i-t traces in H2O and D2O are shown in Figure 7 (extended i-t traces are shown in Figure S12). A primary kinetic isotope effect (KIE) was observed for the base flipping out (kH/kD~5), while a limited KIE is observed for base flipping in (kH/kD~1.2) at two pH/pD levels (6.0 and 7.2, see measured rates of base flipping in Table S5). The large KIEs for the intra- to extra-helical transitions suggest that base flipping out of the helix involves breaking of a deuterium bond in the transition state. This is in agreement with our proposed model and the assignment of the states (Figure 5A), as the base flipping out requires breaking of a N-D bond when the C:C mismatch is singly protonated. Note that one advantage of the single-molecule kinetic isotope experiment is that KIE can be observed even if the step involved is not rate limiting, in contrast to bulk kinetic isotope experiment.28
Figure 7.
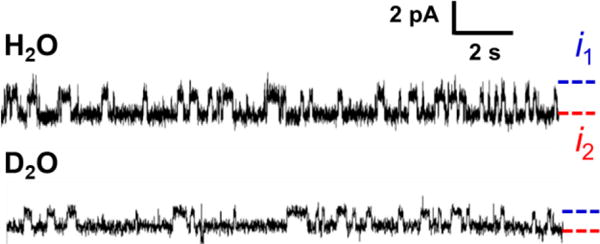
i-t traces for dsDNA with the C:C mismatch in H2O and D2O. The solution contained 0.25 M KCl and 10 mM phosphate at pH/pD 6.0. Data were collected at -70 mV and 20 °C.
The protonation rate (kp) obtained from our analysis is fast (>2 ×10⁸ M−1 s−1). Assuming the time-average pH inside the pore is the same as the outside, this kp corresponds to >36% of the transport-limited rate based on the calculated proton flux through the pore (56 H+ per sec at pH 7.0, see Table S3). Note that any slower kp results in significant errors in fitting the simulated distribution of intra-helical durations (Figures S13-S15); thus, we have significant confidence in this value. It should be pointed out that kp is an apparent rate constant and does not explicitly account for the residence time and the instantaneous H+ concentration inside the pore. The residence time (tres) of a single H+ in the channel can be estimated to be ~4 ns based on tres = E/μ. Here, E = 7 × 10⁶ V/m is the electric field across the nanopore (assuming a linear potential drop and therefore E = V/d, where V = 70 mV is the applied voltage, d=10 nm is the channel length), and assume the bulk value for the electrophoretic mobility of H+ of μ = 3.6 × 10⁻⁷ m2 s−1 V−1. The concentration of H+ in the pore, when a single H+ resides in the pore, can be estimated from the total number of ions in the channel. Assuming ~30% blockade from the DNA in the pore is caused by ~70% reduction in the number of ions in the pore, the DNA occupied channel contains ~15 mobile ions (based on a reported value of ~50 ions in an open channel).29–30 This corresponds to an effective H+ concentration of ~0.03 M, assuming one proton residing in the pore and the ionic strength inside the pore remains at ~0.25 M. Together with the protonation probability of >0.36 obtained from our model, the instantaneous kp is estimated to be >1 × 10⁹ M−1 s−1, which is comparable to the kp for heterocycle nitrogenous bases in bulk solution (109-1010 M−1 s−1).31
The pKa of intra-helical C:C mismatch ( ) is more than 1 pH unit higher than that of the extra-helical C:C ( ). This can be explained by several factors. First, the additional H-bonding from the protonation lowers the free energy of the protonated form of C:C, effectively raising the . In addition, the low dielectric environment inside the helix has been reported to raise the pKa of base pairs.32 Indeed, the we obtained for C:C is closer to a free cytosine (pKa ~4.2) than the .
This near physiological and lower for C:C in the confinement suggests that protonation/deprotonation is predominately occurring while the base pair is inside the helix. Note that this acid-base chemistry for intra-helical C:C is necessary when comparing simulations with experiments (Figure S16). The mechanism of intra-helical protonation/deprotonation of a DNA base pair is an alternative pathway to the commonly proposed one where proton exchange with bases requires their opening.33 This protonation/deprotonation mechanism has significant implications in many important physiological processes for protein-DNA interactions, including replication, modification and repair.34–36 Our results suggest that when DNA is bound to an enzyme, reaction with a base without opening of the base pair is possible, which might be an important step in DNA recognition, modification or repair. The obtained in our confined geometry is close to the pKa of a C:C obtained in bulk ensemble measurements (6.95, by NMR),25 suggesting that the proton exchange measured in the bulk is likely to reflect the acid-base chemistry of bases in an intra-helical state. However, the protonation mechanism is hidden in the bulk measurements.
The N3 of cytosine can be protonated from two potential pathways. The proton could either come directly from the minor groove to N3 of cytosine, or the proton transfer could be assisted by the exocyclic amine group (N4) that is accessible from the major groove. There is less access to the C:C mismatch from the minor groove, favoring a proton transfer process from the major groove. In our measurement, the observed transport limited protonation rate for a base inside the helix is fast considering the barrier created by the helix. This suggests that the transfer mechanism might involve proton tunneling,37 which is supported by the large observed KIE. However, the exact pathway for the proton transfer will require further investigation.
Our study of the single-molecule reaction in nano-confinement demonstrates many advantages over bulk measurements. First, the single-molecule experiment here demonstrates the unique ability to discover a hidden mechanism of protonation/deprotonation without requiring the base to flip out, which may be very important in DNA recognition and catalysis by proteins.38 In addition, fast protonation kinetics (near transport limited) inside the protein channel can be measured by interrogation of the pH-dependent kinetics of base flipping. Thirdly, the long term trapping of a free single molecule allows the reaction to be performed on a single molecule, which provides a mimetic way to study the solvent/ion access to the catalytic center of enzymes.
In conclusion, we report the long-term trapping of a single molecule of a dsDNA with a C:C mismatch inside the α-HL nanopore, which allows the titration of a single molecule of dsDNA to be performed. The kinetics of base flipping between the intra-helical and extra-helical states for a single molecule under nano-confinement are stable over several hours. In addition, the pH-dependent single-molecule kinetics of base flipping is accurately studied, and a hidden Markov model is proposed to determine the kinetics of the protonation/deprotonation reaction of a C:C mismatch by comparing the experimental results with Monte Carlo simulations. The protonation and deprotonation are likely to occur at the intra-helical state at physiological pH, and the rate of protonation is mass transport limited inside the pore. The ability to capture the molecule for extended periods of time and perform the chemical reaction on the molecule can add another dimension in the differentiation of single molecules by their reactivity (kinetics) of the nanopore experiment. On the other hand, capturing a single molecule inside a nanoreactor also provides an experimental tool to study the effect of confinement on single-molecule reactions. In such confinement, protonation and deprotonation of base pair at intra-helical state can be distinguished, providing evidence for a hidden acid-base mechanism that is relevant for DNA recognition and enzyme catalysis.
Supplementary Material
Acknowledgments
This works is supported by NIH (R01 GM093099). The authors thank Dr. Robert P. Johnson for helpful discussions. The authors also thank Electronic BioSciences Inc. (San Diego, CA) for the ion-channel recording instrument and software.
Footnotes
Experimental section; voltage- and temperature- dependent base flipping kinetics; optimization of residence time of ds-DNA inside the protein channel; log-binned histograms for determining lifetimes; Prolonged measurement of base flipping; single-molecule titrations; details on the simulation using a hidden Markov model; kinetic isotope effect on base flipping; protonation rate and mechanism from hidden Markov simulation (PDF).
Notes
The authors declare no competing financial interests.
References
- 1.Dalhus B, Laerdahl JK, Backe PH, Bjørås M. FEMS Microbiol Rev. 2009;33(6):1044–1078. doi: 10.1111/j.1574-6976.2009.00188.x. [DOI] [PubMed] [Google Scholar]
- 2.Pechlaner M, Donghi D, Zelenay V, Sigel RKO. Angew Chem Int Ed. 2015;54(33):9687–9690. doi: 10.1002/anie.201504014. [DOI] [PubMed] [Google Scholar]
- 3.Ward WL, Plakos K, DeRose VJ. Chem Rev. 2014;114(8):4318–4342. doi: 10.1021/cr400476k. [DOI] [PMC free article] [PubMed] [Google Scholar]
- 4.Hobza P, Šponer J. Chem Rev. 1999;99(11):3247–3276. doi: 10.1021/cr9800255. [DOI] [PubMed] [Google Scholar]
- 5.Bhattacharya PK, Cha J, Barton JK. Nucleic Acids Res. 2002;30(21):4740–4750. doi: 10.1093/nar/gkf601. [DOI] [PMC free article] [PubMed] [Google Scholar]
- 6.Kang H, Toan NM, Hyeon C, Thirumalai D. J Am Chem Soc. 2015;137(34):10970–10978. doi: 10.1021/jacs.5b04531. [DOI] [PubMed] [Google Scholar]
- 7.Shvets AA, Kolomeisky AB. J Phys Chem Lett. 2016;7(13):2502–2506. doi: 10.1021/acs.jpclett.6b00905. [DOI] [PubMed] [Google Scholar]
- 8.Hong S, Cheng X. DNA Methyltransferases-Role and function. Springer; 2016. DNA Base Flipping: A General Mechanism for Writing, Reading, and Erasing DNA Modifications; pp. 321–341. [DOI] [PMC free article] [PubMed] [Google Scholar]
- 9.Sancar A, Lindsey-Boltz LA, Unsal-Kacmaz K, Linn S. Annu Rev Biochem. 2004;73:39–85. doi: 10.1146/annurev.biochem.73.011303.073723. [DOI] [PubMed] [Google Scholar]
- 10.Brown T, Leonard GA, Booth ED, Kneale G. J Mol Biol. 1990;212(3):437–440. doi: 10.1016/0022-2836(90)90320-L. [DOI] [PubMed] [Google Scholar]
- 11.Lee J, Bayley H. Proc Natl Acad Sci U S A. 2015;112(45):13768–13773. doi: 10.1073/pnas.1510565112. [DOI] [PMC free article] [PubMed] [Google Scholar]
- 12.Kasianowicz JJ, Brandin E, Branton D, Deamer DW. Proc Natl Acad Sci U S A. 1996;93(24):13770–13773. doi: 10.1073/pnas.93.24.13770. [DOI] [PMC free article] [PubMed] [Google Scholar]
- 13.Howorka S, Cheley S, Bayley H. Nat Biotechnol. 2001;19(7):636–639. doi: 10.1038/90236. [DOI] [PubMed] [Google Scholar]
- 14.Deamer D, Akeson M, Branton D. Nat Biotechnol. 2016;34(5):518–524. doi: 10.1038/nbt.3423. [DOI] [PMC free article] [PubMed] [Google Scholar]
- 15.Lathrop DK, Ervin EN, Barrall GA, Keehan MG, Kawano R, Krupka MA, White HS, Hibbs AH. J Am Chem Soc. 2010;132(6):1878–1885. doi: 10.1021/ja906951g. [DOI] [PMC free article] [PubMed] [Google Scholar]
- 16.Mathé J, Aksimentiev A, Nelson DR, Schulten K, Meller A. Proc Natl Acad Sci U S A. 2005;102(35):12377–12382. doi: 10.1073/pnas.0502947102. [DOI] [PMC free article] [PubMed] [Google Scholar]
- 17.Sauer-Budge AF, Nyamwanda JA, Lubensky DK, Branton D. Phys Rev Lett. 2003;90(23):238101. doi: 10.1103/PhysRevLett.90.238101. [DOI] [PubMed] [Google Scholar]
- 18.Ding Y, Fleming AM, White HS, Burrows CJ. J Phys Chem B. 2014;118(45):12873–12882. doi: 10.1021/jp5101413. [DOI] [PMC free article] [PubMed] [Google Scholar]
- 19.Pfeifer GP, Besaratinia A. Hum Genet. 2009;125(5):493–506. doi: 10.1007/s00439-009-0657-2. [DOI] [PMC free article] [PubMed] [Google Scholar]
- 20.Jin Q, Fleming AM, Johnson RP, Ding Y, Burrows CJ, White HS. J Am Chem Soc. 2013;135(51):19347–19353. doi: 10.1021/ja410615d. [DOI] [PMC free article] [PubMed] [Google Scholar]
- 21.Ding Y, Fleming AM, White HS, Burrows CJ. ACS Nano. 2015;9(11):11325–11332. doi: 10.1021/acsnano.5b05055. [DOI] [PMC free article] [PubMed] [Google Scholar]
- 22.Johnson RP, Fleming AM, Perera RT, Burrows CJ, White HS. J Am Chem Soc. 2017;139(7):2750–2756. doi: 10.1021/jacs.6b12284. [DOI] [PMC free article] [PubMed] [Google Scholar]
- 23.Johnson RP, Fleming AM, Beuth LR, Burrows CJ, White HS. J Am Chem Soc. 2016;138(2):594–603. doi: 10.1021/jacs.5b10710. [DOI] [PMC free article] [PubMed] [Google Scholar]
- 24.Yin Y, Yang L, Zheng G, Gu C, Yi C, He C, Gao YQ, Zhao XS. Proc Natl Acad Sci U S A. 2014;111(22):8043–8048. doi: 10.1073/pnas.1400667111. [DOI] [PMC free article] [PubMed] [Google Scholar]
- 25.Boulard Y, Cognet JA, Fazakerley GV. J Mol Biol. 1997;268(2):331–347. doi: 10.1006/jmbi.1997.0975. [DOI] [PubMed] [Google Scholar]
- 26.Jin Q, Fleming AM, Burrows CJ, White HS. J Am Chem Soc. 2012;134(26):11006–11011. doi: 10.1021/ja304169n. [DOI] [PMC free article] [PubMed] [Google Scholar]
- 27.Colquhoun D, Sigworth F. Single-Channel Recording. Springer; 1995. Fitting and Statistical Analysis of Single-Channel Records; pp. 483–587. [Google Scholar]
- 28.Lu S, Li W-W, Rotem D, Mikhailova E, Bayley H. Nat Chem. 2010;2(11):921–928. doi: 10.1038/nchem.821. [DOI] [PubMed] [Google Scholar]
- 29.Noskov SY, Im W, Roux B. Biophys J. 2004;87(4):2299–2309. doi: 10.1529/biophysj.104.044008. [DOI] [PMC free article] [PubMed] [Google Scholar]
- 30.Aksimentiev A, Schulten K. Biophys J. 2005;88(6):3745–3761. doi: 10.1529/biophysj.104.058727. [DOI] [PMC free article] [PubMed] [Google Scholar]
- 31.Eigen M. Angew Chem Int Ed. 1964;3(1):1–19. [Google Scholar]
- 32.Zacharias M, Sklenar H. J Mol Biol. 1999;289(2):261–275. doi: 10.1006/jmbi.1999.2760. [DOI] [PubMed] [Google Scholar]
- 33.Gueron M, Kochoyan M, Leroy J-L. Nature. 1987;328(6125):89–92. doi: 10.1038/328089a0. [DOI] [PubMed] [Google Scholar]
- 34.O’Brie PJ, Ellenberger T. Biochemistry. 2003;42(42):12418–12429. doi: 10.1021/bi035177v. [DOI] [PubMed] [Google Scholar]
- 35.Fromme JC, Bruner SD, Yang W, Karplus M, Verdine GL. Nat Struct Mol Biol. 2003;10(3):204–211. doi: 10.1038/nsb902. [DOI] [PubMed] [Google Scholar]
- 36.Zhu C, Lu L, Zhang J, Yue Z, Song J, Zong S, Liu M, Stovicek O, Gao YQ, Yi C. Proc Natl Acad Sci U S A. 2016;113(28):7792–7797. doi: 10.1073/pnas.1604591113. [DOI] [PMC free article] [PubMed] [Google Scholar]
- 37.Lieblein AL, Krämer M, Dreuw A, Fürtig B, Schwalbe H. Angew Chem Int Ed. 2012;51(17):4067–4070. doi: 10.1002/anie.201200549. [DOI] [PubMed] [Google Scholar]
- 38.Shih Ih, Been MD. Proc Natl Acad Sci U S A. 2001;98(4):1489–1494. doi: 10.1073/pnas.98.4.1489. [DOI] [PMC free article] [PubMed] [Google Scholar]
Associated Data
This section collects any data citations, data availability statements, or supplementary materials included in this article.


