

Abstract
Insulin/IGF-1 action is driven by a complex and highly integrated signalling network. Loss-of-function studies indicate that the major insulin/IGF-1 receptor substrate (IRS) proteins, IRS-1 and IRS-2, mediate different biological functions in vitro and in vivo, suggesting specific signalling properties despite their high degree of homology. To identify mechanisms contributing to the differential signalling properties of IRS-1 and IRS-2 in the mediation of insulin/IGF-1 action, we performed comprehensive mass spectrometry (MS)-based phosphoproteomic profiling of brown preadipocytes from wild type, IRS-1−/− and IRS-2−/− mice in the basal and IGF-1-stimulated states. We applied stable isotope labeling by amino acids in cell culture (SILAC) for the accurate quantitation of changes in protein phosphorylation. We found ~ 10% of the 6,262 unique phosphorylation sites detected to be regulated by IGF-1. These regulated sites included previously reported substrates of the insulin/IGF-1 signalling pathway, as well as novel substrates including Nuclear Factor I X and Semaphorin-4B. In silico prediction suggests the protein kinase B (PKB), protein kinase C (PKC), and cyclin-dependent kinase (CDK) as the main mediators of these phosphorylation events. Importantly, we found preferential phosphorylation patterns depending on the presence of either IRS-1 or IRS-2, which was associated with specific sets of kinases involved in signal transduction downstream of these substrates such as PDHK1, MAPK3, and PKD1 for IRS-1, and PIN1 and PKC beta for IRS-2. Overall, by generating a comprehensive phosphoproteomic profile from brown preadipocyte cells in response to IGF-1 stimulation, we reveal both common and distinct insulin/IGF-1 signalling events mediated by specific IRS proteins.
Keywords: Insulin/IGF-1, Insulin Receptor Substrate, Signal Transduction, Phosphoproteomics, Kinase
1. Introduction
Insulin and insulin-like growth factor 1 (IGF-1) control a wide variety of biological processes including growth, differentiation, metabolism, and the regulation of lifespan. These actions are under the control of a complex and tightly regulated signalling network comprised of intracellular signalling cascades activated downstream the two closely related tyrosine kinase receptors for insulin and IGF-1, the insulin receptor (IR) and the IGF-1 receptor (IGF1R), respectively. Although the IR and IGF1R are relatively specific for their respective ligands and mediate distinct physiological functions, cross-reaction of ligand-receptor occurs at higher concentrations [1]. The intracellular juxtamembrane region of the insulin and IGF-1 receptors plays a role in distinguishing the cellular functions of these receptors [2]. Furthermore, hybrid heterodimeric receptors consisting of an IR and IGF1R subunits are also involved in delivering the insulin/IGF-1 signal in living cells, and the stimulation of both IR and IGF1R at higher ligand concentrations activates similar signalling pathways in a complex network to fulfill numerous actions. The activation of these pathways relies heavily on phosphorylation of several intracellular substrates, including the insulin receptor substrate (IRS) proteins [3, 4].
IRS proteins constitute a crucial and early point of divergence of the insulin/IGF-1 signal and are also a major site of regulation, both at positive and negative levels [5]. Downregulation of IRS function is highly associated with insulin resistance in rodents and humans [6] and the two major IRS proteins, IRS-1 and IRS-2, enable most of insulin/IGF-1 actions in the regulation of growth, differentiation, and metabolism [5]. IRS-1 and IRS-2 share a high degree of structure homology as they both possess a pleckstrin homology (PH) domain, a phosphotyrosine-binding (PTB) domain, and several tyrosine-phosphorylation sites [5]. When phosphorylated via IR/IGF1R, these phosphotyrosine residues serve as binding sites for Src-homology-2 (SH2) domains containing molecules. Despite their known homologous structure, IRS proteins display distinct roles in insulin/IGF-1 signalling and bioactivities. To examine the tissue-specific roles of IRS-1 and IRS-2 in mediating insulin/IGF-1 actions in the main insulin-responsive organs (adipose, liver, and muscle), several IRS-1/IRS-2 loss-of-function studies have been conducted.
Whether IRS proteins play specific or redundant roles in mediating insulin/IGF-1 signal remains debated. Different IRS proteins potentially have unique and complementary, rather than completely redundant roles in insulin and IGF-1 signalling, as deletion of each isoform results in different biological consequences [7–10]. Mice lacking IRS-1 become insulin resistant, but do not develop diabetes [11, 12]. IRS-1−/− mice are characterized by defective insulin action, primarily in skeletal muscle, as well as impaired body growth [11]. In contrast, IRS-2−/− mice develop impaired glucose tolerance and diabetes [13]. IRS-2−/− mice are characterized by defective insulin function mainly in liver, and altered growth in specific sets of neurons [14] and pancreatic β-cells [13]. At the cellular level, brown preadipocytes from IRS-1−/− mice fail to differentiate into mature adipocytes [7], while brown preadipocytes from IRS-2−/− mice differentiate normally, but insulin-stimulated glucose uptake is impaired [8]. IRS-1 and IRS-2 coordinate skeletal muscle growth and metabolism [15]. In human skeletal muscle, IRS-1 is mainly involved in differentiation and glucose metabolism, while IRS-2 is primarily linked to mitogen-activated protein kinase (MAPK) activation and lipid metabolism [9]. In liver, a cooperative function of IRS proteins is required for efficient insulin action [16]. Moreover, nutritional status influences IRS-1 and IRS-2 protein abundance in liver [17], further suggesting different yet complementary roles of these proteins in the control of metabolism. While IRS-1 and IRS-2 have distinct roles in coordinating growth, differentiation, and metabolism, the molecular mechanisms underlying the different pathways mediated by IRS proteins in response to insulin/IGF-1 are poorly understood.
Protein phosphorylation is a crucial intermediate in insulin/IGF-1 mediated signal transduction. Thus, we applied mass spectrometry (MS)-based proteomics to investigate the molecular mechanisms underlying the different pathways mediated by IRS-1 and IRS-2 proteins, and characterized the phosphoproteomes of metabolically labeled wild type (WT), IRS-1−/−, and IRS-2−/− cells following IGF-1 stimulation. Combination of stable isotope labeling by amino acids in cell culture (SILAC) [18], high-resolution MS-based phosphoproteomics, and comprehensive bioinformatic analysis revealed a core of phosphoproteins representing potential novel components of the insulin/IGF-1 pathway. By linking the phosphorylation sites to their cognate kinases using the NetworKIN algorithm [19], we found multiple active kinase groups, among which protein kinase B (PKB), protein kinase C (PKC), and cyclin-dependent kinase (CDK) had the largest number of substrates. Furthermore, comparison of cells before and after IGF-1 exposure provided a global map of the changes in protein phosphorylation in these cells. Finally, a comparison of the IGF-1 regulated phosphoproteome between WT and IRS knockout (KO) cells identified both common and distinct insulin/IGF-1 induced phosphorylation events downstream of IRS proteins.
2. Materials and Methods
2.1. Preparation of the Triple-Labeling SILAC Media
Arginine- and lysine- free DMEM was supplemented with 28 mg/liter of the three Arginine isotopes separately to make the Arg-0, Arg-6, and Arg-10 media, respectively. In addition, 48.7 mg/liter L-lysine, L-lysine- D4, and L-lysine13C6, 15N2 were supplemented separately to the three lots containing Arg-0, Arg-6, and Arg-10. Finally, glutamine and antibiotics were added to the media with the full complement of amino acids (Arg-0/Lys-0, Arg-6/Lys-D4, and Arg-10/Lys-8) and thereafter sterile-filtered (Millipore). For double labeling SILAC media we used a combination of Arg-0, Lys-0 for the “unlabeled” state and Arg-10, Lys-8 for the “heavy” state.
2.2. Cell Culture and IGF-1 Stimulation
Brown preadipocytes isolated and immortalized from wild type, IRS-1−/−, and IRS-2−/− mice as described in reference [20], were grown for at least five cell divisions in the corresponding labeling medium. This ensured a complete labeling of the cells. After a 16 h starvation period the cells were treated with 100 nM of IGF-1 (1 mg/ml, R&D). After incubation for 5 min at 37 °C, the media were removed and the cells were immediately lysed with ice-cold 4% SDS, 0.1 M Tris HCL (pH= 8.5), followed by sonication and boiling at 70 °C for 10 min.
2.3. Sample Preparation for Mass Spectrometry
Lysates were clarified by centrifugation (13.000g, 10 min) and a Bradford assay was performed to determine protein concentrations of the lysates followed by mixing the lysates of the two (1:1)/three (1:1:1) conditions in equimolar amount. Approximately 3 mg protein of each labeling condition (Light—Arg0, Lys0; Middle—Arg6, LysD4; Heavy—Arg10, Lys8) were pooled and reduced using 100 mM dithiothreitol (Sigma-Aldrich) for 10 min at 56 °C and then subjected to the FASP digestion technique[21]. Briefly, samples were washed with 8 M urea, alkylated with 550 mM iodoacetamide (Sigma-Aldrich) and digested overnight in 20 mM ammoniumbicarbonate/trypsin (Promega), at an enzyme-to-protein ratio of 1:100. Peptides were collected by multiple washing of filter units, acidified to pH= 2.67 with trifluoroacetic acid (TFA) and loaded on a Resource S, 1 ml SCX column (Äkta Purifier, GE Healthcare). Flow-through was collected and peptides were separated according to their charge in acidic conditions using a linear increase in salt concentration in a binary buffer system: buffer A 7 mM KH2PO4 in 30% acetonitrile (ACN) (pH= 2.65) and B 7 mM KH2PO4, 350 mM KCl in 30% ACN (pH=2.65). All fractions were pooled conducting absorbance at 280 nm to a total of 8–10 fractions, concentrated and adjusted to binding conditions for Titan sphere (TiO2) bead-based extraction of phosphorylated peptides[22] (80% acetonitrile, 6% TFA). Fractions were incubated twice with 2.5 mg of TiO2 beads and flow-throughs were incubated three times with 5 mg of TiO2 beads (SLSC Science). Beads were washed several– times with decreasing content of TFA (6–3%) and loaded on C8 material-containing tips. Peptides were eluted with 40% ammonia/acetonitrile (pH= 11.6), concentrated in a speed vac at room temperature to almost complete dryness and diluted in acidified (0.1% formic acid or 0.5% acetic acid) H2O before mass spectrometry. All experiments were at least performed in duplicates.
2.4. Mass Spectrometric Analysis
Reverse phase nano-LC was performed on an Agilent 1.100/1.200 nanoflow LC system (Agilent Technologies) with a cooled thermo stated 96-well autosampler. The LC system was coupled to a 7-Tesla LTQ-FT or LTQ Orbitrap instrument (Thermo Fisher Scientific) equipped with a nanoeletrospray source (Proxeon). Two fragmentation modes of HCD and CID were applied. Chromatographic separation of peptides was performed in a 10-cm long 8-mm tip opening/75- mm inner diameter capillary needle (Proxeon). The column was custom-made with methanol slurry of reverse-phase ReproSil-Pur C18-AQ 3-mm resin (Dr. Maisch GmbH). The tryptic peptide mixtures were autosampled at a flowrate of 0.5 ml/min and then eluted with a linear gradient at a flow rate 0.25 ml/min. The mass spectrometers were operated in the data-dependent mode to automatically measure MS and MS/MS[23].
LTQ-FT full scan MS spectra (from m/z 300 to m/z 1.600) were acquired with a resolution of R = 100.000 at m/z 400 (after accumulation to a target value of 3,000.000 in the linear ion trap). The five most intense ions were sequentially isolated and fragmented in the linear ion trap by using collision induced dissociation at a target value of 10.000[23]. LTQ-FT full scan MS spectra were acquired with a resolution r = 50.000 at m/z 400. The three most intense ions were sequentially isolated for accurate mass measurements by a FTICR selected ion monitoring (SIM) scan. The SIM scans had a 15 Da mass range, with a resolution of 50.000 and a target accumulation value of 80.000. After the SIM scans the ions were fragmented in the linear ion trap using collision-induced dissociation at a target value of 10.000.
2.5. Data analysis
Raw data files were converted to Mascot generic format files with in-house software (Raw2MSM), and Mascot was used for database search and protein identification. The raw files from all experimental setups in replicates were processed using MaxQuant [24]. For protein assignment, electrospray ionization-tandem mass spectrometry (ESI-MS/MS) fragmentation spectra were searched against the International Protein Index sequence database (mouse IPI, version 3.24) [25]. Searches were performed with tryptic specifications and default settings for mass tolerances for MS and MS/MS spectra. Carbamidomethyl at cysteine residues was set as a fixed modification, while methionine oxidation, pSTY, N-term protein acetyl, and SILAC labels Lys-D4, Lys-8, Arg-6, and Arg-10 were defined as variable modifications. The minimal peptide length was set to seven amino acids, and the false discovery rate for proteins and peptide- spectrum matches to 1%. A minimal ratio count for SILAC pairs was required and we enabled the match-between-run feature with a time window of 1 min. The maximum initial mass tolerance for MS scans was 10 ppm and 0.5 Da for MS/MS scans. Only proteins were identified and quantified that had at least 2 ion scores > 20.
2.6. Statistical Analysis
Proteins with at least one unique peptide and a ratio count of two were considered in the analysis. Gene Ontology (GO) annotations for Cellular Compartment, Molecular Function and Biological Process were performed in GOrilla and Panther annotation tools [26, 27]. The enriched protein domains were identified by DAVID Bioinformatics Resources and visualized with REVIGO [28]. Correlation of protein phosphorylation between three cell lines and the hierarchical clustering of protein expression in three cell populations were performed in Perseus (Max Quant). The motif-X algorithm was used to determine over-represented sequence motifs from the regulated phosphoproteome dataset. NetworKIN [29] was used to predict the kinases which are potential to phosphorylate the IGF-1 regulated residues. Statistical processing and analysis were performed in the R environment [30]. In general, data are represented as gmean ± SD. Fisher enrichment tests were performed for analysis of the regulated proteins and phosphopeptides. P- values below 0.001 were considered significant, using all identified proteins as the background. The threshold for up and downregulation of phosphopeptides was set to a fold change of 1.5 <, and > 0.5.
2.7. Animal Housing and Diet
All animal experiments were approved by Danish Animal Experimental Inspectorate in compliance with the European Convention for Protection of Vertebrate Animal Used for Scientific Purposes. C57BL/6J mice were purchased from the Jackson Laboratory. Mice were housed in temperature and humidity controlled rooms in a 12:12 light: dark cycle (06:00-18:00), with ad libitum access to food of regular chow (Open Source Diets #D12450B, Brogaarden, Denmark) and water, in enriched cages during the entire study. Twelve 20-22-week-old male mice were fasted for 4 hours and used for the experiment. Mice were anesthetized via i.p. injection of Tribromoethanol/Avertin (250mg/kg body weight), followed by retro-orbital injection of 1 unit insulin/saline for 5 minutes. Six mice were used in each group. Mice were dissected and brown adipose tissue, subcutaneous adipose tissue and liver were quickly removed, snap frozen in liquid nitrogen, and stored at −80◦ until further analysis.
2.8. Western Blotting
Upon confluency, the brown preadipocytes were serum-depleted for four hours prior to IGF-1 treatment. Each of the three cell populations was treated with either 100 nM IGF-1 for 5 minutes or no treatment was used as control. Cells were lysed in ice-cold RIPA lysis buffer (Thermo Scientific, # 89900) including protease and phosphatase inhibitors. Frozen tissues were then homogenized using steel bead homogenization (Tissue Lyser II, Qiagen) in ice-cold modified GSK3 buffer (NaCl 150 mM, Hepes pH 7.5, 50 mM, Glycerol 10%, Na-pyrophosphate 20 mM, IGEPAL (CA -630) 1%, β-glycerophosphate 20 mM, NaF 10 mM, EDTA (pH 8.0) 1 mM, Na3VO4 2 mM, Sigma Fast Protease Inhibitor Tablets). Protein concentrations were determined using BCA assays (Thermo Scientific, #23223 and #23224). Equal amounts of cleared lysates were separated using SDS–PAGE and transferred to polyvinylidene difluoride (PVDF) membranes (Millipore, Denmark). Proteins were detected using their respective antibodies and visualized using enhanced chemiluminescence system (BioRAD). Antibodies used for detection are p-Acly (s455, Cell Signaling Technology, #4331), p-Eif4b (s422, Cell Signaling Technology, #3591), p-Gsk3 (s9, Cell Signaling Technology, #9336), p-Mtor (s2481, Cell Signaling Technology, #2974), p-Mypt (s507, Cell Signaling Technology, #3040), p-REPS1 (s709, Cell Signaling Technology, #6884), p-Sema-4B (s825, Cell Signaling Technology, #5622), p-Zyx (s142/143, Cell Signaling Technology, #4863), p-Stat3 (s727, Cell Signaling Technology, #9134), p-Akt (s473, Cell Signaling Technology, #9271), T-Akt (Cell Signaling Technology, #9272), b-actin (Cell Signaling Technology, #8457), p-Erk (Thr 202/Tyr204, Cell Signaling Technology, #4377), p-Nfix (s265, custom-made antibody, Thermofischer).
3. Results
3.1. Proteome and Phosphoproteome Quantification in WT, IRS-1−/− and IRS-2−/− cells
To investigate the phosphorylation events downstream of insulin/IGF-1 and to dissect the contribution of IRS-1 and IRS-2 in mediating these events, we used cells with total genetic ablation of either IRS-1 or IRS2: brown preadipocyte cell lines which were isolated and immortalized from WT, IRS-1−/−, and IRS-2−/− mice [20]. Since the KO cells do not differentiate normally [8, 31], and since IGF-1 receptors dominate over insulin receptors in the undifferentiated state, we studied the cells in the basal and IGF-1 (100 nM for 5 min) stimulated states using stable isotope labeling by amino acids in cell culture (SILAC) for accurate quantitation of IGF-1 regulated phosphopeptides. To compare the phosphoproteomes of different cell populations we used a mixture of non-labeled (Arg0, Lys0) and labeled (Arg10, Lys8) cells for control or stimulated conditions, alternatively (Fig. 1A). In one combination, we performed double SILAC labeling and directly compared stimulated to unstimulated WT cells, IRS-1−/− cells, and IRS-2−/− cells. In addition, for a more direct comparison, we performed a triple SILAC labeling using non-labeled (Arg0, Lys0) WT cells as a control, labeled (Arg6, LysD4; “middle label”) WT stimulated cells and labeled (Agr10, Lys8; “heavy label”) IRS-1−/− stimulated cells (Fig. 1B). In each experimental setup, proteomes from SILAC-labeled cell populations were combined in equimolar amounts. The protein mixtures were then digested in solution using trypsin and peptides were separated using strong cation exchange chromatography (SCX) after which the phosphopeptides were enriched with titanium dioxide (TiO2) beads [22]. All samples were analyzed using nanoLC-MS/MS on the LTQ Orbitrap Velos mass spectrometer and raw spectra were processed using MaxQuant (Version 1.3.7.2) (Fig. 1A).
Fig. 1.
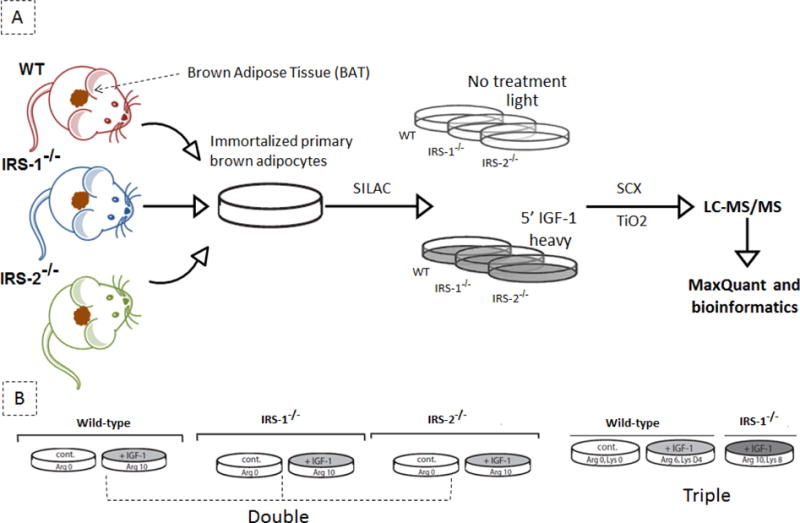
Experimental strategy and labeling procedure. (A) schematic view of experimental procedure; brown preadipocytes were isolated and immortalized from brown adipose tissue of wild type (WT), IRS-1−/− and IRS-2−/− transgenic knockout mice models. SILAC technology was applied by using the stable heavy, light, and medium isotopes of lysine and arginine to differentially label the proteins at different conditions. Cells were grown in the SILAC medium for several generations. The three populations were harvested either after 5 min IGF-1 stimulation or with no treatment and were mixed equally one to one. Next, the peptides were separated using strong cation exchange (SCX) chromatography and the phosphopeptides were enriched on the TiO2 column and analyzed by high-resolution tandem mass spectrometry. The raw spectra were processed using MaxQuant. (B) ‘double/triple’ SILAC labeling experimental layout; Double design: the left experimental design was used as a control for investigating the changes in cellular phosphorylation after 5 min IGF-1 treatment in WT cells. The middle and right experimental setups were used to gain more insight into the different branches of insulin/IGF-1 signalling downstream of IRS-1 and IRS-2 proteins. Triple design: the non- stimulated cell population (Arg0 and Lys0) was compared with cells stimulated with IGF-1 (medium labeled; Arg6 and Lys4/heavy labeled; Arg10 and Lys8) for 5 min.
Using SILAC labeling, we quantitatively compared the protein phosphorylation levels upon IGF- 1 stimulation, in cells derived from WT versus IRS-1−/− or IRS-2−/− mice. In total, we quantified over 6,262 phosphorylation sites with the average localization probability (pRS) >75% from 3,723 phosphoproteins (Fig. 2A and Table S1). Mass deviation of less than 2 p.p.m. for more than 99% of all quantified peptides demonstrated high mass accuracy. The number of phosphosites identified in at least two biological replicates among all experiments showed a reproducibility ranging between 55-60% for all cell populations (Table S1). As no significant changes in protein abundance is expected within 5 min of IGF-1 treatment, we assumed that phosphorylation changes could not be due to differences in protein abundance, so normalization was not required [32]. We did, however, test for differences in basal protein expression among the WT and KO cells, and observed only about 1-2% of all the quantified proteins were differentially expressed among the three cell lines (p-values < 0.001) (Table S2 and Fig. S1A–C). This indicates that the observed changes in phosphorylation do likely not result from differences in protein abundance among the 3 cell populations.
Fig. 2.
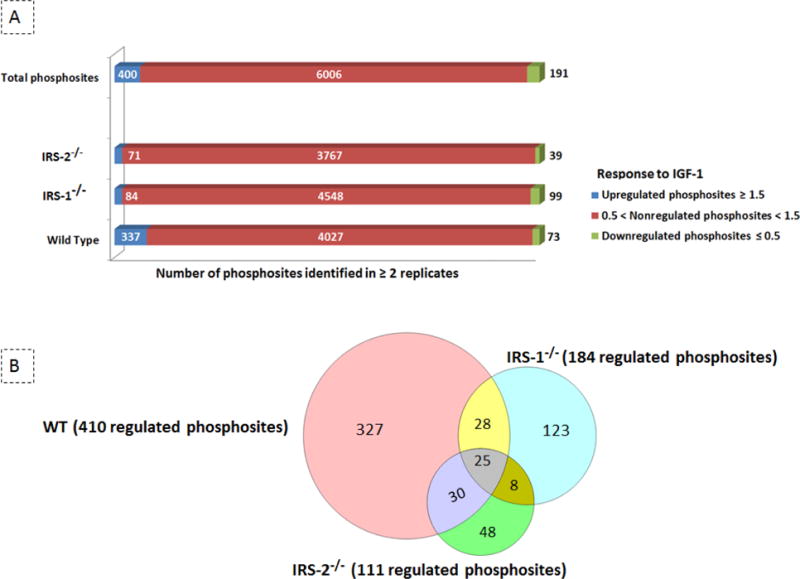
Quantification of the IGF-1-regulated phosphoproteome. (A) Identified phosphosites; clustered bars represent the number of up- (≥ 1.5 folds), down- (≤ 0.5 folds), and non- regulated phosphosites (0.5-1.5 folds) that were quantified in at least two experimental setups. The number of quantified phosphosites is shown both at global level as well as in each individual cell population. (B) Regulated phosphosites; the number of regulated phosphosites and the overlap among the three cell lines is visualized using Venn Diagram Plotter.
3.2. Regulation of Protein Phosphorylation in Response to IGF-1 Stimulation
Of the 6,262 unique phosphosites quantified, 589 sites (~10%) were regulated upon 5 minutes of IGF-1 stimulation in at least two biological replicates. Among those 589 regulated phosphosites observed in one of the three cell types, 400 were induced with a fold change ≥ 1.5 upon 5 min IGF-1 stimulation, whereas 191 phosphorylation sites were downregulated by at least 50% (Fig. 2A and Table S1). The most robust changes were observed in WT cells, which showed 410 regulated phosphosites, with 337 up-regulated sites, and 73 down-regulated sites. This number was markedly reduced in both IRS-1−/− and IRS-2−/− cells. In IRS-1−/− cells there were only 84 up- regulated and 99 down-regulated sites, and in IRS-2−/− cells only 71 up-regulated and 39 down- regulated sites (Fig. 2A and Table S1). This suggests major alterations in kinase/phosphatase activities in IRS-1−/− and IRS-2−/− cells, as compared to the control WT cells. Interestingly, the overlap between IGF-1 dependent phosphosites in WT and IRS knockout cells was only ~10% (Fig. 2B), indicating that IRS-1 and IRS-2 are both crucial mediators of insulin/IGF-1 signalling and cannot fully compensate for each other. Furthermore, among 293 IGF-1 induced phosphosites quantified in IRS-1−/− and IRS-2−/− cells, only ~10% of the detected sites were regulated in common, indicating the signalling specificity downstream of these two substrates (Fig. 2B). It should be noted that the number of common phosphosites that were significantly regulated (t-test < 0.1) among the three cell lines was around 1-2% of all quantified phosphosites (Table S1).
3.3. Classification of the IGF-1 Regulated Phosphoproteome
In order to understand the IGF-1 dependent phosphorylation network and to assess functional differences between the three cell populations, we categorized the regulated phosphoproteome in functional classes. Functional annotation (DAVID) showed that most of the IGF-1 dependent phosphoproteins include a “pleckstrin homology domain” (p-value: 1.40E-26), “serine/threonine protein kinase active site” (p-value: 2.80E-23), “protein kinase, ATP binding site” (p-value: 9.80E-20), “SH2/Src homology-3 domain” (p-value: 1.80E-12), “Zinc finger, PHD-type, conserved site” (p-value: 3.10E-19), “RNA recognition motif” (p-value 6.40E-17), and “bromodomain” (p-value: 7.20E-13), suggesting these protein groups as major targets for insulin/IGF-1 signalling in brown preadipocytes (Fig. 3A and Table S3).
Fig. 3.
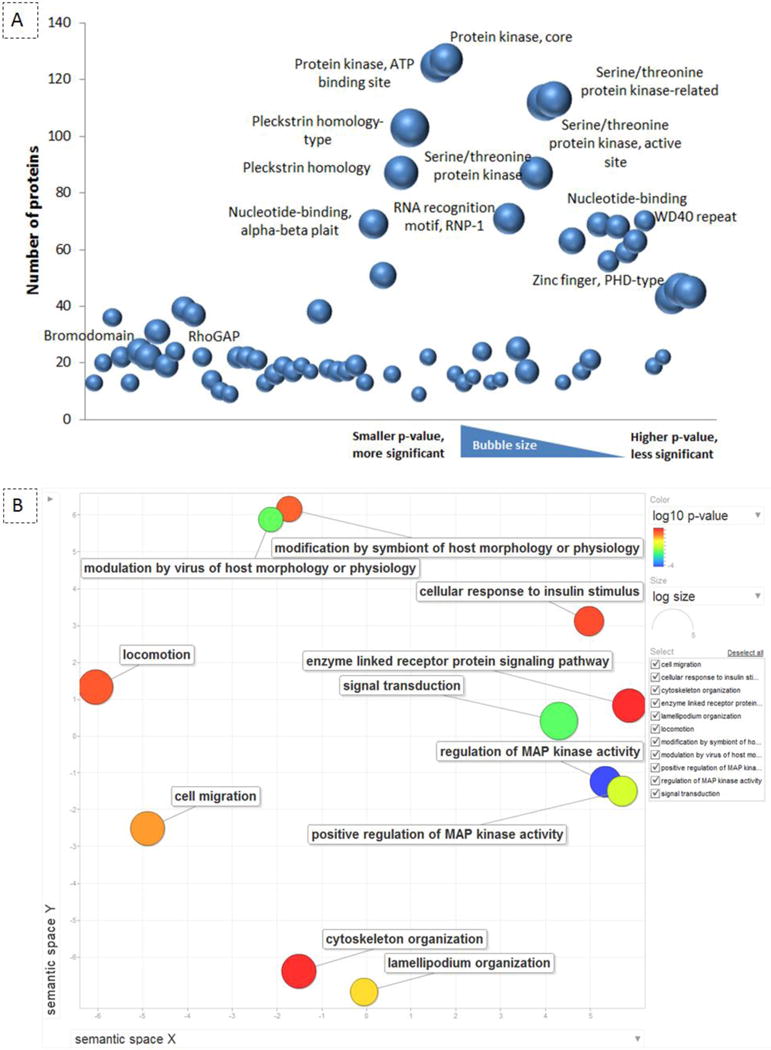
Domain and Pathway enrichment of the IGF-1 regulated phosphoproteome. (A) visualization of over-represented protein domains; bubble plot represents the enriched protein domains of globally phosphoregulated proteins which are identified by DAVID Bioinformatics Resources 6.7. The Y axis represents the number of proteins which include the specific domain. The bigger the bubble size is, the smaller the p-value is, indicating a more significant enrichment of the protein domain among others. (B) REVIGO scatterplot of regulated GO terms in wild type brown preadipocytes; regulated GO terms after 5 minutes of IGF-1 stimulation were summarized and visualized using the REVIGO web server. The color of an individual bubble indicates the p-value enrichment of the GO term. The size of the bubble representing the GO term shows the frequency of occurrence of that term in the underlying GO annotation database. Semantic space is based on the semantic similarity, which is the connection degree between two entities by measuring the similarity of their annotation meanings. The list of enriched GO terms is subjected to medium redundancy reduction in REVIGO and is represented by cluster representatives in a scatterplot. The X and Y axes of the scatter plot represent the distance between the terms between these cluster representatives.
Regulated phosphoproteins in WT cells and total protein datasets were further analyzed for overrepresented gene ontology (GO) categories using Gorilla [26]. REVIGO was used to summarize and visualize the overrepresented GO terms [28]. The analysis was performed for biological process, molecular function, and cellular compartment (Table S4). As shown in Fig. 3B, the IGF-1 dependent phosphoregulated proteins in WT cells are highly enriched for “regulation of MAPK activity” (p-value: E-05), “regulation of phosphorylation” (p-value: E-04), “signal transduction” (p-value: E-04), “cellular response to insulin stimulus” (p-value: E-04), “TOR signalling” (p-value: E-04), “cell adhesion and junction” (p-value: E-05), and “cytoskeleton organization” (p-value: E-04). By comparing the GO term annotation of phosphoregulated proteins in WT versus KO cells, proteins involved in “focal adhesion”, “cell junction”, “actin binding and cytoskeletal organization”, “localization to the organelles”, “signal transduction and cellular response to the stimulus/growth factor” were among the common phosphoregulated pathways in all the three cell lines. Several proteins annotated to be involved in “MAPK pathway”, “TOR signalling”, “kinase activity and its regulation”, “protein autophosphorylation”, and “regulation of chromatin modification”, were only enriched in datasets obtained from WT and not from KO cells. “Cellular response to insulin stimulus”, “transmembrane receptor protein tyrosine kinase signalling pathway”, and “enzyme linked receptor protein signalling pathway” were among the most enriched GO terms of the phosphoregulated proteins in WT and IRS-2−/− cells. The GO annotation of “protein transport and localization between the membrane and nucleus” was highly enriched from phosphoregulated proteins in IRS-1−/− cells (Table S4). Collectively, these results suggest that essential cellular functions are differentially controlled downstream of IRS-1 or IRS-2 in response to insulin/IGF- 1 stimulation.
We also compared our phosphoproteome dataset with previously published phosphoproteome databases [33, 34] as well as a publicly available database of phosphorylation sites (http://www.phosphosite.org). We identified 67 novel phosphorylation sites, which were regulated by IGF-1 (Table S5). Among the 3,723 proteins phosphorylated on a total of 6,262 residues, more than 730 sites have not been previously described (Table S5). Using Panther [27] GO enrichment analysis, proteins identified with novel phosphorylation sites are annotated to function as small “GTPase regulator activity”, “transcriptional regulation”, and “cytoskeletal protein organization” (Table S6). Therefore, our phosphoproteomics screening revealed both known and novel phosphorylation sites regulated in response to IGF-1 treatment in brown preadipocytes (Fig. 4). Among all the IGF-1 regulated phosphosites, we identified several previously described protein phosphorylation sites with recognized roles in insulin/IGF-1 pathway such as GSK3b (S9) [35], TSC2 (S939, S981) [36], EIF4b (S422) [37], PTEN (S385) [38] (Fig. 4). More importantly, many novel targets were also identified including EHD1 (S456), CAP1 (S34, S307, S309), NCK (S85). The potential roles of these novel phosphorylation sites in mediating/regulating the insulin/IGF-1 pathway need to be elucidated and might reflect the presence of additional IGF-1 induced signalling pathways.
Fig. 4.
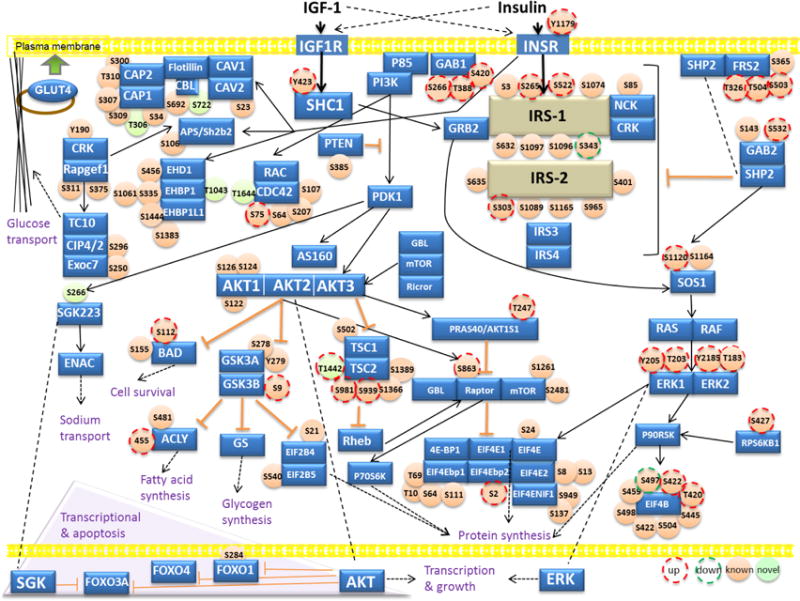
Insulin/IGF-1 signalling map. Non-phosphorylated proteins, non-regulated phosphoproteins, and regulated phosphoproteins are mapped to the pathway. The complete list of the proteins involved in insulin/IGF-1 pathway can be found in Table S5. Proteins known to be involved in insulin/IGF-1 pathway are represented in blue color; IRS-1 and IRS-2 are shown in beige color. Identified phosphosites by MS are shown in light orange, previously reported sites; light green, novel sites. The IGF-1 induced upregulated sites are shown with the surrounding red dash lines and the downregulated sites are marked with dark green dashed-circles. The inhibitory and positive relationship between different nodes of the signalling network is shown by orange and solid black arrows, respectively. The dashed lines point the same proteins located at different cell compartments, and dashed arrows indicate the final functional outputs of the pathway.
3.4. Validation of Proteins Regulated by Phosphorylation upon Insulin/IGF-1 Stimulation
To confirm the obtained phosphorylation profiles, we performed western blot analysis of protein lysates from brown preadipocytes derived from WT, IRS-1−/−, or IRS-2−/− mice following IGF-1 stimulation (Fig. 5A). The phosphorylation of several known IGF-1 targets such as AKT, GSK3b, ERK, ACLY, EIF4b, as well as mTOR, was increased by at least 1.5-fold in all three cell populations. However, the phosphorylation of REPS1 and ZYX were only significantly regulated in WT cells and we observed no stimulation upon IGF-1 treatment in either IRS-1 or IRS-2 deficient cells. Thus, both IRS-1 and IRS-2 are required for IGF-1 induced phosphoregulation of these two proteins. By comparison, IGF-1 induced phosphoregulation of STAT3 and Nuclear Factor I X (NFIX) was detected in WT and IRS-2−/− cells, but not in IRS-1−/− cells.
Fig. 5.
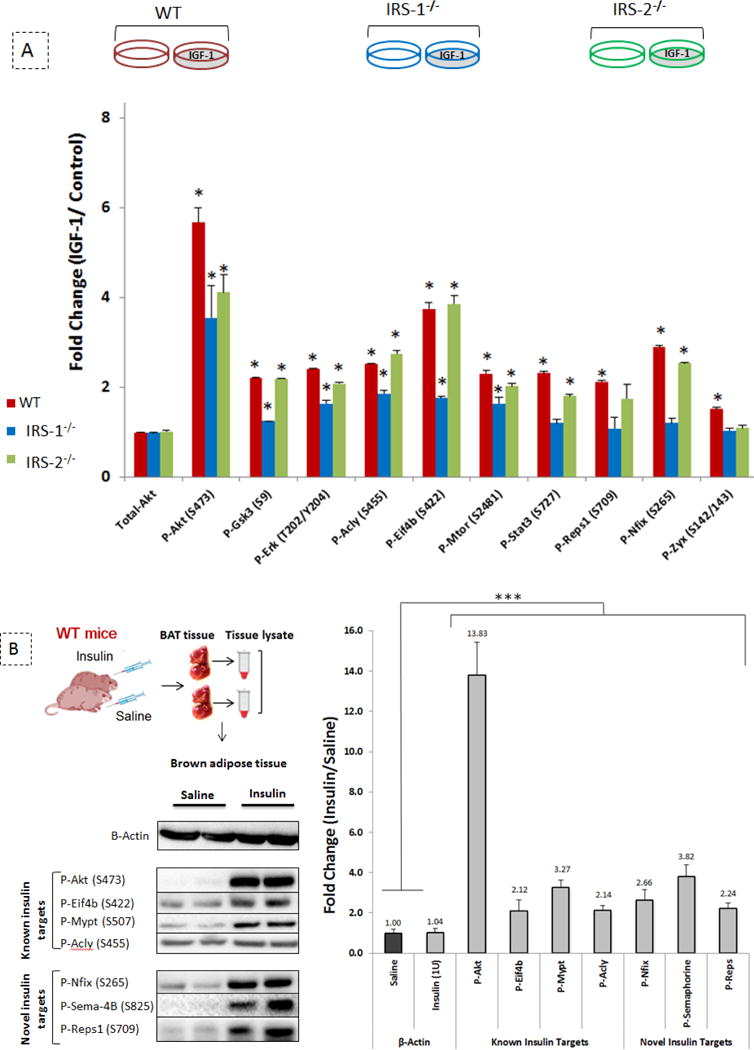
Validation of novel targets of the insulin/IGF-1 signalling pathway. (A) in vitro; quantification of western blot analysis of proteins from WT, IRS-1−/−, and IRS-2−/− brown preadipocytes stimulated with 100 nM of IGF-1 for 5 minutes vs no treatment as control ; n= 3 biological replicates. Values are mean ± SD. *indicates vs. control no-treatment (p ≤ 0.03) analyzed by unpaired t-tests. (B) in vivo; western blot analysis of proteins from brown adipose tissue of WT mice injected with 1 unit of insulin/saline for 5 minutes; n= 6 mice per condition. The left panel visualizes representative blots and the right panel represents the western blot quantification. The vertical axis shows the fold change of protein phosphorylation upon 5 min insulin treatment compared to saline injection. Values are mean ± SD. *indicates vs. control saline (p ≤ 0.03) analyzed by unpaired t- tests.
To test the activation of selected candidates in living animals, we stimulated adult WT mice with insulin (1 unit per animal) or saline (control) for 5 minutes by retro-orbital injection, then isolated the brown adipose tissue, subcutaneous adipose tissue and liver, extracted proteins and performed western blot analysis. As expected, we observed increased phosphorylation on known insulin targets, including AKT, EIF4b, MYPT, and ACLY. Furthermore, we verified the induction of phosphorylation on several novel phosphosites identified by our phosphoproteomics analysis on previously unidentified components of the insulin/IGF-1 signalling pathway, such as NFIX, Sema-4B, and REPS1 (Fig. 5B). This induction of NFIX and Sema-4B phosphorylation by insulin was not detected in other insulin-sensitive tissues such as the liver and white adipose tissue (Fig. S2), suggesting that these phosphorylation events may be specific to brown fat. This complementary in vivo approach confirmed that the identified sites from the cell culture experiments were also regulated by insulin in vivo.
3.5. Common and Distinct Phosphoregulation Patterns Downstream of IRS Proteins
By comparing IGF-1 regulated phosphosites in the three cell populations (WT, IRS-1−/−, and IRS- 2−/−), we classified the phosphosites into four categories based on their regulation (Fig. 6A and Table S7): 1) IGF-1 regulated phosphorylation sites that are independent of IRS-1 and IRS-2 proteins, such as AKT1S1 (T247), MAPK1 (T183, Y185), TSC2 (S981), GSK3b (S9), ACLY (S455), and EIF4b (S422); 2) IGF-1 regulated phosphorylation sites that were not activated in either IRS-1 or IRS-2 deficient cells, such as RAB3GAP1 (S536), NUP50 (S234), AHNAK (S5630), and ZFYVE16 (S884); 3) IGF-1 regulated phosphorylation sites that preferentially depend on the presence of IRS-1, such as NFIX (S265), GAB1 (S266), and DNMT1 (S140); and 4) IGF-1 regulated phosphosites that preferentially depend on IRS-2, such as PALLD (S901) and IFI204 (S190). It is worth highlighting that our phosphoproteomics script revealed the IRS- dependent phosphorylation of several proteins known to be involved in insulin/IGF-1 pathway, such as AHNAK [39] and ADD1 [40].
Fig. 6.
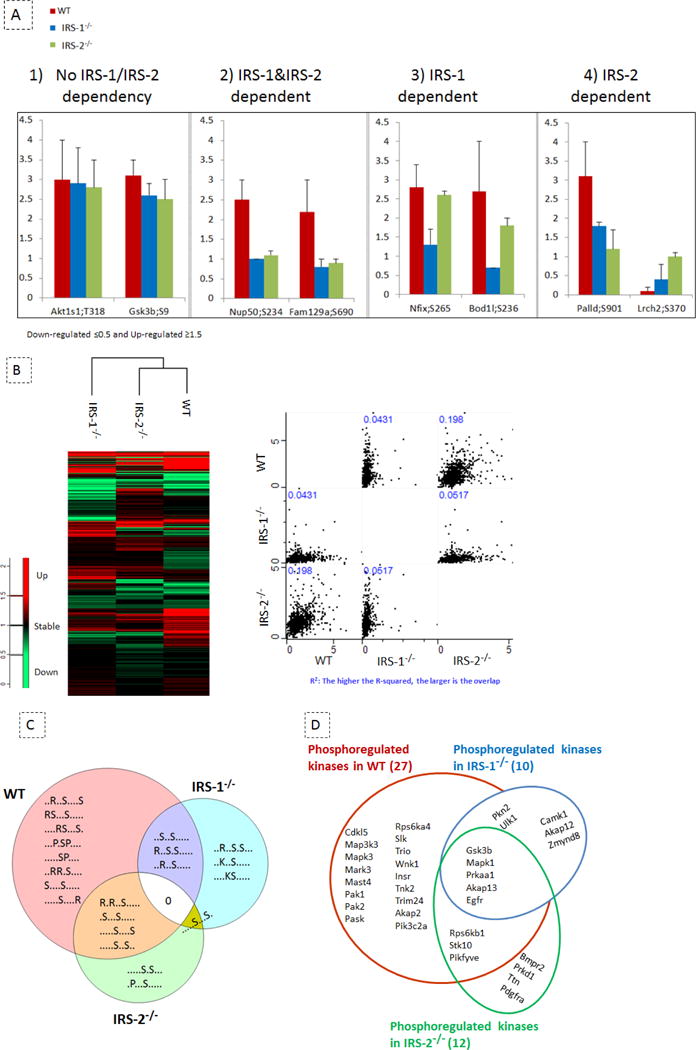
IRS-1 and IRS-2 mediated redundant and unique signalling events. (A) Different categories of IGF-1 regulated phosphoproteins in WT cells (red bars), IRS-1−/− cells (blue bars) and IRS-2−/− cells (green bars); values are gmean ± SD from MS data (n= 5–7), we termed the “upregulated” proteins the proteins for which the phosphorylation ratio after IGF-1 stimulation was increased by ≥ 1.5 fold as compared to basal and phosphoproteins with a ≤ 0.5 fold change were termed as “downregulated”. Phosphosites with a ratio of less than 1.5 and more than 0.5 were not considered as regulated. 1) IGF-1 regulated phosphorylation sites independent of IRS-1 and IRS-2 proteins, i.e. with phosphoregulation occurring in all cell lines stimulated with IGF-1; 2) IGF-1 regulated phosphorylation sites, for which the optimal regulation depends on the presence of both IRS-1 and IRS-2 proteins, this group of phosphorylation sites is defined by an absence of regulation in both IRS-1−/− cells and IRS-2−/− cells as compared to WT cells stimulated with IGF-1; 3) IGF-1 regulated phosphorylation sites which preferentially depend on the presence of IRS-1, this category is defined by an absence of regulation in IRS-1−/− cells as compared to WT and IRS-2−/− cells; 4) IGF-1 regulated phosphosites which preferentially depend on IRS-2, defined by a similar regulation in WT and IRS-1−/− cells but absent in IRS-2−/− cells. (B) Correlation of protein phosphorylation between three cell lines; the left panel shows the hierarchical clustering of protein phosphorylation in three cell populations using Perseus (Max Quant). The IGF-1 regulated phosphoproteomes in WT and IRS-2−/− cells are coclustered. On the right panel, the multi scatter plot from Perseus (Max Quant) is used to visualize the correlation between the three cell lines using MS- acquired quantitative values of phosphosites. The correlation number is shown by R- squared (R2) which might range between 0 and 1. The R-squared of ~0.2 indicates a higher correlation between the phosphoproteomes of WT and IRS-2−/− cells as compared to any other possible combination. (C) Over-represented consensus motifs; the motif-X algorithm was used to determine over-represented sequence motifs from the regulated phosphoproteome dataset, using the mouse database as background. We applied an 11 amino acid residue sequence window surrounding the phosphorylated Serine. Only motifs with p < 10−6 were allowed. Venn Diagram Plotter was used to visualize the overlap of over-represented phosphomotifs among the three cell lines. (D) Unique and common IGF-1 phosphoregulated kinases are shown in WT, IRS-1−/−, and IRS-2−/− cells.
In order to compare IGF-1 induced phosphosites among the three cell populations, we next compared the quantified values related to phosphorylation sites in all three cell lines using hierarchical clustering and multi scatter plot analysis by Perseus (v. 1.5.1.6, tool of MaxQuant package). The R-squared values from the multi scatter plot ranging between 0.04 and 0.2 showed a low correlation of the phosphorylation profiles between the three cell lines (Fig. 6B). Furthermore, these data indicate that the phosphorylation profiles of IRS-2−/− and WT brown preadipocytes are more similar (R2≈ 0.2) than the other possible combinations (R2≈ 0.04–0.05), indicating that IRS-1 is an important mediator of insulin/IGF-1 signalling in brown preadipocytes. In order to determine over-represented sequence motifs from the regulated phosphoproteome dataset, we performed a motif-X algorithm using the mouse database as background. Among our dataset of all the IGF-1 regulated phosphosites, we were unable to identify a common overrepresented motif between the three cells lines, again indicating the low correlation of IGF-1 induced protein phosphoregulation among these cells. Some overrepresented motifs were found to be common between two of the three cell lines, however, each of the three cell lines include ~50% unique motifs (Fig. 6C and Table S8). Collectively, these results are consistent with the notion that there is specificity among IRS proteins in mediating insulin/IGF-1 signal.
Aligning our phosphoproteome dataset with the mouse UniProt kinase database of 7,971 kinases, we found 173 of the detected phosphosites assigned to kinases, among which 34 were regulated in response to 5 min IGF-1 stimulation. The changes of phosphorylation in kinases upon IGF-1 induction were mostly observed in brown preadipocytes derived from WT mice and less in the knockout cells (WT: IRS-1−/−: IRS-2−/− _ 27: 10: 12). This suggests an overall altered kinase/phosphatase activity in the IRS knockout cells compared to the WT. Indeed, the phosphorylation of kinases such as SLK, TRIO, WNK1, TNK2, PASK, and several others were found to be regulated on individual sites uniquely in the WT cells. Some kinases such as GSK3b, MAPK, EGFR, AKAP13, and PRKAA1 were similarly regulated by IGF-1 in all the three cell lines, indicating that their sensitivity to IGF-1 stimulation does not depend on IRS proteins or that IRS-1 and IRS-2 can compensate each other. Furthermore, our dataset of IGF-1 regulated kinases discloses several kinases for which the phosphorylation was only modulated in knockout cells, suggesting those kinases as mediators of insulin resistance or other pathological conditions caused by dysfunctional IRS proteins (Fig. 6D and Table S9).
3.6. The IGF-1 Stimulated Kinome Network
To predict upstream kinases responsible for the IGF-1 induced phosphorylation events, we performed a kinase motif analysis using the NetworKIN software [29]. The NetworKIN algorithm combines probabilistic modeling of network contexts with linear motifs recognized by the catalytic domain of kinases. Relationships between kinases and the phosphorylation sites for each cell population were predicted, creating an in vitro kinase-substrate database for brown preadipocytes (Fig. 7A and Table S10). This database comprises 291 kinases, representing most of the known kinase families [41]. The comparison between the kinases and kinase families predicted with high NetworKIN scores to phosphorylate the protein residues in response to IGF- 1 indicated that PKB, PKC, CDK, MAPK, CK2, CAMKII, P70S6K, GSK3, and AMPK families of kinases were among the main predicted kinases to be involved in all three cell lines. Interestingly, we also found that several kinases predicted to be involved in the phosphoregulation of residues by IGF-1 in WT cells were not identified in IRS knockout cells, including P38MAPK, PKA and AURORAa. Conversely, ACTR2, ACTR2b, TGFβR2 and DMPK groups of kinases were only found to be predicted to phosphorylate proteins in response to IGF-1 in either IRS-1 or IRS-2 knockout cells, but not in WT cells. CAMKIV and DNAPK were predicted to be involved in mediating IGF-1 regulated phosphorylation events in IRS-1 and IRS-2 knockout cells, respectively (Fig. 7A and Table S10). Furthermore, by linking the IGF-1 regulated phosphosites of these specific kinases to their corresponding upstream kinases in WT and KO cells, we generated a temporal kinase-cascade model that illustrates the partial alteration of the kinome in knockout cells compared to WT cells (Fig. 6D, Fig. 7B, and Table S11). Therefore, in line with the previously proposed model [41], this overview suggests that some of the alterations in protein phosphorylation in IRS knockout cells may be partially attributed to defective regulation of kinases in these cells. Importantly, we also identified using this algorithm PDHK1, MAPK3, and PKD1 as IRS-1 dependent kinases, and PIN1 and PKC beta as IRS-2 dependent kinases.
Fig. 7.
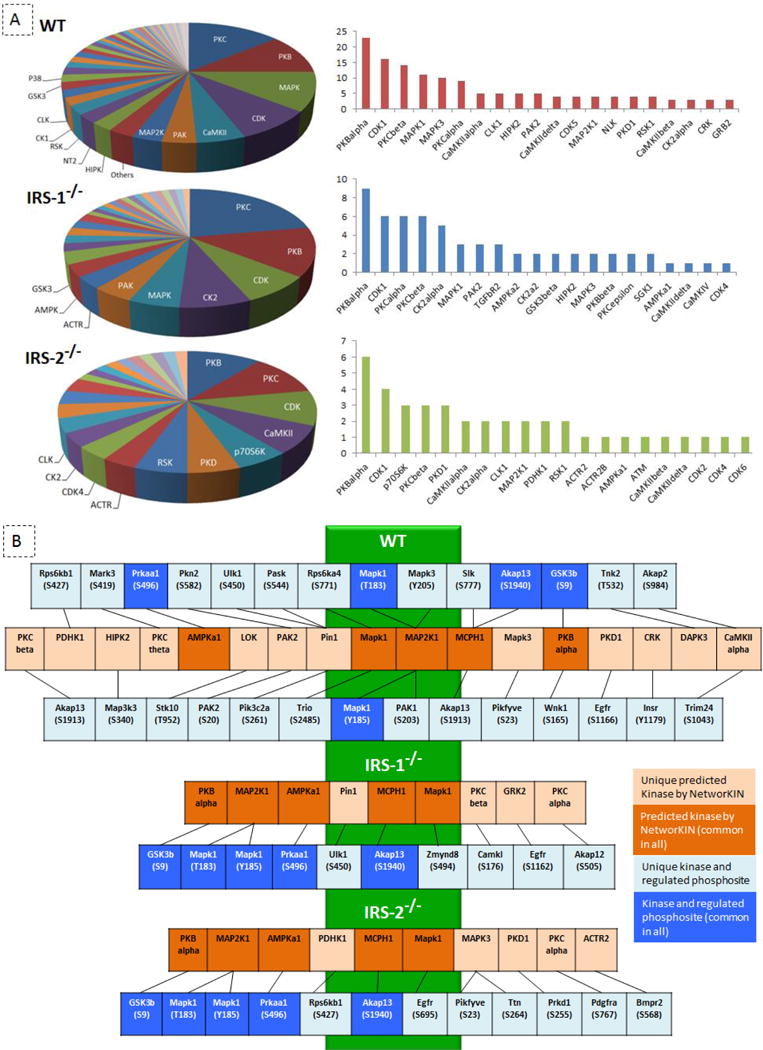
IRS-specific kinome. (A) Prediction of kinases in charge of IGF-1 induced regulation of phosphorylation; NetworKIN was used to predict the kinases which are potential to phosphorylate the IGF-1 regulated residues in WT, IRS-1−/−, and IRS-2−/− cells, ~80-90% of the phosphorylation sites in each cell population were successfully mapped to their potential kinases. The Venn diagrams on the left panel represent the major kinase families predicted by NetworKIN in each cell population, the clustered bars on the right panel show the top 20 kinase members predicted by NetworKIN in each cell line. (B) Kinome network; a temporal kinase-cascade model was generated by linking site-specific kinases that were found regulated upon 5 min IGF-1 stimulation (in blue boxes) with their predicted upstream kinases by NetworKIN (in orange boxes). Kinases regulated by IGF-1 in all three cell lines are depicted as dark blue and common kinases predicted by NetworKIN in all the three cell populations are shown in dark orange boxes.
4. Discussion
Using high resolution quantitative MS-based phosphoproteomics to clarify the contribution of IRS-1 and IRS-2 in the transduction of the insulin/IGF-1 signalling pathway, we have identified several novel substrates of this pathway and characterized an IRS-1/2 specific signature for the regulation of several phosphorylated proteins by IGF-1. Indeed, specific phosphorylation events regulated by IGF-1 display either complementarity, interchangeability, or preferential dependency of IRS proteins, for optimal regulation. Thus, these data demonstrate, at the molecular level, the absolute requirement of both IRS-1 and IRS-2 in the mediation of the full response to insulin and IGF-1, and enhance our understanding of the molecular mechanisms underlying the distinct biological functions regulated by these two isoforms.
In brown preadipocytes, ~ 10% of all the phosphoproteins identified in WT cells are regulated in response to 5 min IGF- 1 stimulation. This is similar to what has been reported in differentiated adipocytes [33], or in the liver [34], following insulin stimulation. This fraction is reduced to only ~ 3% of the phosphoproteins being regulated by IGF-1 in either the IRS-1−/− or IRS-2−/− cells. Thus, there is a 70% reduction in insulin/IGF-1 signalling in absence of either one of these two IRS proteins.
Among all the phosphorylated sites induced by IGF-1 in WT cells, ~80% and ~20% (4:1) were up- or down-regulated, respectively. However, this ratio was significantly lower in KO cells with ratios of ~1:1 in IRS-1−/− cells and ~2:1 in IRS-2−/− cells, suggesting an alteration of the kinases and phosphatases in KO cells compared to the WT cells. Interestingly, the novel kinome dataset generated in this study also revealed that IGF-1 regulated phosphorylation of several kinases mainly occurs in WT cells and not in KO cells. This finding suggests that IRS-1/2 dependent kinases constitute potential targets for therapeutic intervention for treatment of diseases linked to impaired insulin/IGF-1 pathways. Collectively, these results indicate the overall increase in IGF-1 stimulated kinase activity is fairly rapid and dynamic in WT brown preadipocytes, but attenuated in the KO cells. Whether the decreased IGF-1 induced phosphorylation events observed in KO versus WT cells are due to less kinase activity or more phosphatase activity remains to be determined.
We also identified only a ~10% overlap between IGF-1 regulated phosphoproteins in IRS-1−/− and IRS-2−/− cells, indicating that there is a high degree of signalling specificity downstream of these two substrate proteins. These differences in pre-adipocytes may shed light on the mechanisms driving adipogenesis, an event highly controlled by insulin/IGF-1, and which is impaired in IRS-1−/− cells, but conserved in IRS-2−/− cells [7, 8, 31]. Interestingly, re-expression of IRS-1, but not overexpression of IRS-2, in IRS-1 KO cells restores adipogenesis [31], supporting the notion that specific signals are conveyed by IRS-1 to drive this process, which cannot be fully compensated by overexpression of IRS-2. Our correlation analysis using the quantified values of all common phosphosites in WT and KO cells also showed a low correlation between the three cell lines. Therefore, our data support the notion that IRS in fact function with complementary rather than redundant roles, and that they cannot fully compensate for each other. Several molecular mechanisms have been proposed to explain the specific effects of IRS proteins including their ability to bind to the IR, IGF1R, or hybrid receptors [42], or to various downstream effectors as well as the kinetics of their binding to different interactors [43, 44]. Characterization of the phosphotyrosine interactome of IRS-1 or IRS-2 specific regions revealed numerous common binding partners, but also specific ones, which may contribute to the divergence of the signal [45]. In addition, this specificity could possibly be due to the different cell compartmentalization of IRS proteins [46, 47], as well as the existence of different signalling complexes and clusters [48] downstream of the two substrate proteins, IRS-1 and IRS-2. In that context, fine tuning the relative expression of IRS-1 and IRS-2 at the cellular or tissue level may contribute in delivering a specific signal. A sequential pattern of expression for IRS-1 and IRS-2 was reported in the liver following fasting and re-feeding, suggesting distinct functional roles for these two isoforms in regulating specific hepatic metabolic needs [17]. Whether this regulation occurs in other cell types or tissues remains unknown. We also hypothesize that diverse phosphorylation patterns of the proteins identified in our study may play a potential role in the distinct insulin/IGF-1 pathways downstream of IRS-1 and IRS-2. Therefore, by assessing IGF-1 signal transduction through a quantitative comparison of phosphorylation events as the most prominent cell signalling hallmark, we highlight the existence of specific pathways deriving from the activation of the IRS proteins in response to insulin/IGF-1.
Among the phosphosites that we found to be regulated by IGF-1, at least a third was also found to be regulated by insulin in 3T3L1 adipocytes [33], and 20% in the liver [34], suggesting that a part of these signaling events belong to the canonical insulin/IGF-1 pathway, while another part may be more specific to a particular cell type and/or may be ligand-dependent. Multiple phosphoregulated proteins described in our MS-based dataset belong to the classical insulin/IGF- 1 pathway, including INSR and IRS, as well as proteins involved in glucose transport (i.e. CAP, CBL, and CIP4/2), glucose homeostasis (i.e. AKT, GSK3b, and PCK2), lipid homeostasis (i.e. FAS, ACACA, and HSL), protein synthesis (i.e. mTOR, RAPTOR, P70S6K, and EIF4e), and cell proliferation and differentiation (i.e. SOS, RAF, and MAPK1/3) (Fig. S3). In addition, we identified several phosphoproteins regulated upon IGF-1 stimulation for which a contribution to insulin/IGF-1 signalling has not been previously described, representing new and potentially important players for this pathway.
Among the phosphoregulated proteins are proteins enriched in chromatin binding domains such as zinc finger, bromodomain, SANT/MYB domain, and chromodomain. By aligning our dataset with the transcription factor databases AnimalTFDB [49] and DBD, we found that ~ 25% of the quantified phosphorylation sites were localized on proteins assigned to function as transcription factors and other transcriptional regulators (TRs). Among the 529 quantified phosphoproteins assigned as transcriptional regulators, 127 of these showed a dynamic regulation by phosphorylation in response to IGF-1. Overall, these data suggest that the regulation of transcriptional machinery and gene expression is altered in brown preadipocytes upon IGF-1 stimulation (Table S1). The functional role for individual TRs and specific effect of their phosphorylation by insulin/IGF-1 treatment in adipocyte development remains to be elucidated.
Another highly enriched category of phosphorylated proteins regulated by IGF-1 were found to contain WD40 repeat regions. WD-40 repeats (also known as WD or beta-transducin repeats) are short ~40 amino acid motifs, often terminating in a Trp-Asp (W-D) dipeptide. WD40 repeat regions are known to be multifunctional and regulate a plethora of cellular functions, including adaptor/regulatory modules in signal transduction, protein interactions, pre-mRNA processing, cytoskeleton assembly, transcriptional activation, cell cycle control, and recognition of post-translational modifications [50]. As a common feature of insulin/IGF-1 induced protein phosphorylation, we propose the WD40 repeat regions containing proteins including RAPTOR (Regulatory-associated protein of mTOR), TLE3 (transducin-like enhancer of split 3), TTN (Ttn), and several others as potential targets domain for the insulin signalling pathway (Table S3).
Over-represented sequence motifs from our regulated phosphoproteome dataset indicates that most of the sites are within consensus motifs of AGC (basophilic sequence directed kinases) and CMGC (proline directed kinases) and are therefore candidates for unrecognized IR/IGF1R mediated processes [51–53]. This is also consistent with the NetworKIN kinases prediction for the regulated phosphorylation sites. By linking the phosphorylation sites to their cognate kinases, we reveal the multiple active kinases AGC and CMGC had the largest number of potential substrates. This indicates the role of proline and arginine as crucial residues in substrate recognition by the kinases involved in insulin/IGF-1 signal transduction networks. Enrichment of proline directed sequence motifs has been reported to be among the insulin-stimulated phosphorylation sites in mature 3T3-L1 cells [33].
Signalling pathways are not isolated, but perform an active crosstalk with other pathways, creating an integrated signalling network. A perturbation of a signalling pathway might also influence other branches, and therefore understanding of this crosstalk is essential for developing new potential pharmacological targets. In this regard, crosstalk between the insulin/IGF-1 and other pathways is of high physiological relevance. Our analysis proposes many potential intersection sites linking insulin/IGF-1 signalling to other important biological pathways and critical signalling molecules. Several of the signalling molecules identified in our study are implicated in diabetes pathophysiology. Our data revealed robust insulin/IGF-1 regulated phosphorylation of proteins known to be involved in TGF-β signalling, including ZFYVE16 (at S884 and S888). The role of TGF-β signalling in nephropathy of diabetes is known. Moreover, TGF-β inhibitors are suggested to protect against diabetes and obesity through induced pancreatic beta cell replication in human [54, 55]. Conversely, dysfunctional TGF-β signalling is closely connected to the pathogenesis of various diseases including diabetes, cancer and fibrosis [56]. Several intersection components of IGF-I pathway that interact with TGF-β signalling have been described earlier [57].
We also identified several signalling molecules associated with obesity and adipogenesis. WNT signalling is a potent inhibitor of adipogenesis, and dysregulated WNT signalling is associated with diabetes. WNT co-receptors LRP5 and LRP6 are known to be the critical regulators of WNT pathway, as well as the sites where the WNT signalling pathway interacts with, and regulates, the insulin signalling pathway [58]. DUPLIN/CHD8 has an inhibitory role on WNT signalling when it is localized in the nucleus [59]. Accordingly we observed an upregulation of DUPLIN/CHD8 at S2040 in response to IGF-1, which might essentially lead to its translocation into the nucleus and enhance its further inhibitory role on WNT pathway. RAS- like GTPases are widely expressed and conserved molecular switches that link extracellular signals to numerous cellular responses. RAP1 (RAS-proximate-1 or RAS-related protein 1), has been a center of attention due to the possibility of regulating RAS-mediated signalling. Extracellular signals regulate RAP1 through several regulatory proteins, and it might be involved in various processes, ranging from modulation of growth, differentiation, cell adhesion, and morphogenesis [60]. Activation of EPAC1/RAP1 pathway through Cyclic AMP (cAMP) is required for adipocyte differentiation [61] RAP1 may also be activated by insulin/IGF-1 signalling. Here, we identified several proteins from RAP1 signalling pathway, including CTND1 and MLLT4, that are regulated by IGF-1 in brown preadipocytes. Our data indicated dynamic CTNND1 (pS905) and MLLT4 (pS1795) phosphorylation sites, which might reflect new intersections between RAP1 and insulin/IGF-1 pathways and could function as potential therapeutic targets against obesity [62].
The serine threonine kinase AKT plays a central role in the regulation of insulin/IGF-1 signalling. AKT signalling is connected with an important protein degradation pathway in mammalian cells, namely the ubiquitin–proteasome system. Two distinct ubiquitination systems regulate AKT signalling, namely K63-linked ubiquitination, with its promoting effect on oncogenic activation of AKT, and K48-linked ubiquitination, which causes the proteasomal degradation of phosphorylated AKT [63]. Therefore insulin-induced AKT kinase activity and its inhibition by the ubiquitin pathways is an important key node of the insulin/IGF-1 pathway. In addition, prolonged insulin exposure in adipocytes leads to proteasomal degradation of IRS-1 and insulin resistance [64]. Independent from its role in protein degradation, ubiquitin functions as signalling modulator in DNA repair and activation of kinases involved in inflammatory responses [65]. Our dataset revealed several IGF-1 dependent phosphorylation sites, including UBR5 (pS1549), TRIP12 (pS1063), NEDD4L (pS475), UBE20 (pS1236), and UBE4b (pS105) as potential nodes of crosstalk linking insulin/IGF-1 to the ubiquitin pathway.
DNMT1 is an enzyme activated by obesity-induced pro-inflammatory cytokines which selectively methylates and stimulates compact chromatin structure in the adiponectin promoter and thereby leads to the obesity-induced reduction of adiponectin expression. Inhibition of DNMT1 activity leads to the amelioration of obesity-induced glucose intolerance and insulin resistance in an adiponectin-dependent manner [66]. Our phosphoproteomic screening revealed the phosphorylation of DNMT1 at S140 which is regulated in response to IGF-1 stimulation only in WT cells. Notably, the inactivation of IRS-1 and IRS-2 completely abolish the phosphorylation of DMNT1 in response to IGF1 stimulation. This may suggest the phosphorylation as one way to activate DNMT1 and thereby, proposes inactive DNMT1 as a mechanism towards insulin resistance observed in IRS deficient conditions.
By providing a more comprehensive map of insulin/IGF-1 signalling integrating the IRS- 1 and IRS-2 branches and describing the shared and more unique signalling specificities of these two proteins, we uncover new potential mechanisms involved in the regulation of cell growth, differentiation and metabolism. In particular, with IRS-1 and IRS-2 dysfunction being associated with insulin resistance, it seems likely that the different signalling properties of IRS-1 and IRS-2 might have an important impact in these pathophysiological conditions such as diabetes, obesity and metabolic syndrome, where the signal downstream one of these two major isoforms may be differently altered.
Supplementary Material
Fig. S1: Volcano plot representation of the differentially regulated proteins in basal condition among the three cell populations. Differentially regulated proteins between A) WT cells and IRS-1−/− cells; B) WT cells and IRS-2−/− cells; C) IRS-1−/− cells and IRS-2−/− cells; in each plot, the X axis represents the t-test differences among the two compared populations and the Y axis represents the p-values. Considering the p-values <0.001 as significant, around 1-2% of the total 2333 quantified protein are significantly regulated among the three cell lines.
Fig. S2: In vivo western blot analysis of proteins from (A) liver of WT mice injected with 1 unit of insulin/saline for 5 minutes; n= 6 mice per condition; or from (B) subcutaneous white adipose tissue of WT mice injected with 1 unit of insulin/saline for 5 minutes; n= 5-6 mice per condition. The left panel visualizes representative blots and the right panel represents the western blot quantification. The vertical axis shows the fold change of protein phosphorylation upon 5 min insulin treatment compared to saline injection. Values are mean ± SEM. * indicates vs. control saline (p ≤ 0.05) analyzed by unpaired t-tests.
Fig. S3: KEGG pathway: insulin signalling pathways; the KEGG pathway shown here represents different layers of insulin signalling pathway, proteins marked with the red star were as well identified in our dataset.
Table S1: List of identified, quantified, and regulated proteins, phosphoproteins, and phosphopeptides; the table includes two sheets, sheet 1) shows the raw MS data information which includes 58 individual columns (A-BF) representing the Proteins UniProt IDs, Positions of phosphorylation within proteins, Leading proteins, Protein names, Gene names, the SILAC ratio of 7 experimental setups including WT cells, Geomean of the 7 different setups, the number of experimental setups in which the specific phosphopeptides were quantified, the number of setups among 7 in which the SILAC ratio were found to be >1.5, the number of setups among 7 in which the SILAC ratio were found to be <0.5, the SILAC ratio of 7 experimental setups including IRS-1−/− cells, Geomean of the 7 different setups, the number of experimental setups in which the specific phosphopeptides were quantified, the number of setups among 7 in which the SILAC ratio were found to be >1.5, the number of setups among 7 in which the SILAC ratio were found to be <0.5, the SILAC ratio of 5 experimental setups including IRS-2−/− cells, Geomean of the 5 different setups, the number of experimental setups in which the specific phosphopeptides were quantified, the number of setups among 5 in which the SILAC ratio were found to be >1.5, the number of setups among 7 in which the SILAC ratio were found to be <0.5, t-test WT-IRS1, t-test WT-IRS2, t-test IRS1-IRS2, Phospho (STY) Probabilities, Fasta headers, Localization prob, Score diff, PEP Score, Score for localization, Number of Phospho (STY) Amino acid, Sequence window, Modification window, Peptide window coverage, Modified sequence, Phospho (STY) Probabilities, Phospho (STY) Score diffs, Position in peptide, Charge, m/z, and Mass error [ppm]. The entries in each column are dependent to the entries in other columns of each row. Sheet 2) is the summarized version of sheet 1 including 25 individual columns (A-Y) representing the list of All quantified phosphosites, All quantified phosphoproteins known to function as TFs/TRs, All stables phosphopeptides, All insulin/IGF-1 regulated phosphosites, All insulin/IGF-1 regulated phosphoproteins known to function as TFs/TRs, All insulin/IGF-1 upregulated phosphosites, All insulin/IGF-1 downregulated phosphosites, All phosphosites table in WT cells, All insulin/IGF-1 regulated phosphosites in WT cells, All insulin/IGF-1 upregulated phosphosites in WT cells, All insulin/IGF-1 downregulated phosphosites in WT, All stable phosphosites in IRS-1−/−, All insulin/IGF-1 regulated phosphosites in IRS-1−/− cells, All insulin/IGF-1 upregulated phosphosites in IRS-1−/− cells, All insulin/IGF-1 downregulated phosphosites in IRS-1−/− cells, All stable phosphosites in IRS-2−/− cells, All insulin/IGF-1 regulated phosphosites in IRS-2−/− cells, All insulin/IGF-1 upregulated phosphosites in IRS-2−/− cells, All insulin/IGF-1 downregulated phosphosites in IRS- 2−/− cells, Commonly regulated phosphosites among WT cells and IRS-1−/− cells, WT-IRS-1 t-test, Commonly regulated phosphosites among WT cells and IRS-2−/− cells, WT-IRS-2 t-test, Commonly regulated phosphosites among IRS-1−/− cells and IRS-2−/− cells, IRS-1-IRS-2 t-test. The commonly regulated phosphosites with the t-test <0.1 are marked in green. The entries in each column are independent of the entries in other columns of each row.
Table S2: Information about proteins and their abundance among the three cell populations in the basal (without IGF-1 treatment) condition; the table includes two sheets, sheet 1) shows the raw MS data information which includes 25 individual columns (A-Y) representing the Protein IDs, Protein names, Gene names, SILAC ratios in 3 biological replicates each performed in 3 different arrangements of double SILAC labeling (M/L, H/L, H/M) which only included WT cells, IRS-1−/− cells and IRS-2−/− cells, Score, Intensity, Intensity L, Intensity M, Intensity H, -log 10 p-value of IRS1−/−/WT, t-test Difference_IRS1−/−/WT, -log 10 p-value of IRS2−/−/WT, t-test Difference_IRS2−/−/WT, -log 10 p-value of IRS2−/−/IRS1−/−, t-test Difference_IRS2−/−/IRS1−/−, Protein IDs, and Majority protein IDs. The entries in each column are related to the entries in other columns of each row. Sheet 2) is the summarized version of sheet 1 which includes three main columns each composed of three sub-columns representing the comparison (A-C) between WT cells and IRS-1−/− cells, (E-G) between WT cells and IRS-2−/− cells, and (I-K) between IRS-1−/− cells and IRS-2−/− cells. The three main columns are divided by an empty column colored in black. The first sub-column of each column indicates the gene name, the second one the t-test difference, and the third one indicates the –log10 p-values between the two compared cell lines. The entries in each main column are independent of the entries in other columns of each row. However, the entries in each sub-column are related to the entries in other sub-columns of each row within a main column.
Table S3: Enriched protein domains; enriched domains of globally phosphoregulated proteins are identified by DAVID Bioinformatics Resources version 6.7. The table includes three individual columns indicating the terminology of the enriched protein domains, the number of proteins in our dataset composed of that specific protein domain, and the p-value of the enriched domains among all identified domains in our dataset. The entries in each column are related to the entries in other columns of each row.
Table S4: GO term annotation of the regulated phosphoproteins in the three cell lines; GOrilla was used to annotate the regulated phosphoproteins in each cell population based on their biological process, molecular function, and cellular compartment. The table includes three main columns each composed of four sub-columns (A-D) representing the GO term information in WT cells, (F-I) the GO term information in IRS-1−/− cells, and (K-N) the GO term information of IRS-2−/− cells. The three main columns are divided by an empty column colored in black. The first sub-column of each column indicates the GO term description, the second one shows the p- value, the third one indicates the FDR corrected p-values or q-values, and the fourth sub-column of each column represent the fold enrichment of each term in our dataset. The entries in each main column are independent of the entries in other columns of each row. However, the entries in each sub-column are related to the entries in other sub-columns of each row within a main column.
Table S5: Known and novel identified regulated phosphosites in three cell populations; comparing our dataset with previously published and available phosphorylation databases we identified several known as well as novel regulated phosphosites on proteins. The table includes four individual columns indicating 1) all IGF-1 regulated phosphosites; 2) IGF-1 regulated phosphosites in WT cells; 3) IGF-1 regulated phosphosites in IRS-1−/− cells; and 4) IGF-1 regulated phosphorylation sites in IRS-2−/− cells. In each column, the cells marked in green represent the previously identified phosphosites and the cells left with no color represent the novel phosphorylation sites. The entries in each column are independent of the entries in other columns of each row.
Table S6: GO term annotation of the novel regulated phosphosites; we used Panther GO enrichment annotation tool (version 10.0 Released 2015-05-15) to identify the overrepresented GO terms among the novel identified regulated phosphosites in our dataset. The table includes three main columns each composed of five sub-columns (A-E) representing the GO term information based on biological processes, (G-K) the GO term information of molecular function, and (M-Q) the GO term information of cellular compartment. The three main columns are divided by an empty column colored in black. The five sub-columns in each column represent 1) description of the GO term; 2) the number of proteins assigned to that specific term in Mus-Musculus reference list; 2) the number of proteins assigned to that specific term in our submitted protein list; 4) the fold enrichment of the specific term in our submitted list compared to the background reference list of Mus musculus; and 5) the p-values. The entries in each main column are independent of the entries in other columns of each row. However, the entries in each sub-column are related to the entries in other sub-columns of each row within a main column.
Table S7: Classification of phosphosites identified in three cell populations; by comparing IGF-1 regulated phosphosites in the three cell populations (WT, IRS-1−/−, and IRS-2−/−), we classified the phosphosites into four categories based on their regulation. The table includes four main column divided by an empty column colored in black. The four columns respectively represent; 1) the phosphosites regulated among all three cell lines; 2) regulated in WT cells, and stable in IRS-1−/− cells and IRS-2−/− cells; 3) regulated in WT cells and IRS-1−/− cells, stable in IRS-2−/− cells; and 4) regulated in WT cells and IRS-2−/− cells, stable in IRS-1−/− cells. Each main column includes 14 sub-columns representing the sequence of the phosphopeptides, their gene ID and phosphosite, the average of the SILAC ratios in three cell lines, the STDEV of the SILAC ratios and log10 of STEDV in 3 cell lines, the gmean of SILAC ratio in WT, IRS-1−/− and IRS-2−/− cells. The entries in each main column are independent of the entries in other columns of each row. However, the entries in each sub-column are related to the entries in other sub- columns of each row within a main column.
Table S8: Motif-x identified overrepresented motifs in regulated phosphopeptides; the table provides information about Motif-X output and includes 3 main columns representing the enriched motifs of the regulated phosphopeptides in WT, IRS-1−/−, and IRS-2−/− cells. Motif-X algorithm used the mouse database as background. The three main columns are divided by an empty column colored in black and each includes 7 sub-columns representing 1) the overrepresented motif identified by Motif-X; 2) motif score; 3) foreground matches; 4) foreground size; 5) background matches; 6) background size; and 7) fold increase, respectively. The entries in each main column are independent of the entries in other columns of each row. However, the entries in each sub-column are related to the entries in other sub-columns of each row within a main column.
Table S9: Information of the kinases in our dataset; the table includes five individual sub- columns representing 1) All Identified Kinases; 2) All Regulated Kinases; 3) Regulated Kinases in WT; 4) Regulated Kinases in IRS-1−/− cells; 5) Regulated Kinases in IRS-2−/− cells. The entries in each main column are independent of the entries in other columns of each row.
Table S10: NetworKIN prediction of potential kinases of IGF-1 induced regulated phosphosites in WT, IRS-1−/−, and IRS-2−/− cells; the table provides information about NetworKIN input and output and includes 3 main columns representing the kinase information of the regulated phosphopeptides in WT, IRS-1−/−, and IRS-2−/− cells. The three main columns are divided by an empty column colored in black and each includes 5 sub-columns respectively represent 1) the substrate ID; and 2) the phosphorylation position in our dataset submitted to NetworKIN as input; 3) the predicted kinase ID; 4) the NetworKIN score for the predicted kinases; and 5) the name of the kinase group/family predicted by NetworKIN. The entries in each main column are independent of the entries in other columns of each row. However, the entries in each sub-column are related to the entries in other sub-columns of each row within a main column.
Table S11: NetworKIN kinase prediction of phosphoregulated kinases in WT, IRS-1−/−, and IRS-2−/− cells; the table provides information about NetworKIN input and output and includes 3 main columns representing the potential kinase information of the phosphoregulated kinases in WT, IRS-1−/−, and IRS-2−/− cells. The three main columns are divided by an empty column colored in black and each includes 6 sub-columns respectively represent 1) the substrate ID of the kinase (the kinase names are presented in yellow marked cells); and 2) the phosphorylation position; and 3) the sequence window of the phosphorylated kinases identified in our dataset and were submitted to NetworKIN as input; 4) the predicted kinase ID potential to phosphorylate the kinase in our dataset in response to IGF-1 treatment; 5) the NetworKIN score for the predicted kinases; and 6) the name of the kinase group/family predicted by NetworKIN. The entries in each main column are independent of the entries in other columns of each row. However, the entries in each sub-column are related to the entries in other sub-columns of each row within a main column.
Highlights.
Phosphoproteomic analysis reveals novel elements of the insulin/IGF-1 signalling pathway.
IRS-1 and IRS-2 are essential and complimentary to mediate the full and optimal response to insulin/IGF-1 stimulation
IRS-1 and IRS-2 mediate distinct and specific signalling events
The particular contributions of IRS-1 and IRS-2 are linked to the regulation of specific sets of kinases downstream each of these two isoforms
Acknowledgments
We thank members of the Emanuelli group for discussions, and Juleen R. Zierath for critical reading and editing of the manuscript.
Funding: This work was supported by internal funding from the Novo Nordisk Foundation Center for Basic Metabolic Research, an independent research center at the University of Copenhagen partially funded by an unrestricted donation from the Novo Nordisk Foundation (http://www.metabol.ku.dk), by a grant from the Novo Nordisk Foundation - Endocrinology Research, CECAD, and by National Institutes of Health (NIH) grant R01-DK-033201.
Footnotes
Publisher's Disclaimer: This is a PDF file of an unedited manuscript that has been accepted for publication. As a service to our customers we are providing this early version of the manuscript. The manuscript will undergo copyediting, typesetting, and review of the resulting proof before it is published in its final citable form. Please note that during the production process errors may be discovered which could affect the content, and all legal disclaimers that apply to the journal pertain.
Author contributions: BE and CRK conceived and designed the study; AR and BE wrote the manuscript with inputs from MK and CRK. AR and MK carried out the main experimental work and interpreted the results. BE supervised the work. All authors approved the final version of the manuscript.
Competing interests: The authors declare no competing financial interests.
Data and materials availability: The MS data will be uploaded to a public MS database, and the link to access it will be provided.
References
- 1.Belfiore A, Frasca F, Pandini G, Sciacca L, Vigneri R. Insulin receptor isoforms and insulin receptor/insulin-like growth factor receptor hybrids in physiology and disease. Endocr Rev. 2009;30(6):586–623. doi: 10.1210/er.2008-0047. [DOI] [PubMed] [Google Scholar]
- 2.Cai W, Sakaguchi M, Kleinridders A, Gonzalez-Del Pino G, Dreyfuss JM, O’Neill BT, Ramirez AK, Pan H, Winnay JN, Boucher J, Eck MJ, Kahn CR. Domain-dependent effects of insulin and IGF-1 receptors on signalling and gene expression. Nature Communications. 2017;8:14892. doi: 10.1038/ncomms14892. [DOI] [PMC free article] [PubMed] [Google Scholar]
- 3.White MF. The IRS-signalling system: a network of docking proteins that mediate insulin action. Mol Cell Biochem. 1998;182(1–2):3–11. [PubMed] [Google Scholar]
- 4.Krüger M, Kratchmarova I, Blagoev B, Tseng YH, Kahn CR, Mann M. Dissection of the insulin signaling pathway via quantitative phosphoproteomics. Proceedings of the National Academy of Sciences. 2008;105(7):2451–2456. doi: 10.1073/pnas.0711713105. [DOI] [PMC free article] [PubMed] [Google Scholar]
- 5.Taniguchi CM, Emanuelli B, Kahn CR. Critical nodes in signalling pathways: insights into insulin action. Nat Rev Mol Cell Biol. 2006;7(2):85–96. doi: 10.1038/nrm1837. [DOI] [PubMed] [Google Scholar]
- 6.Copps KD, White MF. Regulation of insulin sensitivity by serine/threonine phosphorylation of insulin receptor substrate proteins IRS1 and IRS2. Diabetologia. 2012;55(10):2565–82. doi: 10.1007/s00125-012-2644-8. [DOI] [PMC free article] [PubMed] [Google Scholar]
- 7.Tseng YH, Butte AJ, Kokkotou E, Yechoor VK, Taniguchi CM, Kriauciunas KM, Cypess AM, Niinobe M, Yoshikawa K, Patti ME, Kahn CR. Prediction of preadipocyte differentiation by gene expression reveals role of insulin receptor substrates and necdin. Nature cell biology. 2005;7(6):601–11. doi: 10.1038/ncb1259. [DOI] [PubMed] [Google Scholar]
- 8.Miki H, Yamauchi T, Suzuki R, Komeda K, Tsuchida A, Kubota N, Terauchi Y, Kamon J, Kaburagi Y, Matsui J, Akanuma Y, Nagai R, Kimura S, Tobe K, Kadowaki T. Essential role of insulin receptor substrate 1 (IRS-1) and IRS-2 in adipocyte differentiation. Molecular and cellular biology. 2001;21(7):2521–32. doi: 10.1128/MCB.21.7.2521-2532.2001. [DOI] [PMC free article] [PubMed] [Google Scholar]
- 9.Bouzakri K, Zachrisson A, Al-Khalili L, Zhang BB, Koistinen HA, Krook A, Zierath JR. siRNA-based gene silencing reveals specialized roles of IRS-1/Akt2 and IRS-2/Akt1 in glucose and lipid metabolism in human skeletal muscle. Cell metabolism. 2006;4(1):89–96. doi: 10.1016/j.cmet.2006.04.008. [DOI] [PubMed] [Google Scholar]
- 10.Saltiel AR. New perspectives into the molecular pathogenesis and treatment of type 2 diabetes. Cell. 2001;104(4):517–29. doi: 10.1016/s0092-8674(01)00239-2. [DOI] [PubMed] [Google Scholar]
- 11.Araki E, Lipes MA, Patti ME, Bruning JC, Haag B, 3rd, Johnson RS, Kahn CR. Alternative pathway of insulin signalling in mice with targeted disruption of the IRS-1 gene. Nature. 1994;372(6502):186–90. doi: 10.1038/372186a0. [DOI] [PubMed] [Google Scholar]
- 12.Tamemoto H, Kadowaki T, Tobe K, Yagi T, Sakura H, Hayakawa T, Terauchi Y, Ueki K, Kaburagi Y, Satoh S, et al. Insulin resistance and growth retardation in mice lacking insulin receptor substrate-1. Nature. 1994;372(6502):182–6. doi: 10.1038/372182a0. [DOI] [PubMed] [Google Scholar]
- 13.Withers DJ, Gutierrez JS, Towery H, Burks DJ, Ren JM, Previs S, Zhang Y, Bernal D, Pons S, Shulman GI, Bonner-Weir S, White MF. Disruption of IRS-2 causes type 2 diabetes in mice. Nature. 1998;391(6670):900–4. doi: 10.1038/36116. [DOI] [PubMed] [Google Scholar]
- 14.Kubota N, Terauchi Y, Tobe K, Yano W, Suzuki R, Ueki K, Takamoto I, Satoh H, Maki T, Kubota T, Moroi M, Okada-Iwabu M, Ezaki O, Nagai R, Ueta Y, Kadowaki T, Noda T. Insulin receptor substrate 2 plays a crucial role in beta cells and the hypothalamus. The Journal of clinical investigation. 2004;114(7):917–27. doi: 10.1172/JCI21484. [DOI] [PMC free article] [PubMed] [Google Scholar]
- 15.Long YC, Cheng Z, Copps KD, White MF. Insulin receptor substrates Irs1 and Irs2 coordinate skeletal muscle growth and metabolism via the Akt and AMPK pathways. Molecular and cellular biology. 2011;31(3):430–41. doi: 10.1128/MCB.00983-10. [DOI] [PMC free article] [PubMed] [Google Scholar]
- 16.Dong X, Park S, Lin X, Copps K, Yi X, White MF. Irs1 and Irs2 signaling is essential for hepatic glucose homeostasis and systemic growth. The Journal of clinical investigation. 2006;116(1):101–14. doi: 10.1172/JCI25735. [DOI] [PMC free article] [PubMed] [Google Scholar]
- 17.Kubota N, Kubota T, Itoh S, Kumagai H, Kozono H, Takamoto I, Mineyama T, Ogata H, Tokuyama K, Ohsugi M, Sasako T, Moroi M, Sugi K, Kakuta S, Iwakura Y, Noda T, Ohnishi S, Nagai R, Tobe K, Terauchi Y, Ueki K, Kadowaki T. Dynamic functional relay between insulin receptor substrate 1 and 2 in hepatic insulin signaling during fasting and feeding. Cell metabolism. 2008;8(1):49–64. doi: 10.1016/j.cmet.2008.05.007. [DOI] [PubMed] [Google Scholar]
- 18.Ong SE, Blagoev B, Kratchmarova I, Kristensen DB, Steen H, Pandey A, Mann M. Stable isotope labeling by amino acids in cell culture, SILAC, as a simple and accurate approach to expression proteomics. Molecular & cellular proteomics: MCP. 2002;1(5):376–86. doi: 10.1074/mcp.m200025-mcp200. [DOI] [PubMed] [Google Scholar]
- 19.Linding R, Jensen LJ, Ostheimer GJ, van Vugt MA, Jorgensen C, Miron IM, Diella F, Colwill K, Taylor L, Elder K, Metalnikov P, Nguyen V, Pasculescu A, Jin J, Park JG, Samson LD, Woodgett JR, Russell RB, Bork P, Yaffe MB, Pawson T. Systematic discovery of in vivo phosphorylation networks. Cell. 2007;129(7):1415–26. doi: 10.1016/j.cell.2007.05.052. [DOI] [PMC free article] [PubMed] [Google Scholar]
- 20.Klein J, Fasshauer M, Ito M, Lowell BB, Benito M, Kahn CR. beta(3)-adrenergic stimulation differentially inhibits insulin signaling and decreases insulin-induced glucose uptake in brown adipocytes. The Journal of biological chemistry. 1999;274(49):34795–802. doi: 10.1074/jbc.274.49.34795. [DOI] [PubMed] [Google Scholar]
- 21.Wisniewski JR, Zougman A, Mann M. Combination of FASP and StageTip-based fractionation allows in-depth analysis of the hippocampal membrane proteome. J Proteome Res. 2009;8(12):5674–8. doi: 10.1021/pr900748n. [DOI] [PubMed] [Google Scholar]
- 22.Thingholm TE, Jorgensen TJ, Jensen ON, Larsen MR. Highly selective enrichment of phosphorylated peptides using titanium dioxide. Nat Protoc. 2006;1(4):1929–35. doi: 10.1038/nprot.2006.185. [DOI] [PubMed] [Google Scholar]
- 23.Olsen JV, Mann M. Improved peptide identification in proteomics by two consecutive stages of mass spectrometric fragmentation. Proc Natl Acad Sci U S A. 2004;101(37):13417–22. doi: 10.1073/pnas.0405549101. [DOI] [PMC free article] [PubMed] [Google Scholar]
- 24.Schulze WX, Mann M. A novel proteomic screen for peptide-protein interactions. The Journal of biological chemistry. 2004;279(11):10756–64. doi: 10.1074/jbc.M309909200. [DOI] [PubMed] [Google Scholar]
- 25.Kersey PJ, Duarte J, Williams A, Karavidopoulou Y, Birney E, Apweiler R. The International Protein Index: an integrated database for proteomics experiments. Proteomics. 2004;4(7):1985–8. doi: 10.1002/pmic.200300721. [DOI] [PubMed] [Google Scholar]
- 26.Eden E, Navon R, Steinfeld I, Lipson D, Yakhini Z. GOrilla: a tool for discovery and visualization of enriched GO terms in ranked gene lists. BMC Bioinformatics. 2009;10(1):1–7. doi: 10.1186/1471-2105-10-48. [DOI] [PMC free article] [PubMed] [Google Scholar]
- 27.Mi H, Muruganujan A, Casagrande JT, Thomas PD. Large-scale gene function analysis with the PANTHER classification system. Nat Protoc. 2013;8(8):1551–66. doi: 10.1038/nprot.2013.092. [DOI] [PMC free article] [PubMed] [Google Scholar]
- 28.Supek F, Bosnjak M, Skunca N, Smuc T. REVIGO summarizes and visualizes long lists of gene ontology terms. PLoS One. 2011;6(7):e21800. doi: 10.1371/journal.pone.0021800. [DOI] [PMC free article] [PubMed] [Google Scholar]
- 29.Linding R, Jensen LJ, Pasculescu A, Olhovsky M, Colwill K, Bork P, Yaffe MB, Pawson T. NetworKIN: a resource for exploring cellular phosphorylation networks. Nucleic Acids Res 36(Database issue) 2008:D695–9. doi: 10.1093/nar/gkm902. [DOI] [PMC free article] [PubMed] [Google Scholar]
- 30.Ihaka R, Gentleman R. R: A Language for Data Analysis and Graphics. Journal of Computational and Graphical Statistics. 1996;5(3):299–314. [Google Scholar]
- 31.Tseng YH, Kriauciunas KM, Kokkotou E, Kahn CR. Differential roles of insulin receptor substrates in brown adipocyte differentiation. Molecular and cellular biology. 2004;24(5):1918–29. doi: 10.1128/MCB.24.5.1918-1929.2004. [DOI] [PMC free article] [PubMed] [Google Scholar]
- 32.Wang IX, Ramrattan G, Cheung VG. Genetic variation in insulin-induced kinase signaling. Molecular Systems Biology. 2015;11(7):820. doi: 10.15252/msb.20156250. [DOI] [PMC free article] [PubMed] [Google Scholar]
- 33.Humphrey SJ, Yang G, Yang P, Fazakerley DJ, Stockli J, Yang JY, James DE. Dynamic adipocyte phosphoproteome reveals that Akt directly regulates mTORC2. Cell metabolism. 2013;17(6):1009–20. doi: 10.1016/j.cmet.2013.04.010. [DOI] [PMC free article] [PubMed] [Google Scholar]
- 34.Humphrey SJ, Azimifar SB, Mann M. High-throughput phosphoproteomics reveals in vivo insulin signaling dynamics. Nature biotechnology. 2015;33(9):990–5. doi: 10.1038/nbt.3327. [DOI] [PubMed] [Google Scholar]
- 35.Ding VW, Chen RH, McCormick F. Differential Regulation of Glycogen Synthase Kinase 3β by Insulin and Wnt Signaling. Journal of Biological Chemistry. 2000;275(42):32475–32481. doi: 10.1074/jbc.M005342200. [DOI] [PubMed] [Google Scholar]
- 36.Zhang HH, Huang J, Duvel K, Boback B, Wu S, Squillace RM, Wu CL, Manning BD. Insulin stimulates adipogenesis through the Akt-TSC2-mTORC1 pathway. PLoS One. 2009;4(7):e6189. doi: 10.1371/journal.pone.0006189. [DOI] [PMC free article] [PubMed] [Google Scholar]
- 37.Shahbazian D, Roux PP, Mieulet V, Cohen MS, Raught B, Taunton J, Hershey JW, Blenis J, Pende M, Sonenberg N. The mTOR/PI3K and MAPK pathways converge on eIF4B to control its phosphorylation and activity. EMBO J. 2006;25(12):2781–91. doi: 10.1038/sj.emboj.7601166. [DOI] [PMC free article] [PubMed] [Google Scholar]
- 38.Tamguney T, Stokoe D. New insights into PTEN. J Cell Sci. 2007;120(Pt 23):4071–9. doi: 10.1242/jcs.015230. [DOI] [PubMed] [Google Scholar]
- 39.Ramdas M, Harel C, Armoni M, Karnieli E. AHNAK KO mice are protected from diet- induced obesity but are glucose intolerant. Horm Metab Res. 2015;47(4):265–72. doi: 10.1055/s-0034-1387736. [DOI] [PubMed] [Google Scholar]
- 40.Kotzka J, Muller-Wieland D, Koponen A, Njamen D, Kremer L, Roth G, Munck M, Knebel B, Krone W. ADD1/SREBP-1c mediates insulin-induced gene expression linked to the MAP kinase pathway. Biochem Biophys Res Commun. 1998;249(2):375–9. doi: 10.1006/bbrc.1998.9161. [DOI] [PubMed] [Google Scholar]
- 41.Caenepeel S, Charydczak G, Sudarsanam S, Hunter T, Manning G. The mouse kinome: discovery and comparative genomics of all mouse protein kinases. Proc Natl Acad Sci U S A. 2004;101(32):11707–12. doi: 10.1073/pnas.0306880101. [DOI] [PMC free article] [PubMed] [Google Scholar]
- 42.Sawka-Verhelle D, Baron V, Mothe I, Filloux C, White MF, Van Obberghen E. Tyr624 and Tyr628 in insulin receptor substrate-2 mediate its association with the insulin receptor. The Journal of biological chemistry. 1997;272(26):16414–20. doi: 10.1074/jbc.272.26.16414. [DOI] [PubMed] [Google Scholar]
- 43.Miura A, Sajan MP, Standaert ML, Bandyopadhyay G, Kahn CR, Farese RV. Insulin substrates 1 and 2 are corequired for activation of atypical protein kinase C and Cbl-dependent phosphatidylinositol 3-kinase during insulin action in immortalized brown adipocytes. Biochemistry. 2004;43(49):15503–9. doi: 10.1021/bi049221y. [DOI] [PubMed] [Google Scholar]
- 44.Ogihara T, Shin BC, Anai M, Katagiri H, Inukai K, Funaki M, Fukushima Y, Ishihara H, Takata K, Kikuchi M, Yazaki Y, Oka Y, Asano T. Insulin receptor substrate (IRS)-2 is dephosphorylated more rapidly than IRS-1 via its association with phosphatidylinositol 3- kinase in skeletal muscle cells. The Journal of biological chemistry. 1997;272(19):12868–73. doi: 10.1074/jbc.272.19.12868. [DOI] [PubMed] [Google Scholar]
- 45.Hanke S, Mann M. The phosphotyrosine interactome of the insulin receptor family and its substrates IRS-1 and IRS-2. Molecular & cellular proteomics: MCP. 2009;8(3):519–34. doi: 10.1074/mcp.M800407-MCP200. [DOI] [PMC free article] [PubMed] [Google Scholar]
- 46.Kriauciunas KM, Myers MG, Jr, Kahn CR. Cellular compartmentalization in insulin action: altered signaling by a lipid-modified IRS-1. Molecular and cellular biology. 2000;20(18):6849–59. doi: 10.1128/mcb.20.18.6849-6859.2000. [DOI] [PMC free article] [PubMed] [Google Scholar]
- 47.Razzini G, Ingrosso A, Brancaccio A, Sciacchitano S, Esposito DL, Falasca M. Different subcellular localization and phosphoinositides binding of insulin receptor substrate protein pleckstrin homology domains. Molecular endocrinology (Baltimore, Md) 2000;14(6):823–36. doi: 10.1210/mend.14.6.0486. [DOI] [PubMed] [Google Scholar]
- 48.Cebecauer M, Spitaler M, Sergé A, Magee AI. Signalling complexes and clusters: functional advantages and methodological hurdles. Journal of Cell Science. 2010;123(3):309–320. doi: 10.1242/jcs.061739. [DOI] [PubMed] [Google Scholar]
- 49.Zhang HM, Chen H, Liu W, Liu H, Gong J, Wang H, Guo AY. AnimalTFDB: a comprehensive animal transcription factor database. Nucleic Acids Research. 2011 doi: 10.1093/nar/gkr965. [DOI] [PMC free article] [PubMed] [Google Scholar]
- 50.Xu C, Min J. Structure and function of WD40 domain proteins. Protein Cell. 2011;2(3):202–14. doi: 10.1007/s13238-011-1018-1. [DOI] [PMC free article] [PubMed] [Google Scholar]
- 51.Yugi K, Kubota H, Toyoshima Y, Noguchi R, Kawata K, Komori Y, Uda S, Kunida K, Tomizawa Y, Funato Y, Miki H, Matsumoto M, Nakayama Keiichi I, Kashikura K, Endo K, Ikeda K, Soga T, Kuroda S. Reconstruction of Insulin Signal Flow from Phosphoproteome and Metabolome Data. Cell Reports. 2014;8(4):1171–1183. doi: 10.1016/j.celrep.2014.07.021. [DOI] [PubMed] [Google Scholar]
- 52.Pearce LR, Komander D, Alessi DR. The nuts and bolts of AGC protein kinases. Nat Rev Mol Cell Biol. 2010;11(1):9–22. doi: 10.1038/nrm2822. [DOI] [PubMed] [Google Scholar]
- 53.Pearl LH, Barford D. Regulation of protein kinases in insulin, growth factor and Wnt signalling. Curr Opin Struct Biol. 2002;12(6):761–7. doi: 10.1016/s0959-440x(02)00386-x. [DOI] [PubMed] [Google Scholar]
- 54.Yadav H, Quijano C, Kamaraju AK, Gavrilova O, Malek R, Chen W, Zerfas P, Zhigang D, Wright EC, Stuelten C, Sun P, Lonning S, Skarulis M, Sumner AE, Finkel T, Rane SG. Protection from obesity and diabetes by blockade of TGF-β/Smad3 signaling. Cell metabolism. 2011;14(1):67–79. doi: 10.1016/j.cmet.2011.04.013. [DOI] [PMC free article] [PubMed] [Google Scholar]
- 55.Dhawan S, Dirice E, Kulkarni RN, Bhushan A. Inhibition of TGF-beta signaling promotes human pancreatic beta cell replication. Diabetes. 2016 doi: 10.2337/db15-1331. [DOI] [PMC free article] [PubMed] [Google Scholar]
- 56.Hawinkels LJ, Ten Dijke P. Exploring anti-TGF-beta therapies in cancer and fibrosis. Growth Factors. 2011;29(4):140–52. doi: 10.3109/08977194.2011.595411. [DOI] [PubMed] [Google Scholar]
- 57.Danielpour D, Song K. Cross-talk between IGF-I and TGF-β signaling pathways. Cytokine & Growth Factor Reviews. 2006;17(1–2):59–74. doi: 10.1016/j.cytogfr.2005.09.007. [DOI] [PubMed] [Google Scholar]
- 58.Palsgaard J, Emanuelli B, Winnay JN, Sumara G, Karsenty G, Kahn CR. Cross-talk between insulin and Wnt signaling in preadipocytes: role of Wnt co-receptor low density lipoprotein receptor-related protein-5 (LRP5) The Journal of biological chemistry. 2012;287(15):12016–26. doi: 10.1074/jbc.M111.337048. [DOI] [PMC free article] [PubMed] [Google Scholar]
- 59.Kobayashi M, Kishida S, Fukui A, Michiue T, Miyamoto Y, Okamoto T, Yoneda Y, Asashima M, Kikuchi A. Nuclear localization of Duplin, a beta-catenin-binding protein, is essential for its inhibitory activity on the Wnt signaling pathway. The Journal of biological chemistry. 2002;277(8):5816–22. doi: 10.1074/jbc.M108433200. [DOI] [PubMed] [Google Scholar]
- 60.Rosen ED, MacDougald OA. Adipocyte differentiation from the inside out. Nat Rev Mol Cell Biol. 2006;7(12):885–896. doi: 10.1038/nrm2066. [DOI] [PubMed] [Google Scholar]
- 61.Petersen RK, Madsen L, Pedersen LM, Hallenborg P, Hagland H, Viste K, Doskeland SO, Kristiansen K. Cyclic AMP (cAMP)-mediated stimulation of adipocyte differentiation requires the synergistic action of Epac- and cAMP-dependent protein kinase- dependent processes. Molecular and cellular biology. 2008;28(11):3804–16. doi: 10.1128/MCB.00709-07. [DOI] [PMC free article] [PubMed] [Google Scholar]
- 62.Yeung F, Ramírez Cristina M, Mateos-Gomez Pedro A, Pinzaru A, Ceccarini G, Kabir S, Fernández-Hernando C, Sfeir A. Nontelomeric Role for Rap1 in Regulating Metabolism and Protecting against Obesity. Cell Reports. 2013;3(6):1847–1856. doi: 10.1016/j.celrep.2013.05.032. [DOI] [PMC free article] [PubMed] [Google Scholar]
- 63.Noguchi M, Hirata N, Suizu F. The links between AKT and two intracellular proteolytic cascades: Ubiquitination and autophagy. Biochimica et Biophysica Acta (BBA) -Reviews on Cancer. 2014;1846(2):342–352. doi: 10.1016/j.bbcan.2014.07.013. [DOI] [PubMed] [Google Scholar]
- 64.Zhande R, Mitchell JJ, Wu J, Sun XJ. Molecular mechanism of insulin-induced degradation of insulin receptor substrate 1. Molecular and cellular biology. 2002;22(4):1016–26. doi: 10.1128/MCB.22.4.1016-1026.2002. [DOI] [PMC free article] [PubMed] [Google Scholar]
- 65.Sun L, Chen ZJ. The novel functions of ubiquitination in signaling. Current opinion in cell biology. 2004;16(2):119–26. doi: 10.1016/j.ceb.2004.02.005. [DOI] [PubMed] [Google Scholar]
- 66.Kim AY, Park YJ, Pan X, Shin KC, Kwak SH, Bassas AF, Sallam RM, Park KS, Alfadda AA, Xu A, Kim JB. Obesity-induced DNA hypermethylation of the adiponectin gene mediates insulin resistance. Nat Commun. 2015;6 doi: 10.1038/ncomms8585. [DOI] [PMC free article] [PubMed] [Google Scholar]
Associated Data
This section collects any data citations, data availability statements, or supplementary materials included in this article.
Supplementary Materials
Fig. S1: Volcano plot representation of the differentially regulated proteins in basal condition among the three cell populations. Differentially regulated proteins between A) WT cells and IRS-1−/− cells; B) WT cells and IRS-2−/− cells; C) IRS-1−/− cells and IRS-2−/− cells; in each plot, the X axis represents the t-test differences among the two compared populations and the Y axis represents the p-values. Considering the p-values <0.001 as significant, around 1-2% of the total 2333 quantified protein are significantly regulated among the three cell lines.
Fig. S2: In vivo western blot analysis of proteins from (A) liver of WT mice injected with 1 unit of insulin/saline for 5 minutes; n= 6 mice per condition; or from (B) subcutaneous white adipose tissue of WT mice injected with 1 unit of insulin/saline for 5 minutes; n= 5-6 mice per condition. The left panel visualizes representative blots and the right panel represents the western blot quantification. The vertical axis shows the fold change of protein phosphorylation upon 5 min insulin treatment compared to saline injection. Values are mean ± SEM. * indicates vs. control saline (p ≤ 0.05) analyzed by unpaired t-tests.
Fig. S3: KEGG pathway: insulin signalling pathways; the KEGG pathway shown here represents different layers of insulin signalling pathway, proteins marked with the red star were as well identified in our dataset.
Table S1: List of identified, quantified, and regulated proteins, phosphoproteins, and phosphopeptides; the table includes two sheets, sheet 1) shows the raw MS data information which includes 58 individual columns (A-BF) representing the Proteins UniProt IDs, Positions of phosphorylation within proteins, Leading proteins, Protein names, Gene names, the SILAC ratio of 7 experimental setups including WT cells, Geomean of the 7 different setups, the number of experimental setups in which the specific phosphopeptides were quantified, the number of setups among 7 in which the SILAC ratio were found to be >1.5, the number of setups among 7 in which the SILAC ratio were found to be <0.5, the SILAC ratio of 7 experimental setups including IRS-1−/− cells, Geomean of the 7 different setups, the number of experimental setups in which the specific phosphopeptides were quantified, the number of setups among 7 in which the SILAC ratio were found to be >1.5, the number of setups among 7 in which the SILAC ratio were found to be <0.5, the SILAC ratio of 5 experimental setups including IRS-2−/− cells, Geomean of the 5 different setups, the number of experimental setups in which the specific phosphopeptides were quantified, the number of setups among 5 in which the SILAC ratio were found to be >1.5, the number of setups among 7 in which the SILAC ratio were found to be <0.5, t-test WT-IRS1, t-test WT-IRS2, t-test IRS1-IRS2, Phospho (STY) Probabilities, Fasta headers, Localization prob, Score diff, PEP Score, Score for localization, Number of Phospho (STY) Amino acid, Sequence window, Modification window, Peptide window coverage, Modified sequence, Phospho (STY) Probabilities, Phospho (STY) Score diffs, Position in peptide, Charge, m/z, and Mass error [ppm]. The entries in each column are dependent to the entries in other columns of each row. Sheet 2) is the summarized version of sheet 1 including 25 individual columns (A-Y) representing the list of All quantified phosphosites, All quantified phosphoproteins known to function as TFs/TRs, All stables phosphopeptides, All insulin/IGF-1 regulated phosphosites, All insulin/IGF-1 regulated phosphoproteins known to function as TFs/TRs, All insulin/IGF-1 upregulated phosphosites, All insulin/IGF-1 downregulated phosphosites, All phosphosites table in WT cells, All insulin/IGF-1 regulated phosphosites in WT cells, All insulin/IGF-1 upregulated phosphosites in WT cells, All insulin/IGF-1 downregulated phosphosites in WT, All stable phosphosites in IRS-1−/−, All insulin/IGF-1 regulated phosphosites in IRS-1−/− cells, All insulin/IGF-1 upregulated phosphosites in IRS-1−/− cells, All insulin/IGF-1 downregulated phosphosites in IRS-1−/− cells, All stable phosphosites in IRS-2−/− cells, All insulin/IGF-1 regulated phosphosites in IRS-2−/− cells, All insulin/IGF-1 upregulated phosphosites in IRS-2−/− cells, All insulin/IGF-1 downregulated phosphosites in IRS- 2−/− cells, Commonly regulated phosphosites among WT cells and IRS-1−/− cells, WT-IRS-1 t-test, Commonly regulated phosphosites among WT cells and IRS-2−/− cells, WT-IRS-2 t-test, Commonly regulated phosphosites among IRS-1−/− cells and IRS-2−/− cells, IRS-1-IRS-2 t-test. The commonly regulated phosphosites with the t-test <0.1 are marked in green. The entries in each column are independent of the entries in other columns of each row.
Table S2: Information about proteins and their abundance among the three cell populations in the basal (without IGF-1 treatment) condition; the table includes two sheets, sheet 1) shows the raw MS data information which includes 25 individual columns (A-Y) representing the Protein IDs, Protein names, Gene names, SILAC ratios in 3 biological replicates each performed in 3 different arrangements of double SILAC labeling (M/L, H/L, H/M) which only included WT cells, IRS-1−/− cells and IRS-2−/− cells, Score, Intensity, Intensity L, Intensity M, Intensity H, -log 10 p-value of IRS1−/−/WT, t-test Difference_IRS1−/−/WT, -log 10 p-value of IRS2−/−/WT, t-test Difference_IRS2−/−/WT, -log 10 p-value of IRS2−/−/IRS1−/−, t-test Difference_IRS2−/−/IRS1−/−, Protein IDs, and Majority protein IDs. The entries in each column are related to the entries in other columns of each row. Sheet 2) is the summarized version of sheet 1 which includes three main columns each composed of three sub-columns representing the comparison (A-C) between WT cells and IRS-1−/− cells, (E-G) between WT cells and IRS-2−/− cells, and (I-K) between IRS-1−/− cells and IRS-2−/− cells. The three main columns are divided by an empty column colored in black. The first sub-column of each column indicates the gene name, the second one the t-test difference, and the third one indicates the –log10 p-values between the two compared cell lines. The entries in each main column are independent of the entries in other columns of each row. However, the entries in each sub-column are related to the entries in other sub-columns of each row within a main column.
Table S3: Enriched protein domains; enriched domains of globally phosphoregulated proteins are identified by DAVID Bioinformatics Resources version 6.7. The table includes three individual columns indicating the terminology of the enriched protein domains, the number of proteins in our dataset composed of that specific protein domain, and the p-value of the enriched domains among all identified domains in our dataset. The entries in each column are related to the entries in other columns of each row.
Table S4: GO term annotation of the regulated phosphoproteins in the three cell lines; GOrilla was used to annotate the regulated phosphoproteins in each cell population based on their biological process, molecular function, and cellular compartment. The table includes three main columns each composed of four sub-columns (A-D) representing the GO term information in WT cells, (F-I) the GO term information in IRS-1−/− cells, and (K-N) the GO term information of IRS-2−/− cells. The three main columns are divided by an empty column colored in black. The first sub-column of each column indicates the GO term description, the second one shows the p- value, the third one indicates the FDR corrected p-values or q-values, and the fourth sub-column of each column represent the fold enrichment of each term in our dataset. The entries in each main column are independent of the entries in other columns of each row. However, the entries in each sub-column are related to the entries in other sub-columns of each row within a main column.
Table S5: Known and novel identified regulated phosphosites in three cell populations; comparing our dataset with previously published and available phosphorylation databases we identified several known as well as novel regulated phosphosites on proteins. The table includes four individual columns indicating 1) all IGF-1 regulated phosphosites; 2) IGF-1 regulated phosphosites in WT cells; 3) IGF-1 regulated phosphosites in IRS-1−/− cells; and 4) IGF-1 regulated phosphorylation sites in IRS-2−/− cells. In each column, the cells marked in green represent the previously identified phosphosites and the cells left with no color represent the novel phosphorylation sites. The entries in each column are independent of the entries in other columns of each row.
Table S6: GO term annotation of the novel regulated phosphosites; we used Panther GO enrichment annotation tool (version 10.0 Released 2015-05-15) to identify the overrepresented GO terms among the novel identified regulated phosphosites in our dataset. The table includes three main columns each composed of five sub-columns (A-E) representing the GO term information based on biological processes, (G-K) the GO term information of molecular function, and (M-Q) the GO term information of cellular compartment. The three main columns are divided by an empty column colored in black. The five sub-columns in each column represent 1) description of the GO term; 2) the number of proteins assigned to that specific term in Mus-Musculus reference list; 2) the number of proteins assigned to that specific term in our submitted protein list; 4) the fold enrichment of the specific term in our submitted list compared to the background reference list of Mus musculus; and 5) the p-values. The entries in each main column are independent of the entries in other columns of each row. However, the entries in each sub-column are related to the entries in other sub-columns of each row within a main column.
Table S7: Classification of phosphosites identified in three cell populations; by comparing IGF-1 regulated phosphosites in the three cell populations (WT, IRS-1−/−, and IRS-2−/−), we classified the phosphosites into four categories based on their regulation. The table includes four main column divided by an empty column colored in black. The four columns respectively represent; 1) the phosphosites regulated among all three cell lines; 2) regulated in WT cells, and stable in IRS-1−/− cells and IRS-2−/− cells; 3) regulated in WT cells and IRS-1−/− cells, stable in IRS-2−/− cells; and 4) regulated in WT cells and IRS-2−/− cells, stable in IRS-1−/− cells. Each main column includes 14 sub-columns representing the sequence of the phosphopeptides, their gene ID and phosphosite, the average of the SILAC ratios in three cell lines, the STDEV of the SILAC ratios and log10 of STEDV in 3 cell lines, the gmean of SILAC ratio in WT, IRS-1−/− and IRS-2−/− cells. The entries in each main column are independent of the entries in other columns of each row. However, the entries in each sub-column are related to the entries in other sub- columns of each row within a main column.
Table S8: Motif-x identified overrepresented motifs in regulated phosphopeptides; the table provides information about Motif-X output and includes 3 main columns representing the enriched motifs of the regulated phosphopeptides in WT, IRS-1−/−, and IRS-2−/− cells. Motif-X algorithm used the mouse database as background. The three main columns are divided by an empty column colored in black and each includes 7 sub-columns representing 1) the overrepresented motif identified by Motif-X; 2) motif score; 3) foreground matches; 4) foreground size; 5) background matches; 6) background size; and 7) fold increase, respectively. The entries in each main column are independent of the entries in other columns of each row. However, the entries in each sub-column are related to the entries in other sub-columns of each row within a main column.
Table S9: Information of the kinases in our dataset; the table includes five individual sub- columns representing 1) All Identified Kinases; 2) All Regulated Kinases; 3) Regulated Kinases in WT; 4) Regulated Kinases in IRS-1−/− cells; 5) Regulated Kinases in IRS-2−/− cells. The entries in each main column are independent of the entries in other columns of each row.
Table S10: NetworKIN prediction of potential kinases of IGF-1 induced regulated phosphosites in WT, IRS-1−/−, and IRS-2−/− cells; the table provides information about NetworKIN input and output and includes 3 main columns representing the kinase information of the regulated phosphopeptides in WT, IRS-1−/−, and IRS-2−/− cells. The three main columns are divided by an empty column colored in black and each includes 5 sub-columns respectively represent 1) the substrate ID; and 2) the phosphorylation position in our dataset submitted to NetworKIN as input; 3) the predicted kinase ID; 4) the NetworKIN score for the predicted kinases; and 5) the name of the kinase group/family predicted by NetworKIN. The entries in each main column are independent of the entries in other columns of each row. However, the entries in each sub-column are related to the entries in other sub-columns of each row within a main column.
Table S11: NetworKIN kinase prediction of phosphoregulated kinases in WT, IRS-1−/−, and IRS-2−/− cells; the table provides information about NetworKIN input and output and includes 3 main columns representing the potential kinase information of the phosphoregulated kinases in WT, IRS-1−/−, and IRS-2−/− cells. The three main columns are divided by an empty column colored in black and each includes 6 sub-columns respectively represent 1) the substrate ID of the kinase (the kinase names are presented in yellow marked cells); and 2) the phosphorylation position; and 3) the sequence window of the phosphorylated kinases identified in our dataset and were submitted to NetworKIN as input; 4) the predicted kinase ID potential to phosphorylate the kinase in our dataset in response to IGF-1 treatment; 5) the NetworKIN score for the predicted kinases; and 6) the name of the kinase group/family predicted by NetworKIN. The entries in each main column are independent of the entries in other columns of each row. However, the entries in each sub-column are related to the entries in other sub-columns of each row within a main column.