Abstract
Many human cancers are resistant to immunotherapy, for reasons that are poorly understood. We used a genome-scale CRISPR-Cas9 screen to identify mechanisms of tumor cell resistance to killing by cytotoxic T cells, the central effectors of antitumor immunity. Inactivation of >100 genes—including Pbrm1, Arid2, and Brd7, which encode components of the PBAF form of the SWI/SNF chromatin remodeling complex—sensitized mouse B16F10 melanoma cells to killing by T cells. Loss of PBAF function increased tumor cell sensitivity to interferon-γ, resulting in enhanced secretion of chemokines that recruit effector T cells. Treatment-resistant tumors became responsive to immunotherapy when Pbrm1 was inactivated. In many human cancers, expression of PBRM1 and ARID2 inversely correlated with expression of T cell cytotoxicity genes, and Pbrm1-deficient murine melanomas were more strongly infiltrated by cytotoxic T cells.
Cancer immunotherapies that target inhibitory receptors on T cells, including the PD-1 receptor, can induce durable responses, but most patients do not respond (1). The mechanisms that determine resistance to these immunotherapies remain poorly understood. Cytotoxic T cells are key effectors of tumor immunity on the basis of their ability to detect and kill transformed cells following T cell receptor (TCR) recognition of peptide antigens bound to major histocompatibility complex (MHC) class I proteins (2). T cell–mediated cytotoxicity can be especially efficient, but it is diminished when MHC class I expression by tumor cells is reduced. Cytotoxicity is also inhibited when tumor cells express PD-L1, the ligand for the programmed cell death 1 (PD-1) receptor on T cells (3). We hypothesized that sensitivity and resistance of tumor cells to T cell–mediated attack is dynamically regulated by multiple pathways in tumor cells that could represent new targets for immunotherapy.
Discovery of tumor cell–intrinsic genes regulating sensitivity and resistance to T cell–mediated killing
Tumor cells transduced with a genome-scale gRNA library were subjected to selection with cytotoxic T cells to identify genes that controlled resistance to T cell–mediated killing (Fig. 1A). We selected the murine B16F10 melanoma cell line for this screen because it is resistant to checkpoint blockade with antibodies targeting the PD-1 and/or CTLA-4 (cytotoxic T lymphocyte–associated protein 4) receptors (4, 5). Inactivation of resistance genes resulted in depletion of the corresponding gRNAs, but such depletion could only be detected with sufficient sensitivity when most tumor cells had sufficient Cas9 activity. We therefore selected a B16F10-Cas9 clone with high editing efficiency (fig. S1) and tested it with positive controls that were either more resistant (B2m−/−) or sensitive (Cd274−/−) to T cell–mediated cytotoxicity (fig. S2). This B16F10-Cas9 clone was then transduced with a genome-scale gRNA library in a lentiviral vector (6). Selection was performed either with Pmel-1 T cells, which have a relatively low TCR affinity for an endogenous melanoma antigen (7), or high-affinity OT-I T cells (8). Edited tumor cells were selected by 3-day coculture with Pmel-1 CD8 T cells (or 1 day for OT-I T cells), and the representation of all gRNAs was quantified by Illumina sequencing of the gRNA cassette (Fig. 1A). The specificity of gRNA enrichment or depletion was demonstrated by comparing selection with tumor-specific T cells versus control T cells of irrelevant specificity (fig. S3). This comparison also controlled for potential effects of gRNAs on cell proliferation and viability.
Fig. 1. Systematic discovery of genes and pathways regulating sensitivity and resistance of tumor cells to Tcell–mediated killing.
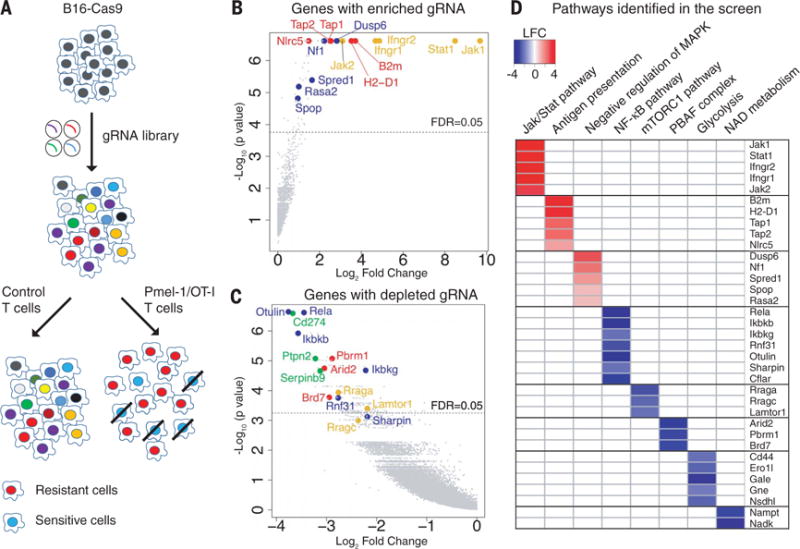
(A) Screening strategy. Cas9-expressing B16F10 cells were transduced with a genome-scale gRNA library (four gRNAs/gene). Edited B16F10 cells were cocultured with activated cytotoxic T cells followed by Illumina sequencing of gRNA representation. Specific selection was performed with Pmel-1 T cells (specific for gp100 melanoma antigen) or OT-I T cells (specific for Ova peptide). Control selection was performed with T cells of irrelevant specificity. (B) Top genes for enriched gRNAs from Pmel-1 screen. Candidate genes were plotted based on mean log2 fold change of gRNA counts compared to control selection and P values computed by MaGeCK (Model-based Analysis of Genome-wide CRISPR-Cas9 Knockout). Dashed line indicates a FDR (false discovery rate) of 0.05. Annotated genes represent MHC class I (red), interferon (yellow), and Ras/MAPK (blue) pathways. (C) Top genes for depleted gRNAs from Pmel-1 screen. Genes related to the PBAF form of SWI/SNF complex (red), NF-κB pathway (blue), mTORC1 pathway (yellow), and known negative immune regulators (green) were annotated. (D) Selected pathways and corresponding genes identified in the Pmel-1 screen. Color scale represents log2 fold change of average gRNA representation.
A number of genes known to be essential for T cell–mediated tumor immunity were identified among the enriched gRNAs in both Pmel-1 and OT-I screens (Fig. 1B, fig. S4A, and tables S1 and S2), including key genes in the MHC class I and interferon-γ (IFN-γ) signaling pathways (9–11). Mutations in both MHC and interferon pathway genes were shown to confer resistance to cancer immunotherapy (12, 13). T cell–based CRISPR-Cas9 screens have been described by two other laboratories. One of these studies performed an in vivo screen covering 2368 murine genes and highlighted the phosphatase Ptpn2 as a new target for immunotherapy (14). The second study focused on human tumor cells and T cells and reported that mutations in APLNR render tumor cells resistant to T cell–mediated cytotoxicity (15). Our approach emphasized sensitive detection of depleted gRNAs in a genome-wide manner, which allowed us to discover additional mechanisms conferring resistance to immunotherapy.
A notable result was that gRNAs were depleted for a large number of genes (tables S1 and S2), indicating that inactivation of these genes sensitized tumor cells to T cell–mediated killing. Top genes in this group included known negative immune regulators, including Cd274 [encoding PD-L1 (16, 17)], Ptpn2 (18), and Serpinb9 (19) (Fig. 1C and fig. S4B). However, the vast majority of identified genes had not been previously implicated in resistance to T cell–mediated killing (tables S1 and S2).
Pathways regulating resistance of tumor cells to T cell–mediated cytotoxicity
We performed gene set enrichment analysis to identify known gene sets and pathways for genes corresponding to enriched or depleted gRNAs (tables S3 and S4). Five negative regulators of the Ras/MAPK (mitogen-activated protein kinase) pathway were identified among enriched gRNAs, including Nf1 (20), Dusp6 (21), Spred1 (22), Rasa2 (23), and SPOP (24) (Fig. 1D). Ras pathway activation is very common among human cancers and may not only promote tumor cell growth but also attenuate tumor immunity. Braf is immediately downstream of Ras, and small-molecule inhibitors of mutant BRAFV600E elicit stronger cytotoxic T cell responses in melanoma patients and murine tumor models (25–27).
Analysis of depleted gRNAs revealed a number of resistance pathways to T cell–mediated killing (Fig. 1, C and D, and table S4). All three unique components of a SWI/SNF chromatin remodeling complex referred to as the polybromo and BRG1-associated factors (PBAF) complex (28, 29) were strongly depleted (Arid2, Pbrm1, and Brd7), providing strong evidence that this complex conferred resistance to T cell–mediated killing (Fig. 1D). We also identified resistance genes in the nuclear factor κB (NF-κB) pathway (30) (Otulin, Rela, Ikbkg, Ikbkb, Rnf31, and Sharpin) and key metabolic pathways, including mTORC1 (mechanistic target of rapamycin complex 1) [Rraga, Rragc, and Lamtor1, which are required for mTORC1 recruitment to lysosomes (31)], glycolysis (including Nsdhl, Gne, Gale, Ero1l, and Cd44), and nicotinate/nicotinamide metabolism (including Nadk and Nampt). The NF-κB pathway was also identified as a resistance mechanism by Manguso et al. (14). Control experiments demonstrated that inactivation of such genes did not merely increase sensitivity to cell death; inactivation of representative genes (Otulin, Dusp6, or Nf1) in B16F10-Cas9 cells did not render them more sensitive to doxorubicin-induced cell death (fig. S5). Most of the identified genes (253 of 313 genes) were validated in a secondary screen (fig. S6), which also confirmed the major pathways described above (fig. S7).
Clinical relevance of PBAF complex to tumor immunity
We used TCGA RNA sequencing (RNA-seq) data sets and TIMER (32) to examine the relevance of the CRIPSR screen (fig. S8) and PBAF complex in human cancers. We found that mRNA levels of ARID2 and PBRM1 negatively correlated with GZMB and PRF1 mRNA levels in many human cancer types (Fig. 2A; fig. S9, A and B; and table S5), suggesting that lower expression of ARID2 and PBRM1 is correlated with higher cytotoxic activity contributed by CD8 T cells (fig. S9, C and D) in human cancers. This correlation was not merely explained by the degree of CD8 T cell infiltration because ARID2 and PBRM1 mRNA levels were also negatively associated with the GZMB/CD8A ratio (Fig. 2B). In addition, we found that low ARID2 mRNA levels were associated with a substantial survival benefit in melanoma patients, but only for those tumors with a higher degree of infiltration by CD8 T cells (on the basis of CD8 expression) (Fig. 2C). These data suggest that ARID2 and PBRM1 affect tumor immunity in a variety of human cancers.
Fig. 2. Expression of ARID2 and PBRM1 is negatively correlated with T cell cytotoxicity markers in TCGA data sets.
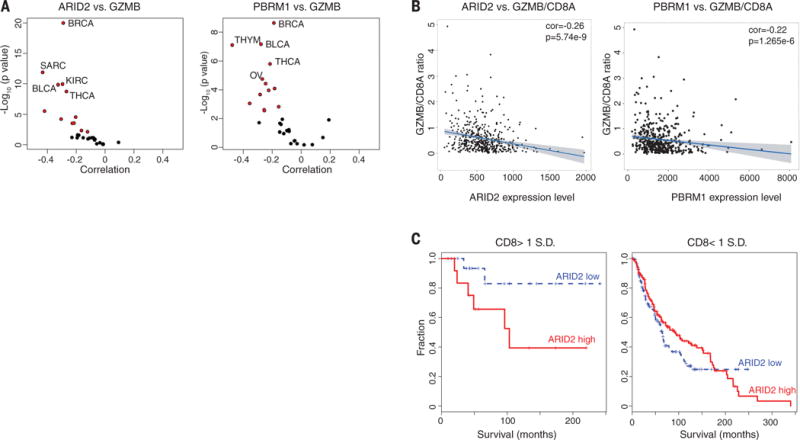
(A) Correlation of ARID2 and PBRM1 mRNA levels with GZMB mRNA levels in indicated cancers. Volcano plot showing the Spearman’s correlation and estimated significance of ARID2 (left) or PBRM1 (right) with GZMB mRNA levels from RNA-seq data across TCGA cancer types calculated by TIMER (Tumor Immune Estimation Resource) and adjusted for tumor purity (32). Each dot represents a cancer type in TCGA; red dots indicate significant correlations (P < 0.01). (B) Analysis of ARID2 and PBRM1 mRNA levels in relation to GZMB and CD8A as cytotoxicity and CD8 T cell infiltration markers, respectively. Spearman’s correlation of ARID2 (left) and PBRM1 (right) mRNA levels to GZMB/CD8A mRNA ratio in the TCGA melanoma data set. (C) Correlation of ARID2 expression level with survival of melanoma patients depending on calculated level of CD8 T cell infiltration. All patients in the TCGA melanoma study were divided according to the expression level of ARID2 (higher or lower than mean expression value of all patients). The impact of ARID2 expression level on survival is shown for patients whose tumors had higher (>1 SD) or lower (<1 SD) expression of CD8 [(CD8A + CD8B)/2].
Relevance of PBAF complex to immune checkpoint blockade therapy
The SWI/SNF complex regulates chromatin accessibility for transcription factors. The BAF version of SWI/SNF induces dissociation of Polycomb repressive complex 1 and 2 (PRC1 and PRC2) (33), but the PBAF complex may operate through a different biochemical mechanism. The two complexes share core subunits, but unique components are ARID1A/B for the BAF (BRG1-associated factors) complex as well as ARID2, PBRM1, and BRD7 for the PBAF complex (Fig. 3A) (28). To validate the role of the PBAF complex in regulating sensitivity to T cell–mediated killing, we generated B16F10 tumor cell lines in which the three genes of the PBAF complex were individually mutated by CRISPR-Cas9. Western blotting experiments confirmed diminished amounts of the corresponding proteins in the mutant cell lines (Fig. 3B). Inactivation of Arid2 diminished protein abundance of BRD7 and PBRM1, consistent with a prior study (34), whereas inactivation of Pbrm1 did not affect protein abundance of ARID2 or BRD7. Partial complexes with some chromatin remodeling activity may therefore remain in some of these knockout cell lines. Coculture of Arid2, Pbrm1, or Brd7 mutant tumor cells with cytotoxic T cells resulted in enhanced depletion of PBAF mutant cell lines compared to B16F10-Cas9 cells transduced with a control gRNA (referred to as control B16F10 tumor cells) in a 3-day coculture assay (Fig. 3C). However, inactivation of Arid2, Pbrm1, or Brd7 genes did not alter cell proliferation over a 2-week period (fig. S10A).
Fig. 3. Inactivation of PBAF complex sensitizes tumor cells to T cell–mediated killing and synergizes with checkpoint blockade therapy.
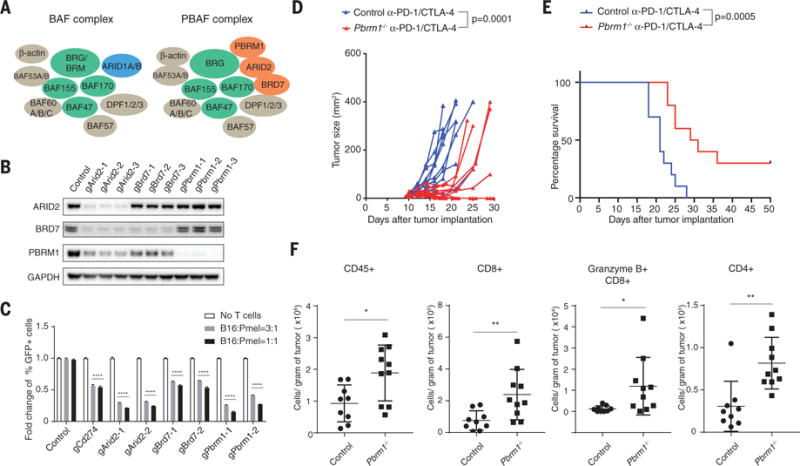
(A) Cartoon illustrating the composition of BAF and PBAF versions of SWI/SNF complex. (B) Western blot showing protein abundance of ARID2, BRD7, PBRM1, and GAPDH in control and indicated knockout cell lines. (C) Green fluorescent protein (GFP)–positive Arid2-, Pbrm1-, or Brd7-deficient B16F10 cells were mixed with GFP-negative control B16F10 cells at approximately 1:1 ratio. Tumor cells were cocultured with Pmel-1 Tcells at indicated effector-to-target ratios for 3 days in triplicates; the fold change of the percentage of GFP-positive tumor cells was determined by fluorescence-activated cell sorting. Two-way analysis of variance (ANOVA) was used to determine statistical significance (****P < 0.0001). Values represent mean ± SD. (D) Mice bearing control (n = 10) or Pbrm1-deficient B16F10 tumors (n = 10) were treated with anti–PD-1 (α-PD-1, 200 μg/mouse) plus anti–CTLA-4 (α-CTLA-4, 100 μg/mouse), and tumor size was measured. Two-way ANOVA was used to determine statistical significance for time points when all mice were viable for tumor measurement. (E) Survival of mice inoculated with control (n = 10) or Pbrm1-deficient B16F10 cells (n = 10) and treated with α-PD-1 plus α-CTLA-4. Log-rank (Mantel-Cox) test was used to determine statistical significance. (F) Flow cytometric analysis of immune cell infiltration in Pbrm1-deficient and control B16F10 tumors. The number of CD45+, CD4+, CD8+, and Granzyme B+ CD8+ T cells was determined per gram of tumor. Mann-Whitney test was used to determine significance (*P < 0.05, **P < 0.01). Values represent mean ± SD. Data in (C) to (F) are representative of two independent experiments.
B16F10 tumor cells are resistant to checkpoint blockade with antibodies against PD-1 (anti–PD-1) and/or anti–CTLA-4, and we therefore examined whether inactivation of Pbrm1 would render B16F10 tumor cells sensitive to checkpoint blockade. Anti–PD-1 plus anti–CTLA-4 conferred therapeutic benefit in mice bearing Pbrm1 mutant B16F10 tumors, but this treatment was ineffective against control B16F10 tumors (Fig. 3, D and E, and fig. S10, B and C). Significantly increased numbers of CD45+ immune cells, CD4 and CD8 T cells, and granzyme B+ CD8 T cells were present in Pbrm1-deficient compared to control B16F10 tumors treated with PD-1 plus CTLA-4 checkpoint blockade (Fig. 3F and fig. S10D). Single-cell RNA-seq analysis of sorted CD45+ immune cells showed that gene expression signatures associated with productive antitumor immunity (IFN-γ response, IFN-α response, and tumor necrosis factor α signaling via NF-κB) were significantly enriched in Pbrm1-deficient compared to control B16F10 tumors for both myeloid cells (dendritic cells and M1-like macrophages) and lymphoid cells (T cells and natural killer cells) (fig. S11, A to C). These single-cell data also identified an increased percentage of dendritic cells and a higher ratio of tumor-inhibitory M1-like macrophages to tumor-promoting M2-like macrophages in Pbrm1-deficient compared to control B16F10 tumors (fig. S11D). Thus, inactivation of Pbrm1 not only sensitizes tumor cells to T cell–mediated cytotoxicity but also results in a more favorable tumor microenvironment.
Regulation of IFN-γ and mTORC1 pathways by the PBAF complex
To investigate the molecular mechanisms by which the PBAF complex regulates the sensitivity of B16F10 tumor cells to T cell–mediated killing, we examined the transcriptome of PBAF-deficient B16F10 cells by RNA-seq. Arid2- and Pbrm1-deficient B16F10 cells shared similar gene expression profiles (fig. S12, A and B), consistent with their critical role in the PBAF complex. The transcriptome of Brd7 mutant B16F10 cells was more distinct, suggesting that Brd7 may also have PBAF-independent functions (fig. S12A). mRNAs for a number of metabolic pathways were concordantly down-regulated in Arid2 and Pbrm1 mutant cells compared to control B16F10 tumor cells, in particular gene sets associated with mTORC1 activation and cholesterol homeostasis (fig. S12, C and D, and fig. S13). mTORC1 was also a major resistance pathway for T cell–mediated cytotoxicity in the CRISPR-Cas9 screen (Fig. 1D).
Silencing of BAF200 (Arid2) with a small interfering RNA was shown to reduce the expression of interferon induced transmembrane protein 1 (IFITM1) by IFN-α but not other interferon-regulated genes (34). We systematically examined whether the PBAF complex regulates gene expression in response to IFN-γ, given the importance of this T cell–derived cytokine for tumor immunity (12). RNA-seq analysis showed that gene sets related to IFN-γ and IFN-α response were significantly enriched among genes concordantly up-regulated in Arid2- and Pbrm1-deficient cells compared to B16F10 control cells treated with IFN-γ (Fig. 4, A and B), suggesting that ARID2 and PBRM1 suppressed the expression of IFN-γ–responsive genes. Many of the IFN-γ–responsive genes suppressed by Arid2 and Pbrm1 were relevant to innate immunity or encoded chemokines (Cxcl9 and Cxcl10) (Fig. 4C) (35). Pbrm1-deficient tumor cells also secreted substantially larger amounts of CXCL9 and CXCL10—key chemokines for recruitment of effector T cells that express the CXCR3 chemokine receptor—compared to control B16F10 cells following IFN-γ stimulation (Fig. 4, D to F) (35). Arid2-deficient cells had significantly increased surface levels of H2-Kb over a range of IFN-γ concentrations compared to control B16F10 cells. Also, all three mutants showed increased surface expression of PD-L1 in response to IFN-γ (fig. S14). Brd7- and Pbrm1-deficient cells only showed enhanced surface expression of PD-L1 but not H2-Kb in response to IFN-γ stimulation (fig. S14), which may be due to partial complexes that retain some activity. These data demonstrate that Arid2 and Pbrm1 attenuate the responsiveness of B16F10 tumor cells to IFN-γ, a key cytokine for the interaction of tumor cells and T cells.
Fig. 4. Enhanced responsiveness to IFN-γ stimulation by Arid2- and Pbrm1-deficient tumor cells.
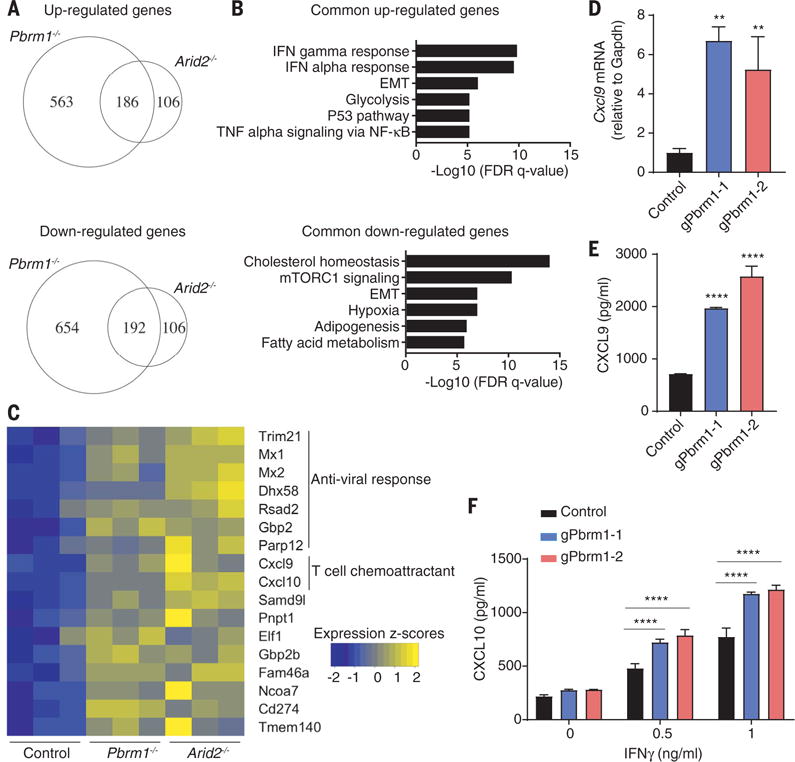
(A to C) RNA-seq analysis of Arid2- or Pbrm1-deficient cells and control B16F10 cells treated with IFN-γ (10 ng/ml) for 24 hours. (A) Venn diagram showing differentially regulated mRNAs in the presence of IFN-γ. (B) Hallmark gene sets enriched for commonly up- or downregulated mRNAs in both Arid2- and Pbrm1-deficient cells compared to control B16F10 cells in the presence of IFN-γ treatment [as shown in (A)]. (C) Heat map showing expression value (z-score based on cufflink count) of interferon-responsive genes in control, Arid2-, and Pbrm1-deficient B16F10 cells following IFN-γ treatment. (D and E) Cxcl9 mRNA level (D) and Cxcl9 protein secretion (E) comparing Pbrm1-deficient and control B16F10 tumor cells stimulated with IFN-γ (10 ng/ml) for 24 hours. Values represent mean ± SD. (F) Cxcl10 secretion by Pbrm1-deficient and control B16F10 tumor cells stimulated with IFN-γ (0, 0.5, and 1 ng/ml) for 24 hours. Values represent mean ± SD. One-way ANOVA (D and E) and two-way ANOVA (F) were used to determine significance. **P < 0.01, ****P < 0.0001. Data in (D) and (F) are representative of two independent experiments.
The PBAF complex regulates chromatin accessibility of IFN-γ–inducible genes
The major function of the SWI/SNF complex is to regulate chromatin accessibility for transcription factors. We therefore performed ATAC-seq (assay for transposase-accessible chromatin using sequencing) to directly assess chromatin accessibility in Pbrm1-deficient and control B16F10 tumor cells with and without IFN-γ treatment for 24 hours. Following IFN-γ treatment, a substantially larger number of genomic sites were accessible in Pbrm1-deficient than control B16F10 cells, consistent with the RNA-seq data (Fig. 5A). Sites in cluster 1 (648 sites) were more accessible before IFN-γ treatment in Pbrm1-deficient compared to control cells, suggesting that the corresponding genes were poised to respond to IFN-γ (Fig. 5, B and C, and fig. S15A). Also, 2708 sites (cluster III) showed enhanced accessibility following IFN-γ exposure in Pbrm1 mutant compared to control B16F10 cells, but their accessibility was similar between the two cell lines in the absence of IFN-γ (Fig. 5, B and C, and fig. S15B). Motif and target gene prediction analysis suggests that these sites were highly enriched with interferon regulatory factor (IRF) motifs and associated with IFN-regulated genes (fig. S15, C to E). Thus, inactivation of Pbrm1 enhances chromatin accessibility for transcription factors at promoters or enhancers of many IFN-γ-inducible genes.
Fig. 5. Enhanced chromatin accessibility for IFN-γ–responsive genes in Pbrm1-deficient tumor cells.
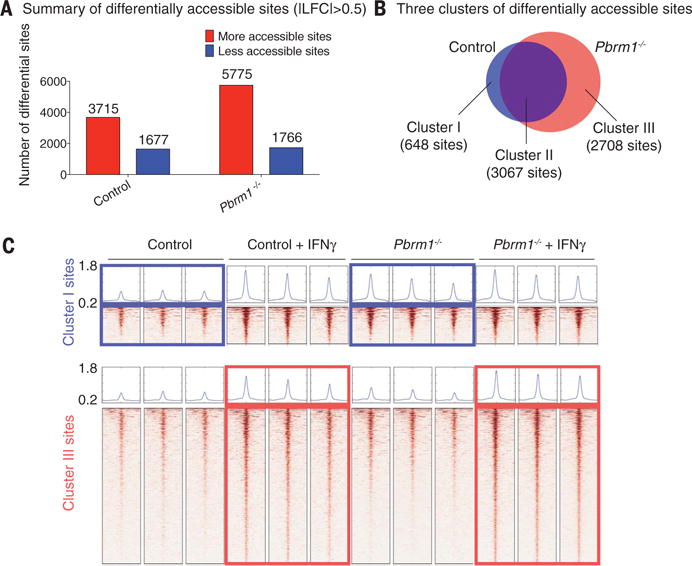
ATAC-seq was performed on Pbrm1-deficient and control B16F10 cells with or without IFN-γ stimulation (10 ng/ml) for 24 hours. (A) Genome-wide analysis of differentially accessible chromatin sites (|log2 fold change| > 0.5) following IFN-γ stimulation in control versus Pbrm1-deficient B16F10 tumor cells. (B) Venn diagram illustrating accessible sites gained following IFN-γ treatment in control (blue) and Pbrm1-deficient (red) cells. (C) Chromatin accessibility heat maps for all sites in clusters I (top panel) and III (bottom panel). Aggregated reads within 2 kb of center of differentially accessible regions are shown above heat maps.
Discussion
These data demonstrate that resistance to T cell–mediated cytotoxicity is regulated by many genes and pathways in tumor cells. The corresponding gene products represent targets for immunotherapy because inactivating mutations sensitize tumor cells to T cell–mediated attack. The interaction between T cells and tumor cells is dynamically regulated at many levels, including innate immune and metabolic pathways within tumor cells. The PBAF complex is of particular interest because it reduces chromatin accessibility for IFN-γ–inducible genes within tumor cells and thereby increases resistance to T cell–mediated cytotoxicity.
The PBAF complex is a tumor suppressor, and inactivating mutations in any of the three unique genes of this complex (PBRM1, ARID2, and BRD7) are known to occur in a variety of human cancers (28). For example, inactivating mutations in PBRM1 are prevalent in clear cell renal cancer (~41% of patients) (36). A study by Miao et al. in this issue demonstrates that PBRM1 mutations in metastatic renal cancers are associated with improved clinical responses to PD-1 or PD-L1 blockade (37). Mutations in ARID2 and BRD7 are also observed in a variety of other human cancers, including ARID2 mutations in melanoma (38). Human tumors with inactivating mutations in PBRM1, ARID2, and BRD7 may therefore be more sensitive to PD-1 blockade as well as other forms of immunotherapy in which cytotoxic T cells serve as the main effector mechanism, including cancer vaccines and adoptive T cell therapies. This study provides a mechanistic understanding for these clinical findings by demonstrating that PBAF-deficient tumor cells are more sensitive to T cell–mediated cytotoxicity. We also show that PBAF-deficient tumor cells produce higher amounts of chemokines (Cxcl9 and Cxcl10) in response to IFN-γ, resulting in more efficient recruitment of effector T cells into tumors (35).
The immunotherapy field has thus far emphasized the targeting of inhibitory receptors expressed by immune cells. We propose that targeting of tumor cell–intrinsic resistance mechanisms to T cell–mediated cytotoxicity will be important to extend the benefit of immunotherapy to larger patient populations, including those with cancers that thus far are refractory to immunotherapy.
Supplementary Material
Acknowledgments
We thank the staff of the Center for Cancer Genome Discovery and the Molecular Biology Core Facility at Dana-Farber Cancer Institute (DFCI) for DNA sequencing. D.P. is a Cancer Research Institute–Robertson Foundation Fellow; L.F.d.A. was funded by a Friends for Life Neuroblastoma Fellowship, and R.E.T. was supported by an A*STAR Graduate Fellowship. A.M.L. is a Research Fellow of the Training Program in Cancer Immunology at DFCI (NIH grant 1T32CA207021-01). This work was supported by a Transformative R01 grant from the National Cancer Institute, NIH (R01CA173750) (K.W.W.) and NIH (U24CA224316) (X.S.L.), and by a sponsored research agreement with Astellas Pharma. X.S.L. is a cofounder of and is on the scientific advisory board of GV20 Oncotherapy, a precision cancer medicine company. X.S.L. is also on the scientific advisory board of 3DMedCare and is a paid consultant for Genentech. J.D. is a paid consultant for Tango Therapeutics. K.W.W. and D.P. are inventors on patent application DFS-190.6 submitted by DFCI, which covers new targets for cancer immunotherapy. RNA-seq data have been deposited at the Gene Expression Omnibus under accession number GSE107670.
Footnotes
SUPPLEMENTARY MATERIALS
www.sciencemag.org/content/359/6377/770/suppl/DC1
Materials and Methods
References (39–50)
REFERENCES AND NOTES
- 1.Sharma P, Hu-Lieskovan S, Wargo JA, Ribas A. Cell. 2017;168:707–723. doi: 10.1016/j.cell.2017.01.017. [DOI] [PMC free article] [PubMed] [Google Scholar]
- 2.Zhang N, Bevan MJ. Immunity. 2011;35:161–168. doi: 10.1016/j.immuni.2011.07.010. [DOI] [PMC free article] [PubMed] [Google Scholar]
- 3.Iwai Y, et al. Proc Natl Acad Sci USA. 2002;99:12293–12297. doi: 10.1073/pnas.192461099. [DOI] [PMC free article] [PubMed] [Google Scholar]
- 4.van Elsas A, Hurwitz AA, Allison JP. J Exp Med. 1999;190:355–366. doi: 10.1084/jem.190.3.355. [DOI] [PMC free article] [PubMed] [Google Scholar]
- 5.Chen S, et al. Cancer Immunol Res. 2015;3:149–160. doi: 10.1158/2326-6066.CIR-14-0118. [DOI] [PubMed] [Google Scholar]
- 6.Doench JG, et al. Nat Biotechnol. 2016;34:184–191. doi: 10.1038/nbt.3437. [DOI] [PMC free article] [PubMed] [Google Scholar]
- 7.Overwijk WW, et al. J Exp Med. 2003;198:569–580. doi: 10.1084/jem.20030590. [DOI] [PMC free article] [PubMed] [Google Scholar]
- 8.Hogquist KA, et al. Cell. 1994;76:17–27. doi: 10.1016/0092-8674(94)90169-4. [DOI] [PubMed] [Google Scholar]
- 9.Blum JS, Wearsch PA, Cresswell P. Annu Rev Immunol. 2013;31:443–473. doi: 10.1146/annurev-immunol-032712-095910. [DOI] [PMC free article] [PubMed] [Google Scholar]
- 10.Kobayashi KS, van den Elsen PJ. Nat Rev Immunol. 2012;12:813–820. doi: 10.1038/nri3339. [DOI] [PubMed] [Google Scholar]
- 11.Parker BS, Rautela J, Hertzog PJ. Nat Rev Cancer. 2016;16:131–144. doi: 10.1038/nrc.2016.14. [DOI] [PubMed] [Google Scholar]
- 12.Gao J, et al. Cell. 2016;167:397–404.e9. [Google Scholar]
- 13.Zaretsky JM, et al. N Engl J Med. 2016;375:819–829. doi: 10.1056/NEJMoa1604958. [DOI] [PMC free article] [PubMed] [Google Scholar]
- 14.Manguso RT, et al. Nature. 2017;547:413–418. doi: 10.1038/nature23270. [DOI] [PMC free article] [PubMed] [Google Scholar]
- 15.Patel SJ, et al. Nature. 2017;548:537–542. doi: 10.1038/nature23477. [DOI] [PMC free article] [PubMed] [Google Scholar]
- 16.Dong H, Zhu G, Tamada K, Chen L. Nat Med. 1999;5:1365–1369. doi: 10.1038/70932. [DOI] [PubMed] [Google Scholar]
- 17.Freeman GJ, et al. J Exp Med. 2000;192:1027–1034. doi: 10.1084/jem.192.7.1027. [DOI] [PMC free article] [PubMed] [Google Scholar]
- 18.Kleppe M, et al. Blood. 2011;117:7090–7098. doi: 10.1182/blood-2010-10-314286. [DOI] [PubMed] [Google Scholar]
- 19.Kaiserman D, Bird PI. Cell Death Differ. 2010;17:586–595. doi: 10.1038/cdd.2009.169. [DOI] [PubMed] [Google Scholar]
- 20.Ratner N, Miller SJ. Nat Rev Cancer. 2015;15:290–301. doi: 10.1038/nrc3911. [DOI] [PMC free article] [PubMed] [Google Scholar]
- 21.Messina S, et al. Oncogene. 2011;30:3813–3820. doi: 10.1038/onc.2011.99. [DOI] [PubMed] [Google Scholar]
- 22.Phoenix TN, Temple S. Genes Dev. 2010;24:45–56. doi: 10.1101/gad.1839510. [DOI] [PMC free article] [PubMed] [Google Scholar]
- 23.Arafeh R, et al. Nat Genet. 2015;47:1408–1410. doi: 10.1038/ng.3427. [DOI] [PMC free article] [PubMed] [Google Scholar]
- 24.Li G, et al. Cancer Cell. 2014;25:455–468. doi: 10.1016/j.ccr.2014.02.007. [DOI] [PMC free article] [PubMed] [Google Scholar]
- 25.Frederick DT, et al. Clin Cancer Res. 2013;19:1225–1231. doi: 10.1158/1078-0432.CCR-12-1630. [DOI] [PMC free article] [PubMed] [Google Scholar]
- 26.Ebert PJR, et al. Immunity. 2016;44:609–621. doi: 10.1016/j.immuni.2016.01.024. [DOI] [PubMed] [Google Scholar]
- 27.Koya RC, et al. Cancer Res. 2012;72:3928–3937. doi: 10.1158/0008-5472.CAN-11-2837. [DOI] [PMC free article] [PubMed] [Google Scholar]
- 28.Kadoch C, Crabtree GR. Sci Adv. 2015;1:e1500447. doi: 10.1126/sciadv.1500447. [DOI] [PMC free article] [PubMed] [Google Scholar]
- 29.Lemon B, Inouye C, King DS, Tjian R. Nature. 2001;414:924–928. doi: 10.1038/414924a. [DOI] [PubMed] [Google Scholar]
- 30.Zhang Q, Lenardo MJ, Baltimore D. Cell. 2017;168:37–57. doi: 10.1016/j.cell.2016.12.012. [DOI] [PMC free article] [PubMed] [Google Scholar]
- 31.Sancak Y, et al. Cell. 2010;141:290–303. doi: 10.1016/j.cell.2010.02.024. [DOI] [PMC free article] [PubMed] [Google Scholar]
- 32.Li B, et al. Genome Biol. 2016;17:174. doi: 10.1186/s13059-016-1028-7. [DOI] [PMC free article] [PubMed] [Google Scholar]
- 33.Kadoch C, et al. Nat Genet. 2017;49:213–222. doi: 10.1038/ng.3734. [DOI] [PMC free article] [PubMed] [Google Scholar]
- 34.Yan Z, et al. Genes Dev. 2005;19:1662–1667. doi: 10.1101/gad.1323805. [DOI] [PMC free article] [PubMed] [Google Scholar]
- 35.Groom JR, Luster AD. Immunol Cell Biol. 2011;89:207–215. doi: 10.1038/icb.2010.158. [DOI] [PMC free article] [PubMed] [Google Scholar]
- 36.Varela I, et al. Nature. 2011;469:539–542. doi: 10.1038/nature09639. [DOI] [PMC free article] [PubMed] [Google Scholar]
- 37.Miao D, et al. Science. 2018;359:801–806. doi: 10.1126/science.aan5951. [DOI] [PMC free article] [PubMed] [Google Scholar]
- 38.Hodis E, et al. Cell. 2012;150:251–263. doi: 10.1016/j.cell.2012.06.024. [DOI] [PMC free article] [PubMed] [Google Scholar]
Associated Data
This section collects any data citations, data availability statements, or supplementary materials included in this article.


