Abstract
Higher eukaryotic genomes are bound by a large number of coding and non-coding RNAs, but approaches to comprehensively map the identity and binding sites of these RNAs are lacking. Here we report a method to in situ capture global RNA interactions with DNA by deep sequencing (GRID-seq), which enables the comprehensive identification of the entire repertoire of chromatin-interacting RNAs and their respective binding sites. In human, mouse and Drosophila cells, we detected a large set of tissue-specific coding and non-coding RNAs that are bound to active promoters and enhancers, especially super-enhancers. Assuming that most mRNA-chromatin interactions indicate the physical proximity of a promoter and an enhancer, we constructed a three-dimensional global connectivity map of promoters and enhancers, revealing transcription activity-linked genomic interactions in the nucleus.
Introduction
Recent genomic research has revealed that mammalian genomes are more prevalently transcribed than previously thought1. Mammalian genomes express not only protein-coding mRNAs but also a large repertoire of non-coding RNAs (ncRNAs) that have regulatory functions in different layers of gene expression. Many ncRNAs appear to act directly on chromatin, as exemplified by various characterized long non-coding RNAs (lncRNAs)2,3. Some ncRNAs may mediate genomic interactions predominantly in cis, whereas others, such as MALAT1 and NEAT1, are capable of extensively acting in trans4. These findings suggest a role of specific RNA-chromatin interactions in regulating gene expression.
Various techniques have been developed to localize specific RNAs on chromatin. These include Chromatin Isolation by RNA Purification (ChIRP)5, Capture Hybridization Analysis of RNA Targets (CHART)6, and RNA Affinity Purification (RAP-DNA)7, which all rely on using complementary sequences to capture a specific RNA followed by deep sequencing to identify chromatin targets. However, these methods only allow analysis of one known RNA at a time, and consequently, a global view is lacking on all potential RNA-chromatin interactions, which is critical for addressing a wide range of functional genomics questions.
RNAs might also play a role in coordinating functional DNA elements in regulated gene expression. The chromatin structure has been analyzed with Hi-C, which detects all possible DNA-DNA interactions8,9, and ChIA-PET, which enriches specific factor-mediated interactions10–12. However, as these techniques detect both regulatory and static physical interactions that are largely confined within cell type-independent topologically associating domains (TADs)13,14, chromatin-associated RNAs may help define chromatin interactions that are directly linked to transcriptional activities and differentiate super-enhancers from typical enhancers15–17..
To address these questions, we sought to develop a general approach for comprehensively localizing all potential chromatin-interacting RNAs in an unbiased fashion. Here we report a strategy for mapping Global RNA Interactions with DNA by deep sequencing (GRID-seq) that uses a bivalent linker to ligate RNA to DNA in in situ on fixed nuclei. Application of GRID-seq to two human cell lines (MDA-MB-231 and MM.1S), one mouse cell line (mESC), and one Drosophila cell line (S2), exposed distinct classes of cis- and trans-chromosomal interacting RNAs that were linked to cell type-specific gene expression programs. We discovered a large set of both coding mRNAs and ncRNAs that bind to active promoters and enhancers, especially super-enhancers. Assuming that most interactions represent a physical proximity between the site of transcription and the distal binding site, this comprehensive RNA-chromatin interactome permitted the identification of transcription activity-associated promoter-enhancer interactions both within and beyond TADs.
Results
Ligating RNA to proximal DNA in situ
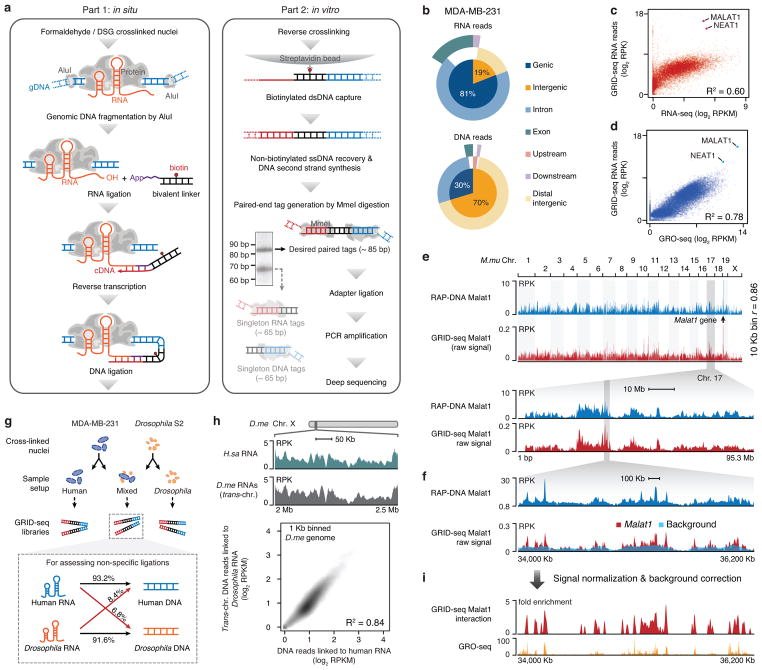
We first chose a triple negative breast cancer MDA-MB-231 cell line to develop an unbiased strategy to map RNA-chromatin interactions genome-wide. To this end, we stabilized RNAs on chromatin by double fixing cells with disuccinimidyl glutarate (DSG) and formaldehyde, isolated nuclei, and performed in situ DNA digestion with a frequent 4-base cutter AluI. We designed a biotin-labeled bivalent linker consisting of a single-stranded RNA (ssRNA) portion for ligation to RNA and a double-stranded DNA (dsDNA) portion for ligation to DNA (Extended Data Fig. 1a). The linker was pre-adenylated at the 5′ end of the RNA and characterized in vitro and in the cell (Extended Data Fig. 1b,c). As diagrammed in Fig. 1a, we first performed in situ RNA ligation and then extended the DNA primer in the linker into ligated RNA with reverse transcriptase. After removing free linker, we performed in situ DNA ligation to AluI-digested genomic DNA followed by affinity purification on streptavidin beads. Next, we released ssDNA from the beads, generated dsDNA, and used a type II restriction enzyme MmeI to cleave DNA ~20 nt upstream and downstream from the two built-in recognition sites in the linker.
Fig. 1. The GRID-seq technology.
a, Schematic presentation of the GRID-seq technology. Left: steps performed in situ on fixed nuclei; Right: steps performed in solution. The two major bands resolved by native polyacrylamide gel correspond to the products of the linker ligated to both DNA and RNA (upper band) or to either DNA or RNA (lower band). The upper band was excised for adapter ligation and deep sequencing. b, Genomic distributions of uniquely mapped RNA/DNA read mates in MDA-MB-231 cells. c,d, Scatterplots of length-normalized RNA reads from annotated genes detected by GRID-seq in comparison with gene expression detected by RNA-seq (c) or GRO-seq (d) in MDA-MB-231 cells. Highlighted are two representative lncRNAs MATAL1 and NEAT1. e, Comparison of raw MALAT1-chromatin interaction signals captured by RAP-DNA and GRID-seq. RPK: GRID-seq reads per Kb. RPKM: reads per Kb per million mapped reads. f, MALAT1 GRID-seq signals in a highlighted region of Chr. 17 relative to the background (light blue). g, Top: Scheme for using human MDA-MB-231 cells, Drosophila S2 cells, or their mix for library construction. Bottom: The percentages of human RNAs ligated to human or Drosophila DNA and the percentages of Drosophila RNAs ligated to Drosophila or human DNA. h, Comparison between the true background based on cross-species RNA-DNA interactions and the deduced background by trans-chromosomal mRNAs, as illustrated on a region of Chr. X in Drosophila S2 cells (top panel) or globally (bottom panel). i, MALAT1 GRID-seq signals after background correction in comparison with GRO-seq signals in MDA-MB-231.
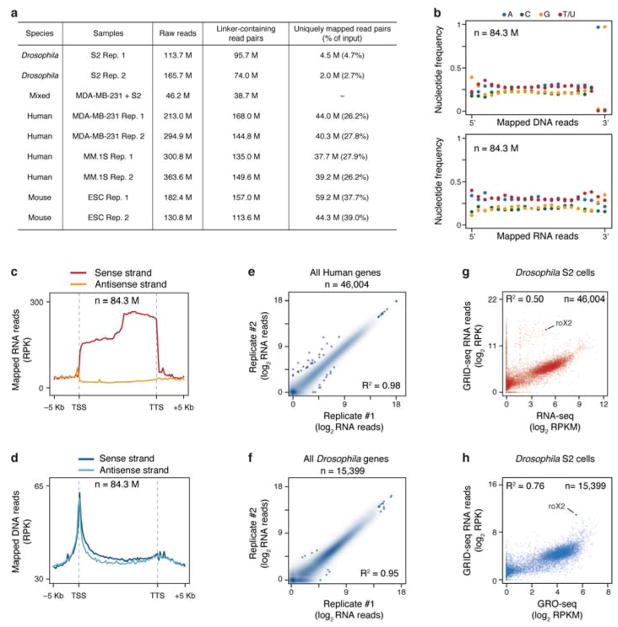
We resolved two defined DNA fragments in native gel, one (85 bp) corresponding to linker ligation to both RNA and DNA, and the other (65 bp) to linker ligation to either RNA or DNA (Fig. 1a, Extended data Fig. 1c). We isolated the 85 bp band for adapter ligation and PCR amplification followed by deep sequencing, typically generating ~200 million 100 nt raw reads (~40 million uniquely mapped RNA/DNA read mates) per library (Extended Data Fig. 2a). Specific linker ligation to RNA and DNA was validated based on sequenced libraries by the lack of nucleotide preference at the RNA end, but with the expected nucleotide preference (AluI site) at the DNA end (Extended Data Fig. 2b). The RNA reads showed the same strand orientation as original transcripts, but the DNA reads lacked any strand specificity (Extended Data Fig. 2c,d). Independent libraries showed a high concordance (R2 >0.95) (Extended Data Fig. 2e,f).
The RNA reads were primarily from genic regions (both intronic and exonic), indicating their origins from various partially spliced RNAs, whereas the DNA reads were predominantly from promoters and intergenic regions (Fig. 1b). In MDA-MB-231 cells, the chromatin-interacting RNAs were better correlated with nascent RNAs detected by global nuclear run-on (GRO-seq) than RNAs at the steady state measured by polyA+ RNA-seq (Fig. 1c,d). Positive correlations were also evident when compared to both rRNA-depleted RNAs and nascent RNAs in Drosophila S2 cells (Extended Data Fig. 2g,h). These data suggest that GRID-seq preferentially detects nascent RNA on chromatin in both human and Drosophila genomes. We also detected various matured lncRNAs and small ncRNAs, likely due to RNA fragmentation that occurred either in intact cells as reported earlier18 or during the experimental procedure.
Validating GRID-seq and deducing background
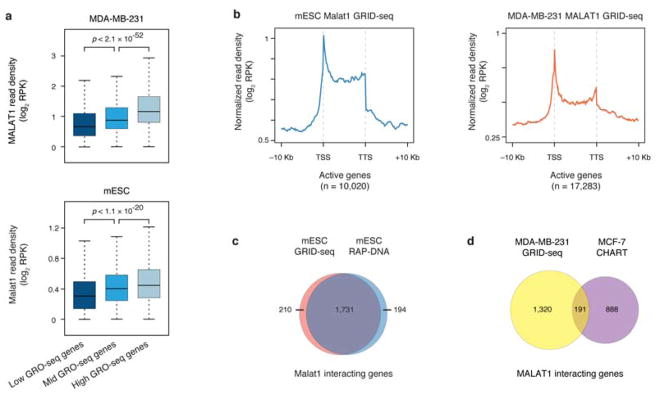
Two well-characterized mammalian lncRNAs MALAT1 and NEAT1 were amongst the most significantly enriched RNAs on chromatin identified by GRID-seq in MDA-MB-231 cells (Fig. 1c,d). To enable direct comparison with the existing data as the first pass of validation for GRID-seq, we also performed GRID-seq on an mESC line where the high-quality Malat1 RNA capture data based on RAP-DNA are available19 (Neat1 is not expressed in ES cells20). We found that the data of the two assays were highly comparable across the whole genome (Fig. 1e), which we further highlighted in a mouse Chr. 17 region (Fig. 1f). As previously reported4,19, MALAT1 interacted with active genes proportional to gene expression levels in both human and mouse cells (Extended Data Fig. 3a). However, MALAT1 appears to prefer for transcription start sites (TSS) (Extended Data Fig. 3b), which is distinct from the pattern observed with RAP-DNA on mESCs or CHART on MCF-7 cells where both showed MALAT1 preference for gene body4,19. Because RAP-DNA and GRID-seq detected Malat1 interactions with the same set of genes in mESCs (Extended Data Fig. 3c), the different patterns are likely due to local RNA-DNA contacts detected by GRID-seq versus total Malat1-associated DNA pulled down by the capture methods. As expected from the previous studies, MALAT1 decorated genes were distinct between MDA-MB-231 and MCF-7 cells (Extended Data Fig. 3d).
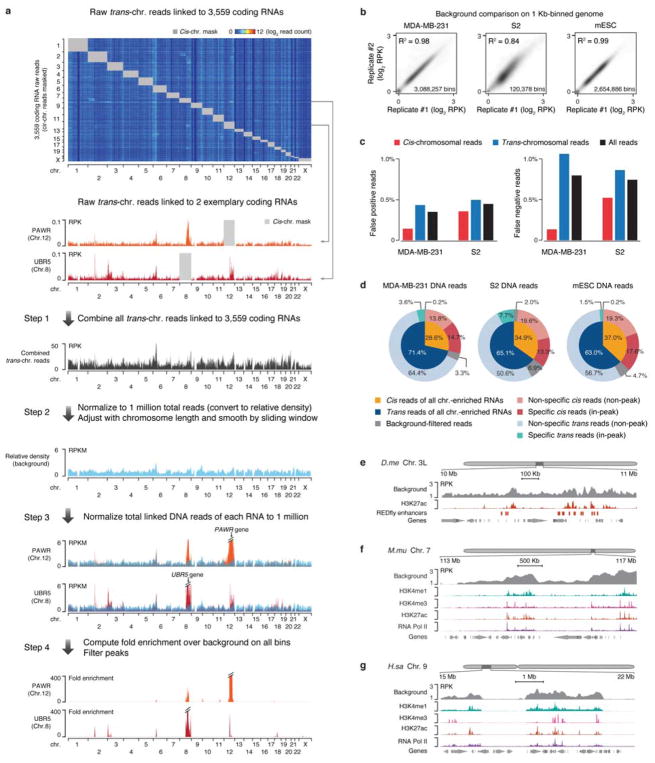
Besides lncRNAs, we noted that most RNA reads were from protein-coding genes, which might reflect both specific and non-specific RNA-chromatin interactions, thus requiring a background model to identify specific interactions. To assess the background, we mixed isolated nuclei from MDA-MB-231 and S2 cells in equal genome content (Fig. 1g). By using uniquely and unambiguously mapped RNA/DNA read mates to human or Drosophila genome (see Methods), we detected 6.8% human RNA linked to Drosophila DNA and 8.4% Drosophila RNA linked to human DNA (Fig. 1g). Utilizing these cross-species reads, we took advantage of the small Drosophila genome (thus having sufficient read density from human RNAs) to construct a true background for non-specific RNA-chromatin interactions (Fig. 1h, top panel). We next used mRNA-chromatin interactions in the same cells to develop an endogenous background model, inspired by the strategy developed for processing Hi-C data21. As illustrated in a step-wise fashion on MDA-MB-231 cells (Extended Data Fig. 4a), we deduced the background based on endogenous mRNAs engaged in trans-chromosomal interactions, and after normalization to equal density in comparison with specific RNA, true trans-chromosomal interactions were still preserved. This endogenous background was highly concordant with the exogenous background (Fig. 1h, Extended Data Fig. 4b), and further quantitative analysis showed <1% discrepancy in identifying specific RNA-chromatin interactions by using either background model in both MDA-MB-231 and S2 cells (Extended Data Fig. 4c).
Differentiating specific and non-specific RNA-chromatin interactions
Using the background models we developed, we estimated the false positive rate of trans-chromosomal RNA-chromatin interactions at 3.3% in MDA-MB-231 cells, 6.9% in S2 cells, and 4.7% in mESCs (Extended Data Fig. 4d). After peak calling (see Methods), we found that 70.5% chromatin-enriched RNAs showed at least one significant trans peak in MDA-MB-231 cells, 77.1% in S2 cells, and 87.8% in mESCs. Notably, in MDA-MB-231 cells, only 3.6% of 71.4% total trans reads were in peaks compared to 14.7% of 28.6% total cis reads in peaks, and similar results were also obtained on S2 cells and mESCs (Extended Data Fig. 4d). These data suggest that the majority of trans reads resulted from released RNAs from their sites of transcription that non-specifically interacted with different chromosomes whereas about half of cis reads were engaged in specific interactions with chromatin.
We also noted that non-specific trans interactions tended to occur on open chromatin regions when compared to RNA Pol II binding as well as H3K4me1 and H3K27ac marks (Extended Data Fig. 4e,f,g). This further stressed the importance for developing a reliable background model in order to identify specific RNA-chromatin interactions. After background correction and peak filtering, all true trans-chromosomal interactions were highlighted, as demonstrated with Malat1 whose signals closely tracked nascent RNA production detected by GRO-seq in mESCs (Fig. 1i).
Global view of RNA-chromatin interactions
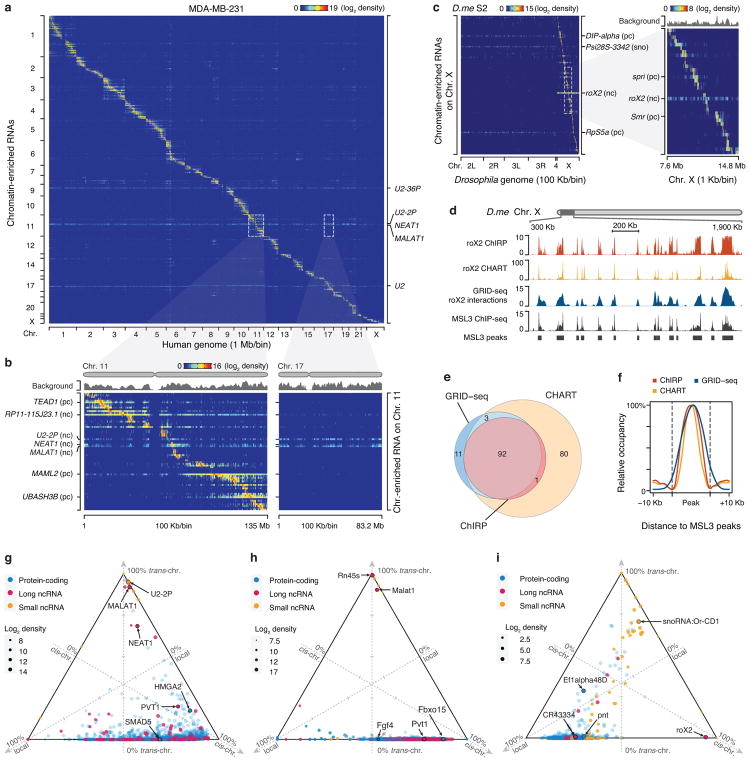
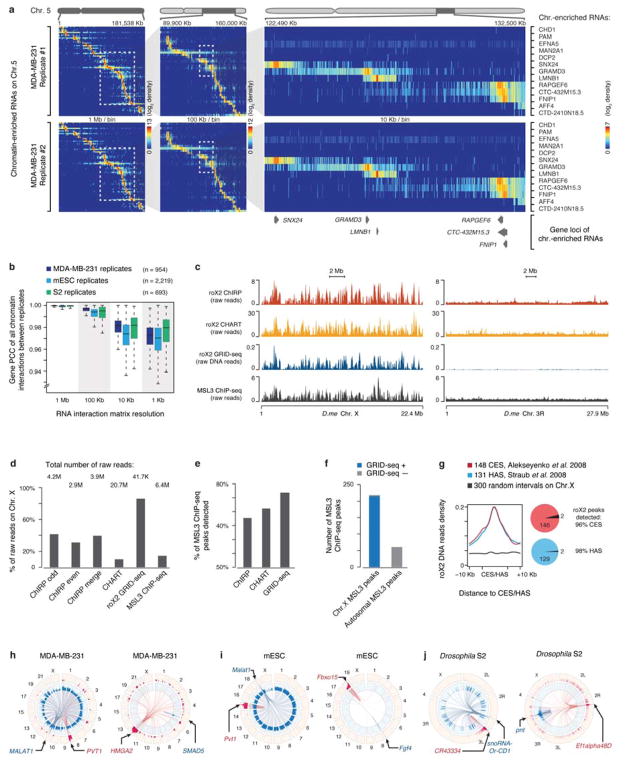
After removing non-specific signals, we detected 868 (88.75%) mRNAs and 72 (7.36%) ncRNAs highly enriched on chromatin in MDA-MB-231 cells at the current sequencing depth. We obtained comparable data on mESCs (Supplementary Table 1). Displaying all specific chromatin-enriched RNAs on chromosomes, we observed that only a limited number of RNAs were extensively engaged in trans interactions across the genome (Fig. 2a). In MDA-MB-231 cells, for example, MALAT1 and NEAT1, as well as U2 snRNA and two pseudo U2 snRNAs interacted with numerous loci on all chromosomes (Fig. 2b). By contrast, the majority of RNAs, whether protein-coding (pc) or non-coding (nc), interacted with chromatin near their sites of transcription. These extensive RNA-chromatin interactions were highly reproducible based on duplicated GRID-seq experiments, even with increasing resolution in all cell types we examined (Extended Data Fig. 5a,b).
Fig. 2. Global view of RNA-chromatin interactions.
a, Heatmap showing chromatin-enriched RNAs across the whole human genome in MDA-MB-231 cells. Row: chromatin-enriched RNAs. Column: human genome in 1 Mb resolution. Major trans-chromosomal interacting RNAs are labeled on the right. U2-36P and U2-2P are transcripts from two pseudo U2 snRNA genes. b, Two enlarged representative regions boxed in a, showing detailed RNA-chromatin interaction patterns on Chr. 11 (left) and Chr. 17 (right) at 100 Kb resolution. pc: protein-coding RNAs, nc: non-coding RNAs. c, Heatmap showing background-corrected RNA-chromatin interactions on Chr. X across the Drosophila genome. Right: an enlarged view of the boxed region on the left, showing decoration of roX2 RNA on Chr. X in Drosophila S2 cells. d, A region of Drosophila Chr. X, illustrating roX2 RNA on chromatin detected by ChIRP and CHART in comparison with GRID-seq signals as well as ChIP-seq signals for the roX2 binding protein MSL3. e, Overlaps of peaks identified by different methods. f, Meta-analysis of roX2-chromatin interactions detected by ChIRP, CHART and GRID-seq relative to MSL3 ChIP-seq peaks. g,h,i Ternary plots of chromatin-enriched RNAs in called peaks in human MDA-MB-231 cells (g), mESCs (h), and Drosophila S2 cells (i), showing percentages of individual chromatin-interacting RNAs engaged in local (±1 Kb around their genes), cis (in the same chromosome except local), and trans (in other chromosomes) interactions. The 3 axes were shown as dashed lines perpendicular to the edges of the triangle. The arrowhead on the tip of each axis indicates the direction of increase from 0 (at the edge) to 100% (at the vertex). 3 ticks on each axis mark 25%, 50% and 75% positions. Colors of dots represent different types of RNAs and sizes represent chromatin interaction levels. Labeled are representative coding mRNAs and lncRNAs in each genome.
In S2 cells, we also detected a large number of chromatin-enriched RNAs (Supplementary Table 1). For example, an enlarged chromosomal view showed that roX2, a known lncRNA involved in dosage compensation in Drosophila22, was exclusively decorated on Chr. X (Fig. 2c). Comparing this profile with the published roX2 ChIRP and CHART data5,6 as well as the ChIP-seq data on MSL3, a known roX2-interacting factor23, we observed high concordance among all datasets, as indicated by examples on an expanded view of Chr. X (Fig. 2d) and by the overlaps in both peak number (Fig. 2e) and position (Fig. 2f). Even at the raw data levels, the concordance was strong among the data generated by different methods (Extended Data Fig. 5c). In fact, GRID-seq showed the highest specificity for Chr. X and was more concordant with MSL3 ChIP-seq signals on Chr. X than other RNA capture results (Extended Data Fig. 5d,e,f). Moreover, roX2 GRID-seq peaks recovered >96% of previously defined chromosomal entry sites (CES)23 or high affinity sites (HAS)24 for the roX-MSL complex (Extended Data Fig. 5g). Together, these data suggest that our unbiased GRID-seq approach is able to recapitulate known specific RNA-chromatin interactions with high specificity and sensitivity. However, given the all-to-all nature of GRID-seq, each chromatin-enriched RNA is expected to have much less reads compared to the capture technologies that focus on a single target at comparable sequencing depths. For example, at the current sequencing depth, the GRID-seq data on roX2 gave to rise of a medium peak width of 83 Kb from a total of 42K reads, whereas ChIRP roX2 exhibited a medium peak width of 4.5 Kb from a total of 40M reads, indicating a relatively lower resolution of GRID-seq compared to ChIRP on this particular RNA.
To further characterize newly identified chromatin-enriched RNAs, we classified their chromatin-interactions in local (±10 Kb from their encoding genes), cis (beyond local regions, but in the same chromosomes), and trans (across different chromosomes) modes. Notably, with a few exceptions of specific lncRNAs and small ncRNAs, the majority of RNAs exhibited predominant local and cis-interactions in all cell types (Fig. 2g,h,i). Compared to human MDA-MB-231 cells, we noted a much lower degree of trans-interactions in mESCs (Fig. 2g,h), and relative to mammalian cells, we saw more restricted local interactions in Drosophila S2 cells (Fig. 2i). At individual RNA levels, each showed specific preference for different modes of interactions, as illustrated by Circos plots25 of representative coding mRNAs and lncRNAs in each cell type. Some RNAs exhibiting rather local and cis-interactions, whereas others engaged in more extensive trans-interactions (Extended Data Fig. 5h,i,j). These data provide rich resources for future investigation of individual chromatin-interacting RNAs.
Cell type-specific interactions
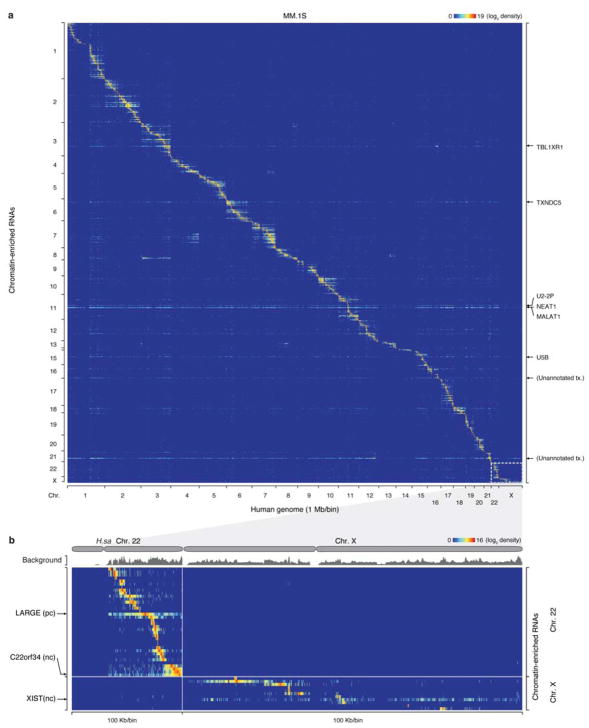
We next determined whether specific RNA-chromatin interactions reflected cell type-specific activities and analyzed another well-characterized human multiple myeloma cell line MM.1S, which enabled us to take advantage of previously generated functional data on this cell type26. Similar to MDA-MB-231 cells, we detected MALAT1 and NEAT1 (Extended Data Fig. 6a) and numerous other mRNAs and ncRNAs on chromatin (Supplementary Table 1). We also detected exclusive decoration of the lncRNA XIST on Chr. X in this human cell type (Extended Data Fig. 6b).
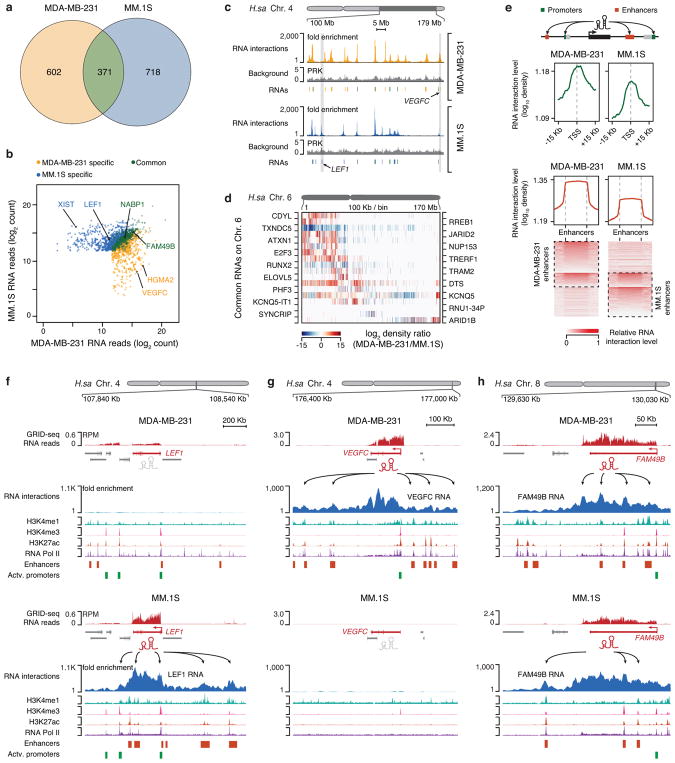
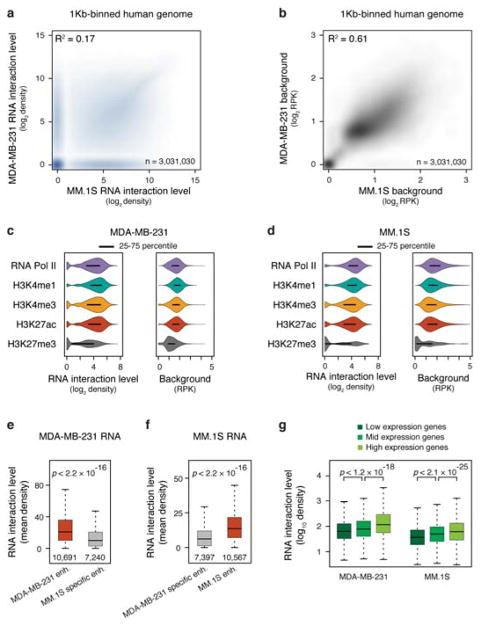
Cross analysis between MDA-MB-231 and MM.1S cells revealed that the repertoire of chromatin-enriched RNAs were largely cell type-specific (Fig. 3a,b), as illustrated on a representative region of Chr. 4 (Fig. 3c) an on the whole genome (Extended Data Fig. 7a), whereas background RNA-chromatin interactions were relatively similar (Extended Data Fig. 7b). Even a common set of RNAs showed distinct chromatin-interaction patterns in the two cell types, as exemplified on Chr. 6 (Fig. 3d), indicating that chromatin-RNA interactions likely reflected cell type-specific gene regulation programs. Consistently, we also observed a genome-wide trend of chromatin-enriched RNAs that specifically bound DNA elements marked with H3K4me1, H3K4me3 and H3K27ac, as well as RNAPII (Extended Data Fig. 7c,d).
Fig. 3. Cell type-specific RNA-chromatin interactions in human cells.
a, Overlap of chromatin-enriched RNAs between MDA-MB-231 and MM.1S cells, illustrating the cell type specificity. b, Comparison of individual chromatin-enriched RNA levels in the two human cell types. Colored dots represent enriched RNAs on chromatin, a few of which are highlighted. c, Illustration of both common and cell type-specific RNA-chromatin interactions in MDA-MB-231 and MM.1S cells. Two representative cell type-specific regions are shaded (see further details in panel f and g). d, Heatmap illustrating differential RNA-chromatin interactions on Chr. 6 from common chromatin-enriched RNAs in the two human cell types. Red and blue respectively indicate lower and higher levels of chromatin interactions in MDA-MB-231 cells relative to MM.1S cells. e, Meta-analysis of RNA interactions at gene promoters (top panel) or enhancers (middle panel) in MDA-MB-231 and MM.1S cells. Bottom panel: heatmaps of enhancers ranked by normalized RNA signals in the two cell types, showing both cell type-specific and common RNA-chromatin interactions at enhancers. f,g,h, Examples showing broad chromatin interactions by LEF1 (MM.1S cell-specific), VEGFC (MDA-MB-231 cell-specific) and FAM49B (common) in comparison with key chromatin marks (in autoscale). RPM: RNA reads per million.
In addition to various unannotated DNA elements, RNA interactions were enriched on active promoters and enhancers in a cell type-specific manner (Fig. 3e, Extended Data Fig. 7e,f), positively correlated with gene expression levels (Extended Data Fig. 7g). For example, we observed cell type-specific chromatin-enriched RNAs that were able to interact with enhancers several hundred Kb away from their promoters (Fig. 3f,g). Representative of many commonly captured RNAs, FAM49B RNA showed similar chromatin interaction density in both MDA-MB-231 and MM.1S, but reached out to distinct enhancers (arrows in Fig. 3h). Although we do not have sufficient read density to detect enhancer-produced RNAs (eRNAs), which are believed to link enhancers to promoters27,28, these data indicate that RNAs from actively transcribing genes are also associated with their enhancers, perhaps reflecting spatial proximity between specific promoters and enhancers in the nucleus.
Prevalent RNAs on super-enhancers
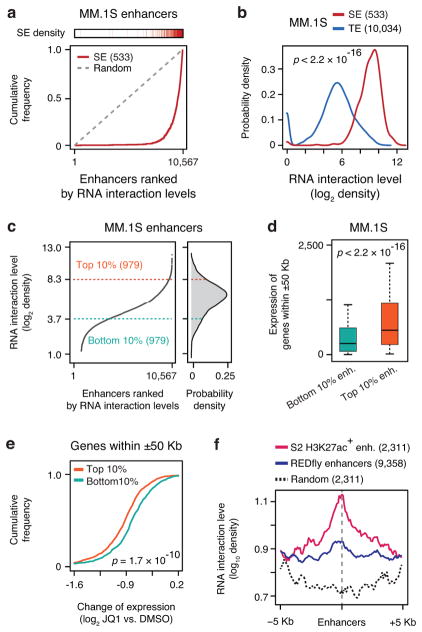
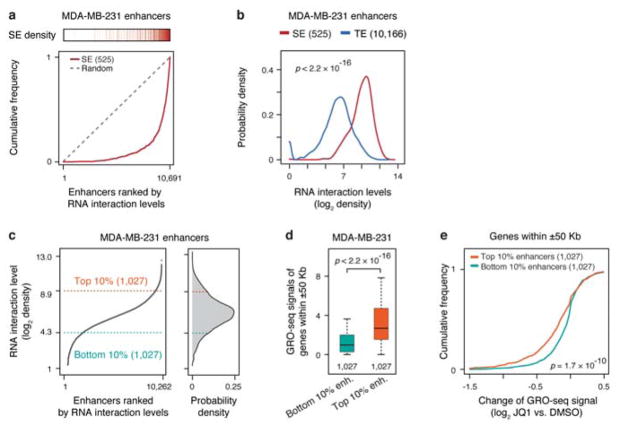
Recent studies suggest that enhancers may be segregated into typical and super-enhancers, the latter being defined by a much higher density of enhancer marks, such as Mediator and BRD4 ChIP-seq signals that generally track H3K27ac signals, and super-enhancers also appear to be more potent than typical enhancers in activating nearby genes16,26. Because of the RNA decoration on active enhancers, we sought to determine whether GRID-seq signals might also reflect relative strengths of typical versus super-enhancers. We found that enhancers highly associated with RNAs predominantly corresponded to super-enhancers in both MDA-MB-231 and MM.1S cells (Fig. 4a, Extended Data Fig. 8a), which was also evident from quantitative analysis (Fig. 4b, Extended Data Fig. 8b). Therefore, the levels of chromatin-interacting RNAs may provide an independent criterion to differentiate typical from super-enhancers.
Fig. 4. Preferential RNA decoration on super-enhancers in MM.1S cell.
a, Super-enhancers in relationship to RNA-chromatin interaction levels. 10,567 active enhancers marked by H3K27ac in MM.1S cells were ranked by RNA interaction levels. Each red bar on top represents a super-enhancer. Red curve: The accumulative curve of rank-ordered RNA-chromatin interactions; Grey dashed line: Random distribution. b, Density distribution of chromatin-enriched RNAs at super-enhancers (SE, red) and typical enhancers (TE, blue). c, Left: Rank-ordered RNA-chromatin interaction levels on all active enhancers. Right: The top 10% and bottom 10% enhancers with the most and least RNA interactions, respectively, selected for functional analysis. d, Gene expression associated with top 10% enhancers (orange box) and bottom 10% enhancers (green box). e, Accumulative curves of expression changes of genes associated with top 10% and bottom 10% enhancers in response to JQ1 treatment in MM.1S cell. Statistical significance of comparison was determined by Student’s t-test in panel b, d and e with degrees of freedom of 631.5, 1955.8 and 1926.4, respectively. f, Meta-analysis of chromatin-enriched RNAs on H3K27ac-positive enhancers detected in Drosophila S2 cells (red) versus all enhancers scored positively in Drosophila embryos from the REDfly database (blue) or random genomic fragments (black).
We next sorted enhancers based on their levels of bound RNA and compared the expression of neighboring genes from flanking enhancers using the same RNA expression data and analysis strategy as previously reported on MM.1S cells26. We found that genes adjacent (± 50 Kb) to top 10% RNA-decorated enhancers were more active than those adjacent to bottom 10% (Fig. 4c,d). Consistently, the genes associated with top 10% RNA-decorated enhancers were more responsive to functional perturbation with the BRD4 inhibitor JQ1 than those associated with bottom 10% (Fig. 4e). We performed a similar analysis on MDA-MB-231 cells by using GRO-seq to score nascent RNA production and transcriptional response to JQ1 treatment and reached the same conclusion (Extended Data Fig. 8c,d,e). Combined, these data demonstrated that the levels of chromatin-enriched RNAs reflected enhancer activities in activating gene expression.
To further establish specific RNA-chromatin interactions on enhancers, we took advantage of the REDfly database, which listed a large number of genomic fragments tested for enhancer activities using a reporter-based assay in Drosophila embryos29. To enable comparison with our GRID-seq data, we first identified active enhancers based on the published H3K27ac ChIP-chip data on S2 cells30. By examining S2 cell-specific RNA interaction levels on different classes of distal regulatory elements, we found that active enhancers marked by H3K27ac were indeed preferentially linked to chromatin-enriched RNAs, compared to a similar number of randomly selected genomic regions (Fig. 4f). These data provided further support to the significance of chromatin-enriched RNAs on active enhancers.
RNA-chromatin interactions relative to TADs
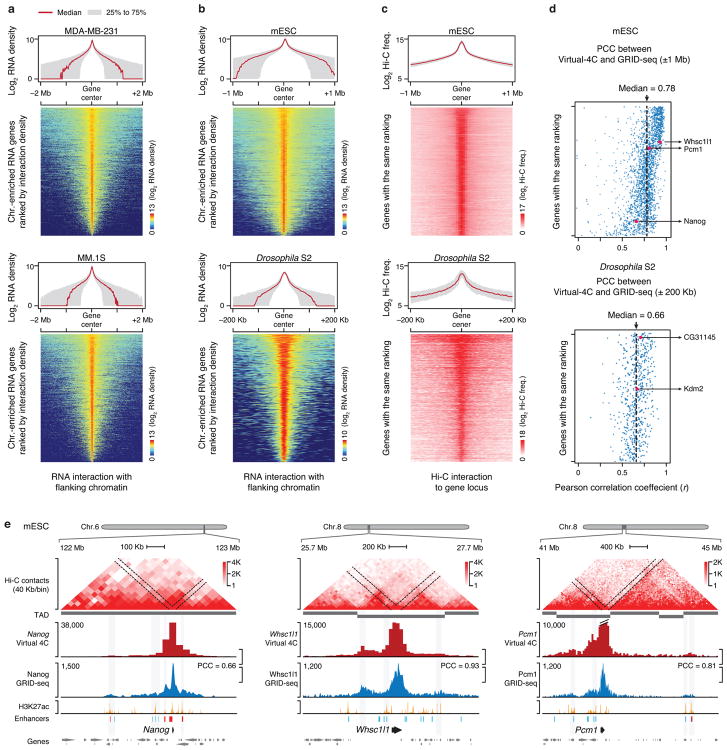
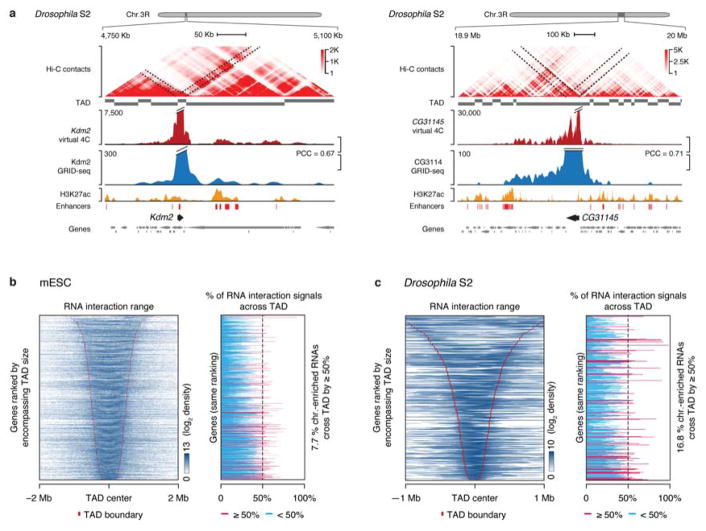
A fundamental genomics question regards how various DNA elements interact with one another in the 3D space of the nucleus. Hi-C experiments revealed predominant DNA-DNA interactions within TADs with a median interval of ~800 Kb13, but RNAPII ChIA-PET studies showed RNAPII-tethered genomic interactions both within and beyond TADs10,11. However, it has been challenging to use either Hi-C or RNAPII ChIA-PET data to differentiate actively transcribing genes from inactive or transcriptionally poised genes31. As GRID-seq has the ability to detect chromatin sites associated with RNA production, we observed in both human cell types that RNAs often covered chromatin up to ~1 Mb away from their transcription sites (Fig. 5a). mESCs showed the same trend as human cells (Fig. 5b, upper panel). By contrast, the cis-interaction range of RNAs was on average ~10-fold smaller in Drosophila S2 cells (Fig. 5b, lower panel). Such prevalent local interactions are likely due to closely spaced genes in the fly genome compared to mammalian genomes. These data indicate that the genomic organization dictates the range of specific RNA-chromatin interactions.
Fig. 5. Comparison of genomic interactions detected by GRID-seq and Hi-C.
a, The RNA-chromatin interaction range in two human cells. Top in each panel: Meta-analysis of RNA-chromatin interactions. Red line: the medium range; Grey area: the distribution range of 25%-75% RNAs. Bottom in each panel: Heatmap of chromatin interaction density of individual RNAs, sorted based on the total RNA density. b, Similar analysis as in a on mESCs and Drosophila S2 cells. c, Extracted Hi-C interactions from gene bodies (virtual 4C) in mESC (top) and S2 cells (bottom), which were sorted according to the same rank order as in b. d, Pearson’s Correlation Coefficient of individual GRID-seq detected RNA-chromatin interactions relative to Hi-C contacts in mESCs (top) and Drosophila S2 cells (bottom). e, Comparison between GRID-seq and Hi-C on three representative genomic regions of the mouse genome in mESCs.
We next investigated how RNA-chromatin interactions were related to the 3D chromatin structure. Taking advantage of the high quality Hi-C data on mESCs32 and S2 cells33, we compared between RNA-DNA interactions scored by GRID-seq and DNA-DNA contacts established by Hi-C. Because Hi-C detects all types of DNA-DNA interactions whereas GRID-seq can only capture the interactions of RNA-producing genes with DNA elements, we extracted Hi-C contacts from individual gene-bodies for direct comparison with RNA-chromatin interactions detected by GRID-seq (Fig. 5c, left panels). Pearson’s Correlation Coefficient (PCC) between GRID-seq and Hi-C signals for each gene quantitatively demonstrated the high global concordance between the two datasets within ±1 Mb in mESCs or ±200 Kb in S2 cells (Fig. 5c, right panels). This was further illustrated on representative examples on mESCs (Fig. 5e) and S2 cells (Extended Data Fig. 9a).
We further marked GRID-seq detected RNA-chromatin interactions relative to previously assigned TAD boundaries, observing that GRID-seq signals were predominantly confined within TADs in both mouse and fly cells (Extended Data Fig. 9b,c, left panels). However, a small fraction of RNAs were clearly capable of interacting with chromatin across TAD boundaries (red line), spreading >50% of their chromatin interaction signals into neighboring TADs on both mESCs and S2 cells (Extended Data Fig. 9b,c, right panels). These data suggest that chromatin-interacting RNAs were largely embedded in the high-order organization of nuclear territories. Such similarity demonstrates that GRID-seq signals could be applied to infer genomic interactions that are linked to RNA production, providing yet another transcription-focused approach to complement the existing 3D genomic technologies.
Global connectivity of promoters and enhancers
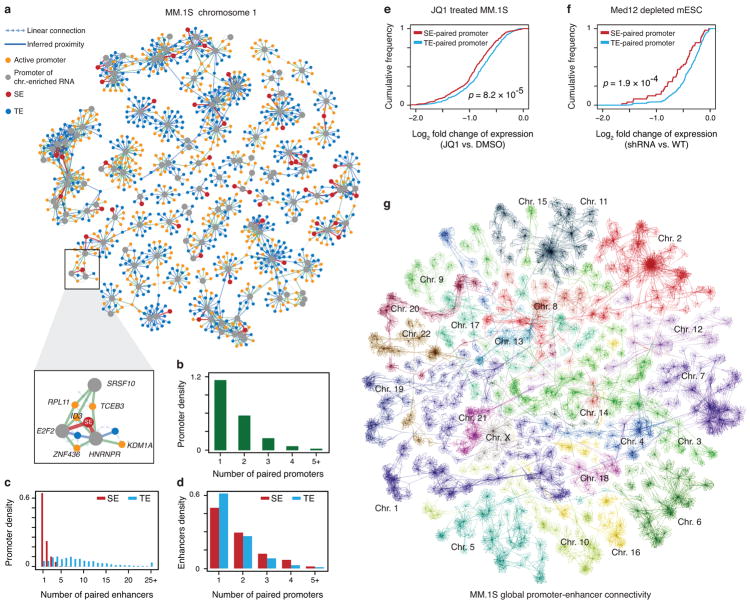
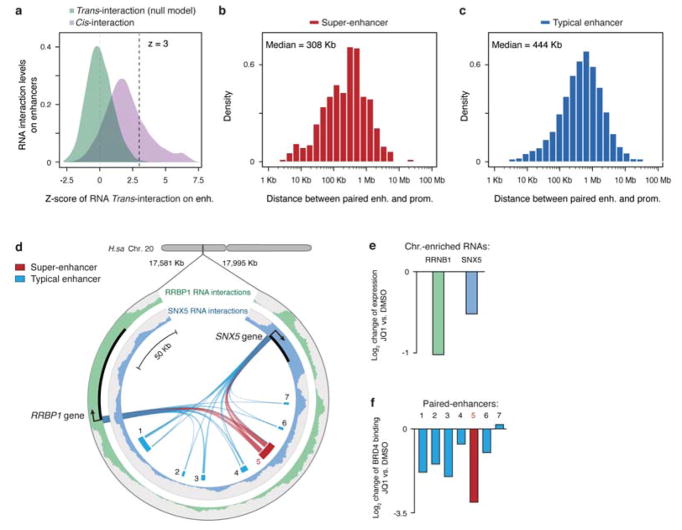
To further use GRID-seq to infer transcription-linked genomic interactions, we turned to a long-standing problem of how enhancers and active gene promoters contact one another in 3D genome. Although GRID-seq per se does not distinguish between cis-interactions by RNAs with DNA elements in the proximity of their sites of transcription and trans-interactions due to traveling RNAs after they are released from chromatin, we took advantage of their distinct features to construct a statistical model to differentiate cis- versus trans-interactions. We reasoned that the collective trans-chromosomal signals from mRNAs were statistically unlikely to reflect proximal interactions, which we defined as the null distribution. Thus, any cis-chromosomal signal that rejects the null distribution at a stringent significance level would most likely indicate chromatin proximity between active genes and their underlying DNA elements (Extended Data Fig. 10a). Based on this model and the requirement for a significance level of Z≥3, we identified 10,933 significant promoter-enhancer and 8,142 promoter-promoter interactions in MM.1S cells (Supplementary Table 2). We visualized the resultant promoter-promoter and promoter-enhancer networks with Cytoscape by using a self-organized layout34, as illustrated on Chr. 1 from MM.1S cells (Fig. 6a). Based on this network, we observed that typical enhancers appeared to have slightly longer interaction ranges than super-enhancers (Extended Data Fig. 10b,c). We next calculated the frequencies of promoter-promoter and promoter-enhancer interactions, finding that each promoter attracted RNAs from up to 4 other genes in most cases (Fig. 6b), suggesting that one gene promoter may serve as an enhancer for other genes, as previously proposed11. However, in contrast to an earlier report12, we rarely detected promoter-promoter interactions between chromosomes. We also found that each chromatin-enriched RNA was able to interact with multiple typical enhancers, but only 1 or 2 super-enhancers (Fig. 6c). By contrast, each enhancer, whether typical or super, mainly interacted with RNAs from 1 or 2 genes (Fig. 6d). These findings suggest that, while each gene is controlled by a large number of enhancers, each enhancer regardless of typical or super status is dedicated to regulate a highly selective set of target genes.
Fig. 6. Inferring promoter-promoter and promoter-enhancer connectivity by chromatin-enriched RNAs.
a, A representative subnetwork of RNA-chromatin interactions on Chr. 1 in MM.1S cells, exhibiting intra-chromosomal promoter-promoter and promoter-enhancer connectivity. b, The number of chromatin-enriched RNA genes paired with each active promoter. c, The number of chromatin-enriched RNA genes paired with typical (blue) or super- (red) enhancers. d, The number of enhancers paired by each chromatin-enriched RNA gene. e,f, Fold-changes in gene expression plotted in the accumulative fashion for the genes associated with only typical enhancers (blue) versus those also linked to super-enhancers (red) in response to JQ1 treatment in MM.1S cells (f) or Mediator depletion in mESCs (g). P-values in e and f were determined by Kolmogorov–Smirnov test. g, Self-organized map for visualization of the whole-genome network in MM.1S cells. Individual chromosome territories are highlighted.
We next sought functional evidence for these deduced global promoter-enhancer interactions. Choosing specific examples in MM.1S cells, RNAs from two transcribing genes SNX5 and RPBP1 were interacting with one super-enhancer and six typical enhancers (Extended data Fig. 10d). In response to JQ1, both genes were down regulated (Extended data Fig. 10e) and the super-enhancer showed a higher reduction in BRD4 binding than typical enhancers (Extended Data Fig. 10f). We then extended the analysis to all promoters and enhancers connected by chromatin-enriched RNAs in MM.1S cells by asking whether genes associated with at least one super-enhancer (plus typical enhancers) might be more sensitive to perturbation by JQ1 than those only linked to typical enhancers. We found that this was indeed the case (Fig. 6e). We performed parallel analysis on mESCs based on super-enhancers previously defined by Mediator binding16 and reached the same conclusion from the transcriptional response to Mediator depletion (Fig. 6f).
In addition to network analysis on individual chromosomes, we displayed the whole genome network detected by GRID-seq with Cytoscape, as illustrated for MM.1S cells (Fig. 6g). Notably, the resulting global network revealed the organization of individual chromosomes that resembled nuclear territories detected by chromosome painting35, which is similar to those reconstructed with Hi-C data in budding yeast36 and mammalian cells37. Despite the fact that we rarely detected promoter-promoter proximity between chromosomes, we did observe various specific inter-chromosomal interactions, suggesting potential neighboring relationships between different chromosomes in a given cell type. Although verifying such putative inter-chromosomal interactions clearly require future work, especially at single cell levels, the elucidated global interaction network establishes a foundation to understand genomic organization in the 3-dimensional space of the nucleus.
Discussion
We present here a technology for global detection and analysis of RNA-chromatin interactions. One of the major findings of applying GRID-seq to mammalian and fly cells is that few RNAs are capable of engaging in broad trans-chromosomal interactions, with the exceptions of the major lncRNAs MALAT1 and NEAT1 in mammals, as reported in literature4,19. However, we cannot rule out the possibility that many less abundant lncRNAs may escape detection at our current sequencing depth. Interestingly, we detected a large number of snoRNAs on chromatin interactions in fly cells, raising the possibility that various snoRNAs may have important roles at the chromatin level. We also detected many unannotated chromatin-enriched transcripts in all cell types we examined thus providing rich recourses for future studies of their functions. Numerous RNAs were able to reach out to chromatin regions that are megabases away in linear DNA distance, and in some extreme cases, some specific RNAs can decorate an entire chromosome arm, posing the question whether some of those RNAs might broadly modulate gene expression on various autosomes.
Although our GRID-seq data provide rich resources to study individual chromatin-interacting RNAs, we have utilized this information to elucidate general patterns of RNA-chromatin interactions. Here, it is important to emphasize that, although GRID-seq detects genomic interactions that are directly linked to transcription, it does not necessarily establish the functionality of detected distal DNA elements for regulating their contact genes, which requires functional perturbation in their native genomic contexts. We also used the GRID-seq data to infer contacts between the sites of RNA transcription and distal DNA elements. In contrast to the RNPPII ChIA-PET deduced promoter-promoter interactions, which suggested one promoter to interact with an average of ~8 other promoters11 and about half occurred between chromosomes12, we mainly detect intra-chromosomal interactions based on our statistical model. Although resolving this discrepancy will require future studies, we argue that intra-chromosomal interactions are expected to dominate over inter-chromosomal interactions because of the confinement imposed by nuclear territories35.
The majority of chromatin-enriched RNAs are pre-mRNAs, implying that many pre-mRNAs may function in the regulation of gene expression as lncRNAs before processing into mRNAs in the nucleus. This is in line with increasing evidence for a role of both lncRNAs and nascent RNAs in meditating a range of regulatory activities on chromatin, as exemplified by the RNA-dependent recruitment of a de novo DNA methyltransferase38, transcriptional activators39,40, or repressors41–44. Thus, the GRID-seq technology is expected to expedite the discovery of a variety of RNA-mediated regulatory activities on chromatin.
Methods
Cell culture
MDA-MB-231 breast cancer cells (HTB-26, ATCC) were cultured at 37°C and 5% CO2 in Dulbecco’s Modified Eagle Medium (Thermo Fisher) supplemented with 10% fetal bovine serum. MM.1S cells were cultured at 37°C and 5% CO2 in RPMI-1640 supplemented with 1% GlutaMAX (Thermo Fisher) and 10% fetal bovine serum. For JQ1 treatment, MDA-MB-231 cells were re-suspended in fresh media containing 500 nM JQ1 (a gift from Cheng-Ming Chiang, UT Southwestern) or 0.05% DMSO as vehicle for a duration of 6 hrs. Mouse ES cells (C57BL/6) were cultured in KnockoutTM DMEM (Thermo Fisher) supplemented with 15% KnockoutTM Serum Replacement (Thermo Fisher), 2 mM L-glutamine (Thermo Fisher), 1× non-essential amino acids (Thermo Fisher), 0.1 mM 2-mercaptoethanol (Thermo Fisher), 1,000 U /ml LIF (Millipore), 3 μM CHIR99021 (Stemgent) and 1 μM PD0325901 (Stemgent). Drosophila S2 cells were cultured at room temperature and ambient CO2 in Schneider’s Drosophila Medium (Thermo Fisher) supplemented with 10% fetal bovine serum and 2 mM L-glutamine (Thermo Fisher). The origins, authentication and mycoplasma-testing methods of the cell lines used in the current study were listed in the Life Sciences Reporting Summary.
Construction of GRO–seq library
Global nuclear run-on coupled with deep sequencing (GRO-seq) was performed as previously described with a few modifications27,45. Briefly, MDA-MB-231 cells in 10-cm plates treated with DMSO or JQ1 were washed 3 times with cold 1× phosphate buffered saline (PBS) and then swelled in swelling buffer (10 mM Tris-Cl pH 7.5, 2 mM MgCl2, 3 mM CaCl2) for 5 min on ice. Cells were harvested and re-suspended in 10 ml lysis buffer (10 mM Tris-Cl pH 7.5, 2 mM MgCl2, 3 mM CaCl2, 10% Glycerol and 0.5% IGEPAL) with gentle pipetting and incubation for 5 min on ice. The resultant nuclei were washed once with 10 ml lysis buffer and re-suspended in 100 μl freezing buffer (40% Glycerol, 5 mM MgCl2, 0.1 mM EDTA, 50 mM Tris-Cl, pH 8.3). For run-on assay, re-suspended nuclei were mixed with equal volume of the nuclear-run-on reaction buffer (10 mM Tris-Cl, pH 8.0, 5 mM MgCl2, 300 mM KCl, 1 mM DTT, 200 U/ml RNaseOut, 1% Sarkosyl, 500 μM ATP, GTP, Br-UTP and 2 μM CTP) and incubated for 5 min at 30°C. Total RNA was extracted with TRIzol LS reagent (Life Tech), re-suspended in 20 μl H2O, and subjected to base hydrolysis on ice followed by treatment with DNase I and Antarctic Phosphatase (NEB). Before immunopurification, RNA was heated to 65°C for 5 min and kept on ice. Pre-equilibrated anti-BrdU agarose beads (Santa Cruz Biotech) were mixed with heated RNA in binding buffer (0.25 × SSPE, 1 mM EDTA, 0.05% Tween-20, 37.5 mM NaCl) for 1 hr at 4°C with rotation. After binding, the beads were washed sequentially with low salt buffer (0.2 × SSPE, 1 mM EDTA, 0.05% Tween-20) and high salt buffer (0.25 × SSPE, 1 mM EDTA, 0.05% Tween-20, 150 mM NaCl). Br-U incorporated RNA was eluted with elution buffer (20 mM DTT, 150 mM NaCl, 50 mM Tris-Cl, pH7.5, 1 mM EDTA, 0.1% SDS). To generate RNA with 5′-P and 3′-OH, immunoprecipitated Br-U labeled RNA was re-suspended in 50 μl H2O with 5.5 μl T4 PNK buffer, 1 μl T4 PNK (NEB) and 1 μl RnaseOut and incubated for 1 hr at 37°C. RNA was extracted using Acidic Phenol-Chloroform (Life Tech) and then subjected to poly-A tailing with Poly(A) Polymerase (NEB) for 30 min at 37°C. Tailed RNA was converted to cDNA by using SuperScript III (Life Tech) and oNTI223 primer (5′-/5Phos/AGATCGGAAGAGCGTCGTGTAG/idSp/GCAGAAGACGGCATACGAGATTTTTTTTTTTTTTTTTTTTVN-3′), where the /5Phos/indicates 5′ phosphorylation, /idSp/indicates an abasic dSpacer furan, and VN indicates degenerate nucleotides. The cDNA products were resolved in 10% polyacrylamide TBE-urea gel and cDNA in the size range of 100–400 bp was excised and recovered. The first-strand cDNA was circularized using CircLigase II (Epicenter) and then re-linearized with ApeI (NEB). Finally, linearized DNA was amplified by PCR using Phusion High-Fidelity enzyme (NEB), primer oNTI200 (5′-CAAGCAGAAGACGGCATACGA-3′) and primer oNTI201 (5′-AATGATACGGCGACCACCGAGATCTACACNNNNNACACTCTTTCCCTACACGACGCTCTTCCGATCT-3′), where NNNNN indicates the index sequence for multiplexing sequencing. PCR products were resolved on native 10% polyacrylamide TBE gel and recovered. Sequencing was performed on Illimina HiSeq-2500 using the sequencing primer (5′-ACACTCTTTCCCTACACGACGCTCTTCCGATCT-3′).
Construction of GRID-seq library
A bivalent linker was chemically synthesized (IDT), as illustrated in Extended Data Fig. 1a,b. The DNA strand consists of: 5′-/5Phos/GTTGGAGTTCGGTGTGTGGGAGTGAGCTGTGTC-3′, and the DNA/RNA hybrid strand consists of 5′-/5Phos/rGrUrUrGrGrArUrUrCrNrNrNrGrACACAGC/iBiodT/CACTCCCACACACCGAACTCCAAC-3′ (r: ribonucleotide; rNrNrN: Random 3-mer ribonucleotide barcode; /iBiodT/:biotin-conjugated T). The DNA/RNA hybrid stand was pre-adenylated by using the DNA 5′ Adenylation Kit (NEB), and purified by Phenol:Chloroform:Isoamyl Alcohol (pH 8.0, Thermo Fisher) extraction followed by ethanol precipitation. Equal molar quantity of the two stands were mixed, heated at 80°C for 5 min, and annealed by slow cooling to room temperature at ~0.1°C per sec. The annealed linker was adjusted to the final concentration of 8 pmol/μl.
Approximately 2×10⁶ mammalian cells or 1×10⁷ Drosophila cells were used for GRID-seq library construction. Cells were washed twice with 1× PBS and crosslinked for 45 min at room temperature with 2 mM PBS-diluted DSG solution. Cells were washed and further crosslinked for 10 min at room temperature with 3% PBS-diluted formaldehyde followed by quenching formaldehyde with 350 mM Glycine. Cells were washed twice with PBS and incubated in 500 μl of Buffer A (10 mM Tris-Cl pH 7.5, 10 mM NaCl, 0.2% IGPAL, 1 U/μL RiboLock (Thermo Fisher), 1× Protease inhibitor (Sigma-Aldrich)) for 15 min on ice. To prepare nuclei, fixed cells were washed in 200 μl of 1× Tango Buffer (Thermo Fisher) and then incubated in 320 μl Buffer B (1× Tango Buffer, 0.2% SDS) for 10 min at 62°C. SDS was immediately quenched with 50 μl of 10% Triton X-100 and the integrity of nuclei was examined under microscope. Nuclei were collected by brief centrifugation, washed twice with 1× Tango Buffer, re-suspended in 500 μl of AluI solution (1× Tango Buffer, 1 U/μl RiboLock, 1× Protease inhibitor, 1% Triton X-100, 0.5 U/μl AluI) (Thermo Fisher), and incubated at 37°C for 2 hrs with agitation. Nuclei were collected, re-suspended in 400 μl of PNK solution (1× Tango Buffer, 1 U/μl RiboLock, 1× Protease inhibitor, 1 mM ATP, 0.35 U/μl T4 PNK (Thermo Fisher)), and incubated at 37°C for 1.5 hr with agitation.
For in situ linker ligation to RNA, prepared nuclei were washed twice with 200 μl of 1× RNA Ligase Buffer (NEB), re-suspended in 500 μl of RNA ligation solution (1× RNA Ligase Buffer, 1 U/μl RiboLock, 0.4 pmol/μl pre-adenylated linker, 4 U/μL T4 RNA Ligase 2-truncated KQ (NEB), 15% PEG-8000), and incubated at 25°C for 2 hrs. For primer extension, 10 μl of H2O, 36 μl of 1 M KCl, 32 μl of 10 mM dNTP mix, 28 μl of 5× RT First Strand Buffer (Thermo Fisher), 28 μl of 100 mM DTT and 5 μl of SuperScript III Reverse Transcriptase were added directly into the suspension, and the reaction was incubated at 50°C for 45 min. For in situ linker ligation to AluI-cut genomic DNA, nuclei were collected, washed twice with 200 μl of 1× DNA Ligase Buffer (NEB) to remove free linker, re-suspended in 1.2 ml of DNA Ligation Solution (0.2 U/μl RiboLock, 1× DNA Ligase Buffer, 1 mg/ml BSA, 1% Triton X-100, 1 U/μl T4 DNA Ligase (Thermo Fisher)) and incubated overnight at 16°C with rotation.
Nuclei were collected, washed with PBS, re-suspended in 266 μl of Proteinase K solution (50 mM Tris-Cl pH 7.5, 100 mM NaCl, 1 mM EDTA, 1% SDS, 1 mg/ml Proteinase K (Thermo Fisher)) and incubated at 65°C for 30 min. After adding 20 μl of 5 M NaCl, protease-treated nuclei were incubated for another 1.5 hr. Total DNA was extracted and dissolved in 200 μl of B&W Buffer (5 mM Tris-Cl pH 7.5, 1 M NaCl, 0.5 mM EDTA, 0.02% Tween-20). Isolated DNA was mixed with 300 μg of Streptavidin-conjugated magnetic beads that had been washed with B&W Buffer for biotin affinity purification. After incubation at 37°C for 30 min, the beads were extensively washed 5 times with B&W Buffer, and incubated in 100 μl of 150 mM NaOH at room temperature for 10 min. Cleared supernatant was collected, neutralized with 6.5 μl of 1.25 M Acetic Acid, and diluted with 11 μl of 10× TE Buffer (100 mM Tris-Cl pH 7.5, 10 mM EDTA). Released single-stranded DNA (ssDNA) was precipitated with isopropanol and dissolved in 30 μl H2O. Second strand synthesis was performed by mixing ssDNA with 250 ng Random Hexamer Primers and 5 μl of 10× NEB Buffer CutSmart. The reaction was incubated at 98°C for 5 min, chilled on ice, added with 8.5 μl H2O, 5 pmol dNTP and 5 U Klenow Fragment (3′ to 5′ exo-) enzyme (NEB), and further incubated at 37°C for 1 hr. After heat inactivation at 70°C for 10 min, 5 pmol S-adenosylmethionine (NEB) and 1 U MmeI enzyme (NEB) were added to the reaction followed by incubation at 37°C for 30 min. Another 3 U MmeI was added and the reaction was incubated for another 30 min. The reaction was terminated by adding 40 μg Proteinase K at 65°C for 20 min. Digested DNA was extracted and purified before loading to 12% native polyacrylamide TBE gel for size-selection. This gel electrophoresis is a critical quality control for the first half of the protocol. The 85 bp band should be clearly visible by naked eye on top of the background DNA smear (Fig. 1a, part 2, Extended Data Fig. 1c, left panel). The presence of the 65 bp band was diagnostic of whether inefficient ligation occurred at RNA ligation or DNA ligation step. When a linker was not ligated at RNA, it would eventually produce single-stranded products that had MmeI motif at the 3′ end before random priming. The absence of the 65 bp band was due the extremely low probability of random priming from the very 3′end, which is required to produce double-stranded MmeI motif. The desired band at 85 bp was excised and purified for adapter ligation. Moreover, a negative control sample should also be harvested from the gel (e.g. from 95 bp smear region above the 85 bp band) and processed in parallel to ensure the lack of products in subsequent procedures.
Adapters were prepared by annealing the following two oligonucleotides (IDT) in 1× NEB Buffer 2 to a final concentration of 25 mM: 5′-/5Phos/AGATCGGAAGAGCACACGTCT-3′ and 5′-ACACTCTTTCCCTACACGACGCTCTTCCGATCTNN-3′, where N represents random nucleotide. Purified DNA was dissolved in 10 μl of 1× NEB Buffer CutSmart and 0.5 U Shrimp Alkaline Phosphatase (NEB), incubated at 37 °C for 30 min, and heat inactivated at 65°C for 5 min. The reaction was diluted with 36 μl H2O, mixed with 10 μl 10× T4 DNA Ligase Buffer (NEB), 32 μl PEG-6000, 200 pmol Adapters and 1,600 U T4 DNA Ligase (NEB), and incubated at room temperature for 1 hr. Unligated nick was phosphorylated by 20 U T4 PNK (NEB) supplemented with 100 pmol ATP at 37°C for 30 min. Single strand nick was then sealed by addition of 1 μl 10×T4 DNA Ligase Buffer, 100 pmol ATP and 1,600 U T4 DNA Ligase (NEB) at room temperature for 30 min. DNA along with excessive Adapters were extracted and purified before loading into 10% native polyacrylamide TBE gel for size-selection. Desired band appeared in a compact single band that could be empirically determined to be in the range from 165 to 185 bp in size. This variability might be caused by the “Y”-shaped Adapter that migrate differently under different gel electrophoresis conditions. It is important to ensure the absence of the desired band in the negative control sample when isolating the desired band for subsequent steps (Extended Data Fig. 1c, middle panel). DNA was extracted and dissolved in 20 μl H2O, in parallel of a new negative control sample. To amplify each library, 20 μl of PCR amplification mix (9.4 μl of H2O, 5 μl of DNA sample, 4 μl of 5× Phusion HF Buffer, 40 pmol dNTP, 5 pmol Primer#1, 5 pmol Primer#2, 0.4 U Phusion High-Fidelity DNA Polymerase (Thermo Fisher)) was prepared. PCR primers consist of Primer#1 (5′-AATGATACGGCGACCACCGAGATCTACACBBBBBACACTCTTTCCCTACACGACGCTCTTCCGATCT-3′ (BBBBB: 5 nt barcode for multiplexing libraries)) and Primer#2 (5′-CAAGCAGAAGACGGCATACGAGACGTGTGCTCTTCCGATCT-3′). PCR was performed initially for 30 seconds at 98°C, and then 16 cycles of 10 sec denaturation at 98°C, 30 sec annealing at 65°C, and 15 sec extension at 72°C. The PCR product was resolved by native 10% polyacrylamide gel and the band of 194 bp in size was recovered (Extended Data Fig. 1c, right panel). The negative control sample should not yield any visible band in the similar range. DNA was subsequently subjected to single-end 100 bp sequencing on Illumina HiSeq 2500 with the sequencing primer (5′-ACACTCTTTCCCTACACGACGCTCTTCCGATCT-3′).
To set up a Human-Drosophila mix, MDA-MB-231 and S2 cells were independently double-crosslinked and collected, from which nuclei were isolated and counted (related to Fig. 1g,h). Pilot experiments indicated that human MDA-MB-231 nuclei and Drosophila S2 nuclei at a 1:5 ratio contain roughly equal amounts of total nucleic acid, and accordingly, 1 million MDA-MB-231 nuclei and 5 million S2 nuclei were mixed (Fig. 1g). The construction of the mix library was performed in parallel on 2 million MDA-MB-231 cell nuclei and 10 million S2 cell nuclei.
GRID-seq raw data processing
Upon sequencing, reads from individual libraries were segregated according to multiplexing barcodes and then both barcode and residual adapter sequences were removed, producing trimmed reads that predominantly ranged from 84 bp to 87 bp (read count of each library was shown in the 3rd column in Extended Data Fig. 2a). To precisely remove linker sequence from each read, MmeI motifs were used for defining linker boundaries. Linker orientation also dictated whether a given read at each end was originated from RNA or genomic DNA. In most of sequenced GRID-seq libraries, >70% reads unambiguously contain the complete linker sequence at the expected positions. To minimize the loss of reads that do not contain the exact full linker sequence due to errors introduced in sequencing and/or PCR, reads were first filtered based on the presence of two opposite-orientated MmeI motifs, then the read segment in-between the two MmeI motifs were aligned to the linker sequence from both directions to determine its orientation. With this strategy, ~85% of raw reads could be further clipped at MmeI motifs to produce paired DNA and RNA read mates (4th column in Extended Data Fig. 2a). Paired reads range from 18 bp to 23 bp in size were assigned uniquely paired IDs and deposited at Gene Expression Omnibus (see Author Information).
All processed read mates were separately aligned to their indicated genome builds using Bowtie2 with parameter of --local46. Human samples were aligned to genome build hg38, mouse samples to mm9 or Drosophila samples to dm3. Read pairs containing ambiguously mapped DNA or RNA read were filtered out by SAMtools47 with the parameter of -q2 (5th column in Extended Data Fig. 2a). To estimate the numbers of cross-species RNA/DNA read mates in the mix of MDA-MB-231 and S2 nuclei, RNA reads were first aligned independently to the transcriptome builds of hg38 and dm3, and only uniquely mapped reads were identified by SAMtools47 with the most stringent parameter of -q44. DNA reads with their RNA read mates uniquely aligned to the human transcriptome were then aligned to human genome and filtered with the parameter of -q2. Those DNA reads failed to align to the human genome were then aligned to the Drosophila genome, with the parameter of -q2. Similarly, DNA reads with their RNA read mates uniquely aligned to the Drosophila transcriptome were first aligned to the Drosophila genome, and those unaligned DNA reads were then aligned to the human genome (related to Fig. 1g).
Identifying chromatin-enriched RNAs
Genomic regions with enriched GRID-seq RNA reads were detected by MACS2 using the broad-peak detection model48. Mapped regions with significant enrichment (p<0.001) and overlapping with known-gene annotation (Ensemble genes GRCh38.83 for human, NCBIM37 for mouse and BDGP5.78 for Drosophila) were assigned to their respective largest annotated transcripts. Enriched regions without any known annotation were assigned as “unannotated transcripts”. To ensure a high specificity, we filtered all detected RNAs and unannotated transcripts with stringent cutoffs based on the enrichment of their RNA and DNA read mates. First, transcripts with detectable coverage of RNA reads on their genes above the sliding-window threshold were considered as “abundant chromatin-interacting RNAs”. The sliding-window threshold was determined by following requirements: (Ni − Ni+n) ≥ n, where i is the rank of given RNA; N is the read-counts of this RNA; and n is the 1/100 of the total number of ranked RNAs. Secondly, we evaluated the read densities of mate RNA and DNA reads for each of these abundant chromatin-interacting RNAs by BEDtools49 and SAMtools47. A subset of abundant chromatin-interacting RNAs (1) with sufficient RNA read density on gene body [RPK (reads per Kb) ≥100] or (2) with significant DNA read density (RPK≥10) associated with any given genomic region was identified as chromatin-enriched RNAs. By applying this strategy, we took into consideration both the abundance of transcript and targeting chromatin site.
Comparison of Malat1 GRID-seq raw signal with RAP-DNA and CHART
RAP-DNA detected chromatin-interaction of mouse Malat1 were obtained from public dataset (Supplementary Table 3). Genome-wide and local comparison of interaction density were calculated as RPK (reads per Kb genome). Malat1 coverage values were averaged into 100 Kb intervals when displayed in the genome and specific chromosomes (Fig. 1e), and averaged into 1 Kb intervals in the regional track (Fig. 1f). Pairwise Pearson’s Correlation Coefficient (PCC) for the whole genome was calculated at 10 Kb resolution. Human MALAT1 and mouse Malat1 targeting genes were assigned by the overlap of active gene-bodies with significant peaks of DNA reads linked to MALAT1/Malat1 RNA, called by MACS2 with FDR<0.05.
Construction of non-specific background
To determine specific RNA-chromatin interactions, we developed both experimental and computational approaches to evaluating the genome-wide background of non-specific RNA interactions on chromatin. The experimental approach was to utilize mixed nuclei from human MDA-MB-231 and Drosophila S2 cells for library construction and parallel data analyses. In the Drosophila genome, these alien RNAs from the mixed library represent true non-specific RNAs, and their chromatin interactions were therefore considered as background for non-specific RNA-chromatin interactions (Fig. 1h, top track). Similarly, in the human genome, a background was built of non-specific interactions based on alien RNAs from Drosophila nuclei. Because of the dramatic difference in genome sizes, the DNA read density on the human genome mated with Drosophila RNAs was often too scattered to provide a reliable background. The performance evaluation led to the conclusion that we could not achieve a satisfactory density by simple increase of sequencing depth (data not shown). Therefore, we sought to computationally construct the background based on endogenous RNA reads. Analogous to the strategy proposed by algorithms for background correction of Hi-C data50, in which signals of inter-chromosomal DNA-DNA interactions were combined to deduce noise distribution, we utilized trans-chromosomal RNA-chromatin interactions to deduce the background. Considering potential bias that might be introduced by certain non-coding RNAs, such as MALAT1 and NEAT1, known to have significant trans-chromosomal interactivity, we excluded all non-coding RNAs during background construction. DNA reads mated with all detected protein-coding RNAs that engaged in trans-chromosomal interactions were thus combined, normalized, and used to calculate the coverage in each 1 Kb bin of the genome (Extended Data Fig. 4a, step 1). Such read density at each bin was then smoothed by a moving window of flanking 10 bins and normalized by the total read number and chromosome size (Extended Data Fig. 4a, step 2). The final value Bi at each bin i is:
where m is the number of RNAs mated with specific DNA reads; for each RNA k, Readki is the read counts in bin i from RNA k; Ci is the total number of DNA reads mated with RNA k in the chromosome of bin i; and Li is the length of chromosome where bin i is located (Extended Data Fig. 4a, step 3). As shown in the main text, the resulting background in the Drosophila genome was highly correlated with the cross-species background (Fig. 1h, bottom track and scatter plot). This strategy enabled us to deduce the background on any cell type by using endogenous RNA reads.
Identification of specific RNA-chromatin interaction
To evaluate specific RNA-chromatin interactions for each RNA at each genomic bin, we first summarized the coverage of DNA reads mated of each RNA in the 1 Kb binned genome, and then normalized by the total number of mapped reads and the length of chromosome where the bin was located. This part was similar to the formula described for background construction. We next calculated the fold enrichment by dividing the normalized DNA read density with background read density, giving rise to value Vi in bin i:
where the ratio Vi represents the fold enrichment of this RNA on the chromosome Ci at bin i location, compared to background. For each chromatin-enriched RNA, bins without sufficient enrichment of DNA reads (V < 2) were filtered out as false positives. To construct a robust genome-wide pattern of specific RNA binding, fold enrichment of RNA at genomic bins with robust levels (at least 3 bins with fold enrichment ≥ 2 in every 10 bin-window) were preserved and smoothed by a moving-widow of 10 bins (Fig. 1i and Extended Data Fig. 4a step 4). In this way, we identified enriched peaks for individual RNAs on the genome and considered them as specific RNA-chromatin interactions in downstream analyses.
We further combined interaction patterns of all chromatin-enriched RNAs into a 2D matrix (each gene as one row and each genomic bin as one column), based on which we performed subsequent analyses on genomic features. By partitioning the linear genome into bins of fixed size (e.g. 1 Mb or 1 Kb) on one dimension, and partitioning into gene annotations on the other dimension, the map can be represented as an interaction matrix M, where the entry Mi,j is the background-corrected interaction density (fold-enrichment) observed when RNA of genei interacted with genomic binj. Such matrixes were used to generate the global GRID-seq interaction maps.
GRID-seq interaction heatmap, ternary plot and Circos plot
GRID-seq interaction maps is a list of RNA-DNA interactions produced by the background-corrected interaction matrix (see previous section). An interval on the x-axis refers to a set of consecutive genomic bins; while the interval on the y-axis refers to gene body where individual chromatin-enriched RNAs were derived. We defined the resolution of GRID-seq interaction map as the genomic bin size used to construct a particular matrix. Such interaction maps could be directly plotted into heatmaps, each row in the interaction heatmap represented one chromatin-enriched RNA, which was coordinate-ranked based on their encoding gene location in the genome; and each column represented one genomic bin at a given resolution. Thus, the color at each position in this matrix represented the level of this RNA (row) interacting with this binned interval of genome (column) (Fig. 2a,b,c, Extended Data Fig. 5a, Extended Data Fig 6a,b). In the ternary plots, each point corresponded to one chromatin-enriched RNA. The size of each data point was proportional to the level of background-corrected interaction with chromatin in log scales. The position of each data point in the triangular coordinates reflected the relative percentages of interaction levels in local, cis and trans modes, as determined by the interaction matrix (Fig. 2g,h,i). The Circos plots25 exemplified representative chromatin-enriched RNAs. The links in the center of the plot were drawn based on the original RNA-DNA read mates. Links were bundled into 1 Mb resolution for simplicity of the plots. The outer circle of histograms was plotted based on background-corrected interaction levels of the RNAs. Y-axis of histograms was auto-scaled to the highest peak on the genome (Extended Data Fig. 5h,i,j).
Comparison of roX2 GRID-seq with ChIRP, CHART and MSL3 ChIP-seq
Peaks of roX2 ChIRP and CHART were extracted from original published datasets without modification (Supplementary Table 3). GRID-seq peaks were filtered based on the distribution of peak density (Z ≥-1.7), resulting in 108 significant peaks. MSL3 ChIP-seq reads were mapped to dm3 genome build, and peaks were called by MACS2 with default narrow peak parameters (FDR<0.05), stitched within 5 Kb range and filtered by Z score (>0.8), resulting in 285 top peaks that agree with the original report23, which used dm1 genome build. We first counted the overlapping peaks between each pair of GRID-seq, ChIRP, CHART and among all three, then merged them into sets of uniformed peaks (Fig. 2e, intersections of Venn diagram). RNA interaction signals on chromatin (RPK) detected by ChIRP and CHART, as well as background-corrected signals by GRID-seq (fold-enrichment) were piled on the composite MSL3 ChIP-seq peaks flanked by 10 Kb (Fig. 2f). Mean levels of signals were normalized to the highest value, generating curves of relative occupancy.
Assigning active promoters and enhancers
In MDA-MB-231 and MM.1S cells, active promoters and enhancers were identified based on genomic regions enriched with histone marks of H3K4me3 and H3K27ac, extracted from published data (Supplementary Table 3). Briefly, enriched peaks of H3K4me3 and H3K27ac were detected by MACS2 in narrow-peak mode with default parameters. H3K4me3-enriched peaks in regions ±5 Kb from TSS were filtered out as active promoters by BEDTools49, and enriched H3K27ac peaks in regions ±2.5 Kb from known promoters were removed. The remaining peaks were then stitched together if they were clustered within a 12.5 Kb region. These stitched H3K27ac peaks were defined as active enhancers. The coverage of H3K4me3 in active promoters and the coverage of H3K27ac in active enhancers were then calculated by BEDTools49. Super-enhancers were defined based on the H3K27ac coverage on active enhancers using the algorithm as previously described26. On mESCs, active promoters were defined by H3K4me3 and H3K27ac marked peaks with same criteria as on human cells. Enhancer annotation in mESCs was according to Whyte et al16, by exploiting the co-occupancy of Oct4, Sox2, and Nanog. Super-enhancers were defined by the high Mediator binding on the transcription factor defined enhancers, instead of H3K27ac, as described by Whyte et al16. On Drosophila cells, enhancers were annotated by REDfly database29, of which a subset of active enhancers was defined by H3K27ac ChIP-chip dataset on Drosophila S2 cells according to published modENCODE data (Supplementary Table 3). When displaying and analyzing RNA levels on DNA elements such as gene-body, enhancer and promoter, total RNA interaction density on each element was calculated as the sum of background-corrected interaction levels (fold-enrichment) of each chromatin-interacting RNA. This calculation is equivalent as the sum of column of GRID-seq interactions matrix at specific DNA element (related to Fig. 3c,e and Fig. 4).
Hi-C data processing
In Drosophila S2 cells, raw Hi-C reads from published datasets (Supplementary Table 3) were first separated in paired fragment mates, and independently aligned on the Drosophila genome (dm3 build) by Bowtie2 in end-to-end mapping mode. Reads that were aligned but unpaired were discarded, and paired read mates were converted into a paired-end BAM file. Aligned read mates were further filtered by the assignment of HindIII sites in the genome by HIC-PRO51. To construct a high-resolution contact map, raw contact densities were further allocated and smoothed into 10 Kb binned genome by 10-step-overlapping using HiTC R package52, resulting a new contact map at 1 Kb resolution. Next, intra- and inter-chromosomal interactions in the contact map were normalized by ICE algorithm50. Topologically associating domains in S2 cells were directly sourced from published data at the 10 Kb resolution (Supplementary Table 3).
We adopted the ICE-normalized Hi-C contact matrix at 40 Kb resolution on mESCs, as originally reported by Giorgetti L. et al32, and combined the diploid contact map into haploid contact matrix before further analysis. TADs were recalculated based on the merged Hi-C matrix by using the same scripts with the same parameters provided in the report32. Visualization of Hi-C data in triangle heatmap was plotted by Sushi R package53.
To compare with gene-oriented interactions deduced from GRID-seq data, the normalized Hi-C contact map was transformed into a gene-chromatin matrix, much similar to GRID-seq interaction matrix described in the previous sections. Specifically, all of the intra- and inter-chromosomal interactions failed to connect with any known genic regions were discarded, while those interactions at genic regions were kept. Interactions of these genes were first summarized gene-by-gene and then transformed into a gene-centered contact matrix (Fig. 5c,d, Extended Data Fig. 9c).
Comparison of RNA local and cis-interactions with Hi-C
RNA interactions with flanking chromatin regions around its gene locus were displayed as heatmaps (Fig. 5a,b). The matrixes underling the heatmaps were generated by transforming the RNA-chromatin interaction matrixes and aligning all RNA’s gene-body to the center bin. The RNA interaction density (fold-enrichment) value at each genomic bin was the same as in the RNA-chromatin interactions matrix. The rows of heatmaps representing chromatin-enriched RNAs were sorted in decreasing order based on the total interaction density across the displayed genomic interval (Fig. 5a,b). The matrixes were generated in 10 Kb resolution on both human cells, but in 40 Kb on mESCs, and 1 Kb on Drosophila S2 cells for the comparison with respective Hi-C matrixes. Hi-C gene-chromatin contacts matrixes (described in the previous section) were transformed and centered in the same way as RNA-chromatin interactions matrix (Fig. 5c). The sorting of Hi-C gene-chromatin contacts matrixes were kept in the same order as in the RNA-chromatin heatmaps (sorting orders displayed in Fig. 5b). Global concordance of Hi-C and GRID-seq matrixes were evaluated by Pairwise Pearson’s Correlation Coefficient of each gene (row of heatmap) at all genomic bins (columns of heatmap) within ±1 Mb on mESCs or ±200 Kb on Drosophila S2 cells (Fig. 5d). When displaying exemplary tracks, all GRID-seq RNA interactions were plotted in their original 1 Kb resolution (Fig. 5e, Extended Data Fig. 9a).
Comparison of RNA local and cis-interactions with TADs
RNA interactions with flanking genomic regions around its gene locus were displayed as heatmaps (Extended Data Fig. 9b,c, left panels). The matrixes underlying the heatmaps were generated by transforming the RNA-chromatin interaction matrixes. Each row of the new matrix represents one chromatin-interacting RNA. The genomic bins occupied the two boundaries of the TAD that encompassed the gene locus were labeled red. Each row was aligned by the center of the TAD. The RNA interaction density (fold-enrichment) value at each genomic bin was the same as in the RNA-chromatin interactions matrix. The rows of heatmaps were sorted in decreasing order based on the size of TADs. Note that the same TAD could appear multiple times in different rows as some chromatin-enriched RNAs share the same encompassing TADs. To quantitatively evaluate how much chromatin-enriched RNAs interacted with chromatin across TAD boundaries with significant levels (≥50%), we plotted the portion of each RNA’s interaction signals that reached beyond TAD boundaries as a relative percentage of its total signals as a bargraph (Extended Data Fig. 9b,c, right panels). The sorting order of the bargraphs was kept the same as the heatmaps.
Inference of GRID-seq detected networks
Hi-C intra-chromosomal contact probability, which is generally believed to represent spatial proximity, exponentially decline along the linear genomic distance following power-law distribution8. We observed in GRID-seq that most cis RNA-chromatin interaction signals also exponentially decline along the linear distance from their sites of transcription, following similar power-law distribution. A few exceptions in GRID-seq represented by well-known trans-acting lncRNAs, such as MALAT1 and NEAT1, showed similar intensity at their sites of transcripts as well as on numerous loci in other chromosomes. However, mRNAs, as a collection, strictly follows such power-law distribution and thus signify chromatin proximity similar to that of Hi-C. Such concordance therefore enables our rationale to use mRNA signals to deduce genomic proximity. In contrast to cis interactions, most mRNA signals landed on all other chromosomes other than the ones they were transcribed from were likely due to trans interactions, and those trans signals on individual loci were generally orders-of-magnitude weaker compared to cis signals. Thus, we used these trans-chromosomal interactions of mRNAs as “true negatives” to build a statistical null model as non-proximal interactions. The principle of our null model is that, as mRNAs signals decline alone genomic distance from the site of transcription, the signal levels become indistinguishable from trans-interactions on other chromosomes. Therefore, any signal that rejects the null model is considered as cis-interaction that occurs in the spatial proximity of individual transcribed loci. According to this null model, for each given RNA-DNA interaction peak of mRNAs, we calculated a Z score to evaluate its significance of deviation from the trans (null) distribution. Specifically, for each RNA k interacting with enhancer t, the normalized interaction density Gkt was calculated based on the GRID-seq value Vki, as:
The Gkt value was observed to fit normal distribution in all human, mouse, and Drosophila data. We used trans-chromosomal distribution of G value as statistical null model and these mRNA-chromatin interactions significantly greater than the null distribution were considered to reflect spatial proximity of looped chromatin.
The promoter-promoter and enhancer-promoter connectivity in the MM.1S cell were identified based on this model at the significance of Z≥3 (Supplementary Table 2), as displayed in the network of chromosome 1 (Fig. 6a) and further characterized (Fig. 6b,c,d). The global networks were built at the less significance cut-off of Z>2.5 to preserve sufficient trans-chromosomal interactions needed to depict chromosome-chromosome relationships in the nucleus. All networks were displayed by Cytoscape (version 3.3), a versatile software for network visualization and analysis, and rendered by a self-organized layout algorithm, Edge-Repulsive Spring-Electric Layout, supported by the third-party app of AllegroLayout34.
Functional perturbation of enhancer activities
MDA-MB-231 cells were treated with the BRD4 inhibitor JQ1 or DMSO for 6 hrs, and then immediately harvested for analysis by global nuclear run-on27. To quantify transcription activities in an unbiased manner, GRO-seq read densities were first normalized by total uniquely mapped reads to remove variations between libraries. To minimize potential bias introduced by promoter pausing or due to variations in gene length, only reads aligned in between 2 to 3 Kb downstream of TSS were selected to calculate the transcription activity. Genes smaller than 3 Kb were excluded from this analysis. For genes expressing multi-isoforms, the transcripts from the most active promoter were selected to represent the gene’s transcription activity. GRO-seq data on mESCs were processed with the same criteria as on human cells. GRO-seq data on Drosophila S2 cells were analyzed as previously described54.
GIRD-seq analysis pipeline and additional datasets
The computational scripts and analysis pipeline as well as additional datasets are accessible at: fugenome.ucsd.edu/gridseq. Software used in the pipeline was described in detail in the previous sections and listed in the Life Sciences Reporting Summary.
Image acquisition and processing
DNA and/or RNA polyacrylamide gels were stained with SYBR-gold (Thermo Fisher) (Fig. 1a, Extended Data Fig. 1b,c). Gel images were acquired by GelDoc-It Imaging System, and subsequently converted to grey-scale mode. Minor adjustments of brightness and contrast were applied equally across the entire image for all panels. Irrelevant lanes and spaces were then cropped and the images were adjusted to appropriate sizes with Adobe Illustrator.
Statistical parameters
The exact sample size (N) for each comparison group was given in the figure and/or the legends. All GRID-seq and GRO-seq libraries were generated and sequenced in duplicates, which started from independent cell culture. Student’s t-tests were performed in Fig. 4b,d,e; Extended Data Fig. 7e,f,g and Extended Data Fig. 8b,d,e and all tested data follow normal distribution. Kolmogorov–Smirnov tests were performed in Fig. 6e,f and compared variables are mutually independent and continuous. Fisher’s exact test were performed in Extended Data Fig. 3a,c,d. All t-tests were performed without the assumption of equal variances between groups. Welch approximation to the degrees of freedom was used. All calculated P-values were two-sided. Center lines in all box plots in the current study were shown as median values and whiskers extended to a maximum of 1.5 × interquartile range beyond the boxes. (see Life Sciences Reporting Summary).
Code availability
All computational scripts and analysis pipeline as well as additional datasets are accessible at: fugenome.ucsd.edu/gridseq.
Data availability
High-throughput data are deposited in Gene Expression Omnibus under accession number GSE82312 for all GRID-seq and GRO-seq experiments. All public data used for comparisons in the current study are listed in Supplementary Table 3, which includes unique accession numbers, web links and a list of associated figure panels where specific comparisons were made.
Extended Data
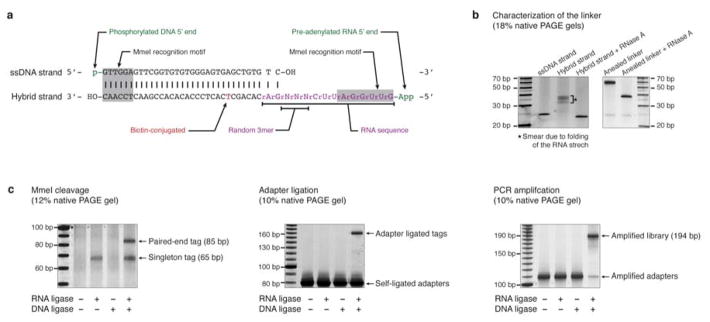
Extended Data Fig. 1. Characterization of the GRID-seq technology.
a, The design of a bivalent linker for GRID-seq. The top strand is a 5′ phosphorylated DNA sequence (black) and the bottom strand consists of both DNA and RNA bases (purple) with a biotinylated T residue (red) in the middle. Randomized bases (N) served as barcodes for filtering PCR duplicates during library amplification and both ends of the linker each carry an MmeI restriction site (grey-shaded). The linker is pre-adenylated for ligation to RNA in the absence of ATP, which prevents ligation of endogenous RNAs. b, Characterization of the linker before (left) and after (right) annealing, showing the sensitivity of the RNA-containing linker to RNase A. c, Controls by omitting RNA ligase, DNA ligase or both during GRID-seq library construction, which yielded expected ligated products of singleton tags or paired-end tags (left). After adapter ligation (middle) and PCR amplification (right), the expected products were only detected after library construction with both RNA and DNA ligases.
Extended Data Fig. 2. Characterization of GRID-seq libraries.
a, Summary of sequenced GRID-seq libraries constructed on two human cell lines (MDA-MB-231 and MM.1S), one mESC, and one Drosophila S2 cells. Shown are raw reads, linker-containing reads, and uniquely mapped reads from mated RNA/DNA pairs. b, Nucleotide frequency of DNA (up) and RNA (bottom) reads. Note specific dinucleotide as part of the AluI recognition site at the 3′ end of DNA reads, but the lack of nucleotide bias in any position of RNA reads. c,d, Strand orientation of mapped RNA (c) and DNA (d) reads. Note the same strand orientation of mapped RNA reads as their transcripts, but not DNA. e,f, Reproducibility of GRID-seq libraries constructed on human (e) and Drosophila (f) cells. g,h, Comparison of GRID-seq detected RNA reads with gene expression detected by RNA-seq of rRNA-depleted total RNA (g) or GRO-seq (h) in Drosophila S2 cells. The lncRNA roX2 is highlighted in both plots. RPK: GRID-seq reads per Kb. RPKM: reads per Kb per million mapped reads.
Extended Data Fig. 3. Characteristics of MALAT1 interaction with chromatin in human and mouse cells.
a, MDA-MB-231 cells (upper panel) and mESCs (bottom panel). b, Meta-analysis of MALAT1-chromatin interactions in human (left panel) and mouse (righ panel) cells on a composite gene model. TSS: Transcription Start Site. TTS: Transcription Termination Site. c, Comparison of MATAL1-chromatin interactions detected by GRID-seq versus RAP-DNA in mESCs. d, Comparison of MATAL1-chromatin interactions detected by GRID-seq in MDA-MB-231 cells versus those identified by CHART in MCF-7 cells. Note that these metagene plots were based on the data before background correction, which remained the same after background subtraction. P-values in a, c, and d were determined by Fisher’s exact test.
Extended Data Fig. 4. Construction of a background model for GRID-seq data analysis.
a, Steps in building the background with trans-chromosomal interacting mRNAs. GRID-seq detected raw DNA reads of trans-acting mRNAs (n=3,559) on chromatin were displayed on all chromosomes with their cis-acting signals masked by grey boxes. Two specific mRNAs on their trans locations were highlighted below the heatmap. Step 1: All trans-acting mRNAs were summed, and then in Step 2, normalized to 1 million total reads. Step 3: The GRID-seq signals of the two specific mRNAs were similarly normalized to 1 million across all chromosomes. Red signals above the general background were highlighted. Step 4: Specific interaction sites were displayed after background correction. b, Comparison of deduced background from replicate GRID-seq libraries constructed on human MDA-MB-231 cells, mESCs and Drosophila S2 cells. Each genome was 1 Kb binned for global comparison. RPK: reads per Kb. c, Comparison between the true background based on the human/Drosophila mixing experiment and the deduced background from mRNA trans-chromosomal reads in inferring specific RNA-chromatin interactions. The data illustrate <1% discrepancies in inferring cis, trans, or all reads in both MDA-MB-231 and S2 datasets. d, Quantification of cis/trans-chromosomal reads distribution before and after background correction. e,f,g, Background GRID-seq signals in open chromatin regions in human (e), mouse (f), and Drosophila (g) cells. Chromatin marks and Pol II binding were displayed on autoscale.
Extended Data Fig. 5. Characteristics of RNA-chromatin interactions.
a, RNA-chromatin interaction heatmaps on Chr. 5 constructed from two independent GRID-seq libraries on MDA-MB-231 cells. Boxed regions in each panel were enlarged with increasing resolution in the next panel on the right. A set of representative chromatin-enriched RNAs are labeled on the right and their encoding gene loci illustrated on the bottom. b, Pearson’s Correlation Coefficient of GRID-seq interaction density of each RNA at increasing resolution (decreasing bin size) across genomes between the replicates performed on MDA-MB-231 cells, mESC and Drosophila S2 cells. c, Whole chromosome view of raw roX2 GRID-seq DNA reads on Drosophila Chr. X and Chr. 3R in comparison with raw signals detected by ChIRP and CHART as well as ChIP-seq signals for the roX2 binding protein MSL3. d, Percentage of total raw roX2 GRID-seq DNA reads on Chr. X in comparison with the raw data of ChIRP, CHART, GRID-seq and MSL3 ChIP-seq. Total number of raw read for each dataset is noted on top of each bar. e, Comparison of roX2 peaks identified by ChIRP, CHART, and GRID-seq with MSL3 ChIP-seq peaks in Drosophila S2 cells, showing the highest overlap between GRID-seq and MSL3 ChIP-seq identified peaks. f, Comparison of GRID-seq identified roX2 peaks with MSL3 ChIP-seq peaks on Chr. X and autosomes, showing their overlap only on Chr. X. g, Meta-analysis of roX2 GRID-seq DNA reads relative to chromatin binding of CES and HAS. Pie charts on the right illustrate the overlaps between CES/HAS peaks and roX2 GRID-seq peaks. h,i,j, Circos plots depicting chromatin-interactions of two representing lncRNAs (left panels) and two protein-coding mRNAs (right panels) in each cell type. In MDA-MB-231 cells (h), the lncRNA MALAT1 broadly interacted with all chromosomal regions whereas PVT1 was predominantly involved in local and cis-chromosomal interactions, although trans-chromosomal interaction signals were also evident in various specific locations (h, left panel). Similarly, RNAs from the coding HMGA2 gene showed chromatin interactions in local, cis and trans modes whereas RNAs from the coding SMAD5 gene was largely confined in local interactions (h, right panel). Similar examples also illustrated distinct chromatin interaction patterns with both coding RNAs and lncRNAs in mESC (i) and Drosophila S2 cells (j).
Extended Data Fig. 6. Global view of RNA-chromatin interactions in human MM.1S cells.
a, Heatmap showing RNA-chromatin interactions across the whole human genome in MM.1S cells. Row: chromatin-enriched RNAs. Column: human genome in 1 Mb resolution. Representative trans-chromosomal interacting RNAs are labeled on the right. b, Enlarged heatmaps of boxed Chr. 22 and X in a, showing detailed RNA-chromatin interactions on Chr. 22 (left) and Chr. X (right). Representative RNAs are labeled on the left (pc: protein-coding RNAs, nc: non-coding RNAs), highlighting the non-coding RNA XIST on Chr. X (note that XIST is expressed in MM.1S cells, but not in MDA-MB-231 cells). Top: The background deduced from endogenous traveling mRNAs.
Extended Data Fig. 7. RNA-chromatin interactions on cell type-specific enhancers.
a,b, Scatterplots of foreground (a) and background (b) of GRID-seq signals between MDA-MB-231 and MM.1S cells in the 1 Kb-binned human genome. c,d, Violin plots showing co-enrichment of specific RNA-chromatin interactions and key chromatin features in MDA-MB-231 cells (c) and MM.1S (d). Left: Enrichment of mean chromatin interaction signals of GRID-seq RNA density after background correction relative to ChIP-seq peaks of RNA Pol II, H3K4me1, H3K4me3, H3K27ac and H3K27me3. Right: Background signals. RPK: reads per Kb. Bars represent the range from 25 to 75 percentiles. e,f, Quantification of RNA-chromatin interaction levels on enhancers in the same cell type (orange) relative to specific enhancers in a different cell type (grey). g, Correlation of RNA-chromatin interaction levels on promoters with gene expression in MDA-MB-231 and MM.1S cells.
Extended Data Fig. 8. RNA interaction levels on super-enhancers and relative contribution of typical and super-enhancers to transcription.
a, Super-enhancers in relationship to RNA-chromatin interaction levels. Enhancers in MDA-MB-231 cells were ranked by RNA interaction levels. Each red bar on top represents a super-enhancer. Red curve: The accumulative curve of rank-ordered RNA-chromatin interactions; Grey dashed line: Random distribution. b, Density distribution of chromatin-enriched RNAs at super-enhancers (SE, red) and typical enhancers (TE, blue). c, Left: Rank-ordered RNA-chromatin interaction levels at all active enhancers. Right: The Top 10% and bottom 10% enhancers with the most and the least RNA interactions, respectively, selected for functional analysis. d, Gene transcription associated with top 10% enhancers (orange box) and bottom 10% enhancers (green box). e, Accumulation curves of transcription changes of genes associated with top 10% and bottom 10% enhancers in response to JQ1 treatment in MDA-MB-231 cells. Statistical significance of comparison is estimated by Student’s t-test in panel b, d and e.
Extended Data Fig. 9. Comparison between Hi-C and GRID-seq in different cell types.
a, Examples of Hi-C interactions in comparison with GRID-seq detected RNA interactions relative to previously assigned TADs in Drosophila S2 cells. H3K27as ChIP-chip signals and reporter scored enhancers from the RedFly database were displayed at bottom. b,c, Left panels: GRID-seq signals relative established TADs in mESCs (b) and Drosophila S2 cells (c). Right panels: GRID-seq signals across TAD boundaries. Red lines indicate chromatin-enriched RNAs with more than 50% GRID-seq signals spread to adjacent TADs.
Extended Data Fig. 10. Inferred enhancer-promoter distance and examples.
a, Density distributions of cis- and trans-chromosomal RNA interaction levels on enhancers in MM.1S cells. x-axis: Z-scores of all trans-chromosomal RNA interactions (green). Z≥3 was used to identify significant RNA interactions on individual promoter and enhancer elements. b,c, Distribution of linear DNA distance between genes and RNA decorated super-enhancers (b) and typical enhancers (c). d, Circos plot, showing a representative case of two chromatin-enriched RNAs RRBP1 and SNX5 on nearby seven enhancers, one of which corresponds to a super-enhancer (red) in MM.1S cells. The RRBP1 RNA interaction profile is shown on the outer track (green) and the SNX5 RNA interaction profile on the inter track (blue). Ribbons connecting with enhancers illustrate inferred enhancer-promoter association. e, f, Upon JQ1 treatment, fold-changes in gene expression are shown in e and fold-changes in BRD4 binding on individual enhancers in f.
Supplementary Material
Acknowledgments
We wish to express our gratitude to X. Ji and R. Young (Massachusetts Institute of Technology) for sending us MM.1S cells; B. Zhou and S. Wasserman (University of California San Diego) for sending us S2 cells; G. Li and B. Ren (University of California San Diego) for sharing with us mESC; C.-M. Chiang (University of Texas Southwestern) for sharing the JQ1 inhibitor; C. Class, S. Dowdy, and N. Chi for critical comments; and members of the Fu lab for stimulating discussion and advice during this investigation. This work was supported by NIH grants (HG004659, HG007005, GM049369 and DK098808) to X.D.F.
Footnotes
Author Contributions
X.L. and X.D.F. designed GRID-seq; X.L. performed most experiments; B.Z. and X.L. analyzed the data; L.C. performed GRO-seq; L.G. contributed to characterization of the global gene network; H.L. sequenced all GRO-seq and GRID-seq libraries; X.L., B.Z., and X.D.F. wrote the paper.
Information linked to the online version of the paper at www.nature.com/nature.
Competing Financial Interests Statement
The authors declare no competing financial interests.
Ed sum
The RNAs bound to the genome and their binding sites are detected with GRID-seq.
References
- 1.Djebali S, et al. Landscape of transcription in human cells. Nature. 2012;489:101–108. doi: 10.1038/nature11233. [DOI] [PMC free article] [PubMed] [Google Scholar]
- 2.Fu XD. Non-coding RNA: a new frontier in regulatory biology. Natl Sci Rev. 2014;1:190–204. doi: 10.1093/nsr/nwu008. [DOI] [PMC free article] [PubMed] [Google Scholar]
- 3.Rinn JL, Chang HY. Genome regulation by long noncoding RNAs. Annu Rev Biochem. 2012;81:145–166. doi: 10.1146/annurev-biochem-051410-092902. [DOI] [PMC free article] [PubMed] [Google Scholar]
- 4.West JA, et al. The long noncoding RNAs NEAT1 and MALAT1 bind active chromatin sites. Mol Cell. 2014;55:791–802. doi: 10.1016/j.molcel.2014.07.012. [DOI] [PMC free article] [PubMed] [Google Scholar]
- 5.Chu C, Qu K, Zhong FL, Artandi SE, Chang HY. Genomic maps of long noncoding RNA occupancy reveal principles of RNA-chromatin interactions. Mol Cell. 2011;44:667–678. doi: 10.1016/j.molcel.2011.08.027. [DOI] [PMC free article] [PubMed] [Google Scholar]
- 6.Simon MD, et al. The genomic binding sites of a noncoding RNA. Proc Natl Acad Sci U S A. 2011;108:20497–20502. doi: 10.1073/pnas.1113536108. [DOI] [PMC free article] [PubMed] [Google Scholar]
- 7.Engreitz JM, et al. The Xist lncRNA exploits three-dimensional genome architecture to spread across the X chromosome. Science. 2013;341:1237973. doi: 10.1126/science.1237973. [DOI] [PMC free article] [PubMed] [Google Scholar]
- 8.Lieberman-Aiden E, et al. Comprehensive mapping of long-range interactions reveals folding principles of the human genome. Science. 2009;326:289–293. doi: 10.1126/science.1181369. [DOI] [PMC free article] [PubMed] [Google Scholar]
- 9.Rao SS, et al. A 3D map of the human genome at kilobase resolution reveals principles of chromatin looping. Cell. 2014;159:1665–1680. doi: 10.1016/j.cell.2014.11.021. [DOI] [PMC free article] [PubMed] [Google Scholar]
- 10.Fullwood MJ, et al. An oestrogen-receptor-alpha-bound human chromatin interactome. Nature. 2009;462:58–64. doi: 10.1038/nature08497. [DOI] [PMC free article] [PubMed] [Google Scholar]
- 11.Li G, et al. Extensive promoter-centered chromatin interactions provide a topological basis for transcription regulation. Cell. 2012;148:84–98. doi: 10.1016/j.cell.2011.12.014. [DOI] [PMC free article] [PubMed] [Google Scholar]
- 12.Zhang Y, et al. Chromatin connectivity maps reveal dynamic promoter-enhancer long-range associations. Nature. 2013;504:306–310. doi: 10.1038/nature12716. [DOI] [PMC free article] [PubMed] [Google Scholar]
- 13.Dixon JR, et al. Topological domains in mammalian genomes identified by analysis of chromatin interactions. Nature. 2012;485:376–380. doi: 10.1038/nature11082. [DOI] [PMC free article] [PubMed] [Google Scholar]
- 14.Jin F, et al. A high-resolution map of the three-dimensional chromatin interactome in human cells. Nature. 2013;503:290–294. doi: 10.1038/nature12644. [DOI] [PMC free article] [PubMed] [Google Scholar]
- 15.Hnisz D, et al. Super-enhancers in the control of cell identity and disease. Cell. 2013;155:934–947. doi: 10.1016/j.cell.2013.09.053. [DOI] [PMC free article] [PubMed] [Google Scholar]
- 16.Whyte WA, et al. Master transcription factors and mediator establish super-enhancers at key cell identity genes. Cell. 2013;153:307–319. doi: 10.1016/j.cell.2013.03.035. [DOI] [PMC free article] [PubMed] [Google Scholar]
- 17.Pott S, Lieb JD. What are super-enhancers? Nat Genet. 2015;47:8–12. doi: 10.1038/ng.3167. [DOI] [PubMed] [Google Scholar]
- 18.Grosswendt S, et al. Unambiguous identification of miRNA:target site interactions by different types of ligation reactions. Mol Cell. 2014;54:1042–1054. doi: 10.1016/j.molcel.2014.03.049. [DOI] [PMC free article] [PubMed] [Google Scholar]
- 19.Engreitz JM, et al. RNA-RNA interactions enable specific targeting of noncoding RNAs to nascent Pre-mRNAs and chromatin sites. Cell. 2014;159:188–199. doi: 10.1016/j.cell.2014.08.018. [DOI] [PMC free article] [PubMed] [Google Scholar]
- 20.Chen LL, Carmichael GG. Altered nuclear retention of mRNAs containing inverted repeats in human embryonic stem cells: functional role of a nuclear noncoding RNA. Mol Cell. 2009;35:467–478. doi: 10.1016/j.molcel.2009.06.027. [DOI] [PMC free article] [PubMed] [Google Scholar]
- 21.Yaffe E, Tanay A. Probabilistic modeling of Hi-C contact maps eliminates systematic biases to characterize global chromosomal architecture. Nat Genet. 2011;43:1059–1065. doi: 10.1038/ng.947. [DOI] [PubMed] [Google Scholar]
- 22.Gelbart ME, Kuroda MI. Drosophila dosage compensation: a complex voyage to the X chromosome. Development. 2009;136:1399–1410. doi: 10.1242/dev.029645. [DOI] [PMC free article] [PubMed] [Google Scholar]
- 23.Alekseyenko AA, et al. A sequence motif within chromatin entry sites directs MSL establishment on the Drosophila X chromosome. Cell. 2008;134:599–609. doi: 10.1016/j.cell.2008.06.033. [DOI] [PMC free article] [PubMed] [Google Scholar]
- 24.Straub T, Grimaud C, Gilfillan GD, Mitterweger A, Becker PB. The chromosomal high-affinity binding sites for the Drosophila dosage compensation complex. PLoS Genet. 2008;4:e1000302. doi: 10.1371/journal.pgen.1000302. [DOI] [PMC free article] [PubMed] [Google Scholar]
- 25.Krzywinski M, et al. Circos: an information aesthetic for comparative genomics. Genome Res. 2009;19:1639–1645. doi: 10.1101/gr.092759.109. [DOI] [PMC free article] [PubMed] [Google Scholar]
- 26.Loven J, et al. Selective inhibition of tumor oncogenes by disruption of super-enhancers. Cell. 2013;153:320–334. doi: 10.1016/j.cell.2013.03.036. [DOI] [PMC free article] [PubMed] [Google Scholar]
- 27.Wang D, et al. Reprogramming transcription by distinct classes of enhancers functionally defined by eRNA. Nature. 2011;474:390–394. doi: 10.1038/nature10006. [DOI] [PMC free article] [PubMed] [Google Scholar]
- 28.Li W, et al. Functional roles of enhancer RNAs for oestrogen-dependent transcriptional activation. Nature. 2013;498:516–520. doi: 10.1038/nature12210. [DOI] [PMC free article] [PubMed] [Google Scholar]
- 29.Gallo SM, et al. REDfly v3.0: toward a comprehensive database of transcriptional regulatory elements in Drosophila. Nucleic Acids Res. 2011;39:D118–123. doi: 10.1093/nar/gkq999. [DOI] [PMC free article] [PubMed] [Google Scholar]
- 30.Negre N, et al. A cis-regulatory map of the Drosophila genome. Nature. 2011;471:527–531. doi: 10.1038/nature09990. [DOI] [PMC free article] [PubMed] [Google Scholar]
- 31.Adelman K, Lis JT. Promoter-proximal pausing of RNA polymerase II: emerging roles in metazoans. Nat Rev Genet. 2012;13:720–731. doi: 10.1038/nrg3293. [DOI] [PMC free article] [PubMed] [Google Scholar]
- 32.Giorgetti L, et al. Structural organization of the inactive X chromosome in the mouse. Nature. 2016;535:575–579. doi: 10.1038/nature18589. [DOI] [PMC free article] [PubMed] [Google Scholar]
- 33.Ulianov SV, et al. Active chromatin and transcription play a key role in chromosome partitioning into topologically associating domains. Genome Res. 2016;26:70–84. doi: 10.1101/gr.196006.115. [DOI] [PMC free article] [PubMed] [Google Scholar]
- 34.Shannon P, et al. Cytoscape: a software environment for integrated models of biomolecular interaction networks. Genome Res. 2003;13:2498–2504. doi: 10.1101/gr.1239303. [DOI] [PMC free article] [PubMed] [Google Scholar]
- 35.Cremer T, Cremer C. Chromosome territories, nuclear architecture and gene regulation in mammalian cells. Nat Rev Genet. 2001;2:292–301. doi: 10.1038/35066075. [DOI] [PubMed] [Google Scholar]
- 36.Duan Z, et al. A three-dimensional model of the yeast genome. Nature. 2010;465:363–367. doi: 10.1038/nature08973. [DOI] [PMC free article] [PubMed] [Google Scholar]
- 37.Di Stefano M, Paulsen J, Lien TG, Hovig E, Micheletti C. Hi-C-constrained physical models of human chromosomes recover functionally-related properties of genome organization. Sci Rep. 2016;6:35985. doi: 10.1038/srep35985. [DOI] [PMC free article] [PubMed] [Google Scholar]
- 38.Schmitz KM, Mayer C, Postepska A, Grummt I. Interaction of noncoding RNA with the rDNA promoter mediates recruitment of DNMT3b and silencing of rRNA genes. Genes Dev. 2010;24:2264–2269. doi: 10.1101/gad.590910. [DOI] [PMC free article] [PubMed] [Google Scholar]
- 39.Sigova AA, et al. Transcription factor trapping by RNA in gene regulatory elements. Science. 2015;350:978–981. doi: 10.1126/science.aad3346. [DOI] [PMC free article] [PubMed] [Google Scholar]
- 40.Lai F, et al. Activating RNAs associate with Mediator to enhance chromatin architecture and transcription. Nature. 2013;494:497–501. doi: 10.1038/nature11884. [DOI] [PMC free article] [PubMed] [Google Scholar]
- 41.Wei C, et al. RBFox2 Binds Nascent RNA to Globally Regulate Polycomb Complex 2 Targeting in Mammalian Genomes. Mol Cell. 2016;62:875–889. doi: 10.1016/j.molcel.2016.06.003. [DOI] [PMC free article] [PubMed] [Google Scholar]
- 42.Yin Y, et al. Opposing Roles for the lncRNA Haunt and Its Genomic Locus in Regulating HOXA Gene Activation during Embryonic Stem Cell Differentiation. Cell Stem Cell. 2015;16:504–516. doi: 10.1016/j.stem.2015.03.007. [DOI] [PubMed] [Google Scholar]
- 43.Lee N, Moss WN, Yario TA, Steitz JA. EBV noncoding RNA binds nascent RNA to drive host PAX5 to viral DNA. Cell. 2015;160:607–618. doi: 10.1016/j.cell.2015.01.015. [DOI] [PMC free article] [PubMed] [Google Scholar]
- 44.Yu Y, et al. Panoramix enforces piRNA-dependent cotranscriptional silencing. Science. 2015;350:339–342. doi: 10.1126/science.aab0700. [DOI] [PMC free article] [PubMed] [Google Scholar]
- 45.Core LJ, Waterfall JJ, Lis JT. Nascent RNA sequencing reveals widespread pausing and divergent initiation at human promoters. Science. 2008;322:1845–1848. doi: 10.1126/science.1162228. [DOI] [PMC free article] [PubMed] [Google Scholar]
- 46.Langmead B, Salzberg SL. Fast gapped-read alignment with Bowtie 2. Nat Methods. 2012;9:357–359. doi: 10.1038/nmeth.1923. [DOI] [PMC free article] [PubMed] [Google Scholar]
- 47.Li H, et al. The Sequence Alignment/Map format and SAMtools. Bioinformatics. 2009;25:2078–2079. doi: 10.1093/bioinformatics/btp352. [DOI] [PMC free article] [PubMed] [Google Scholar]
- 48.Zhang Y, et al. Model-based analysis of ChIP-Seq (MACS) Genome Biol. 2008;9:R137. doi: 10.1186/gb-2008-9-9-r137. [DOI] [PMC free article] [PubMed] [Google Scholar]
- 49.Quinlan AR, Hall IM. BEDTools: a flexible suite of utilities for comparing genomic features. Bioinformatics. 2010;26:841–842. doi: 10.1093/bioinformatics/btq033. [DOI] [PMC free article] [PubMed] [Google Scholar]
- 50.Imakaev M, et al. Iterative correction of Hi-C data reveals hallmarks of chromosome organization. Nat Methods. 2012;9:999–1003. doi: 10.1038/nmeth.2148. [DOI] [PMC free article] [PubMed] [Google Scholar]
- 51.Servant N, et al. HiC-Pro: an optimized and flexible pipeline for Hi-C data processing. Genome Biol. 2015;16:259. doi: 10.1186/s13059-015-0831-x. [DOI] [PMC free article] [PubMed] [Google Scholar]
- 52.Servant N, et al. HiTC: exploration of high-throughput ‘C’ experiments. Bioinformatics. 2012;28:2843–2844. doi: 10.1093/bioinformatics/bts521. [DOI] [PMC free article] [PubMed] [Google Scholar]
- 53.Phanstiel DH, Boyle AP, Araya CL, Snyder M, Sushi P. R: flexible, quantitative and integrative genomic visualizations for publication-quality multi-panel figures. Bioinformatics. 2014;30:2808–2810. doi: 10.1093/bioinformatics/btu379. [DOI] [PMC free article] [PubMed] [Google Scholar]
- 54.Core LJ, et al. Defining the status of RNA polymerase at promoters. Cell Rep. 2012;2:1025–1035. doi: 10.1016/j.celrep.2012.08.034. [DOI] [PMC free article] [PubMed] [Google Scholar]
Associated Data
This section collects any data citations, data availability statements, or supplementary materials included in this article.
Supplementary Materials
Data Availability Statement
High-throughput data are deposited in Gene Expression Omnibus under accession number GSE82312 for all GRID-seq and GRO-seq experiments. All public data used for comparisons in the current study are listed in Supplementary Table 3, which includes unique accession numbers, web links and a list of associated figure panels where specific comparisons were made.


