

Abstract
Objective
To find and validate generalizable sepsis subtypes using data-driven clustering.
Design
We used advanced informatics techniques to pool data from 14 bacterial sepsis transcriptomic datasets from 8 different countries (N=700).
Setting
Retrospective analysis.
Subjects
Persons admitted to the hospital with bacterial sepsis.
Interventions
None.
Measurements and Main Results
A unified clustering analysis across 14 discovery datasets revealed three subtypes, which, based on functional analysis, we termed Inflammopathic, Adaptive, and Coagulopathic. We then validated these subtypes in 9 independent datasets from 5 different countries (N=600). In both discovery and validation data, the Adaptive subtype is associated with a lower clinical severity and lower mortality rate, and the Coagulopathic subtype is associated with higher mortality and clinical coagulopathy. Further, these clusters are statistically associated with clusters derived by others in independent single sepsis cohorts.
Conclusions
The three sepsis subtypes may represent a unifying framework for understanding the molecular heterogeneity of the sepsis syndrome. Further study could potentially enable a precision-medicine approach of matching novel immunomodulatory therapies with septic patients most likely to benefit.
Keywords: Sepsis, gene expression, cluster analysis, machine learning, precision medicine
Introduction
Sepsis is defined as life-threatening organ dysfunction resulting from a dysregulated immune response to infection (1). Despite its association with nearly half of all in-hospital deaths, there are still no approved therapies specific for sepsis (2, 3). In part, this is because the clinical syndrome of sepsis includes substantial heterogeneity and may in fact encompass many different subtypes, analogous to what is well established among patients with cancer (4, 5). Current sepsis groupings are based on clinical criteria such as the presence of shock, infection source, or organ failure, but such groupings may not represent the driving biology of the host response. They have also failed to adequately match patients for novel interventions. If the heterogeneity of sepsis truly reflects heterogeneity in the host response, characterization of these underlying host response types will be fundamental to enabling precision sepsis therapeutics(6).
In unsupervised analysis, data is sorted into subgroups (‘clusters’) that are defined only internally and without reference to external ‘supervisory’ outcomes, such as mortality or severity. Instead, the structure inherent within the data is used to define the subgroups. Such data-driven analyses have been successful in defining validated, clinically relevant disease subtypes in multiple diseases(4, 5, 7, 8). Since whole-blood gene expression reflects the temporal state of the circulating leukocytes, at least two academic groups have applied unsupervised clustering to whole-blood transcriptomic profiles in patients with sepsis to study the ‘host response’ in a data-driven framework(9–13). Their results have identified higher-mortality subtypes with evidence of immune exhaustion and diminished glucocorticoid receptor signaling, as well as lower-mortality subtypes with conventional pro-inflammatory signaling(9–13).
Clustering analyses often yield non-reproducible results for one of two reasons: either multiple arbitrary choices in methodology are used such that minor changes in analysis yield new results, or the clustered dataset is too small and not representative of the broad heterogeneity of a disease. However, recent advances in meta-clustering and data pooling can help solve both problems(14–16). Coupled with an unprecedented amount of publicly available transcriptomic data in sepsis(17, 18), here we tested the hypothesis that there exist robust, reproducible sepsis host-response subtypes (clusters) across the broad, heterogeneous spectrum of clinical sepsis.
Methods
Systematic search and dataset criteria
We performed a systematic search of GEO and ArrayExpress for gene expression studies of clinical studies in sepsis, as previously described (16). Individual datasets were renormalized as previously described (18). Datasets were only included if they studied whole blood gene expression at hospital or ICU admission (i.e., primary admission for sepsis). Since the host response differs substantially between bacterial and viral infections(15, 19), an unsupervised analysis would likely lead to groupings primarily based on infection type. We thus removed all samples with microbiologically confirmed viral infection unless a microbiologically confirmed bacterial infection was also present (only 3 confirmed co-infections were included). Studies that did not supply sample-level microbiological data but were identified in their manuscript as being drawn from patients with primarily bacterial sepsis were treated as all bacterial. We further removed patients that were sampled more than 48 hours after sepsis diagnosis given the potential impact of treatment on the host response(20, 21). All data used herein were de-identified and publicly available and so exempt from IRB review.
Pooling data with COCONUT to enable clustering
The recent development of the COmbat CO-Normalization Using conTrols method (COCONUT)(15) allows for bias-free correction of batch effects between multiple microarray datasets, enabling pooled analysis, provided that healthy controls are present. The core assumption is that healthy controls across datasets come from the same statistical distribution. This assumption allows for the calculation of correction factors that remove technical differences across pooled datasets without bias to the number or type of diseased samples present.
We split the datasets into ‘discovery’ and ‘validation’ groups based on whether healthy controls were present in the dataset, specifically so that we could use the COCONUT method. Since the inclusion of healthy controls in any given dataset is essentially random, the discovery/validation split was not expected to introduce bias. We used the COCONUT method to co-normalize the discovery datasets into a single pool, and then removed all healthy controls from further analysis.
Clustering the discovery data using COMMUNAL
In order to determine how many clusters were present in the COCONUT-conormalized discovery data, we used the COmbined Mapping of Multiple clUsteriNg ALgorithms (COMMUNAL) method, which integrates data from multiple clustering algorithms and validity metrics across a range of included variables to identify the most robust number of clusters present in the data (see Supplementary Digital Content) (14). We ranked the top 5,000 genes across the discovery datasets using an algorithm that accounts for both within-dataset variance and between-dataset variance (16). We ran COMMUNAL using consensus-clustering versions of two algorithms, K-means clustering and Partitioning Around Medioids (PAM), due to their robustness in large, noisy datasets. Both methods were run across a range of variables from 100 genes up to 5,000 genes (in ranked order). COMMUNAL then integrated these data (at its default parameters) to produce an optimality map of clustering. In the resulting map, the most stable optima were taken as indicating the most robust clustering.
Having chosen an optimal clustering using COMMUNAL, we integrated the sample assignments between clustering algorithms (i.e., the clusters into which the PAM and K-means algorithms assigned samples). The COMMUNAL method assigned all samples for which the clustering algorithms agreed to discovery clusters, and removed all samples for which there was disagreement between the PAM and K-means methods as ‘unclustered’. The hypothesis is that not every sample may be perfectly assigned to a given cluster (e.g., some samples may exhibit biology suggestive of two clusters). Since classifiers trained on data with fewer errors are more robust, removing these uncertain samples improves the classifier accuracy. Note that the classifier built for validation does not produce ‘unclustered’ assignments (see Supplementary Digital Content).
To check whether the discovery clusters appeared to be separated in gene expression space, we visualized them using both heat maps and principal component analyses. We further used pooled sample-level demographic and phenotypic data to investigate clinical differences between discovery clusters.
Biological and clinical investigations
The details of our treatment of complex clinical variables including illness severity, immunosuppression, and coagulopathy are explained in the Supplemental Digital Content. Gene ontology analysis (22), the construction of a cluster classifier (23), and testing of the validation datasets are described in the Supplementary Digital Content.
Jargon-free summary
In recognition of the highly technical nature of the paper, we have prepared a ‘jargon-free summary’ of the methods and results. This is available in the Supplementary Digital Content.
Results
Included studies, COCONUT conormalization, and COMMUNAL cluster selection
We first hypothesized that robust molecular subgroups exist in patients with bacterial sepsis. We thus performed a unified clustering across 14 bacterial sepsis discovery datasets from 8 different countries (N=700, Table 1a) using COCONUT co-normalization (24–37). We identified 9 validation datasets from 5 different countries that matched inclusion criteria but did not include healthy controls (N=600, Table 1b and Figure 1)(12, 38–43). We first co-normalized the 14 discovery datasets into a single pooled cohort using the COCONUT method (15), providing batch-corrected, pooled sepsis data across a wide variety of clinical conditions (Supplemental Figure 1). There were 8,946 genes that were measured in all 14 pooled discovery datasets. The pooled data were then clustered using the COMMUNAL algorithm across 11 test points ranging from the top 100 to 5,000 genes using consensus K-means and consensus PAM clustering (individual clustering algorithm results shown in Supplemental Figure 2) (14). Visual inspection of the COMMUNAL optimality map showed clear, stable optima at K=3 clusters from 500 genes to 5,000 genes (Supplemental Figure 3). Further, we chose the clustering at 500 genes as the optimal clustering assignment under the assumption that using the fewest number of genes had the least amount of noise or redundant signal. Based on gene ontology analysis described below, and to facilitate their easier understanding, we have named the three clusters “Inflammopathic”, “Adaptive”, and “Coagulopathic”.
Table 1.
Datasets included in the study. (A) Datasets with healthy controls were chosen for discovery and (B) datasets without healthy controls were chosen for validation.
| Use | Accession | First author |
Description of patients used here |
Timing of sepsis diagnosis |
Sample Size (N) |
Age | Sex (percent male) |
Severity | Mortality (percent) |
Country |
|---|---|---|---|---|---|---|---|---|---|---|
| A. Discovery | EMEXP3567 | Irwin | Children with meningococcal sepsis +/− HIV co-infection | Admission to ED | 12 | 2.0 (IQR 0.6–6.9) | 55 | unk. | 50 | Malawi |
| EMTAB1548 | Almansa | Adult surgical patients with sepsis (EXPRESS study) | Average post-operation day 4 (hospital acquired) | 82 | 69.7 (std. dev. 13.1) | 67 | APACHE II 17.0 (std. dev. 5.4) | 32 | Spain | |
| GSE11755 | Emonts | Children with meningococcal septic shock | Admission to ICU | 6 | 1.94 | 100 | PRISM 24 | 0 | Netherlands | |
| GSE13015 gpl6106 | Pankla | Adults with sepsis, many from burkholderia | Within 48 hours of diagnosis; both community-acquired and hospital-acquired. | 48 | 54.7 (std. dev. 11.7) | 54 | unk. | 27 | Thailand | |
| GSE13015 gpl6947 | 15 | 47 | ||||||||
| GSE20346 | Parnell | Adults with severe bacterial pneumonia | Admission to ICU | 6 | 63 (range 52–75) | 50 | APACHE II 22 (range 10–33) | 33 | Australia | |
| GSE28750 | Sutherland | Community-acquired sepsis with bacteremia | Admission to ICU | 10 | 60 | 55 | unk | unk | Australia | |
| GSE33341 | Ahn | Adults with 2+ SIRS criteria and bacteremia | Within 24 hours of admission to hospital | 51 | 58 (range 24–91) | 61 | unk. | 4 | USA | |
| GSE40012 | Parnell | Adults in ICU with sepsis | Admission to ICU | 21 | 61 (std. dev. 16) | 40 | APACHE II 21 (std. dev. 6) | 26 | Australia | |
| GSE40586 | Lill | Infants, children, and adults with bacterial meningitis | Within 48 hours of hospital admission | 21 | 43.4 (range 17d – 70y) | unk. | unk. | 10 | Estonia | |
| GSE57065 | Cazalis | Adults with septic shock | Within 48 hours of admission to ICU | 56 | 62 | 68 | SOFA 10.5 (IQR 9–13) | 18 | France | |
| GSE65682 | Scicluna | Adults with community-acquired pneumonia in ICU | Within 24 hours of ICU admission | 101 | 64 | 57 | APACHE IV 81 | 24 | Netherlands | |
| GSE66099 | Wong | Children in ICU with sepsis/septic shock | Admission to ICU | 188 | 3.7 | 58 | PRISM 15.7 | 14 | USA | |
| GSE69528 | Khaenam | Adults with sepsis, many from burkholderia | unknown | 83 | adults | unk | unk | unk | Thailand | |
| B. Validation | EMEXP3850 | Kwan | Children w/meningococcal sepsis | Admission to hospital; sampled at multiple times 0–48 hrs | 24 | 1.3 (range 0.8–2.0) | 40 | PELOD; 29.2 (range 11–61) | 21 | UK |
| EMTAB4421.51 | Davenport | Adults with sepsis (GAinS study) | Within 24 hours of admission to ICU | 178 | 64.2 (std. dev. 15.2 | 55 | APACHE II 18.6 (std. dev. 9.7) | 32 | UK | |
| GSE10474 | Howrylak | Adults in MICU with sepsis +/− ALI | Admission to ICU | 34 | 57 (std. dev. 4.3) | 45 | APACHE II 20.7 (std. dev. 1.6) | 33 | USA | |
| GSE28658 | Khoo | Children with bacteremia | At diagnosis | 6 | 3.6 (std. dev. 2.2) | 33 | unk | unk | Nigeria | |
| GSE32707 | Dolinay | Adults in MICU with sepsis +/− ARDS | Admission to ICU | 48 | 57.1 (std. dev. 14.9) | 53 | APACHE II 26.7 (std. dev. 8.5) | 35 | USA | |
| GSE63042 | Langley | Adults with sepsis (CAPSOD study) | Admission to ED | 104 | 59.1 (std. dev. 18.3) | 59 | APACHE II 16.5 (std. dev. 7.3) | 37 | USA | |
| GSE63990 | Tsalik | Adults with bacterial infection plus 2+ SIRS criteria | Admission to ED | 70 | 49 (range 14–88) | 50 | unk. | 9 | USA | |
| GSE66890 | Kangelaris | Adults in ICU with sepsis +/− ARDS | Admission to ICU | 62 | 63 (std. dev 19) | 56 | APACHE III 100 (std. dev. 35) | 25 | USA | |
| GSE74224 | McHugh | Community-acquired sepsis with bacteremia | Within 24 hours of ICU admission | 74 | 62.5 | 55 | unk | unk | Australia & Netherlands |
Figure 1.

Overall study schematic.
To visualize their general separability, we performed principal components analysis on the discovery clusters using all genes both with and without the ‘unclustered’ sample (Figure 2). Details on the assignment of clusters in the Discovery datasets are available in the Supplemental Results, Supplemental Tables 1–2, and Supplemental Figures 4–5.
Figure 2.
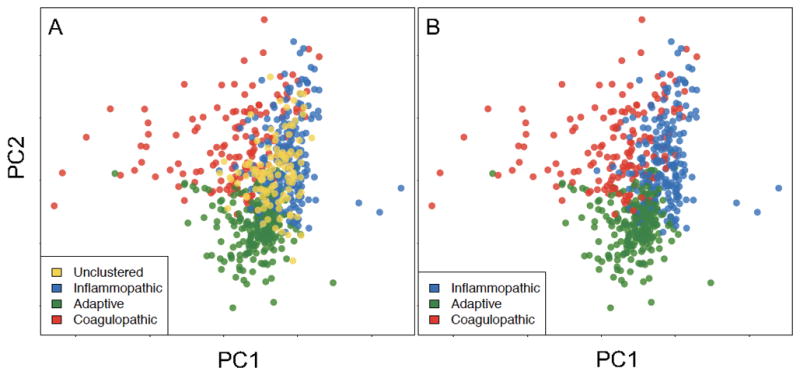
The first two principal components (PCs) of the discovery clustering results (both with (A) and without (B) the 16% of samples that went unclustered in the final analysis, in gold) using all 8,946 genes present in the COCONUT conormalized data. Here we show that the cluster assignments that we recovered in an unsupervised manner are clearly separated in high-dimensional space, as demonstrated by the first two principal components.
Gene ontology across the different clusters
To better understand the biology represented by the clusters, we used gene ontology over-representation analysis. We assigned each of the 500 genes to one of the three discovery clusters based on absolute effect size (i.e., each gene was assigned to the cluster in which it was most different from the remaining two clusters). We then tested each of the resulting three gene lists for significance in gene ontology (GO) terms (Supplemental Table 3). The Inflammopathic cluster was significant for canonical pro-inflammatory signaling pathways such as IL-1 receptor, pattern recognition receptor activity, and complement activation. The Adaptive cluster was significant for several pathways related to adaptive immunity and interferon signaling. The third cluster was named Coagulopathic as it was significant for terms related to clotting and coagulation, such as platelet degranulation, glycosaminoglycan binding, and coagulation cascade.
Clinical findings across the different clusters
We investigated the differences between the discovery clusters in the demographic and clinical variables for which we had subject-level data (Table 2). We found significant differences in age (both the overall distribution, and the percent of patients >70 years of age), severity (as measured by percent of patients with clinical severity scores above the dataset mean, and/or in septic shock), and 30-day mortality. We also found that the Inflammopathic cohort had greater bandemia and a lower lymphocyte percentage on white blood cell differential; however, differential was only available in a single cohort. This suggests that the Adaptive cluster is comprised of less sick patients with fewer elderly patients, while the Inflammopathic and Coagulopathic clusters separate the sicker patients into a younger and an older group. Addition of the ‘unclustered’ patients showed they have a balanced phenotype with respect to age and shock; their addition did not substantially change the demographic or clinical findings (Supplemental Table 4). Since the unsupervised clustering did not take into account any clinical data whatsoever, finding a significant difference in mortality suggests that the clusters may represent distinct pathophysiological states of clinical relevance.
Table 2.
Demographic and clinical variables across discovery clusters. Not all variables were available for all samples, so the totals are not always consistent; N for each measured variable is included as a separate column. Statistics were calculated by pooling data among cohorts.
| Variable | Inflammopathic | Adaptive | Coagulopathic | P value (chisq/ANOVA) | Total N used |
|---|---|---|---|---|---|
| Total Samples Assigned | 175 | 219 | 108 | ||
| Male (percent) | 58.4 | 59.4 | 61.5 | 0.864 | 481 |
| Age (years, +/− sd) | 34.8 (32.1) | 38.5 (28.7) | 49.7 (29.4) | 0.0001 | 452 |
| Age < 18 (percent) | 16.8 | 17.6 | 15.9 | 0.930 | |
| Age > 70 (percent) | 27.7 | 20.0 | 36.4 | 0.007 | |
| WBC count (+/− sd) | 18.02 (16.18) | 13.83 (10.64) | 12.87 (13.3) | 0.176 | 133 |
| Neutrophils (+/− sd) | 59.67 (18.31) | 61.14 (16.42) | 58.15 (23.1) | 0.843 | 107 |
| Bands (+/− sd) | 17.04 (12.77) | 11.58 (11.57) | 6.75 (6.13) | 0.002 | 107 |
| Lymphocytes (+/− sd) | 15.89 (13.8) | 20.17 (12.71) | 27.05 (23.16) | 0.024 | 107 |
| Monocytes (+/− sd) | 6.07 (4.33) | 6.19 (3.82) | 6.6 (6.66) | 0.91 | 107 |
| Immunosuppressed (percent) | 5.80 | 8.90 | 11.50 | 0.62 | 140 |
| Gram negative (percent) | 46.2 | 48.4 | 51.4 | 0.860 | 285 |
| Shock (percent) | 73.0 | 32.2 | 62.2 | 4.58E-10 | 297 |
| High Clinical Severity (percent) | 50.8 | 32.4 | 56.3 | 0.002 | 313 |
| Non-survivor (percent) | 29.8 | 8.1 | 25.4 | 8.01E-06 | 355 |
We ran regression models on cluster membership (in a ‘1-vs-all’ format) to assess the joint ability of age, shock, severity, and their interaction to predict cluster membership. In each case, the percent of variance explained by age, shock and severity was 9.7%, 6.4%, and 0.7% for the Inflammopathic, Adaptive, and Coagulopathic groups, respectively, in discovery (total N=251, Supplemental Table 5). A sensitivity analysis showed that these results could only be explained away by an unmeasured confounding variable with a substantially greater effect size than the included variables (Supplemental Table 5). Thus, while age, shock, and severity are significantly different across the groups, cluster assignment is much more complex than these three factors alone.
Validation of cluster classifier in independent datasets
Having characterized the sepsis clusters in the discovery datasets, we next hypothesized that these same clusters could be recovered in independent validation datasets using a discrete classifier. We next built a gene-expression-based classifier for cluster assignment so that the cluster hypothesis could be tested and applied in external validation datasets. Briefly, the classifier assigns each sample three scores (one for each cluster type) and then applies multiclass regression to output a final cluster assignment (Supplemental Table 6A–B). The classifier used a total of 33 genes, and yielded an overall 83% accuracy in leave-one-out re-assignment of the samples on which it was trained (Supplemental Table 6C). The greatest classifier inaccuracy is in distinguishing Inflammopathic patients from Coagulopathic patients (Supplemental Figure 6). We applied the classifier to the 9 bacterial sepsis validation datasets (Supplemental Table 7)(12, 38–44), and judged the classifier’s accuracy by its ability to recover clusters with similar molecular and clinical phenotypes to the discovery clusters. Since the 9 validation datasets are independent from one another, we examined the same demographic and clinical variables as in the discovery clusters in both a pooled fashion (Table 3) and treating each dataset independently (Supplemental Table 8). As the individual datasets may be underpowered to detect differences, we ran statistical tests in the pooled data; compared to the discovery clusters, we observed the same patterns of significance. The Coagulopathic cluster had significantly more patients older than 70 years (P<0.05), whereas the Adaptive cluster had fewer patients with shock (P<0.01), fewer patients with high clinical severity (P<0.05) and a lower mortality (P=0.01).
Table 3.
Demographic and clinical variables across validation clusters. Not all variables were available for all samples, so the totals are not always consistent. N for each measured variable is included as a separate row. Statistics are shown both by aggregating cohort-level statistics, and by pooling data among cohorts.
| Variable | Inflammopathic | Adaptive | Coagulopathic | P value (chisq/ANOVA) | Total N used | Number of Datasets |
|---|---|---|---|---|---|---|
| Total Samples Assigned | 208 | 264 | 128 | 600 | 9 | |
| Male (pooled percent) | 51.7 | 62.5 | 60.0 | 0.08153 | 519 | 7 |
| Age (pooled mean, sd) | 57.9 (20.9) | 57.3 (19.7) | 60.9 (23.1) | 0.3210 | 520 | 7 |
| Age > 70 Y (pooled percent) | 32.2 | 28.0 | 43.5 | 0.016 | 520 | 7 |
| WBC count (+/− sd) | 18.48 (11.12) | 16.94 (21.61) | 14.57 (7.79) | 0.67 | 104 | 1 |
| Neutrophils (+/− sd) | 81.27 (17.33) | 76.8 (17.51) | 84.19 (11.72) | 0.22 | 93 | 1 |
| Bands (+/− sd) | 12.82 (17.81) | 2.5 (6.62) | 5.83 (9.07) | 0.035 | 51 | 1 |
| Lymphocytes (+/− sd) | 6.96 (4.76) | 11.84 (8.46) | 5.95 (4.94) | 0.001 | 93 | 1 |
| Monocytes (+/− sd) | 4.24 (2.82) | 6.85 (4.44) | 5.03 (3.19) | 0.01 | 93 | 1 |
| Immunosuppressed (percent) | 2.9 | 6.4 | 13 | 0.32 | 104 | 1 |
| Gram negative (pooled percent) | 66.7 | 78.3 | 61.1 | 0.468 | 68 | 3 |
| Shock (pooled percent) | 69.8 | 36.7 | 45.5 | 0.0036 | 136 | 2 |
| High Clinical Severity (pooled percent) | 45.5 | 31.8 | 39.6 | 0.030 | 450 | 6 |
| Non-survivor (pooled percent) | 29.3 | 18.5 | 31.1 | 0.01095 | 514 | 7 |
The Coagulopathic cluster also was associated with clinical coagulopathy, including disseminated intravascular coagulation (P<0.05, Table 4, Supplemental Tables 9–10 and Supplemental Results).
Molecular similarity between clusters identified in discovery and validation
Since the validation clusters were assigned with information from only 33 genes, we investigated whether similar biology was present in the full gene expression profiles across discovery and validation clusters. First, we calculated the mean gene expression profiles for all 500 clustering genes, and tested for correlation between the clusters. Significant correlation would indicate that the classifier was capturing most of the information from the original clustering; the 33 genes used in the classifier were thus excluded from this analysis to avoid bias. Pearson correlations in mean gene expression profiles within the assigned clusters were high (Inflammopathic cluster, 0.59±0.18; Adaptive cluster, 0.67±0.19; Coagulopathic cluster, 0.20±0.21, Figure 3A). These correlations were significant (P<0.01) between the discovery and validation clusters for all datasets for Inflammopathic, all datasets for Adaptive, and five out of nine datasets for Coagulopathic. As a comparison, 1000 random samples of 500 genes yielded mean correlations of 0.01 – 0.02.
Figure 3.

(A) Correlations of average 500-gene expression vectors between clusters assigned in the discovery and validation datasets; correlation coefficient is shown by color (legend at figure right). Notably, samples from Inflammopathic clusters are positively correlated with Inflammopathic samples from other datasets, and negatively correlated with Adaptive samples from other datasets (and vice-versa). The Coagulopathic clusters show less cohesion but are positively correlated with one another. (B) Heatmap of Gene Ontology (GO) codes found to be overrepresented in the different clusters, colored by significance levels. In both (A) and (B), the pooled ‘Core’ discovery datasets are represented by a single column for each cluster, while each cluster in each validation dataset is represented by a separate column. Both sub-figures show a block structure indicative of molecular similarity across datasets between clusters of the same type.
We next tested whether the same Gene Ontology (GO) codes were overrepresented between validation clusters, as compared to the discovery clusters (Figure 3B). On average, 68%, 87%, and 61% of the codes found significant at p<0.01 in the discovery clusters (Inflammopathic, Adaptive, and Coagulopathic, respectively) were identified as significant at p<0.05 in the same clusters in validation. In addition, a block structure is seen within clusters of the same type, indicating generally shared pathway enrichment within cluster types.
Comparison to previously established sepsis endotypes
Two groups have previously performed clustering using sepsis transcriptomic profiles. Wong et al. (9–11) and Davenport et al. (12, 13). We compared our cluster assignments to the previously published assignments and showed significant overlaps with the Inflammopathic and Adaptive clusters (Supplemental Results and Supplemental Table 10).
Discussion
We here performed an unsupervised clustering analysis on pooled transcriptomic profiles (N=700) from 14 datasets from a broad range of subjects with bacterial sepsis, demonstrating that there are three robust sepsis clusters (or ‘endotypes’). We have named these clusters Inflammopathic (higher mortality, innate immune activation), Adaptive (lower mortality, adaptive immune activation), and Coagulopathic (higher mortality, older, and with clinical and molecular evidence of coagulopathy), based on their molecular and clinical profiles. Next, we showed that a 33-gene classifier that assigns subjects to these three clusters is able to recover the clinical and molecular phenotypes in 9 independent validation datasets (N=600). Finally, we showed that these clusters can significantly explain the clusters derived by independent groups using different methods (9, 12). Taken together, these results demonstrate that the host response in the sepsis syndrome can be broadly defined by these three robust clusters.
Notably, each of the validation datasets had separate inclusion/exclusion criteria, providing a sort of sensitivity analysis that the identified clusters appear in both pooled settings (as in discovery) but also in more uniform, carefully phenotyped cohorts. For instance, we pooled samples from pediatric and adult datasets in discovery, but our methods did not simply cluster patients by age; then in validation, two datasets were pediatric and seven were adult, but all datasets contained a mix of all three sepsis clusters. The fact that we redemonstrate the same broad phenotypic and molecular differences in these independent applications of the cluster classifier is strong evidence that cluster membership is present across populations.
Despite the outcome differences across our three clusters, their clinical utility is not merely the ability to risk-stratify in terms of mortality. Mortality prediction is better achieved through purpose-built classifiers, which have been demonstrated with these same data(18). Instead, the hypothesis that underlies the search for sepsis clusters is that ‘sepsis’ represents multiple different disease states and manifests in many different ways(3, 6, 45). The aim of our study was thus to uncover these subclinical clusters using a very large pool of sepsis patients across a wide range of clinical conditions. Uncovering and defining this heterogeneity may allow for greater success in the discovery and validation of therapies that are beneficial only to one sepsis cluster, but may be neutral or even harmful to other clusters(11). For instance, both the molecular and clinical data suggest that the Coagulopathic cluster may be associated with functional coagulopathy. Given the association of sepsis with clinical coagulopathies, and despite (or perhaps because of) the failure of most therapeutic interventions for coagulopathy in sepsis (3, 46, 47), further study of the Coagulopathic cluster is warranted. Similarly, drugs being tested in sepsis that are known to modulate the innate or adapative immune systems (such as anti-IL-1 or anti-PD-L1 treatments (48, 49)) may potentially find efficacy in the Inflammopathic or Adaptive clusters, respectively.
We inferred pathobiology for the clusters by assigning each gene to the cluster in which it showed the greatest differential change from the other clusters. For instance, the association of innate immune pathways in the Inflammopathic cluster is indicative not of ‘normal’ innate immune activation, but rather of overactivation of the innate immune system, or of a relative lack of activation of adaptive immune genes, in Inflammopathic patients as compared to other septic patients. Similarly, the relatively higher adaptive immune gene activation in the Adaptive cluster may be linked to its lower mortality. Seen through this lens, the three sepsis clusters show biological insights that, to some degree, reflect clinical intuitions. The early overactivation of the innate immune system or coagulation cascade in sepsis is linked to higher mortality, while the relative lack of these changes and the expansion of the adaptive immune response may be linked to better outcome(50). Furthermore, since genes were selected based on absolute effect size, similarity in gene ontology pathway analysis between Inflammopathic and Adaptive clusters could be reflective of opposite modulation of similar pathways; this is further suggested by the strong inverse correlation between the Inflammopathic and Adaptive clusters in Figure 2. As above, these biological insights might allow for hypotheses about guided treatments for different subtypes. Still, we only included subjects at admission for sepsis; whether and how these profiles might change depending on time since initial infection onset, longitudinally during treatment, or whether patients might move between subtypes over time, is unknown.
Two independent research groups have identified sepsis subgroups similar to those described here: one focused on pediatric sepsis in a US-based cohort (9, 10); the other focused on adult sepsis in UK-based cohorts (12, 13). Notably, the two subgroupings do not broadly overlap. Comparison of our three clusters with the prior clusterings yielded several interesting findings. First, using subject-level comparisons, patients assigned to the Inflammopathic cluster were mostly assigned to Endotype B (11) or SRS 1 (12). However, Endotype B conferred a lower mortality in children compared to Endotype A, while SRS 1 conferred a higher mortality in adults compared to SRS2. Still, we are reassured that these independent studies identified the same grouping of patients using completely separate techniques. Similarly, patients assigned to the Adaptive cluster were primarily assigned to SRS 2; both studies identified this as a low mortality group associated with interferon signaling. We also identified a third (Coagulopathic) cluster. It is possible that the substantially larger sample size and greater heterogeneity of our discovery cohorts compared to prior work allowed us to detect this third Coagulopathic cluster.
Our study has some limitations. First, we provided validation only in historical independent datasets, not in a prospectively collected cohort. This limited us to only non-targeted gene expression profiling (microarrays and RNAseq). Second, we examined only datasets of patients with bacterial sepsis at admission, because the clustering algorithms may otherwise have been overwhelmed by the differing host responses to different types of infections (15, 19). The coming availability of rapid host-response diagnostics to distinguish between bacterial and viral infections (15, 40, 51) suggests that the cluster classifier could be applied to patients after diagnosis with bacterial infections. However, it is unknown whether these subtypes exist in patients with viral or fungal sepsis, or in non-infected critically ill patients. Third, one of the validation datasets (GSE74224) re-used 21 samples (20% of its total) from one of the discovery datasets (GSE28750), although they were re-profiled using a different technology (29, 42). Exactly which samples are duplicates are unknown, so they could not be removed; however, this makes up less than 4% of the total validation samples, suggesting that results are unlikely to be affected. Finally, we have presented analyses for all clinical variables that were available in more than one study at the sample level. This led to the inclusion of some analyses that were individually underpowered. In addition, variables may not be missing at random; it is thus possible that missingness biases the outcome (for instance, by not reporting mortality in less-severe cohorts). The various weaknesses make clear that a prospective clinical study of the clusters will be necessary to confirm and extend our results.
Overall, we used state-of-the-art methods in bioinformatics and data analysis to create the largest known unbiased pool of sepsis transcriptomic profiles, and to then show that three robust, distinguishable clusters exist across the sepsis spectrum. These sepsis clusters could feature prominently in the clinical trials domain, where they may serve as an enrichment tool or a companion diagnostic. The confirmation that multiple subtypes exist within the host response will hopefully enable more research into a precision medicine approach for sepsis.
Supplementary Material
Acknowledgments
Sources of funding: PK is supported by grants from the Bill and Melinda Gates Foundation, and the National Institute for Allergy and Infectious Diseases (grants 1U19AI109662, U19AI057229 and U54I117925).
JFBM, RA, and ET were supported by Instituto de Salud Carlos III (grants EMER07/050, PI13/02110, PI16/01156).
HRW was supported by National Institute of General Medical Sciences grants R01GM099773 and R01GM108025.
RJL was supported by the National Center for Advancing Translational Sciences of the National Institutes of Health (NIH) under award number UL1TR001417. The CAPSOD study was supported by NIH grants U01AI066569, P20RR016480, HHSN266200400064C.
This work was supported by Defense Advanced Research Projects Agency and the Army Research Office through Grant W911NF-15-1-0107.
We thank Dr. Katie Planey for helpful discussion on meta-clustering. We would like to thank the authors who contributed gene expression data to the public domain that we re-analyzed here. The views expressed are those of the authors and do not reflect the official policy or position of the Department of Veterans Affairs, the Department of Defense, or the U.S. Government.
Footnotes
Author contributions: Study conception and design: TES, PK; Contributed materials: JFBM, RA, ET, JAH, AC, GPP, BT, MN, CWW, GSG, SFK, HRW, ELT, RJL; Contributed methods: TES, TDA, MD, WAH, TMP, RH, LO, LMM, HRW, PK; Performed the analyses: TES; Drafted manuscript: TES; Critical revision: all authors.
Conflicts of interest: The 33-gene set has been disclosed to the Stanford Office of Technology Licensing for possible patent protection. TES and PK are co-founders of Inflammatix, Inc., which has a commercial interest in sepsis diagnostics. Inflammatix played no role in this study. The other authors declare no relevant financial conflicts of interest.
Copyright form disclosure: Drs. Sweeney, Donato, Nichols, Howrylak, Choi, Kingsmore, Wong, Langley, and Khatri received support for article research from the National Institutes of Health (NIH). Drs. Sweeney, Nichols, and Khatri received support from the Bill & Melinda Gates Foundation. Dr. Sweeney and Dr. Khatri are co-founders of Inflammatix, Inc., which has a commercial interest in sepsis diagnostics, but played no role in this study. Drs. Donato and Wongs’ institutions received funding from the NIH. Drs. Perumal, Mangravite, and Langley received support for article research from DARPA. Dr. Henao received funding from OncocellMDx and InfiniaML. Dr. Nichols also received support for article research from the Defense Advanced Research Projects Agency Army Research Office. Dr. Howrylak also received support for article research from the National Center for Advancing Translational Sciences (NCATS) (UL1 TR000127 and KL2 TR000126). Dr. Ginsburg received other support as a founder of Host Response, Inc. Drs. Omberg and Mangravite’s institutions received funding from DARPA. Dr. Tsalik’s institution received funding from Novartis Vaccines and Diagnostics, Inc, and he disclosed other support (unrelated to this work) from grants from the NIH, DARPA, DTRA, and the Henry M. Jackson Foundation; research support from bioMerieux and BioFire Diagnostics; consulting for Immunexpress, and bioMerieux; employment by Duke University and the Durham VA Health Care System; patents (or patents pending) for the Molecular Classification of Bacterial Infection, and Methods to Diagnose and Treat Acute Respiratory Infections; and equity in Host Response, Inc. Dr. Khatri’s institution received funding from the NIH and the Bill & Melinda Gates Foundation, and he received funding from Inflammatrix. The remaining authors have disclosed that they do not have any potential conflicts of interest.
References
- 1.Singer M, Deutschman CS, Seymour CW, et al. The Third International Consensus Definitions for Sepsis and Septic Shock (Sepsis-3) JAMA. 2016;315(8):801–810. doi: 10.1001/jama.2016.0287. [DOI] [PMC free article] [PubMed] [Google Scholar]
- 2.Liu V, Escobar GJ, Greene JD, et al. Hospital Deaths in Patients With Sepsis From 2 Independent Cohorts. JAMA. 2014 doi: 10.1001/jama.2014.5804. [DOI] [PubMed] [Google Scholar]
- 3.Opal SM, Dellinger RP, Vincent JL, et al. The next generation of sepsis clinical trial designs: what is next after the demise of recombinant human activated protein C?*. Crit Care Med. 2014;42(7):1714–1721. doi: 10.1097/CCM.0000000000000325. [DOI] [PMC free article] [PubMed] [Google Scholar]
- 4.van ‘t Veer LJ, Dai H, van de Vijver MJ, et al. Gene expression profiling predicts clinical outcome of breast cancer. Nature. 2002;415(6871):530–536. doi: 10.1038/415530a. [DOI] [PubMed] [Google Scholar]
- 5.Golub TR, Slonim DK, Tamayo P, et al. Molecular classification of cancer: class discovery and class prediction by gene expression monitoring. Science. 1999;286(5439):531–537. doi: 10.1126/science.286.5439.531. [DOI] [PubMed] [Google Scholar]
- 6.Prescott HC, Calfee CS, Thompson BT, et al. Toward Smarter Lumping and Smarter Splitting: Rethinking Strategies for Sepsis and Acute Respiratory Distress Syndrome Clinical Trial Design. Am J Respir Crit Care Med. 2016;194(2):147–155. doi: 10.1164/rccm.201512-2544CP. [DOI] [PMC free article] [PubMed] [Google Scholar]
- 7.Haldar P, Pavord ID, Shaw DE, et al. Cluster analysis and clinical asthma phenotypes. Am J Respir Crit Care Med. 2008;178(3):218–224. doi: 10.1164/rccm.200711-1754OC. [DOI] [PMC free article] [PubMed] [Google Scholar]
- 8.Famous KR, Delucchi K, Ware LB, et al. Acute Respiratory Distress Syndrome Subphenotypes Respond Differently to Randomized Fluid Management Strategy. Am J Respir Crit Care Med. 2017;195(3):331–338. doi: 10.1164/rccm.201603-0645OC. [DOI] [PMC free article] [PubMed] [Google Scholar]
- 9.Wong HR, Cvijanovich N, Lin R, et al. Identification of pediatric septic shock subclasses based on genome-wide expression profiling. BMC Med. 2009;7:34. doi: 10.1186/1741-7015-7-34. [DOI] [PMC free article] [PubMed] [Google Scholar]
- 10.Wong HR, Cvijanovich NZ, Allen GL, et al. Validation of a gene expression-based subclassification strategy for pediatric septic shock. Crit Care Med. 2011;39(11):2511–2517. doi: 10.1097/CCM.0b013e3182257675. [DOI] [PMC free article] [PubMed] [Google Scholar]
- 11.Wong HR, Cvijanovich NZ, Anas N, et al. Developing a clinically feasible personalized medicine approach to pediatric septic shock. Am J Respir Crit Care Med. 2015;191(3):309–315. doi: 10.1164/rccm.201410-1864OC. [DOI] [PMC free article] [PubMed] [Google Scholar]
- 12.Davenport EE, Burnham KL, Radhakrishnan J, et al. Genomic landscape of the individual host response and outcomes in sepsis: a prospective cohort study. Lancet Respir Med. 2016 doi: 10.1016/S2213-2600(16)00046-1. [DOI] [PMC free article] [PubMed] [Google Scholar]
- 13.Burnham KL, Davenport EE, Radhakrishnan J, et al. Shared and Distinct Aspects of the Sepsis Transcriptomic Response to Fecal Peritonitis and Pneumonia. Am J Respir Crit Care Med. 2016 doi: 10.1164/rccm.201608-1685OC. [DOI] [PMC free article] [PubMed] [Google Scholar]
- 14.Sweeney TE, Chen AC, Gevaert O. Combined Mapping of Multiple clUsteriNg ALgorithms (COMMUNAL): A Robust Method for Selection of Cluster Number, K. Sci Rep. 2015;5:16971. doi: 10.1038/srep16971. [DOI] [PMC free article] [PubMed] [Google Scholar]
- 15.Sweeney TE, Wong HR, Khatri P. Robust classification of bacterial and viral infections via integrated host gene expression diagnostics. Sci Transl Med. 2016;8(346):346ra391. doi: 10.1126/scitranslmed.aaf7165. [DOI] [PMC free article] [PubMed] [Google Scholar]
- 16.Planey CR, Gevaert O. CoINcIDE: A framework for discovery of patient subtypes across multiple datasets. Genome Med. 2016;8(1):27. doi: 10.1186/s13073-016-0281-4. [DOI] [PMC free article] [PubMed] [Google Scholar]
- 17.Sweeney TE, Khatri P. Benchmarking Sepsis Gene Expression Diagnostics Using Public Data. Crit Care Med. 2016 doi: 10.1097/CCM.0000000000002021. [DOI] [PMC free article] [PubMed] [Google Scholar]
- 18.Sweeney TE, Perumal TM, Henao R, et al. Mortality prediction in sepsis via gene expression analysis: a community approach. [Accepted, 2018];Nature Communications. doi: 10.1038/s41467-018-03078-2. [DOI] [PMC free article] [PubMed] [Google Scholar]
- 19.Andres-Terre M, McGuire HM, Pouliot Y, et al. Integrated, Multi-cohort Analysis Identifies Conserved Transcriptional Signatures across Multiple Respiratory Viruses. Immunity. 2015;43(6):1199–1211. doi: 10.1016/j.immuni.2015.11.003. [DOI] [PMC free article] [PubMed] [Google Scholar]
- 20.Sweeney TE, Shidham A, Wong HR, et al. A comprehensive time-course-based multicohort analysis of sepsis and sterile inflammation reveals a robust diagnostic gene set. Sci Transl Med. 2015;7(287):287ra271. doi: 10.1126/scitranslmed.aaa5993. [DOI] [PMC free article] [PubMed] [Google Scholar]
- 21.Seok J, Warren HS, Cuenca AG, et al. Genomic responses in mouse models poorly mimic human inflammatory diseases. Proc Natl Acad Sci U S A. 2013;110(9):3507–3512. doi: 10.1073/pnas.1222878110. [DOI] [PMC free article] [PubMed] [Google Scholar]
- 22.Chen J, Bardes EE, Aronow BJ, et al. ToppGene Suite for gene list enrichment analysis and candidate gene prioritization. Nucleic Acids Res. 2009;37(Web Server issue):W305–311. doi: 10.1093/nar/gkp427. [DOI] [PMC free article] [PubMed] [Google Scholar]
- 23.Tusher VG, Tibshirani R, Chu G. Significance analysis of microarrays applied to the ionizing radiation response. Proc Natl Acad Sci U S A. 2001;98(9):5116–5121. doi: 10.1073/pnas.091062498. [DOI] [PMC free article] [PubMed] [Google Scholar]
- 24.Irwin AD, Marriage F, Mankhambo LA, et al. Novel biomarker combination improves the diagnosis of serious bacterial infections in Malawian children. BMC Med Genomics. 2012;5:13. doi: 10.1186/1755-8794-5-13. [DOI] [PMC free article] [PubMed] [Google Scholar]
- 25.Almansa R, Heredia-Rodríguez M, Gomez-Sanchez E, et al. Transcriptomic correlates of organ failure extent in sepsis. J Infect. 2015;70(5):445–456. doi: 10.1016/j.jinf.2014.12.010. [DOI] [PubMed] [Google Scholar]
- 26.Emonts M. PhD thesis. Erasmus University; Rotterdam: 2008. Polymorphisms in Immune Response Genes in Infectious Diseases and Autoimmune Diseases [Polymorphisms in Immune Response Genes in Infectious Diseases and Autoimmune Diseases] [Google Scholar]
- 27.Pankla R, Buddhisa S, Berry M, et al. Genomic transcriptional profiling identifies a candidate blood biomarker signature for the diagnosis of septicemic melioidosis. Genome Biol. 2009;10(11):R127. doi: 10.1186/gb-2009-10-11-r127. [DOI] [PMC free article] [PubMed] [Google Scholar]
- 28.Parnell GP, McLean AS, Booth DR, et al. A distinct influenza infection signature in the blood transcriptome of patients with severe community-acquired pneumonia. Crit Care. 2012;16(4):R157. doi: 10.1186/cc11477. [DOI] [PMC free article] [PubMed] [Google Scholar]
- 29.Sutherland A, Thomas M, Brandon RA, et al. Development and validation of a novel molecular biomarker diagnostic test for the early detection of sepsis. Crit Care. 2011;15(3):R149. doi: 10.1186/cc10274. [DOI] [PMC free article] [PubMed] [Google Scholar]
- 30.Ahn SH, Tsalik EL, Cyr DD, et al. Gene expression-based classifiers identify Staphylococcus aureus infection in mice and humans. PLoS One. 2013;8(1):e48979. doi: 10.1371/journal.pone.0048979. [DOI] [PMC free article] [PubMed] [Google Scholar]
- 31.Parnell GP, Tang BM, Nalos M, et al. Identifying key regulatory genes in the whole blood of septic patients to monitor underlying immune dysfunctions. Shock. 2013;40(3):166–174. doi: 10.1097/SHK.0b013e31829ee604. [DOI] [PubMed] [Google Scholar]
- 32.Lill M, Kõks S, Soomets U, et al. Peripheral blood RNA gene expression profiling in patients with bacterial meningitis. Front Neurosci. 2013;7:33. doi: 10.3389/fnins.2013.00033. [DOI] [PMC free article] [PubMed] [Google Scholar]
- 33.Cazalis MA, Lepape A, Venet F, et al. Early and dynamic changes in gene expression in septic shock patients: a genome-wide approach. Intensive Care Med Exp. 2014;2(1):20. doi: 10.1186/s40635-014-0020-3. [DOI] [PMC free article] [PubMed] [Google Scholar]
- 34.Scicluna BP, Klein Klouwenberg PM, van Vught LA, et al. A molecular biomarker to diagnose community-acquired pneumonia on intensive care unit admission. Am J Respir Crit Care Med. 2015;192(7):826–835. doi: 10.1164/rccm.201502-0355OC. [DOI] [PubMed] [Google Scholar]
- 35.Wong HR, Shanley TP, Sakthivel B, et al. Genome-level expression profiles in pediatric septic shock indicate a role for altered zinc homeostasis in poor outcome. Physiol Genomics. 2007;30(2):146–155. doi: 10.1152/physiolgenomics.00024.2007. [DOI] [PMC free article] [PubMed] [Google Scholar]
- 36.Wong HR, Cvijanovich N, Allen GL, et al. Genomic expression profiling across the pediatric systemic inflammatory response syndrome, sepsis, and septic shock spectrum. Crit Care Med. 2009;37(5):1558–1566. doi: 10.1097/CCM.0b013e31819fcc08. [DOI] [PMC free article] [PubMed] [Google Scholar]
- 37.Kwan A, Hubank M, Rashid A, et al. Transcriptional instability during evolving sepsis may limit biomarker based risk stratification. PLoS One. 2013;8(3):e60501. doi: 10.1371/journal.pone.0060501. [DOI] [PMC free article] [PubMed] [Google Scholar]
- 38.Howrylak JA, Dolinay T, Lucht L, et al. Discovery of the gene signature for acute lung injury in patients with sepsis. Physiol Genomics. 2009;37(2):133–139. doi: 10.1152/physiolgenomics.90275.2008. [DOI] [PMC free article] [PubMed] [Google Scholar]
- 39.Dolinay T, Kim YS, Howrylak J, et al. Inflammasome-regulated cytokines are critical mediators of acute lung injury. Am J Respir Crit Care Med. 2012;185(11):1225–1234. doi: 10.1164/rccm.201201-0003OC. [DOI] [PMC free article] [PubMed] [Google Scholar]
- 40.Tsalik EL, Henao R, Nichols M, et al. Host gene expression classifiers diagnose acute respiratory illness etiology. Sci Transl Med. 2016;8(322):322ra311. doi: 10.1126/scitranslmed.aad6873. [DOI] [PMC free article] [PubMed] [Google Scholar]
- 41.Kangelaris KN, Prakash A, Liu KD, et al. Increased expression of neutrophil-related genes in patients with early sepsis-induced ARDS. Am J Physiol Lung Cell Mol Physiol. 2015;308(11):L1102–1113. doi: 10.1152/ajplung.00380.2014. [DOI] [PMC free article] [PubMed] [Google Scholar]
- 42.McHugh L, Seldon TA, Brandon RA, et al. A Molecular Host Response Assay to Discriminate Between Sepsis and Infection-Negative Systemic Inflammation in Critically Ill Patients: Discovery and Validation in Independent Cohorts. PLoS Med. 2015;12(12):e1001916. doi: 10.1371/journal.pmed.1001916. [DOI] [PMC free article] [PubMed] [Google Scholar]
- 43.Khoo SK, Petillo D, Parida M, et al. Host response transcriptional profiling reveals extracellular components and ABC (ATP-binding cassette) transporters gene enrichment in typhoid fever-infected Nigerian children. BMC Infect Dis. 2011;11:241. doi: 10.1186/1471-2334-11-241. [DOI] [PMC free article] [PubMed] [Google Scholar]
- 44.Langley RJ, Tsalik EL, van Velkinburgh JC, et al. An integrated clinico-metabolomic model improves prediction of death in sepsis. Sci Transl Med. 2013;5(195):195ra195. doi: 10.1126/scitranslmed.3005893. [DOI] [PMC free article] [PubMed] [Google Scholar]
- 45.Cohen J, Vincent JL, Adhikari NK, et al. Sepsis: a roadmap for future research. Lancet Infect Dis. 2015;15(5):581–614. doi: 10.1016/S1473-3099(15)70112-X. [DOI] [PubMed] [Google Scholar]
- 46.Bernard GR, Vincent JL, Laterre PF, et al. Efficacy and safety of recombinant human activated protein C for severe sepsis. N Engl J Med. 2001;344(10):699–709. doi: 10.1056/NEJM200103083441001. [DOI] [PubMed] [Google Scholar]
- 47.Allingstrup M, Wetterslev J, Ravn FB, et al. Antithrombin III for critically ill patients: a systematic review with meta-analysis and trial sequential analysis. Intensive Care Med. 2016;42(4):505–520. doi: 10.1007/s00134-016-4225-7. [DOI] [PMC free article] [PubMed] [Google Scholar]
- 48.Shakoory B, Carcillo JA, Chatham WW, et al. Interleukin-1 Receptor Blockade Is Associated With Reduced Mortality in Sepsis Patients With Features of Macrophage Activation Syndrome: Reanalysis of a Prior Phase III Trial. Crit Care Med. 2016;44(2):275–281. doi: 10.1097/CCM.0000000000001402. [DOI] [PMC free article] [PubMed] [Google Scholar]
- 49.Shindo Y, McDonough JS, Chang KC, et al. Anti-PD-L1 peptide improves survival in sepsis. J Surg Res. 2017;208:33–39. doi: 10.1016/j.jss.2016.08.099. [DOI] [PMC free article] [PubMed] [Google Scholar]
- 50.Angus DC, van der Poll T. Severe sepsis and septic shock. N Engl J Med. 2013;369(9):840–851. doi: 10.1056/NEJMra1208623. [DOI] [PubMed] [Google Scholar]
- 51.Oved K, Cohen A, Boico O, et al. A novel host-proteome signature for distinguishing between acute bacterial and viral infections. PLoS One. 2015;10(3):e0120012. doi: 10.1371/journal.pone.0120012. [DOI] [PMC free article] [PubMed] [Google Scholar]
Associated Data
This section collects any data citations, data availability statements, or supplementary materials included in this article.