

Abstract
Hypoxia inducible factor-1 (HIF1) is a stress-responsive nuclear transcription factor that is activated with a decrease in oxygen availability. HIF1 regulates the expression of genes involved in a cell’s adaptation to hypoxic stress, including those with mitochondrial specific function. To gain a more comprehensive understanding of the role of HIF1 in mitochondrial homeostasis, we studied the link between hypoxia, HIF1 transactivation, and electron transport chain (ETC) function. We established immortalized mouse embryonic fibroblasts (MEFs) for HIF1α wild-type (WT) and null cells and tested whether HIF1α regulates mitochondrial respiration by modulating gene expressions of nuclear-encoded ETC components. High-throughput quantitative real-time polymerase chain reaction was performed to screen nuclear-encoded mitochondrial genes related to the ETC to identify those whose regulation was HIF1α-dependent. Our data suggest that HIF1α regulates transcription of cytochrome c oxidase (CcO) heart/muscle isoform 7a1 (Cox7a1) under hypoxia, where it is induced 1.5−2.5-fold, whereas Cox4i2 hypoxic induction was HIF1α-independent. We propose that adaptation to hypoxic stress of CcO as the main cellular oxygen consumer is mediated by induction of hypoxia-sensitive tissue-specific isoforms. We suggest that HIF1 plays a central role in maintaining homeostasis in cellular respiration during hypoxic stress via regulation of CcO activity.
Graphical abstract
Hypoxia is defined as a state in which the level of oxygen drops below normal in cells or tissues.1 Hypoxia causes stress within a cell that disrupts homeostasis, and these hypoxia-induced disruptions are associated with all of the leading causes of death in the United States, including cardiovascular disease, strokes, and cancer.2,3 Because of the detrimental effects of decreased oxygen tension, primarily at the level of energetics, organisms have developed a programmed response to this condition.4 This response is predominantly aimed at increasing the level of glucose utilization at the cellular level and the stimulation of erythropoiesis and angiogenesis at organismal levels.2 This occurs primarily through the transcriptional regulation of genes involved in these processes, such as those for glycolytic enzymes and transporters (Gapdh and Slc2a1), erythropoietin (Epo), and vascular endothelial growth factor (Vegfa). The transcriptional response to hypoxia is primarily regulated by a subset of the PAS superfamily of proteins, the hypoxia inducible factors.1,2
Hypoxia inducible factors (HIFs), which include HIF1α, HIF2α, HIF3α, aryl hydrocarbon receptor nuclear translocator (ARNT, also known as HIF1β), and ARNT2, are transcriptional regulators whose activity is sensitive to decreases in oxygen availability.2,3 HIF1α, HIF2α, and HIF3α are primarily cytoplasmic and, under normal oxygen tension conditions, are quickly degraded by the ubiquitin pathway. This degradation is dependent upon protein motifs, termed oxygen-dependent degradation domains (ODDs), found near the carboxy terminus of the protein.2 The hydroxylation of conserved residues within the ODD by oxygen-requiring prolyl hydroxylase domain-containing proteins (PHDs) targets HIFs for proteasomal degradation. Under hypoxic conditions, HIFs are stabilized and translocate to the nucleus where they are free to form dimers with ARNT or ARNT2. These heterodimers bind genomic DNA at sites called hypoxia response elements (HREs) to modulate transcription.2 Though HIFs are the primary mediators of the cellular response to hypoxic stress, HIF-independent signaling pathways also play a significant role following exposure to low levels of oxygen.5,6
Hypoxia directly impacts mitochondrial function by limiting the availability of oxygen necessary to complete the electron transport chain (ETC). Mitochondria utilize approximately 90% of cellular oxygen and, in return, generate approximately 90% of the total cellular energy (ATP) in normal tissues.7,8 Aerobic respiration involves three distinct phases: oxidation of substrates (e.g., glucose), electron transport, and oxidative phosphorylation (OXPHOS). In this process, reducing equivalents, primarily derived from the tricarboxylic acid (TCA) cycle, are transferred to the ETC and ultimately to O2. The energetically favorable movement of electrons within the ETC is coupled to the production of an electrochemical gradient across the inner membrane of the mitochondria, which is used to drive ATP synthesis. The critical role of oxygen in this process makes the ability to cope with changes in oxygen tension a metabolic priority. To maintain necessary energy levels under hypoxic stress, eukaryotic cells adapt by switching to anaerobic metabolism and substrate level phosphorylation. Most of the regulation necessary to make this metabolic switch is provided by HIF1 via transcriptional regulation of a battery of genes, including glycolytic enzymes, glucose transporters, and pyruvate dehydrogenase kinase.9 HIF1 also impacts mitochondrial function via transcriptional regulation of Bcl-2/adenovirus E1B 19 kDa-interacting protein3 (Bnip3) expression.10,11 In addition, HIF1 negatively regulates mitochondrial biogenesis and O2 consumption by activating the transcription of genes that regulate c-Myc and by suppressing mitochondrial gene expression nontranscriptionally.9,12
The respiratory chain in the inner mitochondrial membrane contains four enzyme complexes (I−IV) through which electrons pass on their way to reducing O2 to water. Complex I is termed NADH-ubiquinone oxidoreductase and reduces ubiquinone at the expense of NADH, resulting in the net transfer of four protons across the inner membrane. Complex II, also known as succinate dehydrogenase, consists of only four peptides and is thus the simplest of all the complexes of the ETC. Complex II is also a TCA cycle enzyme and directly links the oxidation of succinate to fumarate with the reduction of ubiquinone to ubiquinol but does not translocate protons across the inner membrane. Complex III (also known as ubiquinone-cytochrome-c oxidoreductase) enzymatically couples proton transfer to the oxidization of ubiquinol and the reduction of cytochrome c. Finally, complex IV, cytochrome c oxidase (CcO), completes the ETC by transferring the electrons from cytochrome c to O2 and utilizing the exergonic oxygen reduction reaction to pump protons.
Mammalian CcO crystallizes as a dimer, with each monomer containing 13 subunits, where subunits 1−3 are encoded by the mitochondrial genome. The other 10 subunits are nuclear-encoded proteins with COX4, COX6A, COX6B, COX7A, and COX8 having tissue- and species-specific isoforms.13−16 COX4, specifically isoform 1 (Cox4i1), has been implicated in the allosteric inhibition of CcO via binding of ATP to the matrix domain.17,18 Hypoxia was shown to upregulate Cox4i2 isoform expression in liver and lung, which can alter CcO activity, ATP levels, and ROS production and is proposed as a mechanism for protecting tissues from oxidative damage.19,20 Cox6a isoforms are postulated to participate in mammalian thermogenesis by decreasing H+/e− ratios and increasing respiration and heat production.18 Cox7a1 is expressed tissue-specifically in heart and skeletal muscle, and Cox7a2, a liver-type isoform, is expressed ubiquitously. Though it has been suggested that Cox7a isoforms are associated with glucose uptake, total body aerobic capacity, StAR expression, and steroidogenesis, very little is known about the function of this isoform pair.21,22
To gain a more comprehensive understanding of the link between hypoxic stress, HIF1α activation, and mitochondrial function, we generated two immortalized cell lines [Hif1α, wild type (WT) and null] and measured extracellular oxygen levels (indicative of oxygen consumption rates) after exposure to mitochondrial modulators. Following challenge, the cells were also assessed for changes in mitochondrial function and the expression of genes that encode proteins that are important for ETC and OXPHOS via a comprehensive qPCR screen. The results revealed HIF1α-responsive genes within the ETC, especially in complex IV, subunit 7a1 of cytochrome c oxidase (Cox7a1). Finally, the results suggest that Hif1α plays a central role in regulating the specific activity of CcO under various experimental conditions. This most likely involves various mechanisms, such as allosteric regulation, the redox status of the cell, and, in cells that express both subunits, complex composition.
EXPERIMENTAL PROCEDURES
Mouse Embryonic Fibroblast (MEF) Isolation
Hif1αflox/flox transgenic mice were generous gifts from R. Johnson (University of Cambridge, Cambridge, U.K.). Mice used in this study were kept at the animal housing facility under strict hygienic and pathogen-free conditions approved by the University Laboratory Animal Resource regulatory unit. All procedures were performed with the approval of the Michigan State University Committee on Animals Use and Care. Genotype-specific homozygous male and female mice were mated, and the females were kept isolated until day 14 of gestation (vaginal plug detection day was considered as day 0). Dams were anesthetized in a CO2 chamber for 90 s and then sacrificed using cervical dislocation. Embryos were surgically removed from the uterine horns and processed for fibroblast isolation using a protocol adapted from previous reports.23 Briefly, after surgical excision, embryos were transferred to a sterile cell culture hood, washed with 70% ethanol and PBS, cleaned (removal of liver, limbs, and head), diced, incubated with trypsin/EDTA at 37 °C for 30 min, and then passed through a 22 gauge needle onto a 10 cm plate and placed in a 37 °C incubator.
Cell Culture
High-glucose (Glc) MEF medium was Dulbeco’s modified Eagle’s medium (DMEM) (cat 11965, Gibco, Grand Island, NY) containing glucose (4500 mg/L) supplemented with 10% heat-inactivated fetal bovine serum (FBS), 100 units/mL penicillin, 100 μg/mL streptomycin, 2 mM L-glutamine, 0.1 mM nonessential amino acids, and 10 mM HEPES (pH 7.8). Galactose (Gal) MEF medium was glucose-free DMEM (cat 11966, Gibco) supplemented with 10 mM galactose and all additives described above. All cell culture work, unless otherwise specified, was performed under standard cell culture conditions (5% CO2, 35% humidity, and 37 °C) in a NAPCO (Winchester, VA) model 7000 incubator for normoxic conditions (21% O2) or in an O2-controlled glovebox (Coy Laboratory Products Inc., Grass Lake, MI) for hypoxic conditions (1% O2).
MEF Cell Line Generation and Genotyping
Freshly isolated MEF cells were plated in 10 cm plates at ~70% confluency with Glc medium changed daily. Cells were then immortalized by transfection with a plasmid construct (pRNS) containing the SV-40 large T antigen (a generous gift from C. C. Chang, Michigan State University) using Lipofectamine 2000 (Invitrogen, Carlsbad, CA) following the manufacturer’s instructions. Positive stable integrants were selected with 300 μg/mL G418 (Gibco). G418 resistant cells were split and infected with either LacZ recombinant (Ad-CMV-b-Gal) or Cre recombinase (Ad-CMV-Cre) adenovirus (Vector BioLabs, Philadelphia, PA) at 4000 multiplicity of infection for 48 h. Cells were then plated at very low densities (100 cells/15 cm plate), and when individual colonies became visible, clones were isolated and genotyped. Four WT and four null clones for Hif1α were pooled in equal numbers to generate two cell lines, Hif1α WT and Hif1α null. For genotyping, cell lines were grown to confluency in a 6 cm plate, rinsed and scraped with cold PBS (4 °C), and collected by centrifugation. Genomic DNA extraction and genotyping were performed on the cell pellet as previously described (primer F, TTG GGG ATG AAA ACA TCT GC; primer R, GCA GTT AAG AGC ACT AGT TG).24 The size of the amplified gene for Hif1α WT was 962 bp.
Nuclear Protein Preparation
MEF cells were grown in 15 cm plates to confluency under normoxic (21% O2) or hypoxic (1% O2) conditions or with 150 μM CoCl2 for 24 h, and protein extracts were prepared as described previously.3 Briefly, cells were washed with cold PBS (4 °C) and removed from the plate surface by being scraped in cold (4 °C) PBS and collected by centrifugation. Nuclear fractions were prepared by lysing the cells in 10 mM Tris (pH 7.5), 1.5 mM MgCl2, 10 mM KCl supplemented with Complete-mini EDTA-free protease inhibitor tablets (Roche Applied Science, Indianapolis, IN), 2 mM DTT, 1 mM Na3VO4, and 0.4 mM PMSF and kept on ice for 10 min. Nuclei were collected by centrifugation (12000g for 10 min) and resuspended in 20 mM Tris (pH 7.5), 0.42 M KCl, 20% glycerol, and 1.5 mM MgCl2 supplemented as described above and rotated for 45 min at 4 °C. Insoluble material was removed by centrifugation (20000g for 10 min), and the protein concentrations of the supernatant were determined using the Bio-Rad (Hercules, CA) Bradford assay kit and BSA standards.25 Protein samples were analyzed for HIF1α stabilization through Western blotting.
Mitochondrial Protein Preparation
MEF cells were grown in 15 cm plates to confluency under normoxic (21% O2) or hypoxic (1% O2) conditions for 24 h, and mitochondria were isolated using a protocol adapted from a previous report.26 Briefly, cells were washed with cold PBS (4 °C) and removed from the plate surface by being scraped in solution A (0.25 M sucrose, 20 mM HEPES, 10 mM KCl, 1.5 mM MgCl2, 1 mM EDTA, 1 mM EGTA, 1 mM DTT, and 0.1 mM PMSF). Samples were then subjected to three freeze/thaw cycles with mixing by pipet for each thaw, and insoluble material was removed by centrifugation (700g for 10 min at 4 °C). The supernatant was further cleared by centrifugation (10000g for 15 min at 4 °C) and aspirated, and the pellet was resuspended in solution A. Mitochondrial protein concentrations were determined using the Bio-Rad Bradford assay kit and BSA standards.25 Protein samples were analyzed for CcO enzyme activity.
Western Blotting
Protein samples were separated by sodium dodecyl sulfate−polyacrylamide gel electrophoresis (SDS−PAGE) and transferred to a nitrocellulose membrane. Western blots were performed with rabbit antibodies against HIF1α (NB100-479, Novus Biologicals, Inc., Littleton, CO) and β-actin (SC-7210, Santa Cruz Biotechnology, Inc., Dallas, TX). Proteins were visualized with horseradish peroxidase-conjugated goat anti-rabbit IgG (sc-2004, Santa Cruz Biotechnology, Inc.) and an ECL Western blot system (Pierce, Rockford, IL).
Oxygen Consumption Rate (OCR) Measurements
OCR was measured using an XF24 Extracellular Flux Analyzer (Seahorse Bioscience, Billerica, MA) as described in the manufacturer’s instructions. Hif1α WT and null cells, preadapted to medium glucose levels for 24 h, were plated in Glc or Gal medium at a density of 40000 cells/well and were allowed to adhere to the plate for 24 h. The culture medium was then replaced with specific XF24 assay medium. Glc XF24 assay medium consisted of DMEM base (cat D5030, Sigma-Aldrich, St. Louis, MO) supplemented with 25 mM glucose, 31 mM NaCl, 1 mM sodium pyruvate (Atlanta Biologicals, Inc., Flowery Branch, GA), 2 mM GlutaMAX (Gibco), and 15 mg/L phenol red (Sigma-Aldrich). Gal XF24 assay medium consisted of DMEM base (cat D5030, Sigma-Aldrich) supplemented with 10 mM galactose instead of glucose and all additives described above. Measurement of OCR was started 90 min after switching XF24 assay medium, and the inhibitors of ETC and OXPHOS system were injected in the following order: oligomycin A (1 μM), CCCP (1.5 μM for WT and 0.75 μM for null cells), and rotenone (0.5 μM)/antimycin A (0.5 μM). The concentration of CCCP for each cell line was optimized by measuring OCR in different nutrient environments, Glc or Gal XF24 assay medium. After OCR had been measured, cells were washed with cold PBS and lysed in buffer [10 mM Tris-HCl (pH 7.5) and 0.1% Triton X-100] by being frozen and thawed. The total protein amounts in each well were determined using a Bio-Rad Bradford assay kit and BSA standards.25 The OCR (picomoles per minute) was divided by total protein amounts for each well, and spare respiratory capacity was calculated by manufacturer’s software, the XF Mito Stress Test Report Generator.
RNA Isolation and Quantitative Real-Time PCR (qPCR)
RNA was isolated from the two different cell strains cultured in different carbon sources and at different oxygen tensions using TRIzol reagent via the manufacturer’s instructions (Invitrogen). RNA pellets were resuspended in ddH2O and quantified spectrophotometrically (260 nm). Total RNA (2 μg) was reverse transcribed by SuperScript III using an anchored oligo-(dT)20 primer as described by the manufacturer (Invitrogen). The resulting cDNA was diluted in ddH2O and used as a template for high-throughput qPCR (HTP qPCR) and manual qPCR. Primer pairs were designed to amplify 104 nuclear genes that encode specific mitochondrially related proteins (Table S1 of the Supporting Information). In total, 40 ETC complex I, 4 ETC complex II, 16 ETC complex III, 15 ETC complex IV, and 19 ETC complex V genes were assayed. Five uncoupling proteins, three chaperone, three housekeeping reference, and five control genes (one stress-responsive gene and four HIF1α-responsive genes) were also examined.
HTP qPCR mixtures consisting of 2 μL of cDNA, each primer at 0.3 μM, and 2× Power SYBR Green PCR Master Mix (Applied Biosystems, Foster City, CA) were aliquoted into 384-well plates using a Biomeck 2000 Laboratory Automation Workstation (Beckman Coulter Inc., Fullerton, CA). Amplification was conducted using an Applied Biosystems PRISM 7900HT Sequence Detection System. Quantification was determined using the comparative CT method (ΔΔCT) (Applied Biosystems). The geometric mean of the expression of three housekeeping genes (Actb, Hprt, and Ppia) was used to control for differences in RNA loading, quality, and cDNA synthesis. Fold changes in expression were calculated with HTP qPCR results using the ΔΔCT method with the WT Glc control (WT Glc Ctrl) group for each time point (4 and 24 h) being scaled to equal 1. Cluster version 3.0 was used to generate average linkage files, and Maple Tree version 0.2.3.2 BETA (http://sourceforge.net/projects/mapletree/) was used to create colored dendrograms from the linkage files, where red indicates upregulation and green indicates downregulation.27
Manual qPCR was performed with 25 μL reactions (5 μL of cDNA template, each primer at 0.3 μM, 3 mM MgCl2, 200 μM dNTPs, 0.6 unit of AmpliTaq Gold, and 10× SYBR Green PCR Buffer) and amplified using an Applied Biosystems PRISM 7000 Sequence Detection System. The Hprt housekeeping gene was a reference, and expression levels of key genes (Slc2a1, Vegfa, Cox4i1, Cox4i2, Bnip3, Cox6a1, Cox6a2, Cox7a1, and Cox7a2) were calculated using the ΔΔCT method. Fold changes of Slc2a1, Vegfa, and Bnip3 were calculated compared to the WT Glc control group (WT Glc Ctrl) for 24 h being scaled to equal 1. Fold changes of Cox4i1, Cox4i2, Cox6a1, Cox6a2, Cox7a1, and Cox7a2 were expressed compared to the WT Glc Ctrl of one isoform of each Cox subunit for 24 h being scaled to equal 1.
Measurement of CcO Enzyme Activity
CcO activity was determined as previously described with slight modifications.28 Bovine heart cytochrome c was dissolved in assay buffer (40 mM phosphate buffer and 0.5% Tween 80) at 0.4 mg/mL and was reduced using sodium dithionite. The fully reduced cytochrome c was confirmed by the ratio of absorbance at 550 and 565 nm, and the change in absorbance at 550 nm was recorded as a function of time for the CcO assay. After the absorbance at 550 nm of reduced cytochrome c (Ared) had been recorded, isolated mitochondria were added and the absorbance at 550 nm was recorded every 5 s for 3 min. The initial CcO activity was calculated using the expression
with units of micromoles per minute per milligram. The specific activity was calculated as a turnover number in inverse minutes, dividing CcO activity in micromoles per minute per milligram protein by mitochondrial CcO concentration in micromoles per milligram protein. The absorbance for CcO activity was measured using a SpectraMax M2 spectrophotometer (Molecular Devices, Sunnyvale, CA).
Mitochondrial CcO Measurement
The concentration of cytochrome aa3 (CcO) was determined as previously described29 by measuring the visible difference spectra (dithionite-reduced minus ferricyanide-oxidized) of the detergent-solubilized mitochondria from 500 to 700 nm. The peak at 605 nm represented the reduced minus oxidized peak of cytochrome a. The concentration of CcO was calculated using the extinction coefficient for reduced−oxidized CcO of 24 mM−1 cm−1 at 605−630 nm.
Statistical Analysis
The result of spare respiratory capacity was analyzed for significant differences by analysis of variance (ANOVA) followed by Tukey’s post hoc test.
RESULTS
Creation of Hif1α WT and Null Cells
The genotype of the Hif1α WT and Hif1α null cells was confirmed by PCR, and the extent of recombination was approximately 100% in the nulls (Figure 1A). To confirm the functional deletion of the Hif1α gene, HIF1α protein levels following exposure to control conditions (Ctrl), 150 μM CoCl2 (Co), or hypoxia (1% O2, Hyp) for 24 h were examined by Western blot analysis (Figure 1B). Hif1α null cells did not express HIF1α protein under CoCl2 or hypoxia, confirming that recombination-induced functional deletion of Hif1α gene was approximately 100%.
Figure 1.
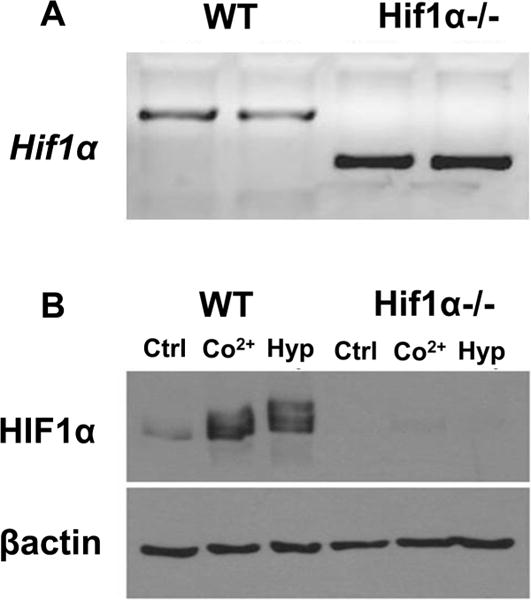
Genotype and protein comparisons of Hif1α WT and null cells. (A) Hif1α WT and null cells were harvested; DNA was extracted, and PCR-based genotyping was performed using Hif1α primers described in Experimental Procedures. (B) Hif1α WT and null cells were exposed to control conditions (Ctrl), 150 μM CoCl2 (Co2+), or 1% O2 (Hyp) for 24 h. Nuclear protein was extracted and separated by SDS−PAGE, transferred to a nitrocellulose membrane, and probed with a HIF1α-specific (top) or β-actin-specific (bottom) antibody (n = 2).
Cellular Respiration in Hif1α WT and Null Cells under Different Energy Sources
To determine the role of HIF1α in cellular respiration, the extracellular oxygen flux of each cell line in different nutrients was measured to calculate OCR (Figure 2). OCR was monitored in the presence of ETC and OXPHOS inhibitors, oligomycin (a), CCCP (b), and rotenone/antimycin (c), in Hif1α WT and null cells in Glc and Gal media (Figure 2A). It is important to note that spare respiratory capacity was described as maximal respiration [i.e., the OCR in the presence of CCCP (44.9 min in Figure 2A)] divided by a basal respiration (OCR at 9.9 min in Figure 2A) times 100 (Figure 2B). The Hif1α WT cells in both Glc and Gal media had spare respiratory capacities significantly higher than those of Hif1α null cells in the Gal media (WT Glc, 182%; WT Gal, 222%; null Gal, 100%). The Hif1α null cells in the Glc media showed a spare respiratory capacity of 158%, but this was not significant when compared to that of null cells in the Gal media. Similar results were also observed in the two cell types and under different conditions when pericellular oxygen consumption was measured using a SensorDish Reader (PreSens Precision Sensing GmbH, Regensburg, Germany)30 (data not shown).
Figure 2.
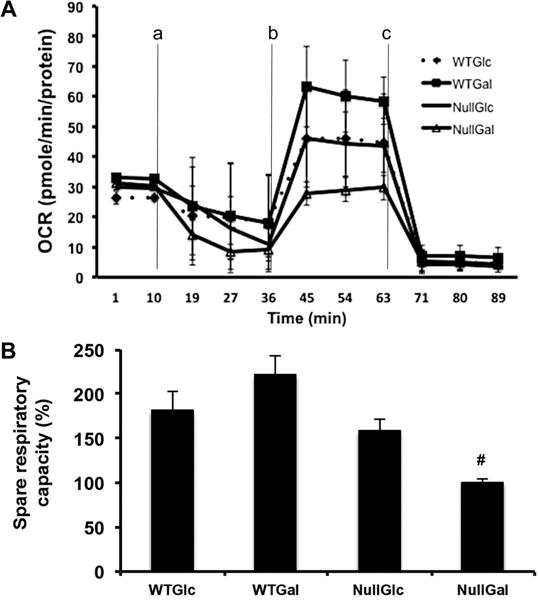
Measurement of oxygen consumption rate (OCR) from Hif1α WT and null cells. (A) OCR, calculated as picomoles per minute per protein amount in the XF24 assay medium of Hif1α WT and null cells grown in Glc or Gal media, measured after exposure to (a) oligomycin (1 μM), (b) CCCP (1.5 μM for WT and 0.75 μM for null cells), and (c) rotenone (0.5 μM)/antimycin A (0.5 μM). Lines indicate average values ± standard errors (n = 3). (B) Spare respiratory capacity as a percentage calculated with maximal respiration (OCR at 44.9 min) and basal respiration (OCR at 9.9 min) by the manufacturer’s software, the XF Mito Stress Test Report Generator. Data were analyzed for significant differences by ANOVA followed by Tukey’s post hoc test. A number sign indicates significant differences at p < 0.05.
Screening HIF1-Dependent mRNA Expression of Nuclear-Encoded Mitochondrial Genes
The oxygen consumption data suggest that the cellular respiration efficiency in the two cell types is inherently different. To further elucidate the role of HIF1α in mitochondrial function, HTP qPCR was utilized to screen the expression levels of 104 nuclear-encoded genes associated with the ETC and mitochondrial function. Hif1α WT and null cells were exposed to control (Ctrl) conditions or 1% O2 (Hyp) in both Glc and Gal media for 4 and 24 h (Figure 3A). Compared to the 24 h time point, the 4 h time point showed a high percentage of downregulated genes. Five groupings of differentially expressed genes are indicated in Figure 3A. Group 1 has many genes that were upregulated at 4 h and downregulated at 24 h, including the complex I genes Ndufc2, Ndufs4, and Ndufb3. Group 2 contains the positive control HIF1α-regulated genes (Bnip3, Slc2a1, and Vegfa) along with Cyb5r2, Cox6a2, and Cox7a1, which, in particular, show a classic HIF1α-regulated expression pattern (Figure 3B). Most of the group 3 genes were downregulated at 4 h and upregulated at 24 h without showing a distinct HIF1α-regulated expression pattern, such as Lonp1, Cox4i2, and Cyb5r1. There was a small group of genes (group 4) that showed greater upregulation in the null than in the WT cell line at both 4 and 24 h time points. This group includes the mitochondrial uncoupling protein (UCP4) gene, Slc25a27, and ATP synthase subunits Atp5j2 and Atp5c1. Finally, group 5 is primarily composed of genes whose expression was downregulated at both 4 and 24 h regardless of cell type, in particular the ETC complex II genes Sdha, Sdhc, and Sdhd.
Figure 3.
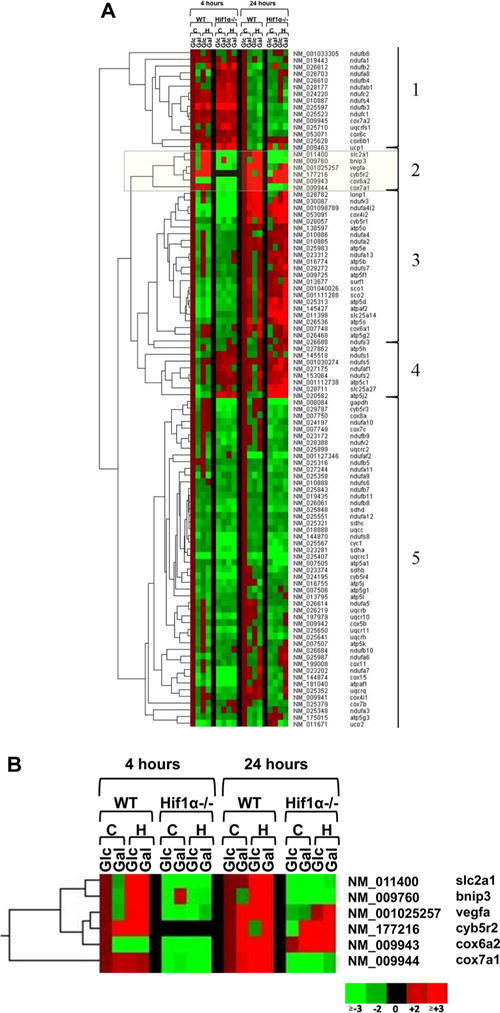
Dendrograms. Gene expression fold changes calculated with HTP qPCR results using the ΔΔCT method for Hif1α WT and null cells exposed to control conditions (C) and 1% O2 (H) in high-glucose media (Glc) or galactose media (Gal) at 4 and 24 h. The cell and medium control group (e.g., WT Glc) at each time point was scaled to 1. Red indicates upregulation, green downregulation, and black no data. (A) Genes are separated into five groups based on clustering and expression profiles. (B) Group 2 contains known HIF1α-regulated genes Slc2a1, Bnip3, and Vegfa.
HIF1-Dependent Gene Expression of Nuclear-Encoded Mitochondrial CcO Genes
Manual qPCR was performed on select genes that were dependent upon HIF1α-mediated regulation in HTP qPCR. Classic HIF1α-regulated genes Slc2a1, Vegfa, and Bnip3 showed the expected higher level of expression in the Hif1α WT cells in response to a 24 h hypoxia treatment compared to control and Hif1α null cells (Figure 4A). Several genes associated with CcO showed differential patterns of gene expression among the different isoforms (Figure 4B−D). Cox4i1 had a higher level of expression when cells were exposed to Gal media and hypoxia. Cox4i2 had a higher level of expression in Hif1α null cells under hypoxia than in WT cells regardless of sugar sources. The level of Cox6a1 expression was higher in Hif1α null cells regardless of nutrient type, while the level of Cox6a2 expression was higher in Gal media regardless of cell type (WT and null cells). In agreement with Figure 3, Cox7a1 displayed a classic HIF1α-dependent expression pattern, being upregulated by hypoxia in the Hif1α WT, especially an increase in Glc media, but not the Hif1α null cells. Cox7a2 expression did not change between cell types or in response to treatments.
Figure 4.
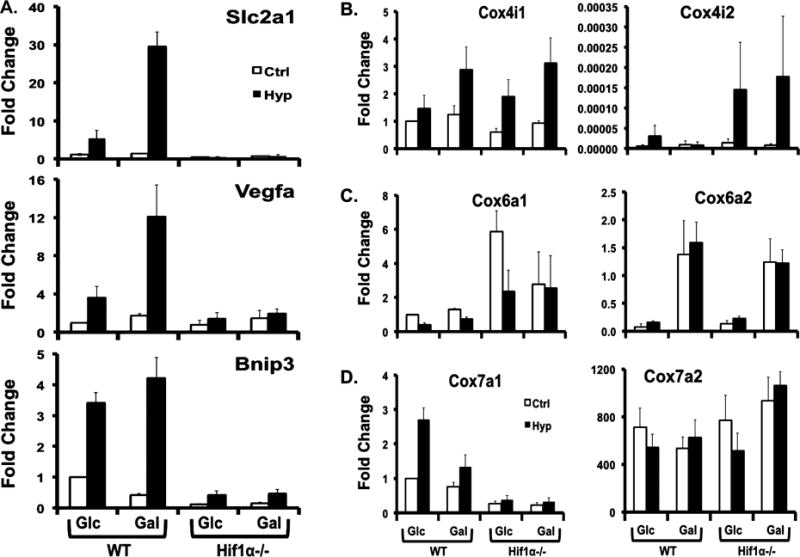
Gene expression of control and select mitochondrial genes. Known HIF1α target genes (A) and selected CcO subunit genes (B−D) were assessed by manual qPCR of Hif1α WT and null cells after exposure to treatment for 24 h. Treatment designations include high-glucose media (Glc), galactose media (Gal), control conditions (Ctrl), and 1% O2 (Hyp). The y-axis indicates the fold change that was calculated using . (A) The fold change for Slc2a1, Bnip3, and Vegfa was a comparison to the fold of WT Glc Ctrl being scaled to 1 within each gene. (B) Fold change of Cox4 was a comparison to the fold of WT Glc Ctrl of Cox4i1 scaled to 1. (C) The fold change of Cox6 was a comparison to the fold of WT Glc Ctrl of Cox6a1 scaled to 1. (D) The fold change of Cox7 was a comparison to the fold of WT Glc Ctrl of Cox7a1 scaled to 1. Bars indicate average values ± standard errors of the mean except the gene expression of Slc2a1 (n = 3 for Vegfa, Cox4i1, and Cox4i2; n = 4 for Bnip3, Cox6a1, and Cox6a2; n = 5 for Cox7a2; n = 7 for Cox7a1). Bars for Slc2a1 expression indicate average values ± the standard deviation (n = 1).
HIF1α-Dependent Regulation of CcO Activity
The results of transcriptional CcO subunit expressions suggest that HIF1α plays a role in modulating the expression of Cox7a1 and, potentially, other critical subunits. A biochemical assessment of the CcO activity was performed to determine if its activity was influenced by changes in Hif1α genotype. Hif1α WT and null cell lines were exposed to control conditions and 1% O2 for 24 h in both Glc and Gal media, and mitochondria were isolated. CcO activity and quantity were assessed in these isolated mitochondria (Table 1). The specific activity of CcO remained fairly constant in both cell strains and different treatment paradigms, with two exceptions. The WT cells showed a decrease in CcO activity following hypoxic exposure in Glc-containing media that was not evident in Gal-containing media. In addition, the null cells grown in Gal media showed an almost 3-fold increase in CcO specific activity under hypoxic stress. This increase reflects both an increase in enzyme activity and a decrease in enzyme concentration under these conditions. These data suggest that loss of HIF1α signaling removes the cell’s ability to regulate CcO activity under hypoxic stress and that maintenance of this activity below a given threshold is important for mitochondrial viability. However, the observed changes in CcO activity under some conditions may not be explained by changes in CcO isoform composition because Cox7a1 transcripts constitute <1% of total subunit 7a transcripts in our cell lines (Figure 4D) even after hypoxic induction (see Discussion).
Table 1.
CcO Enzyme Activity
| CcO activity
|
CcO protein concentration
|
||||||
|---|---|---|---|---|---|---|---|
| nutrient | MEF | oxygen | [CcO] [protein] [CcO] specific activity protein)−1] | [CcO] (mM) |
[protein] (mg/mL) |
[CcO] (μmol/mg) |
specific activity (s−1) |
| glucose | WT | Ctrl | 0.0435 | 2.7 × 10⁻⁴ | 5.7 | 4.71 × 10⁻⁵ | 15.4 |
| Hyp | 0.0320 | 3.7 × 10⁻⁴ | 6.0 | 6.11 × 10⁻⁵ | 8.7 | ||
| Hif1α−/− | Ctrl | 0.0409 | 3.1 × 10⁻⁴ | 5.6 | 5.55 × 10⁻⁵ | 12.3 | |
| Hyp | 0.0391 | 2.5 × 10⁻⁴ | 5.2 | 4.80 × 10⁻⁵ | 13.6 | ||
| galactose | WT | Ctrl | 0.0476 | 2.1 × 10⁻⁴ | 4.7 | 4.54 × 10⁻⁵ | 17.5 |
| Hyp | 0.0520 | 1.7 × 10⁻⁴ | 3.6 | 4.67 × 10⁻⁵ | 18.5 | ||
| Hif1α−/− | Ctrl | 0.0418 | 2.4 × 10⁻⁴ | 4.4 | 5.49 × 10⁻⁵ | 12.7 | |
| Hyp | 0.0944 | 9.1 × 10⁻⁵ | 2.5 | 3.68 × 10⁻⁵ | 42.7 | ||
COX7A Subunit and CcO Protein Structure
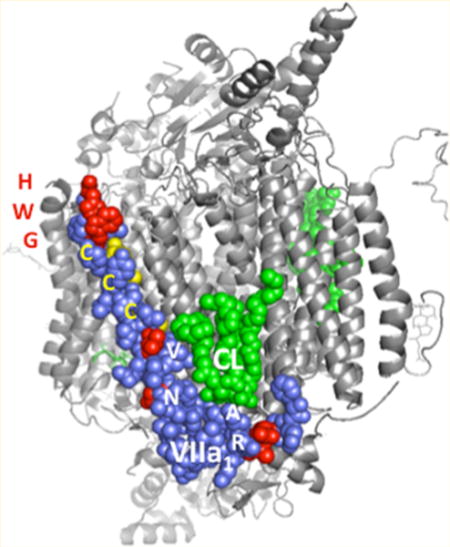
The hypoxia-induced expression of Cox7a1 appears to be HIF1α-dependent, and loss of HIF1α signaling affects the capacity of mitochondria to regulate oxygen consumption and CcO specific activity following hypoxic stress. In cells that express significant amounts of both isoforms, HIF1α might alter the subunit composition of CcO upon hypoxia exposure to maintain CcO activity within acceptable limits to sustain mitochondrial viability. To begin to gain a mechanistic understanding of this role, protein sequence alignment and structural visualization were performed. COX7A1 and COX7A2 are highly conserved across multiple species (e.g., human, 59.7% identical and 79.1% similar; mouse, 58.4% identical and 72.7% similar). The structure of bovine CcO, a 13-subunit enzyme that is highly homologous to that of the mouse, shows the location of the L-shaped COX7A subunit in blue and an associated cardiolipin molecule in green (Figure 5). This membrane-embedded face of CcO is an area that appears to interact with complex III (cytochrome bc1) when they associate with complex I to form a supercomplex.31 Part of the interaction appears to be mediated by cardiolipin and COX7A, and thus, the sequence variation between the 7A1 and 7A2 isoforms might well be expected to influence this interaction. The region of most sequence divergence is the N-terminus, at the bottom of the L and not completely resolved in the crystal structure. In addition, the protein sequences show distinct differences at specific residues along the surface of the helix comprising most of the subunit (i.e., R127K2, A129P2, N152A2, V157A2, C162T2, C169A2, and C172E2). COX4, COX6A, COX7A, and COX8 are also rendered, and these subunits impact the conformation for interaction with cytochrome bc1 (not shown). Given these sequence differences and hypoxic-responsive gene COX4 localization at the same side with COX7A, switching COX7A subunits under hypoxic stress might allow CcO to alter its interactions with other ETC complexes during the formation of supercomplexes.32,33 In addition, because a number of these residues are cysteines, the switch from COX7A2 to COX7A1 might render the CcO more redox sensitive or serve to protect it from oxidative damage while under hypoxic stress.16,34
Figure 5.
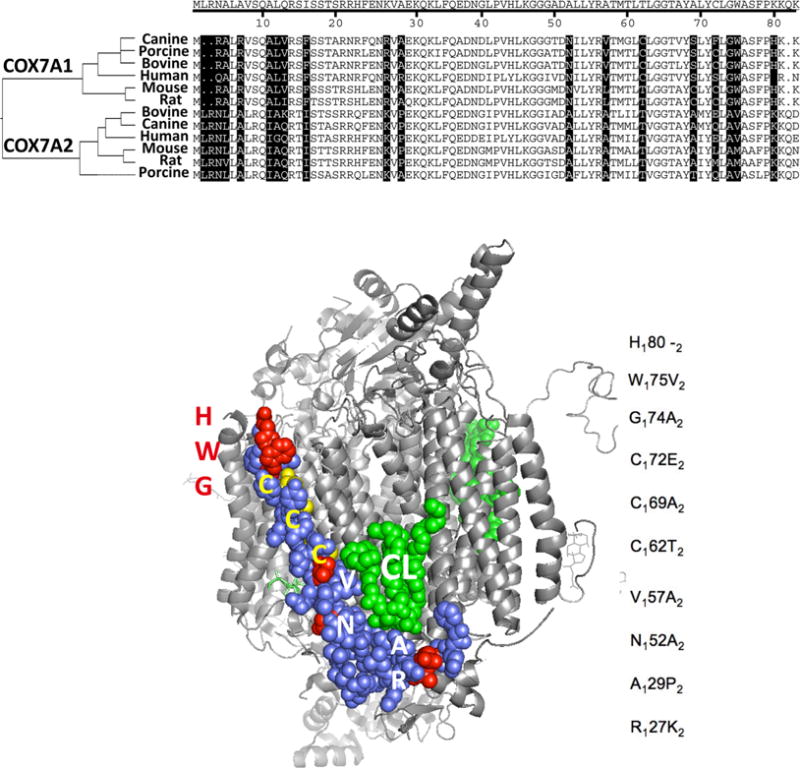
Comparative amino acid sequences for COX7A1 and COX7A2 isoforms and a 3D representation of the CcO monomer. The residues that are altered between 7A1 and 7A2 are listed to the right of the model, with subscripts indicating the isoform and their locations highlighted in red or yellow in the structure. The whole CcO structure is in grey and COX7A1 in purple. A molecule of cardiolipin, CL, is shown in green. The top of the figure is the intermembrane side, the bottom is the matrix side. The COX7A1 structure is not completely resolved in the bovine crystal structure: it starts at phenylalanine 24 on the bottom (N-terminal, matrix side). The figure was made in PyMOL from the coordinates of bovine cytochrome c oxidase PDB 2dyr.
DISCUSSION
In this study, we demonstrate a role of HIF1α in the basal oxygen utilization rate and the ETC function of MEF cells and establish HIF1α regulation of genes associated with cytochrome c oxidase (CcO). Gene expression changes for CcO components occur in response to hypoxia, and the extracellular oxygen concentrations (oxygen consumption rate data) support an apparent constitutive modulation of mitochondrial function by HIF1α. This study adds to the growing body of evidence that the hypoxia signaling system (especially HIF1α) regulates ETC biogenesis and processes associated with mitochondrial function, such as energy production, reactive oxygen species homeostasis, autophagy/apoptosis, and oxygen consumption.
Addition of exogenous glucose to cultured cells will increase the rate of glycolysis and inhibit OXPHOS, a phenomenon known as the Crabtree effect.35 A change from Glc to Gal in culture media increases the respiration rate and cytosolic pH, increases the rate of cellular oxygen consumption, and results in mitochondrial remodeling.35,36 In human primary myotubes, Gal medium enhances aerobic metabolism and decreases the rate of anaerobic glycolysis.37 Our results support these observations with an increased spare respiratory capacity in the Hif1α WT cells (Figure 2B) and dramatic changes in ETC gene expression profiles in response to Gal (Figure 3).38−40 For example, after 24 h, expression profiles show genes upregulated in response to Gal only in the presence of HIF1α (e.g., Ndufa10), in the absence of HIF1α (e.g., Atp5l), and regardless of HIF1α status (e.g., Surf1). Cox8a showed upregulation in response to glucose only when HIF1α was present, while Ucp1 conversely showed upregulation only in Hif1α null cells. Rossignol et al. found no greater levels of mitochondria in HeLa cells grown with galactose than those grown with glucose; however, there were significant galactose-induced changes in mitochondrial protein expression in both HeLa and MRC5 fibroblast cells.36 MRC5 fibroblast cells had significantly increased protein quantities for complex I, II, and IV subunits, while complex III protein levels were not increased. In our 24 h study, the complex III genes were almost all downregulated in the HIF1α null cells with mixed responses in regard to Gal (e.g., Uqcrc1, Uqcrh, and Uqcrq). The uniqueness of the complex III response to Gal is a point of interest as the role of ROS generated at complex III has been implicated in HIF stabilization and signaling, though this is debated.8,41,42 Clearly, there is a complex interaction between HIF1α and carbon substrate availability on mitochondrial function, OXPHOS, and gene expression of ETC components.
There is ample evidence that hypoxia alters mitochondrial function and oxygen utilization.8,9,43 HIF1 influences mitochondrial function by suppressing both the TCA cycle and respiration and controls mitochondrial biogenesis and autophagy.8,43 Few studies, however, have examined HIF1-dependent changes in the expression of specific ETC genes. A Cox4 isoform exchange (Cox4i1 to Cox4i2) in response to hypoxia was reported to be coordinated by HIF1. HIF1 upregulates Cox4i2 mRNA expression and concurrently increases the level of Cox4i1 degradation through an increased level of expression of Lonp1, a mitochondrial protease.20 Our results show an upregulation of Lonp1 and Cox4i2, but the increased level of Cox4i2 was observed in Hif1α null, as well as, WT cells (Figures 3 and 4). These results are in agreement with a previously published report that also found that Cox4i2 is upregulated under hypoxia via a novel oxygen-responsive element (ORE) separate from an HRE.19,44 We observed a higher level of expression of Cox4i1 in both WT and Hif1α null cells grown with Gal, supporting the idea that Cox4i1 expression is independent of HIF1α. There is some indication that Cox4i2 is expressed in only certain tissues, while Cox4i1 is ubiquitously expressed and is the isoform responsible for ATP regulation of CcO activity.13,17,18
Our results indicate that Cox7a1 is a HIF1-regulated gene (Figures 3 and 4), and the 5000 bp sequence on the mouse Cox7a1 gene (NC_00073.5:30964250 to 30969250 bp) prior to the start codon reveals at least six possible HREs.20 One of these HREs (5′-GCGTG-3′) occurs within the 92 bp segment immediately upstream of the major transcription start site (−80 bp), which in the bovine Cox7a1 gene is considered to be the basal promoter region responsible for most of the gene expression and activity.45 Evidence indicates that the level of Cox7a1 mRNA expression in human skeletal muscle decreases significantly with age and is positively related with glucose uptake, total body aerobic capacity, and PGC-1α mRNA expression.21 Cox7a1 knockout male mice displayed tissue-specific differences in resting ATP levels and reduced CcO specific activity and respiratory control ratio in skeletal muscle from wild-type mice.34,46 In addition, a significant increase in ROS production has been observed in response to Cox7a2 overexpression similar to the increased ROS production observed with the Cox4i2 replacement of Cox4i1 under nonhypoxic conditions.20 Because ROS is produced by the transfer of an electron to O2 at complex I or complex III, changes in CcO structure that produce ROS are most probably manifested by limitations in CcO activity.47 Moreover, cardiolipin, which interacts with COX7A near the site of the cytochrome bc1 interface, is critical for CcO assembly and organizing components in supercomplexes and consequently improves CcO function.18 Taken together, this information shows a potential link among Cox7a subunits, CcO activity, and hypoxia, but further experimentation is needed to determine the impact of Cox7a subunit switching on supercomplex formation, ETC efficiency, and cellular energetics under various oxygen tensions in cell systems that express measurably levels of both Cox7a isoforms.
The CcO activity (Table 1) and cellular respiration (Figure 2) in Hif1α null cells suggest that HIF1α stabilization under hypoxia is necessary to maintain homeostasis in cellular oxidative metabolism. As previously described, cellular respiration was measured under nonhypoxic conditions and the respiration capacity in Hif1α null cells was not changed by a mitochondrial uncoupler with either carbon source while WT cells adapted to each nutrient type. CcO activity, however, was increased almost 3-fold in Hif1α null cells grown in Gal media following hypoxic stress. This increase was not observed in Hif1α WT cells. These results suggest two things. First, the Hif1α null cells are at maximal respiration normally. This inability to maintain spare respiratory capacity suggests the Hif1α null cells are partially uncoupled or lack the necessary regulatory mitochondria-to-nuclear signaling to maintain reserve respiratory capacity. This might be partially explained by the upregulation of UCP4 in the null cells (Figure 2). This loss of spare respiratory capacity might also help explain why these cells lose mitochondrial mass under stress (i.e., hypoxia + GAL media). Second, HIF1α plays a role in regulating overall CcO activity to maintain optimal efficiency and limit ROS generation. Galactose forces the cells to become more reliant on oxidative phosphorylation to meet energy demands, and hypoxia limits the cell’s ability to produce ATP through complex IV. Under these conditions (i.e., hypoxia + GAL media), cells must modulate the efficiency of oxidative phosphorylation to maintain cellular energetics and limit oxidative stress. The results suggest that this adaptation is dependent upon HIF1α, and in its absence, CcO activity becomes unregulated and damages the mitochondria. This is evident from the increase in specific activity and the decrease in mitochondrial mass under these conditions. This might stem from the cell’s inability to upregulate glycolytic capacity in the absence of HIF1α. Therefore, the higher CcO activity in Hif1α null cells in Gal media under hypoxia shows an adapted response to cope with a stronger dependence on energy production via oxidative phosphorylation.
In conclusion, our study indicates a significant difference in oxygen utilization by Hif1α WT and Hif1α null MEF cells in response to a mitochondrial uncoupler. These cell lines show differences in ETC gene expression profiles under different nutrient types and oxygen concentrations. Most importantly, we have identified HIF1α as a regulator of CcO activity and Cox7a1 gene expression. Given their location within the crystal structure, we suggest a possible role for these hypoxia-induced isoform changes to translate into structural changes in a supercomplex formation depending on redox state or oxidative stress. Altogether, this study indicates that HIF1α is critical for mitochondrial respiration control and transcriptional regulation of CcO components to achieve cellular adaptation in an oxygen-limiting environment.
Supplementary Material
Acknowledgments
Special thanks to Karen Studer-Rabeler and Coy Laboratory Products, Inc., for generously providing use of a Pre Sens Sensor Dish Reader along with extensive support and expertise. Dr. Jeff Landgraf and his staff at the Research Technology Support Facility (RTSF) at Michigan State University kindly provided access to and assistance with the Biomeck 2000 Laboratory Automation Workstation and ran the high-throughput 384-well qPCR plates. This material is based upon work partially supported by the National Institute of Food and Agriculture, U.S. Department of Agriculture (Project MICL01995).
Funding
This research was supported in part by Grant T32ES007255-19 from the National Institute of Environmental Health Sciences (NIEHS) to S.G.L. as a postdoctoral fellowship through the Michigan State University Center for Integrative Toxicology.
ABBREVIATIONS
- AHR
aryl hydrocarbon receptor
- ARNT
aryl hydrocarbon receptor nuclear translocator
- CCCP
carbonyl cyanide m-chlorophenylhydrazone
- CcO
cytochrome c oxidase
- DMSO
dimethyl sulfoxide
- ETC
electron transport chain
- Glc
glucose
- Gal
galactose
- HIF
hypoxia inducible factor
- HREs
hypoxia response elements
- MEF
mouse embryonic fibroblast
- OXPHOS
oxidative phosphorylation
- OCR
oxygen consumption rate
- PHDs
prolyl hydroxylase domain-containing proteins
- TCA
tricarboxylic acid
- qPCR
quantitative real-time polymerase chain reaction
- HTP qPCR
high-throughput quantitative real-time polymerase chain reaction
- VDAC-1
voltage-dependent anion channel 1
- WT
wild type
Footnotes
Supporting Information
Primer sets for reference, control, and selected genes for qPCR (Table S1). The Supporting Information is available free of charge on the ACS Publications website at DOI: 10.1021/bi5012892.
Author Contributions
H.J.H. and S.G.L. contributed equally to this work.
Notes
The authors declare no competing financial interest.
References
- 1.Vengellur A, Woods BG, Ryan HE, Johnson RS, LaPres JJ. Gene expression profiling of the hypoxia signaling pathway in hypoxia-inducible factor 1α null mouse embryonic fibroblasts. Gene Expression. 2003;11:181–197. doi: 10.3727/000000003108749062. [DOI] [PMC free article] [PubMed] [Google Scholar]
- 2.Ratcliffe PJ. Oxygen sensing and hypoxia signalling pathways in animals: The implications of physiology for cancer. J Physiol. 2013;591:2027–2042. doi: 10.1113/jphysiol.2013.251470. [DOI] [PMC free article] [PubMed] [Google Scholar]
- 3.Vengellur A, LaPres JJ. The role of hypoxia inducible factor 1α in cobalt chloride induced cell death in mouse embryonic fibroblasts. Toxicol Sci. 2004;82:638–646. doi: 10.1093/toxsci/kfh278. [DOI] [PubMed] [Google Scholar]
- 4.Bunn HF, Poyton RO. Oxygen sensing and molecular adaptation to hypoxia. Physiol Rev. 1996;76:839–885. doi: 10.1152/physrev.1996.76.3.839. [DOI] [PubMed] [Google Scholar]
- 5.Shen C, Nettleton D, Jiang M, Kim SK, Powell-Coffman JA. Roles of the HIF-1 hypoxia-inducible factor during hypoxia response in Caenorhabditis elegans. J Biol Chem. 2005;280:20580–20588. doi: 10.1074/jbc.M501894200. [DOI] [PubMed] [Google Scholar]
- 6.Li Y, Padmanabha D, Gentile LB, Dumur CI, Beckstead RB, Baker KD. HIF- and non-HIF-regulated hypoxic responses require the estrogen-related receptor in Drosophila melanogaster. PLoS Genet. 2013;9:e1003230. doi: 10.1371/journal.pgen.1003230. [DOI] [PMC free article] [PubMed] [Google Scholar]
- 7.Taylor CT. Mitochondria and cellular oxygen sensing in the HIF pathway. Biochem J. 2008;409:19–26. doi: 10.1042/BJ20071249. [DOI] [PubMed] [Google Scholar]
- 8.Solaini G, Baracca A, Lenaz G, Sgarbi G. Hypoxia and mitochondrial oxidative metabolism. Biochim Biophys Acta. 2010;1797:1171–1177. doi: 10.1016/j.bbabio.2010.02.011. [DOI] [PubMed] [Google Scholar]
- 9.Palsson-McDermott EM, O’Neill LA. The Warburg effect then and now: From cancer to inflammatory diseases. BioEssays. 2013;35:965–973. doi: 10.1002/bies.201300084. [DOI] [PubMed] [Google Scholar]
- 10.Bruick RK. Expression of the gene encoding the proapoptotic Nip3 protein is induced by hypoxia. Proc Natl Acad Sci USA. 2000;97:9082–9087. doi: 10.1073/pnas.97.16.9082. [DOI] [PMC free article] [PubMed] [Google Scholar]
- 11.Rikka S, Quinsay MN, Thomas RL, Kubli DA, Zhang X, Murphy AN, Gustafsson AB. Bnip3 impairs mitochondrial bioenergetics and stimulates mitochondrial turnover. Cell Death Differ. 2011;18:721–731. doi: 10.1038/cdd.2010.146. [DOI] [PMC free article] [PubMed] [Google Scholar]
- 12.Gomes AP, Price NL, Ling AJ, Moslehi JJ, Montgomery MK, Rajman L, White JP, Teodoro JS, Wrann CD, Hubbard BP, Mercken EM, Palmeira CM, de Cabo R, Rolo AP, Turner N, Bell EL, Sinclair DA. Declining NAD+ induces a pseudohypoxic state disrupting nuclear-mitochondrial communication during aging. Cell. 2013;155:1624–1638. doi: 10.1016/j.cell.2013.11.037. [DOI] [PMC free article] [PubMed] [Google Scholar]
- 13.Huttemann M, Kadenbach B, Grossman LI. Mammalian subunit IV isoforms of cytochrome c oxidase. Gene. 2001;267:111–123. doi: 10.1016/s0378-1119(01)00385-7. [DOI] [PubMed] [Google Scholar]
- 14.Huttemann M, Jaradat S, Grossman LI. Cytochrome c oxidase of mammals contains a testes-specific isoform of subunit VIb: The counterpart to testes-specific cytochrome c? Mol Reprod Dev. 2003;66:8–16. doi: 10.1002/mrd.10327. [DOI] [PubMed] [Google Scholar]
- 15.Huttemann M, Schmidt TR, Grossman LI. A third isoform of cytochrome c oxidase subunit VIII is present in mammals. Gene. 2003;312:95–102. doi: 10.1016/s0378-1119(03)00604-8. [DOI] [PubMed] [Google Scholar]
- 16.Pierron D, Wildman DE, Huttemann M, Markondapatnaikuni GC, Aras S, Grossman LI. Cytochrome c oxidase: Evolution of control via nuclear subunit addition. Biochim Biophys Acta. 2012;1817:590–597. doi: 10.1016/j.bbabio.2011.07.007. [DOI] [PMC free article] [PubMed] [Google Scholar]
- 17.Acin-Perez R, Gatti DL, Bai Y, Manfredi G. Protein phosphorylation and prevention of cytochrome oxidase inhibition by ATP: Coupled mechanisms of energy metabolism regulation. Cell Metab. 2011;13:712–719. doi: 10.1016/j.cmet.2011.03.024. [DOI] [PMC free article] [PubMed] [Google Scholar]
- 18.Arnold S. The power of life: Cytochrome c oxidase takes center stage in metabolic control, cell signalling and survival. Mitochondrion. 2012;12:46–56. doi: 10.1016/j.mito.2011.05.003. [DOI] [PubMed] [Google Scholar]
- 19.Huttemann M, Lee I, Liu J, Grossman LI. Transcription of mammalian cytochrome c oxidase subunit IV-2 is controlled by a novel conserved oxygen responsive element. FEBS J. 2007;274:5737–5748. doi: 10.1111/j.1742-4658.2007.06093.x. [DOI] [PubMed] [Google Scholar]
- 20.Fukuda R, Zhang H, Kim JW, Shimoda L, Dang CV, Semenza GL. HIF-1 regulates cytochrome oxidase subunits to optimize efficiency of respiration in hypoxic cells. Cell. 2007;129:111–122. doi: 10.1016/j.cell.2007.01.047. [DOI] [PubMed] [Google Scholar]
- 21.Ronn T, Poulsen P, Hansson O, Holmkvist J, Almgren P, Nilsson P, Tuomi T, Isomaa B, Groop L, Vaag A, Ling C. Age influences DNA methylation and gene expression of COX7A1 in human skeletal muscle. Diabetologia. 2008;51:1159–1168. doi: 10.1007/s00125-008-1018-8. [DOI] [PubMed] [Google Scholar]
- 22.Chen L, Xin ZC, Li X, Tian L, Yuan YM, Liu G, Jiang XJ, Guo YL. Cox7a2 mediates steroidogenesis in TM3 mouse Leydig cells. Asian J Androl. 2006;8:589–594. doi: 10.1111/j.1745-7262.2006.00178.x. [DOI] [PubMed] [Google Scholar]
- 23.Ryan HE, Poloni M, McNulty W, Elson D, Gassmann M, Arbeit JM, Johnson RS. Hypoxia-inducible factor-1α is a positive factor in solid tumor growth. Cancer Res. 2000;60:4010–4015. [PubMed] [Google Scholar]
- 24.Saini Y, Harkema JR, LaPres JJ. HIF1α is essential for normal intrauterine differentiation of alveolar epithelium and surfactant production in the newborn lung of mice. J Biol Chem. 2008;283:33650–33657. doi: 10.1074/jbc.M805927200. [DOI] [PMC free article] [PubMed] [Google Scholar]
- 25.Lowry OH, Rosebrough NJ, Farr AL, Randall RJ. Protein measurement with the Folin phenol reagent. J Biol Chem. 1951;193:265–275. [PubMed] [Google Scholar]
- 26.Yang TT, Hsu CT, Kuo YM. Cell-derived soluble oligomers of human amyloid-β peptides disturb cellular homeostasis and induce apoptosis in primary hippocampal neurons. J Neural Transm. 2009;116:1561–1569. doi: 10.1007/s00702-009-0311-0. [DOI] [PubMed] [Google Scholar]
- 27.de Hoon MJ, Imoto S, Nolan J, Miyano S. Open source clustering software. Bioinformatics. 2004;20:1453–1454. doi: 10.1093/bioinformatics/bth078. [DOI] [PubMed] [Google Scholar]
- 28.Capaldi RA, Marusich MF, Taanman JW. Mammalian cytochrome-c oxidase: Characterization of enzyme and immunological detection of subunits in tissue extracts and whole cells. Methods Enzymol. 1995;260:117–132. doi: 10.1016/0076-6879(95)60134-1. [DOI] [PubMed] [Google Scholar]
- 29.Thompson DA, Ferguson-Miller S. Lipid and subunit III depleted cytochrome c oxidase purified by horse cytochrome c affinity chromatography in lauryl maltoside. Biochemistry. 1983;22:3178–3187. doi: 10.1021/bi00282a022. [DOI] [PubMed] [Google Scholar]
- 30.Naciri M, Kuystermans D, Al-Rubeai M. Monitoring pH and dissolved oxygen in mammalian cell culture using optical sensors. Cytotechnology. 2008;57:245–250. doi: 10.1007/s10616-008-9160-1. [DOI] [PMC free article] [PubMed] [Google Scholar]
- 31.Althoff T, Mills DJ, Popot J, Kuhlbrandt W. Arrangement of electron transport chain components in bovine mitochondrial supercomplex I1III2IV1. EMBO J. 2011;30:4652–4664. doi: 10.1038/emboj.2011.324. [DOI] [PMC free article] [PubMed] [Google Scholar]
- 32.Tsukihara T, Aoyama H, Yamashita E, Tomizaki T, Yamaguchi H, Shinzawa-Itoh K, Nakashima R, Yaono R, Yoshikawa S. The whole structure of the 13-subunit oxidized cytochrome c oxidase at 2.8 Å. Science. 1996;272:1136–1144. doi: 10.1126/science.272.5265.1136. [DOI] [PubMed] [Google Scholar]
- 33.Cui TZ, Conte A, Fox JL, Zara V, Winge DR. Modulation of the respiratory supercomplexes in yeast: Enhanced formation of cytochrome oxidase increases the stability and abundance of respiratory supercomplexes. J Biol Chem. 2014;289:6133–6141. doi: 10.1074/jbc.M113.523688. [DOI] [PMC free article] [PubMed] [Google Scholar]
- 34.Huttemann M, Klewer S, Lee I, Pecinova A, Pecina P, Liu J, Lee M, Doan JW, Larson D, Slack E, Maghsoodi B, Erickson RP, Grossman LI. Mice deleted for heart-type cytochrome c oxidase subunit 7a1 develop dilated cardiomyopathy. Mitochondrion. 2012;12:294–304. doi: 10.1016/j.mito.2011.11.002. [DOI] [PMC free article] [PubMed] [Google Scholar]
- 35.Rodriguez-Enriquez S, Juarez O, Rodriguez-Zavala JS, Moreno-Sanchez R. Multisite control of the Crabtree effect in ascites hepatoma cells. Eur J Biochem. 2001;268:2512–2519. doi: 10.1046/j.1432-1327.2001.02140.x. [DOI] [PubMed] [Google Scholar]
- 36.Rossignol R, Gilkerson R, Aggeler R, Yamagata K, Remington SJ, Capaldi RA. Energy substrate modulates mitochondrial structure and oxidative capacity in cancer cells. Cancer Res. 2004;64:985–993. doi: 10.1158/0008-5472.can-03-1101. [DOI] [PubMed] [Google Scholar]
- 37.Aguer C, Gambarotta D, Mailloux RJ, Moffat C, Dent R, McPherson R, Harper ME. Galactose enhances oxidative metabolism and reveals mitochondrial dysfunction in human primary muscle cells. PLoS One. 2011;6:e28536. doi: 10.1371/journal.pone.0028536. [DOI] [PMC free article] [PubMed] [Google Scholar]
- 38.Forgacs AL, Burgoon LD, Lynn SG, LaPres JJ, Zacharewski T. Effects of TCDD on the expression of nuclear encoded mitochondrial genes. Toxicol Appl Pharmacol. 2010;246:58–65. doi: 10.1016/j.taap.2010.04.006. [DOI] [PMC free article] [PubMed] [Google Scholar]
- 39.Pulliam DA, Deepa SS, Liu Y, Hill S, Lin AL, Bhattacharya A, Shi Y, Sloane L, Viscomi C, Zeviani M, Van Remmen H. Complex IV-deficient Surf1(−/−) mice initiate mitochondrial stress responses. Biochem J. 2014;462:359–371. doi: 10.1042/BJ20140291. [DOI] [PMC free article] [PubMed] [Google Scholar]
- 40.Oelkrug R, Goetze N, Meyer CW, Jastroch M. Antioxidant properties of UCP1 are evolutionarily conserved in mammals and buffer mitochondrial reactive oxygen species. Free Radical Biol Med. 2014;77:210–216. doi: 10.1016/j.freeradbiomed.2014.09.004. [DOI] [PubMed] [Google Scholar]
- 41.Chandel NS. Mitochondrial regulation of oxygen sensing. Adv Exp Med Biol. 2010;661:339–354. doi: 10.1007/978-1-60761-500-2_22. [DOI] [PubMed] [Google Scholar]
- 42.Chua YL, Dufour E, Dassa EP, Rustin P, Jacobs HT, Taylor CT, Hagen T. Stabilization of hypoxia-inducible factor-1α protein in hypoxia occurs independently of mitochondrial reactive oxygen species production. J Biol Chem. 2010;285:31277–31284. doi: 10.1074/jbc.M110.158485. [DOI] [PMC free article] [PubMed] [Google Scholar]
- 43.Papandreou I, Cairns RA, Fontana L, Lim AL, Denko NC. HIF-1 mediates adaptation to hypoxia by actively downregulating mitochondrial oxygen consumption. Cell Metab. 2006;3:187–197. doi: 10.1016/j.cmet.2006.01.012. [DOI] [PubMed] [Google Scholar]
- 44.Aras S, Pak O, Sommer N, Finley R, Jr, Huttemann M, Weissmann N, Grossman LI. Oxygen-dependent expression of cytochrome c oxidase subunit 4-2 gene expression is mediated by transcription factors RBPJ, CXXC5 and CHCHD2. Nucleic Acids Res. 2013;41:2255–2266. doi: 10.1093/nar/gks1454. [DOI] [PMC free article] [PubMed] [Google Scholar]
- 45.Seelan RS, Gopalakrishnan L, Scarpulla RC, Grossman LI. Cytochrome c oxidase subunit VIIa liver isoform. Characterization and identification of promoter elements in the bovine gene. J Biol Chem. 1996;271:2112–2120. doi: 10.1074/jbc.271.4.2112. [DOI] [PubMed] [Google Scholar]
- 46.Lee I, Huttemann M, Liu J, Grossman LI, Malek MH. Deletion of heart-type cytochrome c oxidase subunit 7a1 impairs skeletal muscle angiogenesis and oxidative phosphorylation. J Physiol. 2012;590:5231–5243. doi: 10.1113/jphysiol.2012.239707. [DOI] [PMC free article] [PubMed] [Google Scholar]
- 47.Chen Q, Vazquez EJ, Moghaddas S, Hoppel CL, Lesnefsky EJ. Production of reactive oxygen species by mitochondria: Central role of complex III. J Biol Chem. 2003;278:36027–36031. doi: 10.1074/jbc.M304854200. [DOI] [PubMed] [Google Scholar]
Associated Data
This section collects any data citations, data availability statements, or supplementary materials included in this article.