Abstract
OBJECTIVE
As the leading risk factor for the development of liver cancer, chronic infection with hepatitis B virus (HBV) represents a significant global health concern. Although an effective HBV vaccine exists, at least 240 million people are chronically infected with HBV worldwide. Therapeutic options for the treatment of chronic HBV remain limited, and none achieve an absolute cure. To develop novel therapeutic targets, a better understanding of the complex network of virus-host interactions is needed. Because of the central metabolic role of the liver, we assessed the metabolic impact of HBV infection as a means to identify viral dependency factors and metabolic pathways that could serve as novel points of therapeutic intervention.
METHODS
Primary rat hepatocytes were infected with a control adenovirus, an adenovirus expressing a greater-than-unit-length copy of the HBV genome, or an adenovirus expressing the HBV × protein (HBx). A panel of 369 metabolites was analyzed for HBV- or HBx-induced changes 24 and 48 hours post infection. Pathway analysis was used to identify key metabolic pathways altered in the presence of HBV or HBx expression, and these findings were further supported through integration of publically available gene expression data.
RESULTS
We observed distinct changes to multiple metabolites in the context of HBV replication or HBx expression. Interestingly, a panel of 7 metabolites (maltotriose, maltose, myristate [14:0], arachidate [20:0], 3-hydroxybutyrate [BHBA], myo-inositol, and 2-palmitoylglycerol [16:0]) were altered by both HBV and HBx at both time points. In addition, incorporation of data from a transcriptome-based dataset allowed us to identify metabolic pathways, including long chain fatty acid metabolism, glycolysis, and glycogen metabolism, that were significantly altered by HBV and HBx.
CONCLUSIONS
Because the liver is a central regulator of metabolic processes, it is important to understand how HBV replication and HBV protein expression affects the metabolic function of hepatocytes. Through analysis of a broad panel of metabolites we investigated this metabolic impact. The results of these studies have defined metabolic consequences of an HBV infection of hepatocytes and will help to lay the groundwork for novel research directions and, potentially, development of novel anti-HBV therapeutics.
1. INTRODUCTION
Hepatocellular carcinoma (HCC) remains one of the leading causes of cancer related death, with an estimated 600,000 yearly deaths and an incidence to mortality ratio near 1 [1]. Chronic infection with the hepatitis B virus (HBV) represents the greatest global risk factor for the development of HCC, despite the availability of an effective HBV vaccine [2]. Estimates suggest that a minimum of 240 million people are chronically infected with HBV worldwide [3, 4]. The ongoing risk for the development of HBV-associated liver cancer can at least partially be attributed to a lack of effective treatments for chronic HBV infection, which continues to drive the search for novel therapeutics. Because the majority of current anti-HBV therapeutics target a single viral factor, the reverse transcriptase function of the viral polymerase, novel therapeutics will ideally target aspects of the viral life cycle outside of the function of the polymerase; however, to achieve this goal a better understanding of the complex network of host-virus interactions is needed.
Because of the central metabolic role of the liver, understanding the metabolic impact of HBV in hepatocytes, the primary cell of the liver and target of HBV infection, as well as the metabolic impact of expression of the HBV × protein (HBx), the only regulatory protein encoded in the HBV genome, could significantly aid in our overall understanding of HBV. Recently, the role of HBV in metabolism has been brought to the forefront due to the discovery of a major bile salt transporter, human sodium taurocholate co-transporting polypeptide (hNTCP), as a functional receptor for HBV [5]. Additional research demonstrated that binding of HBV interferes with the normal function of hNTCP, suggesting that by binding to hNTCP, HBV could dramatically alter hepatic bile acid uptake and liver metabolic function [6]. In addition, HBV infection of mice with humanized livers showed alteration of multiple metabolic pathways and factors [7]. Along with the growing body of research into the relationship between HBV and metabolic pathways, such as Akt signaling [8] and gluconeogenesis [9, 10], it is clear that HBV likely alters the metabolic landscape of an infected hepatocyte.
In this study, we utilize an “-omics”-based approach to establish a profile of the HBV-mediated alterations to the primary hepatocyte metabolome. Using this metabolic profile, we are able to identify specific cellular pathways affected by HBV and predict potential cellular targets of HBV-mediated perturbation. These predictions are supported by the incorporation of corresponding global transcriptomic data to broaden our overall analysis of pathways altered in the context of HBV replication and HBx expression. Together, this approach allows us to better understand the metabolic impact of an HBV infection, which could ultimately help to guide the development of novel therapeutic strategies.
2. MATERIALS AND METHODS
2.1 Animal studies
Surgery and isolation of hepatocytes from rats were approved by the Institutional Animal Care and Use Committee of the Drexel University College of Medicine (Protocol # 20057) and complied with the Animal Welfare Act, the Public Health Service Policy on Humane Care and Use of Laboratory Animals, and the NIH Guide for the Care and Use of Laboratory Animals (2011).
2.2 Isolation and maintenance of cultured primary rat hepatocytes
Primary rat hepatocytes (PRHs) were isolated from 5–7 week-old male Sprague-Dawley rats following a two-step perfusion protocol and maintained as previously described [11, 12].
2.3 Recombinant adenovirus infections
The construction of the recombinant adenoviruses, containing either hrGFP alone (AdGFP), hrGFP and a greater than unit length copy of the HBV genotype D/serotype ayw genome (AdHBV), or hrGFP and the HBx coding sequence under the control of the CMV promotor (AdHBx), has been described previously [13]. The infection protocol, along with detailed descriptions of determination of the amount of virus to use for infection, has also previously been described [12–14].
For these studies, approximately 3.5 × 10⁶ cells were plated per sample in a 6 cm plate coated with rat tail collagen (150–200µg/ml). PRHs were infected with AdHBV, AdHBx, or AdGFP 24 hr after plating in 150 µl total volume at a relative M.O.I. of approximately 0.01, based on titer values determined in Ad293 cells, and allowed to incubate for 1 hr with rocking every 15 mins. After infection, 3ml of culture medium was added to the cells, and cells were incubated overnight at 37°C with 5% C02. Medium was changed daily and infection efficiency was monitored by GFP expression.
2.4 Analysis of HBV replication
The analysis of HBV replication by Southern blot for HBV core particle-associated DNA has been described previously [15]. In addition, expression of HBV core protein was analyzed by western blot using a monoclonal anti-HBcAg (core protein) antibody (Dako, Carpinteria, CA). Monoclonal anti-β-actin (Sigma-Aldrich, St. Louis, MO), was used to detect equal loading. Primary antibodies were detected using an infrared-dye conjugated anti-mouse secondary antibody with an Odyssey infrared detection system (LiCor, Lincoln, NE).
2.5 Metabolomic Profiling
To establish HBV-mediated changes to primary hepatocyte metabolite profiles, PRHs were infected with AdGFP, AdHBV, or AdHBx 24 hr after plating. Quadruplicate samples were generated for each treatment type, and the experiment was duplicated from an independent rat liver, for a total of 8 samples per treatment type. Based on the MS platform used for these studies, this sample setup gave the statistical power needed to reliably identify significant 2-fold changes across the dataset, while also accounting for rat-to-rat variability. Cells were collected 48 hr after plating (24 hr after infection) or 72 hr after plating (48 hr after infection). Metabolon, Inc. (Durham, NC) performed processing, QC, and metabolomic profiling across a panel of 369 known biochemicals using ultra-performance liquid chromatography (UPLC)/mass spectrometry/mass spectrometry (UPLC-MS/MS). The pipeline for sample preparation, fractionation, and detection has been previously described [16, 17]. After raw-data collection, peak identification and QC processing were done using Metabolon’s in-house proprietary analysis software. Significant differences in metabolite levels were determined by ANOVA with a p-value ≤ 0.05. Pathway analysis, based on metabolite network centrality and over-representation, was done using MetaboAnalyst 3.0 [18],
Additional data analysis and visualization was completed using Bioconductor packages for R (v3.2.3, "Wooden Christmas-Tree") [19], including the Weighted Correlation Network Analysis package (WGCNA, v1.51) [20] and ggplot2 (v2.1.0) [21]. Venn diagrams were generated using the Venny tool [22].
2.6 Transcriptomic Profiling
Gene expression data was incorporated from a previously published dataset [12]. This transcriptome analysis was done on AdGFP- or AdHBV-infected cultured primary rat hepatocytes collected at 24 and 48 hrs post-infection, following the infection protocol described above. RNA-seq data from these studies is available as a GEO SuperSeries (GSE68113).
3. RESULTS
3.1 Recombinant adenovirus infection of primary rat hepatocytes
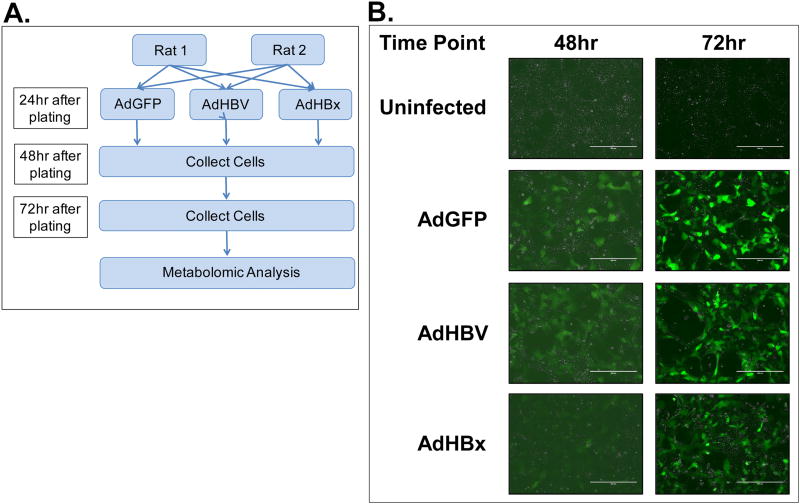
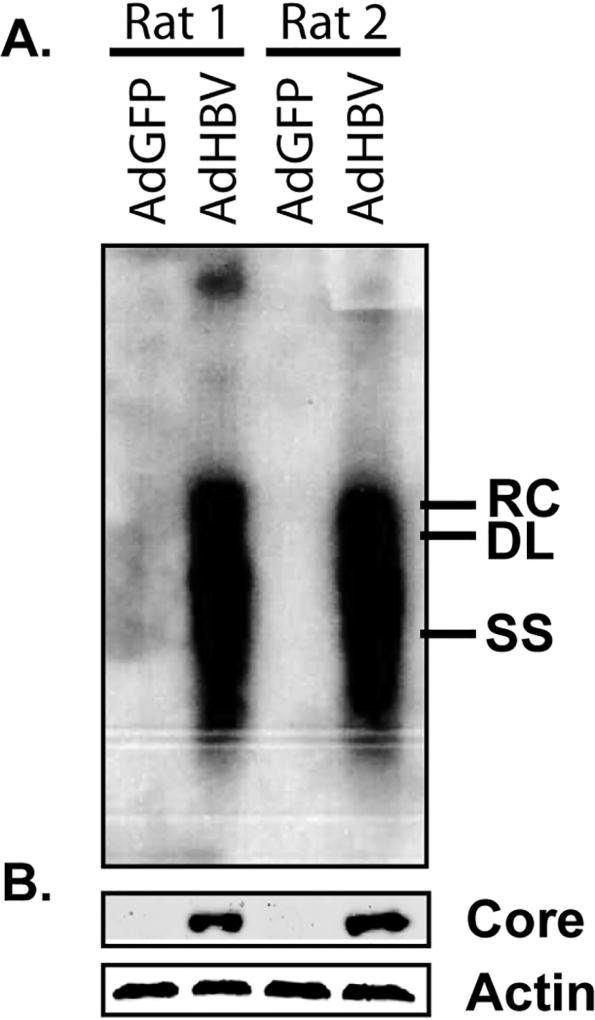
In this metabolome analysis, primary rat hepatocytes from two individual rats were infected with AdGFP, AdHBV, or AdHBx 24 hrs after plating (Fig. 1A). Infection efficiency was monitored by expression of GFP across all samples, with GFP expression detectable at 48 hrs (24 hrs post-infection), and a dramatic increase of GFP expression at 72 hrs (48 hrs post-infection) (Fig. 1B). HBV replication was confirmed by Southern blot for core protein-associated DNA. Importantly, high levels of HBV replication could be detected by Southern blot at 72 hrs (48 hr after infection) in each replicate set of AdHBV-infected hepatocytes (Fig. 2A). Additionally, western blot analysis of HBV core protein showed clear expression in AdHBV-infected cells, but not AdGFP-infected cells (Fig. 2B).
Fig 1. Confirmation of experimental system.
A. Experimental setup for primary dataset. B. PRHs were infected with either AdGFP or AdHBV, or AdHBx and infection efficiency was determined by monitoring GFP expression at 48 hr and 72 hr (24 hr and 48 hr post-infection).
Fig 2. Confirmation of HBV replication.
HBV replication was monitored by Southern blot analysis of HBV core particle-associated DNA (A) and western blot for HBV core protein (B). For western blot analysis, β–actin was used as a protein loading control. Samples were collected at 72 hr (48 hr after infection). RC – relaxed circular DNA, DL – double-stranded linear DNA, SS – single stranded DNA.
3.2 Overview of Metabolomic Profiling Study
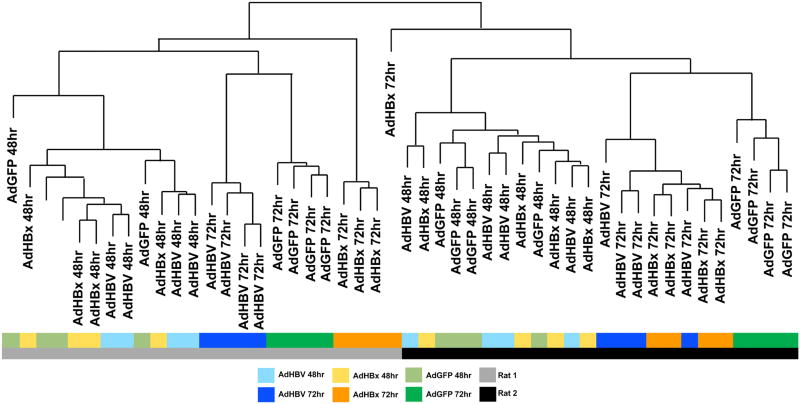
An unbiased analysis of overall sample similarity following metabolomics profiling showed a hierarchy of variables influencing the clustering of the data, such that the two replicate rats represented the primary variable, with individual time points as the secondary component, and treatment type (AdGFP, AdHBV, AdHBx) as the tertiary component (Fig. 3). Although treatment-based segregation of the samples was less evident at 24 hrs after infection, when GFP expression was significantly lower, the samples were distinctly stratified by treatment-type at 48 hrs after infection when both GFP expression (Fig. 1B) and HBV replication (Fig. 2) were clearly evident.
Fig 3. Unbiased sample clustering supports treatment-type distribution.
Hierarchical clustering was done to determine overall sample similarity. Sample grouping and shorter branches indicates greater sample similarity. Samples are color coded beneath the dendrogram to emphasize factors contributing to sample distribution (rat, time, treatment-type).
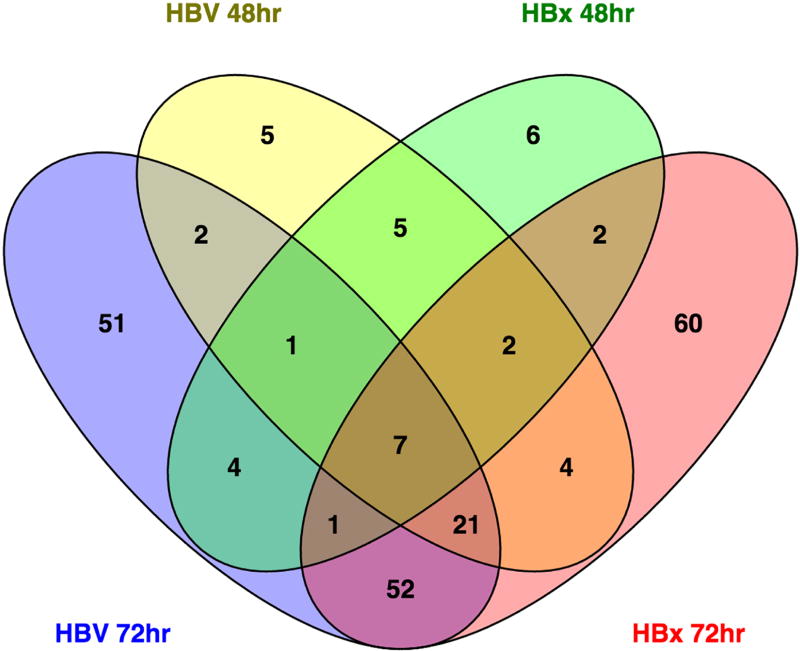
While the analysis of sample similarity suggests that additional confounding factors exist (i.e. rat, time), significant differences are identifiable between control and HBV- or HBx-expressing primary rat hepatocytes. Specifically, at 48 hrs, 47 metabolites were significantly different (p ≤ 0.05) between HBV-expressing and control primary rat hepatocytes with 15 approaching significance (0.05 ≤ p ≤ 0.10). Similarly, HBx-expressing primary rat hepatocytes had 28 metabolites significantly altered compared to control, with another 23 nearly significant. While HBV expression increased the majority of the altered metabolites, HBx expression alone decreased 38 metabolites while increasing only 13. Of the significantly altered metabolites at 48 hrs, 15 were altered in both HBV- and HBx-expressing primary rat hepatocytes (Fig. 4). At 72 hrs, HBV significantly altered 139 metabolites, with an extra 43 nearing significance. Interestingly, of the 47 metabolites altered by HBV at 48 hrs, 31 were also altered by HBV at 72 hrs (Fig. 4). For HBx-expressing primary rat hepatocytes, 149 metabolites had significant changes, plus an additional 35 that were nearly significant at 72 hrs. Only 12 metabolites were altered in the context of HBx expression at both time points, and 81 were in common between HBV-expressing and HBx-expressing cells at 72 hr. Overall, only 7 metabolites (maltotriose, maltose, myristate [14:0], arachidate [20:0], 3-hydroxybutyrate [BHBA], myo-inositol, 2-palmitoylglycerol [16:0]) were significantly altered by both HBV and HBx at both time points (Fig. 4).
Fig 4. Total metabolite alterations across experimental groups.
A Venn diagram was used to visualize all metabolites significantly altered in AdHBV- and AdHBx-infected PRHs compared to AdGFP-infected PRHs at the corresponding time points. The center value, 7 metabolites, represents the number of metabolites that are significantly altered in all 4 comparisons.
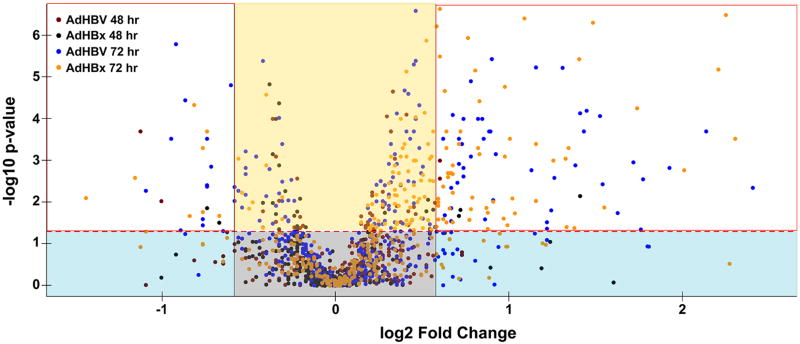
In a broader investigation of altered metabolite expression across both time and treatment type, only 242 (~7%) metabolites had a ≥ 2-fold change up or down, despite the fact that 1,028 (31%) were statistically significantly altered. This could be the result of the short timeframe of the studies, or reflect broader implications of the moderate changes induced by HBV. In fact, when this distribution is broken down further, 145 of these ≥ 2-fold changes (60%) are within the time-mediated comparisons (i.e. HBV 48 hrs vs HBV 72 hrs, etc.), despite these comparisons making up only a third of the total dataset. HBV-mediated changes account for 29 of the ≥ 2-fold changes (12%), and HBx-mediated changes account for 34 of the ≥ 2-fold changes (14%), with HBV- to HBx-expressing cells making up the remaining comparisons. This means, as suggested by the sample dendrogram (Fig. 3), that HBV- and HBx-mediated changes are identifiable, but occur on a smaller scale than those seen in time-mediated comparisons. Unfortunately, these limitations are a consequence of the ex vivo primary hepatocyte model, as both human and rat primary hepatocytes typically do not survive beyond 72 to 96 hrs in culture without significant intervention that would alter the physiological relevance of the system, limiting our ability to extend the duration of our studies. Despite this, significant changes to individual metabolites remain identifiable (Fig. 5).
Fig 5. HBV induces low magnitude, but significant metabolic changes.
A volcano plot was used to depict the fold change (x-axis) of all metabolites between AdHBV- or AdHBx-infected and AdGFP-infected PRHs compared to the corresponding statistical significance of the alteration (y-axis). The horizontal, red dashed line corresponds with the threshold for significance (p < 0.05), with fold changes above the line being statistically significant and those below the line having a p-value > 0.05. Metabolites within the grey box have a low fold change that is not significant, and are considered unchanged. Metabolites in the blue boxes have higher fold changes but are considered not significant. Metabolites in the yellow box have significant, but low magnitude fold changes. The metabolites in the white boxes represent those exhibiting a statistically significant change ≥ 1.5 fold.
3.3 Pathway analysis of altered metabolites
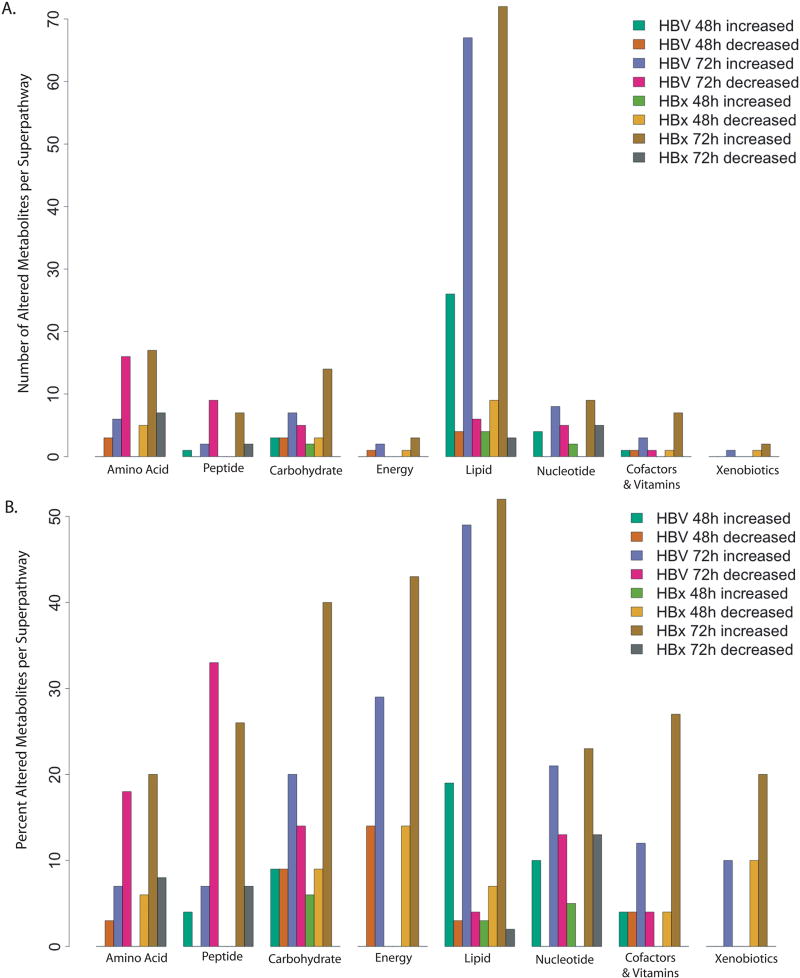
Because metabolism is the result of a cascade of biochemical reactions, analysis of individual metabolites only offers limited information. Instead, pathway analysis of metabolites can generate a clearer picture of the impact of HBV on hepatocyte physiology through disruption of specific metabolic pathways. Within the metabolome analysis, metabolites were grouped by super-pathway and sub-pathway based on Kyoto Encyclopedia of Genes and Genomes (KEGG) identifiers. These groupings consisted of 8 super-pathways (amino acid, peptide, carbohydrate, energy, lipid, nucleotide, cofactors and vitamins, and xenobiotics), with between 2 (peptide and energy) and 28 (lipid) sub-pathways (Fig. 6). Each sub-pathway was made up of between 1 and 31 metabolites, with the large majority (85%) containing less than 10.
Fig 6. Metabolite alteration across metabolic super-pathways.
The total number (A) and percent (B) of metabolites increased and decreased in each metabolic super-pathway is indicated for each experimental comparison. HBV = AdHBV-infected compared to AdGFP-infected PRHs, HBx = AdHBx-infected compared to AdGFP-infected PRHs.
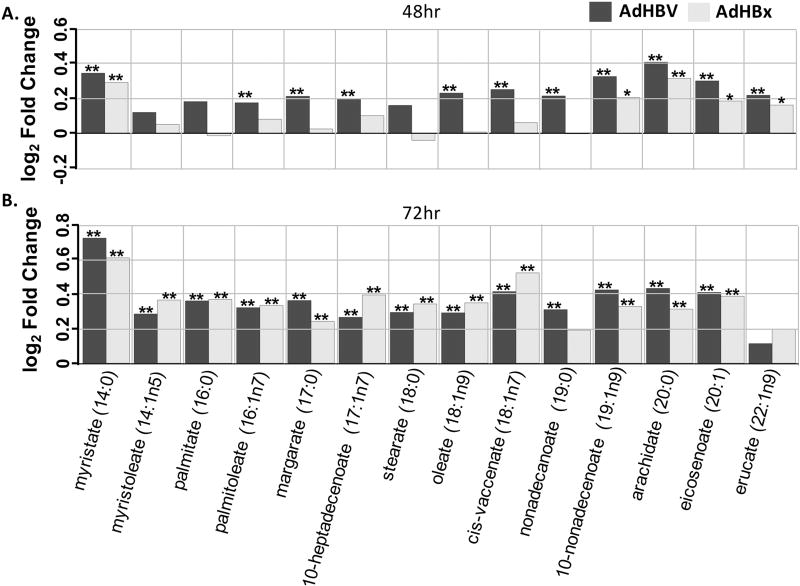
When examining the KEGG designation associated with altered metabolites, obvious patterns emerge (Fig. 6). For example, the lipid super-pathway, which makes up 38% of all metabolites in the analysis, had obvious HBV- and HBx-mediated alterations across multiple sub-pathways. At 48 hrs, 26 lipid-related, significantly altered metabolites were increased in HBV-expressing PRHs, while 4 were decreased; at 72 hrs 68 were increased and 6 were decreased. Specifically, of the 14 metabolites in the long chain fatty acid sub-pathway, only 3 were not significantly altered by HBV at 48 hrs, and all three of these were altered at 72 hrs. Interestingly, HBx-expressing primary rat hepatocytes had only one metabolite in the long chain fatty acid sub-pathway, myristate, which was significantly altered at 48 hrs. By 72 hrs all but 2 of the 14 metabolites were significantly altered (Fig. 7). Similarly, the polyunsaturated fat sub-pathway, which contains 12 metabolites, had 9 metabolites significantly altered in HBV-expressing cells at 48 hrs and 7 at 72 hrs, with all altered metabolites increased. Similar to the effects seen in the long chain fatty acid sub-pathway, HBx also demonstrated delayed metabolite regulation in the polyunsaturated fat sub-pathway compared to HBV-expressing cells, with 0 significant alterations at 48 hrs, but 9 out of 12 altered at 72 hrs.
Fig 7. Metabolite changes in the long chain fatty acid sub-pathway.
A. Fold changes for indicated metabolites within the long chain fatty acid sub-pathway when comparing AdHBV-infected (black bars) or AdHBx-infected (grey bars) PRHs to AdGFP-infected PRHs at 48 hrs are shown. Significance of the difference of the mean metabolite levels between groups, determined by ANOVA, is indicated above the bar (p ≤ 0.05 = **) along with values approaching significance (0.05 ≤ p ≤ 0.01 = *). B. Data presented as in A., but for the 72 hr time point.
Other sub-pathways within the lipid super-pathway were also altered, including the largest sub-pathway in the dataset, phospholipid metabolism. Interestingly, within this sub-pathway only minimal regulation was seen at 48 hr. HBV-expressing PRHs had only 2 out of 31 metabolites increased, while HBx-expressing cells had 3 decreased metabolites. At 72 hr, however, HBV-expressing PRHs had 11 significantly increased and 2 significantly decreased metabolites. For HBx, biochemical alteration was even more dramatic, with 23 of 31 metabolites involved in phospholipid metabolism increased at 72 hrs. Similarly, the sphingolipid pathway, another important sub-pathway involved in lipid signaling, is also altered in both HBV- and HBx-expressing cells. Similar to phospholipid metabolism, this pathway seems to be altered more at 72 hrs, with only limited alteration at 48 hrs.
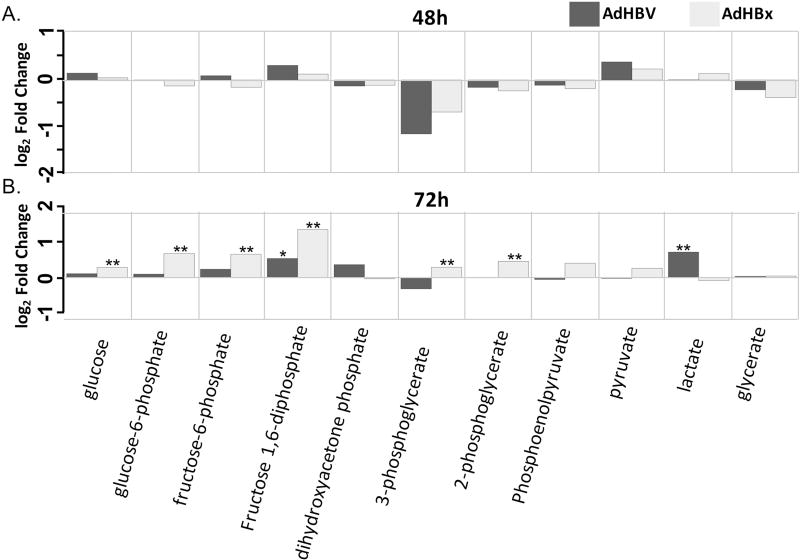
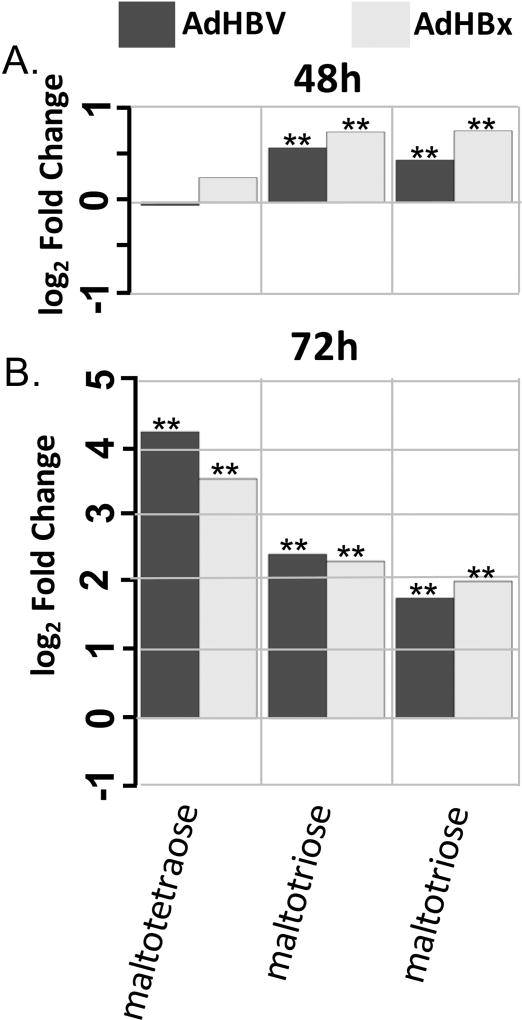
While the lipid super-pathway contains the most sub-pathways and metabolites within our dataset, and therefore the most opportunity for analysis, other pathways also showed interesting treatment-mediated regulation. In particular, the carbohydrate super-pathway contained multiple sub-pathways with HBV- or HBx-mediated metabolite regulation. For example, HBx-expressing cells showed an increase in 6 out of 11 glycolysis intermediates at 72 hrs, including glucose, glucose-6-phosphate, and frucose-6-phosphate (Fig. 8). HBx-expressing cells also demonstrated increased intermediates of the pentose phosphate pathway (PPP) at 72 hrs, and both HBV-expressing and HBx-expressing cells exhibited increased glycogen metabolism at both 48 hrs and 72 hrs (Fig. 9), with the fold changes at 72 hrs among the largest changes in the metabolic analysis.
Fig 8. Metabolite changes in the glycolysis sub-pathway.
A. Fold changes for indicated metabolites within the glycolysis sub-pathway when comparing AdHBV-infected (black bars) or AdHBx-infected (grey bars) PRHs to AdGFP-infected PRHs at 48 hrs are shown. Significance of the difference of the mean metabolite levels between groups, determined by ANOVA, is indicated above the bar (p ≤ 0.05 = **) along with values approaching significance (0.05 ≤ p ≤ 0.01 = *). B. Data presented as in A., but for the 72 hr time point.
Fig 9. Metabolite changes in the glycogen metabolism pathway.
A. Fold changes for indicated metabolites within the glycogen metabolism pathway when comparing AdHBV-infected (black bars) or AdHBx-infected (grey bars) PRHs to AdGFP-infected PRHs at 48 hrs are shown. Significance of the difference of the mean metabolite levels between groups, determined by ANOVA, is indicated above the bar (p ≤ 0.05 = **) along with values approaching significance (0.05 ≤ p ≤ 0.01 = *). B. Data presented as in A., but for the 72 hr time point.
To further support these pathway observations, a pathway analysis of all altered metabolites in a given comparison was done based on metabolite network centrality and over-representation. Using MetaboAnalyst 3.0 [18], we were able to investigate metabolic pathways that should be affected by the HBV- or HBx-mediated alteration of metabolites by considering all of the potential pathways a metabolite may be involved in, giving a more detailed biological context for these changes. Using this approach, we identified a number of pathways that are significantly altered in HBV- or HBx-expressing hepatocytes. Interestingly, in support of the significant alteration of the lipid super-pathway, multiple pathways involving fatty acid metabolism were altered across multiple comparisons. For example, the biosynthesis of unsaturated fatty acids pathway was altered by both HBV and HBx at both time points, and was the most significantly altered pathway at all time points except for the comparison of AdHBx-expressing primary rat hepatocytes to AdGFP-expressing primary rat hepatocytes at 48 hrs, when minimal changes were seen across the metabolome. As expected, the broader fatty acid biosynthesis pathway was also altered across all 4 comparisons, and the fatty acid metabolism pathway was altered in both 72 hr comparisons. Glycerophospholipid metabolism was also one of the most altered pathways across all comparisons except for the HBV comparison at 48 hrs, further supporting the previously described analysis. Beyond lipid metabolism, a number of amino acid metabolism pathways were altered, the glycolysis/gluconeogenesis pathway was altered across all 4 comparisons, and the sucrose/starch metabolism pathway was altered in both 72 hr comparisons. These pathways suggest an HBV-mediated alteration of energetic pathways, as was suggested in the previous analyses. Together, the results of this pathway analysis support the broader interpretation of the impact of HBV and HBx on the PRH metabolome.
3.4 Integration of Metabolomic and Transcriptomic data
Although this metabolomic analysis allows an informative view of a large panel of metabolites, the complicated nature of cellular metabolic processes means that further interpretation of this dataset would be required before strong conclusions can be drawn. In particular, analyzing the levels of enzymes associated with the generation of these factors could give an idea of how pathways identified as altered within the metabolome study are being regulated. Because of this, we utilized a previously described transcriptome dataset from AdHBV-infected primary rat hepatocytes to attempt to correlate changes in the levels of metabolites to changes in the levels of associated genes; however, since the transcriptome dataset contains significantly more genes than metabolites in this metabolic dataset, a direct bioinformatic-based pathway analysis of the combined dataset would be heavily skewed towards gene-mediated pathway alterations, which has previously been described [12]. We instead chose to use the transcriptome data as a tool to support our observations within the metabolome dataset.
The initial step in associating these two datasets was to look for pathways regulated by HBV in both analyses. Because the gene ontology pathway analysis also utilizes KEGG identifiers to organize genes into pathways, it should be possible to identify common pathways altered by HBV in both datasets. For example, one of the pathways with the highest HBV-mediated perturbation at 72 hrs when looking at gene expression was the glycolysis/gluconeogenesis pathway. At 48 hrs, however, this pathway was not identified as statistically significantly altered. Similarly, the metabolome dataset only identified alterations to the glycolysis/gluconeogenesis sub-pathway at 72 hrs, with minimal alterations at 48 hrs. Although we are limited to metabolites that were examined within the assay, when we examine the genes associated with the specific metabolic reactions, we see a similar correlation. For example, the third step of glycolysis involves the conversion of fructose-6-phosphate to fructose 1,6-bisphosphate by the enzyme phosphofructokinase (PFK). Both of these metabolites are increased in HBx-expressing cells at 72 hrs and trending towards a significant increase in HBV-expressing cells. Importantly, the gene encoding the liver-specific subunit of phosphofructokinase is increased in HBV-expressing cells at 72 hrs in the transcriptome analysis.
Similarly, the metabolome data also suggested increased use of the pentose phosphate pathway by HBx-expressing cells at 72 hr. The oxidative phase of the pentose phosphate pathway involves the conversion of glucose-6-phosphate to ribose 5-phosphate. Both of these metabolites are increased by HBx-expressing cells at 72 hrs. The initial enzyme in this cascade, glucose-6-phosphate dehydrogenase (G6PD), is also upregulated at 72 hrs in the transcriptome data and was recently shown to be upregulated in an HBx-dependent manner in HBV-positive human liver samples, HBV-associated HCC, and HBV- or HBx-expressing cell lines [23]. While not statistically significant, there is also a trend towards overall perturbation of the pentose phosphate pathway in the transcriptome dataset as well, with a p-value at 72 hrs of 0.06.
Another pathway identified as perturbed in the transcriptome analysis was glutathione metabolism, which was significantly altered at 72 hrs. Multiple points in the glutathione metabolic pathway were directly altered due to HBV-mediated dysregulation of genes, including G6PD and multiple gamma-glutamyltransferases. Similarly, the metabolome results suggested alteration of the glutathione metabolism sub-pathway at 72 hrs, with 8 of the associated metabolites altered in HBV-expressing primary rat hepatocytes and 6 altered in HBx-expressing primary rat hepatocytes.
Analysis of the lipid super-family shows similar correlations between the metabolome and the transcriptome analyses. Specifically, the PI3K/Akt pathway was one of only 6 pathways perturbed at both time points in the transcriptome analysis, which correlates with the alteration at 72 hrs of the phospholipid metabolism sub-pathway in the metabolome analysis. Another example of lipid regulation is the HBV-mediated increase in myristate, the substrate for protein myristoylation. This correlates well with increased expression of N-myristoyltransferase, the enzyme responsible for transferring the myristoyl group to the glycine residues of targeted proteins.
The observed increase in the pool of free fatty acids in HBV- and HBx-expressing primary rat hepatocytes could be the result of alterations in multiple pathways. For example, it could be caused by decreased β-oxidation, which is supported by a significant decrease in enzymes associated with β-oxidation in the transcriptome analysis. This includes the HBV-mediated downregulation at 72 hrs of CPT1a, the gene encoding the liver isoform of carnitine acyltransferase, as well as decreased levels of the genes encoding the subunits of enoyl-CoA hydratase; these each represent integral parts of the fatty acid oxidation pathway. Concurrently, the increased pool of free fatty acids could be influenced by increased lipogenesis, which is supported by the significant increase in the expression of sterol regulatory element binding protein 1 (SREBP1) in HBV-expressing primary rat hepatocytes in the transcriptome analysis. Fatty acid synthase, and its fatty acid product palmitate, are also increased by HBV in the transcriptome and metabolome, respectively. Another possible contributor to the increased fatty acid pool is increased lipolysis, which correlates with increased HBV-mediated expression of G0S2, which encodes a multifunctional protein involved in regulating the breakdown of fat [24].
Together, the metabolome and transcriptome datasets synergistically support the hypothesis that HBV mediates metabolic changes in a hepatocyte, likely to optimize the cellular environment for its own replication. The vital role of the liver in metabolic pathways means that understanding the effect of HBV on these pathways could be an important step towards understanding HBV-associated disease. By analyzing the impact of HBV in a metabolome-wide perspective, we can generate an overview of the complex network of biochemical changes induced in an HBV-infected cell and how these pathways communicate to ultimately result in successful viral replication.
4. DISCUSSION
Increasing our knowledge of the metabolic impact of an HBV infection of hepatocytes is an important step towards a complete understanding of the HBV life cycle and the development of novel therapeutic interventions to inhibit HBV replication in HBV-infected individuals. In light of the recently described cell-surface, HBV receptor [5] role of the human sodium taurocholate co-transporting polypeptide (hNTCP), a central factor in hepatocyte metabolism through its function as the main hepatocyte bile transporter [25], it is vital that we understand the interplay between the HBV life cycle and hepatocyte metabolism.
In an attempt to mimic in vivo hepatocyte physiology as closely as possible, we used a primary hepatocyte model system for studies of HBV biology. Specifically, we used an ex vivo model of cultured primary rat hepatocyte because they are readily available and we have previously demonstrated their overall similarity to freshly isolated hepatocytes [12]. Although primary rat hepatocytes cannot be directly infected with human HBV, this drawback is counterbalanced by the overall difficulties of doing similar work in primary human hepatocytes. For example, both the low level of HBV replication, ~1 infectious virion per cell per day [26], and the overall inefficiency of HBV infection in cultured primary human hepatocytes [27, 28] are significant impediments to large-scale in vitro studies. To circumvent these difficulties, we utilized a recombinant adenovirus expressing either GFP alone (AdGFP), GFP with a greater-than-unit-length copy of the HBV genome (AdHBV), or GFP with HBx (AdHBx). While this system bypasses the initial stage of infection, it does recapitulate all of the post-infection steps of the HBV life cycle, resulting in successful viral replication. In addition, by using recombinant adenoviruses, we routinely achieve a high level of infection, which can approach 100%, and is much closer to the level of virus seen in a natural HBV infection, where nearly 100% of the liver is infected within the first week [29, 30]. On the other hand, bypassing the initial hepatocyte infection step does mean that metabolic changes associated with HBV binding to hNTCP, itself an important metabolic factor, will not be detected in these studies. Recently, however, studies have shown that HBV binding to hNTCP can competitively inhibit the function of hNTCP [6] and alter a number of transcription factors associated with lipid and cholesterol metabolism [7]. Additional work could help to bridge the larger, profiling-based metabolomics studies and work utilizing direct infection techniques.
Overall, the results of our analysis of the HBV-mediated changes to the hepatocyte metabolome demonstrate that within the analysis variables in the dataset (i.e. time, treatment type), significant changes to the metabolomic profile are occurring. One initial observation is that these results suggest a potentially interesting differential regulation of metabolites between HBV and HBx. For example, when comparing within treatment groups over time, AdGFP- and AdHBV-infected primary rat hepatocytes have similar patterns of time-mediated changes, with 70% and 61% of metabolites decreased between 48 hrs and 72 hrs. AdHBx-infected cells, on the other hand, are nearly the opposite, with 30% of metabolites decreased and 70% increased. While this could represent interesting physiological differences in the expression of HBx in the context of HBV or when expressed on its own, it is more likely that this difference between HBV- and HBx-expressing cells represents differences in these two experimental systems. Specifically, in contrast to AdHBx-infected primary rat hepatocytes, the level of HBx expression in the context of AdHBV-infected primary rat hepatocytes is minimal, to the point that it remains below the level of detection by western blot. Therefore, differences in the levels of metabolites between AdHBV- and AdHBx-expressing cells could be the result of specific HBx-mediated effects due to the potentially over-expressed levels of HBx or changes that would be seen at an extended time point in HBV-expressing cells. Unfortunately, the short life span of primary hepatocytes in culture limit our ability to investigate this hypothesis.
While the purpose of these studies was primarily to produce a global profile of the HBV- and HBx-mediated changes to the primary hepatocyte metabolome, we were able to generate some interesting biological contexts for these changes through the analysis of altered metabolites within their respective metabolic pathways. Through the use of both a broad analysis of super-pathways and a more refined analysis of pathway perturbation, we identified pathways likely altered in the context of HBV and HBx expression. Many of these pathways fall within the lipid super-pathway and included a number of central metabolic pathways. One such lipid-related pathway was phospholipid metabolism. Interestingly, each of the 4 classes of phospholipids measured (phosphatidylcholine, phosphatidylethanolamine, phosphatidylserine and phosphatidylinositol) were altered by HBV and HBx at 72 hrs. Each of these classes of lipids play important roles in cellular function, and a number of recent studies demonstrate their importance for HBV, including the recently described requirement for cellular lipids in HBV envelope formation and infection of hepatocytes [31, 32]. This regulation of phospholipid metabolism, and the similar regulation of sphingolipid metabolism, could imply increased membrane biosynthesis; however, these lipids also play important roles in other cellular pathways, such as apoptosis and calcium signaling, which are also affected in HBV-infected hepatocytes [13, 33].
Another interesting aspect of the lipid super-pathway is the HBV- and HBx-mediated increases in the long chain fatty acid and the polyunsaturated fat sub-pathways. Together, these results imply that HBV- and HBx-mediated alterations to the metabolites in each of these pathways results in an increased pool of free fatty acids. Importantly, minimal increases in the level of essential fatty acids implies that, while some increased uptake may be occurring from outside the cell, the increased level of free fatty acids is more likely due to a decrease in the level of β-oxidation, or an increase in the level of fatty acid synthesis or lipolysis in the presence of HBV and, at the later time point, HBx. These conclusions were further supported through analysis of relevant gene expression. For example, while our biochemical panel did not include analysis of manoyl-CoA, and therefore we can’t directly assess inhibition of fatty acid oxidation, CPT1a and enoyl-CoA hydratase expression were both decreased by HBV, each representing critical early steps in this pathway. Alternatively, factors involved in fatty acid synthesis and lipolysis, such as fatty acid synthase and its fatty acid product palmitate, SREBF1, a main regulator of lipogenesis and fatty acid uptake that is transcriptionally activated by HBx [34], and G0S2, a multifunctional protein involved in regulating the breakdown of fat [24], are all up-regulated by HBV.
Though lipids make up the largest percentage of metabolites in our profiling study, analysis shows multiple pathways are altered by HBV or HBx. In particular, this includes alteration of metabolites associated with glycolysis and gluconeogenesis, amino acid metabolism, starch and sugar metabolism, and other energy-related metabolic pathways. Previous work has shown that induction of gluconeogenesis enhances HBV replication [10], and HBx expression results in increased levels of multiple gluconeogenic genes [9]. Additionally, recent RNA-seq experiments have shown HBV-mediated decreases in the levels of GLUT2, the main hepatic glucose transporter [12, 35], and additional studies have shown that HBV replication depends on transcription factors that are important for the regulation of both gluconeogenesis and lipogenesis [36]. Our findings here, including HBV- and HBx-mediated increases in glycolytic intermediates and glycogen metabolism combined with only minimal alteration of Tricarboxylic Acid Cycle (TCA)- and oxidative phosphorylation-associated metabolites, suggest that HBV- and HBx-expressing cells may be altering the energy state of the hepatocyte, and potentially shifting cells towards increased glycolysis. Taken along with the well-established role in HBV of central metabolic pathways such as PI3K/Akt [8, 37], these findings support the role of HBV as a direct mediator of hepatocyte metabolism.
Because of the depth of these combined datasets, a complete analysis of all HBV-mediated changes goes beyond the scope of any individual study. For example, through the alteration of glutathione metabolism, our data suggests increased oxidative stress in HBV- and HBx-expressing PRHs, something that has also previously been shown in the liver of HBV-transgenic mice [38]. Similarly, the HBV-mediated increase in myristate and N-myristoyltransferase, suggesting a potential mediation of myristoylation by HBV, is interesting because of the requirement for myristoylation of L-HBsAg in viral binding to hNTCP during infection [39, 40]. Moving forward, these types of individual observations could prove to ultimately be equally important during an HBV infection as the larger pathway-based findings described here.
Overall, generating a complete understanding of the cellular consequences of an HBV infection is critically important. Whether these consequences represent the outcome of direct viral regulation of cell signal transduction pathways, or a potential cellular response to viral infection, understanding these outcomes represents an important step towards the identification of novel therapeutic targets for the treatment of HBV. By establishing this profile of HBV-mediated changes to the primary hepatocyte metabolome, our studies expand the knowledgebase through the use of broad, “-omics” based datasets. These datasets, at both the metabolomic and transcriptomic level, enhance our ability to identify cellular pathways altered in the context of replicating HBV, ultimately establishing points of future study in the hope of identifying successful targets for therapeutic intervention.
Highlights.
First global analysis of HBV-mediated changes in the primary hepatocyte metabolome
First global analysis of HBx-mediated changes in the primary hepatocyte metabolome
HBV and HBx alter primary hepatocyte lipid, long-chain fatty acid metabolism
HBV and HBx alter primary hepatocyte glycolysis
HBV and HBx alter primary hepatocyte glycogen metabolism
Acknowledgments
The authors would like to thank Dr. Laura F. Steel and Dr. Joshua C. Mell for critical discussions. The authors also thank Dr. Sumedha Bagga and Nicholas Duchemin for their assistance with recombinant adenovirus and primary rat hepatocyte preparation.
FUNDING
This work was partially supported by Ruth L. Kirschstein (F31) Predoctoral Fellowships to RJL (F31CA171712) and JCC (F31CA171850). The funding agencies had no role in the design or interpretation of the research.
Footnotes
Publisher's Disclaimer: This is a PDF file of an unedited manuscript that has been accepted for publication. As a service to our customers we are providing this early version of the manuscript. The manuscript will undergo copyediting, typesetting, and review of the resulting proof before it is published in its final citable form. Please note that during the production process errors may be discovered which could affect the content, and all legal disclaimers that apply to the journal pertain.
DISCLOSURE STATEMENT
The authors report no conflicts of interest.
AUTHOR CONTRIBUTIONS
R.J.L. and M.J.B. participated in the design and interpretation of the research as well as manuscript writing. R.J.L. and J.C.C. conducted the research and data collection.
References
- 1.GLOBOCAN 2012 v1.0 [Internet]. IARC CancerBase No. 11. 2013 Available from: http://globocan.iarc.fr/
- 2.El-Serag HB. Epidemiology of viral hepatitis and hepatocellular carcinoma. Gastroenterology. 2012;142(6):1264–73 e1. doi: 10.1053/j.gastro.2011.12.061. [DOI] [PMC free article] [PubMed] [Google Scholar]
- 3.Ott JJ, Stevens GA, Groeger J, Wiersma ST. Global epidemiology of hepatitis B virus infection: new estimates of age-specific HBsAg seroprevalence and endemicity. Vaccine. 2012;30(12):2212–9. doi: 10.1016/j.vaccine.2011.12.116. [DOI] [PubMed] [Google Scholar]
- 4.Organization WH. Hepatitis B. 2017 Available from: http://www.who.int/mediacentre/factsheets/fs204/en/
- 5.Yan H, Zhong G, Xu G, He W, Jing Z, Gao Z, et al. Sodium taurocholate cotransporting polypeptide is a functional receptor for human hepatitis B and D virus. eLife. 2012;1:e00049. doi: 10.7554/eLife.00049. Epub 2012/11/15. [DOI] [PMC free article] [PubMed] [Google Scholar]
- 6.Yan H, Peng B, Liu Y, Xu G, He W, Ren B, et al. Viral entry of hepatitis B and D viruses and bile salts transportation share common molecular determinants on sodium taurocholate cotransporting polypeptide. Journal of virology. 2014;88(6):3273–84. doi: 10.1128/JVI.03478-13. [DOI] [PMC free article] [PubMed] [Google Scholar]
- 7.Oehler N, Volz T, Bhadra OD, Kah J, Allweiss L, Giersch K, et al. Binding of hepatitis B virus to its cellular receptor alters the expression profile of genes of bile acid metabolism. Hepatology. 2014;60(5):1483–93. doi: 10.1002/hep.27159. [DOI] [PubMed] [Google Scholar]
- 8.Rawat S, Bouchard M. The Hepatitis B Virus HBx protein activates AKT to simultaneously regulate HBV replication and hepatocyte survival. Journal of virology. 2014 doi: 10.1128/JVI.02440-14. [DOI] [PMC free article] [PubMed] [Google Scholar]
- 9.Shin HJ, Park YH, Kim SU, Moon HB, Park do S, Han YH, et al. Hepatitis B virus × protein regulates hepatic glucose homeostasis via activation of inducible nitric oxide synthase. The Journal of biological chemistry. 2011;286(34):29872–81. doi: 10.1074/jbc.M111.259978. [DOI] [PMC free article] [PubMed] [Google Scholar]
- 10.Shlomai A, Paran N, Shaul Y. PGC-1alpha controls hepatitis B virus through nutritional signals. Proceedings of the National Academy of Sciences of the United States of America. 2006;103(43):16003–8. doi: 10.1073/pnas.0607837103. [DOI] [PMC free article] [PubMed] [Google Scholar]
- 11.Seglen P. Isolation of hepatocytes by collagenase perfusion. Methods in Toxicology. :231–43. 11993. [Google Scholar]
- 12.Lamontagne J, Mell JC, Bouchard MJ. Transcriptome-Wide Analysis of Hepatitis B Virus-Mediated Changes to Normal Hepatocyte Gene Expression. PLoS pathogens. 2016;12(2):e1005438. doi: 10.1371/journal.ppat.1005438. [DOI] [PMC free article] [PubMed] [Google Scholar]
- 13.Clippinger AJ, Gearhart TL, Bouchard MJ. Hepatitis B virus × protein modulates apoptosis in primary rat hepatocytes by regulating both NF-kappaB and the mitochondrial permeability transition pore. Journal of virology. 2009;83(10):4718–31. doi: 10.1128/JVI.02590-08. Epub 2009/03/13. [DOI] [PMC free article] [PubMed] [Google Scholar]
- 14.Sprinzl MF, Oberwinkler H, Schaller H, Protzer U. Transfer of hepatitis B virus genome by adenovirus vectors into cultured cells and mice: crossing the species barrier. Journal of virology. 2001;75(11):5108–18. doi: 10.1128/JVI.75.11.5108-5118.2001. [DOI] [PMC free article] [PubMed] [Google Scholar]
- 15.Bouchard MJ, Wang LH, Schneider RJ. Calcium signaling by HBx protein in hepatitis B virus DNA replication. Science. 2001;294(5550):2376–8. doi: 10.1126/science.294.5550.2376. [DOI] [PubMed] [Google Scholar]
- 16.Sha W, da Costa KA, Fischer LM, Milburn MV, Lawton KA, Berger A, et al. Metabolomic profiling can predict which humans will develop liver dysfunction when deprived of dietary choline. FASEB journal : official publication of the Federation of American Societies for Experimental Biology. 2010;24(8):2962–75. doi: 10.1096/fj.09-154054. Epub 2010/04/08. [DOI] [PMC free article] [PubMed] [Google Scholar]
- 17.Dehaven CD, Evans AM, Dai H, Lawton KA. Organization of GC/MS and LC/MS metabolomics data into chemical libraries. J Cheminform. 2010;2(1):9. doi: 10.1186/1758-2946-2-9. Epub 2010/10/20. [DOI] [PMC free article] [PubMed] [Google Scholar]
- 18.Xia J, Sinelnikov IV, Han B, Wishart DS. MetaboAnalyst 3.0--making metabolomics more meaningful. Nucleic acids research. 2015;43(W1):W251–7. doi: 10.1093/nar/gkv380. [DOI] [PMC free article] [PubMed] [Google Scholar]
- 19.Team RC. R: A language and environment for statistical computing. R Foundation for Statistical Computing. 2015 [Google Scholar]
- 20.Langfelder P, Horvath S. WGCNA: an R package for weighted correlation network analysis. BMC bioinformatics. 2008;9:559. doi: 10.1186/1471-2105-9-559. [DOI] [PMC free article] [PubMed] [Google Scholar]
- 21.Wickham H. ggplot2: elegant graphics for data analysis. Springer; New York: 2009. [Google Scholar]
- 22.Oliveros JC VENNY. An interactive tool for comparing lists with Venn Diagrams. 2007 Available from: http://bioinfogp.cnb.csic.es/tools/venny/index.html.
- 23.Liu B, Fang M, He Z, Cui D, Jia S, Lin X, et al. Hepatitis B virus stimulates G6PD expression through HBx-mediated Nrf2 activation. Cell Death Dis. 2015;6:e1980. doi: 10.1038/cddis.2015.322. [DOI] [PMC free article] [PubMed] [Google Scholar]
- 24.Wang Y, Zhang Y, Qian H, Lu J, Zhang Z, Min X, et al. The g0/g1 switch gene 2 is an important regulator of hepatic triglyceride metabolism. PloS one. 2013;8(8):e72315. doi: 10.1371/journal.pone.0072315. [DOI] [PMC free article] [PubMed] [Google Scholar]
- 25.Stieger B. The role of the sodium-taurocholate cotransporting polypeptide (NTCP) and of the bile salt export pump (BSEP) in physiology and pathophysiology of bile formation. Handb Exp Pharmacol. 2011;(201):205–59. doi: 10.1007/978-3-642-14541-4_5. Epub 2010/11/26. [DOI] [PubMed] [Google Scholar]
- 26.Nowak MA, Bonhoeffer S, Hill AM, Boehme R, Thomas HC, McDade H. Viral dynamics in hepatitis B virus infection. Proceedings of the National Academy of Sciences of the United States of America. 1996;93(9):4398–402. doi: 10.1073/pnas.93.9.4398. [DOI] [PMC free article] [PubMed] [Google Scholar]
- 27.Galle PR, Hagelstein J, Kommerell B, Volkmann M, Schranz P, Zentgraf H. In vitro experimental infection of primary human hepatocytes with hepatitis B virus. Gastroenterology. 1994;106(3):664–73. doi: 10.1016/0016-5085(94)90700-5. [DOI] [PubMed] [Google Scholar]
- 28.Gripon P, Diot C, Theze N, Fourel I, Loreal O, Brechot C, et al. Hepatitis B virus infection of adult human hepatocytes cultured in the presence of dimethyl sulfoxide. Journal of virology. 1988;62(11):4136–43. doi: 10.1128/jvi.62.11.4136-4143.1988. [DOI] [PMC free article] [PubMed] [Google Scholar]
- 29.Kajino K, Jilbert AR, Saputelli J, Aldrich CE, Cullen J, Mason WS. Woodchuck hepatitis virus infections: very rapid recovery after a prolonged viremia and infection of virtually every hepatocyte. Journal of virology. 1994;68(9):5792–803. doi: 10.1128/jvi.68.9.5792-5803.1994. [DOI] [PMC free article] [PubMed] [Google Scholar]
- 30.Wieland S, Thimme R, Purcell RH, Chisari FV. Genomic analysis of the host response to hepatitis B virus infection. Proceedings of the National Academy of Sciences of the United States of America. 2004;101(17):6669–74. doi: 10.1073/pnas.0401771101. [DOI] [PMC free article] [PubMed] [Google Scholar]
- 31.Bremer CM, Bung C, Kott N, Hardt M, Glebe D. Hepatitis B virus infection is dependent on cholesterol in the viral envelope. Cellular microbiology. 2009;11(2):249–60. doi: 10.1111/j.1462-5822.2008.01250.x. [DOI] [PubMed] [Google Scholar]
- 32.Dorobantu C, Macovei A, Lazar C, Dwek RA, Zitzmann N, Branza-Nichita N. Cholesterol depletion of hepatoma cells impairs hepatitis B virus envelopment by altering the topology of the large envelope protein. Journal of virology. 2011;85(24):13373–83. doi: 10.1128/JVI.05423-11. [DOI] [PMC free article] [PubMed] [Google Scholar]
- 33.Rawat S, Clippinger AJ, Bouchard MJ. Modulation of apoptotic signaling by the hepatitis B virus × protein. Viruses. 2012;4(11):2945–72. doi: 10.3390/v4112945. [DOI] [PMC free article] [PubMed] [Google Scholar]
- 34.Kim KH, Shin HJ, Kim K, Choi HM, Rhee SH, Moon HB, et al. Hepatitis B virus × protein induces hepatic steatosis via transcriptional activation of SREBP1 and PPARgamma. Gastroenterology. 2007;132(5):1955–67. doi: 10.1053/j.gastro.2007.03.039. [DOI] [PubMed] [Google Scholar]
- 35.Jagya N, Varma SP, Thakral D, Joshi P, Durgapal H, Panda SK. RNA-seq based transcriptome analysis of hepatitis E virus (HEV) and hepatitis B virus (HBV) replicon transfected Huh-7 cells. PloS one. 2014;9(2):e87835. doi: 10.1371/journal.pone.0087835. [DOI] [PMC free article] [PubMed] [Google Scholar]
- 36.Jhuang HJ, Hsu WH, Lin KT, Hsu SL, Wang FS, Chou CK, et al. Gluconeogenesis, lipogenesis, and HBV replication are commonly regulated by PGC-1alpha-dependent pathway. Oncotarget. 2015;6(10):7788–803. doi: 10.18632/oncotarget.3050. [DOI] [PMC free article] [PubMed] [Google Scholar]
- 37.Guo H, Jiang D, Zhou T, Cuconati A, Block TM, Guo JT. Characterization of the intracellular deproteinized relaxed circular DNA of hepatitis B virus: an intermediate of covalently closed circular DNA formation. Journal of virology. 2007;81(22):12472–84. doi: 10.1128/JVI.01123-07. Epub 2007/09/07. [DOI] [PMC free article] [PubMed] [Google Scholar]
- 38.Yang F, Yan S, He Y, Wang F, Song S, Guo Y, et al. Expression of hepatitis B virus proteins in transgenic mice alters lipid metabolism and induces oxidative stress in the liver. Journal of hepatology. 2008;48(1):12–9. doi: 10.1016/j.jhep.2007.06.021. [DOI] [PubMed] [Google Scholar]
- 39.Persing DH, Varmus HE, Ganem D. The preS1 protein of hepatitis B virus is acylated at its amino terminus with myristic acid. Journal of virology. 1987;61(5):1672–7. doi: 10.1128/jvi.61.5.1672-1677.1987. [DOI] [PMC free article] [PubMed] [Google Scholar]
- 40.Gripon P, Le Seyec J, Rumin S, Guguen-Guillouzo C. Myristylation of the hepatitis B virus large surface protein is essential for viral infectivity. Virology. 1995;213(2):292–9. doi: 10.1006/viro.1995.0002. [DOI] [PubMed] [Google Scholar]


