

Abstract
Compartmentalization is a fundamental design principle of eukaryotic metabolism. Here, we review the compartmentalization of NAD+/NADH and NADP+/NADPH with a focus on the liver, an organ that experiences the extremes of biochemical physiology each day. Historical studies of the liver, using classical biochemical fractionation and measurements of redox-coupled metabolites, have given rise to the prevailing view that mitochondrial NAD(H) pools tend to be oxidized and important for energy homeostasis, whereas cytosolic NADP(H) pools tend to be highly reduced for reductive biosynthesis. Despite this textbook view, many questions still remain as to the relative size of these subcellular pools and their redox ratios in different physiological states, and to what extent such redox ratios are simply indicators versus drivers of metabolism. By performing a bioinformatic survey, we find that the liver expresses 352 known or predicted enzymes composing the hepatic NAD(P)ome, i.e. the union of all predicted enzymes producing or consuming NADP(H) or NAD(H) or using them as a redox co-factor. Notably, less than half are predicted to be localized within the cytosol or mitochondria, and a very large fraction of these genes exhibit gene expression patterns that vary during the time of day or in response to fasting or feeding. A future challenge lies in applying emerging new genetic tools to measure and manipulate in vivo hepatic NADP(H) and NAD(H) with subcellular and temporal resolution. Insights from such fundamental studies will be crucial in deciphering the pathogenesis of very common diseases known to involve alterations in hepatic NAD(P)H, such as diabetes and fatty liver disease.
Keywords: hepatic metabolism, hepatocyte, liver, cell metabolism, intermediary metabolism, NAD biosynthesis, nicotinamide adenine dinucleotide (NAD), nicotinamide adenine dinucleotide (NADH), liver metabolism, oxidation-reduction (redox), NAD(P)ome
Introduction
A key challenge faced by all organisms is how to organize the many chemical reactions that define cellular metabolism, many of which if performed in a single environment would produce futile chemical cycles, unwanted by-products, or suffer from thermodynamic or kinetic barriers. The evolutionary solution to this problem is compartmentalization (Fig. 1). Chemical compartmentalization allows metabolic processes to use different co-factors for the same reactions (e.g. NADPH for reductive biosynthesis and NAD+ for catabolism); temporal compartmentalization allows for different reactions to occur dynamically in response to changing conditions (e.g. glycogen synthesis during feeding and gluconeogenesis during fasting); and spatial compartmentalization across organs and organelles allows for metabolic specialization (e.g. different pH environments).
Figure 1.

Chemical, spatial, and temporal compartmentalization of metabolism.
The pyridine dinucleotides NADH (NAD+-oxidized and NADH-reduced) and NADPH (NADP+-oxidized and NADPH-reduced) are key to metabolic compartmentalization. Taken together, NAD(H) and NADP(H) are utilized by 488 human metabolic reactions (Table S1), making them among the most widely used metabolites in human biochemistry, exceeded only by water and protons (see “Methods”). NAD+ and NADP+ are best known as two-electron carriers that serve as key co-enzymes for redox biology, although it is now appreciated that NAD+ additionally plays a key role as a substrate for protein and nucleic acid modification (1, 2) through action by sirtuins (SIRTs)3 and poly(ADP-ribose) polymerases (PARPs). These proteins, which sense alterations in the NAD+ pool (3–5), are key for cellular signaling (6, 7), transcriptional regulation (8), and DNA damage repair.
The liver, the largest internal organ in humans, is a central hub of chemical metabolism and represents an ideal window through which to explore the biochemical basis and physiological relevance of NAD(H) and NADP(H) biochemistry. The liver undergoes dramatic metabolic changes at the extremes of physiology with fasting and feeding and is the primary organ responsible for gluconeogenesis, transamination, and deamination of amino acids, urea and ammonia metabolism, amino acid synthesis, synthesis of blood proteins such as albumin and clotting factors, lipoprotein synthesis, ketone body generation, and first-pass xenobiotic metabolism. Many of these diverse metabolic processes are linked to NAD(H) or to NADP(H). For example, during fasting, acetyl-CoA is used as a precursor for the formation of ketone bodies within mitochondria using NAD+, but following feeding, it is used as a precursor for cholesterol and lipid synthesis using NADPH as a co-factor (9). Alcohol metabolism occurs primarily within the liver and generates NADH both within the cytosol and mitochondria (10, 11). Xenobiotic metabolism utilizes NADPH via cytochrome P450 reductase for redox transformations (12). Metformin is the most widely used drug for diabetes in the world and is believed to act by inhibiting mitochondrial complex I (13, 14) or mitochondrial glycerophosphate dehydrogenase (15), both of which are NAD+-linked enzymes.
Indeed, as we explore in this Minireview, the liver is predicted to perform more NAD(P)-linked chemical reactions than any other tissue. It is also historically the tissue in which paradigmatic aspects of NAD(P)+ compartmentalization are most well studied and hence are instructive for identifying missing gaps in our knowledge that ought to help guide future studies of NAD(P)+ compartmentalization.
Hepatic NAD+/NADH and NADP+/NADPH ratios
Like other cells and tissues, the liver exhibits striking differences between NAD+/NADH versus NADP+/NADPH within and between the cytosol and mitochondrion. Classic measurements inferred compartmental free (nonprotein bound) ratios by measuring the ratios of metabolites assumed to be enzymatically coupled to compartment-specific NAD+/NADH or NADP+/NADPH in near-equilibrium conditions (16, 17) (Table S2). In the liver, this included the pyruvate/lactate ratio for cytosolic NAD+/NADH (through lactate dehydrogenase, LDH), acetoacetate/β-hydroxybutyrate for mitochondrial NAD+/NADH (through β-hydroxybutyrate dehydrogenase), and α-ketoglutarate/isocitrate (through isocitrate dehydrogenase, IDH1) for cytosolic NADP+/NADPH (16, 18).
These measurements indicated a cytosolic NAD+/NADH ratio between roughly 500 and 1000 (highly oxidized), with a cytoplasmic NADP+/NADPH ratio between 0.001 and 0.01 (highly reduced) (Fig. 2 and Table S2) (16, 17, 19, 20). Such measurements support the traditional view of cytosolic NADP+/NADPH supporting reductive biosynthesis, whereas NAD+/NADH supports oxidation, as major cytosolic biosynthetic pathways (e.g. fatty acid synthesis) require NADPH (21), and major oxidative pathways (e.g. glucose oxidation to pyruvate) require NAD+. In contrast to the cytosol, classical measures demonstrate that mitochondrial NAD+/NADH ratios are more reduced (between 5 and 10) (16, 17).
Figure 2.
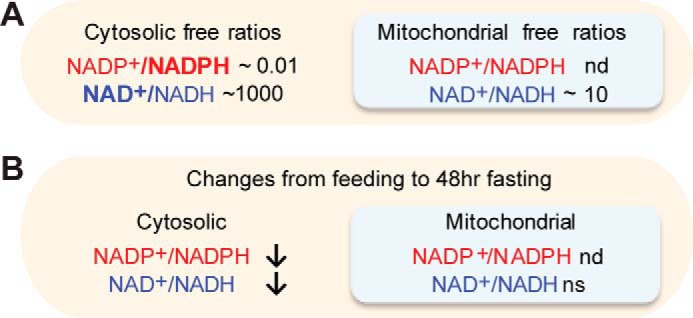
Compartmentalization of NAD(P)(H) in hepatocytes. A, classical measurements of the cytosolic and mitochondrial NAD+/NADH and NADP+/NADPH ratios in rat livers. B, classical feeding/fasting changes of compartment free NAD(P)+ ratios. Data based on Veech et al. (16). nd, not determined; ns, not significant.
What gives rise to the 100,000-fold difference in NAD+/NADH ratio versus NADP+/NADPH (Fig. 2A)? In the cytosol, it is believed that the ratios are established by the activity of highly abundant and active enzymes that are specific for NAD(H) (e.g. LDH) or for NADP(H) (e.g. malic enzyme (ME)), i.e. the very enzymes used by Krebs and co-workers (16, 17) to infer the free cytoplasmic ratios. Under the assumption of near-equilibrium conditions, the concentration of the substrates in conjunction with the in vitro determined equilibrium constants of the LDH and ME enzymes can be used to infer ratios of NAD+/NADH and NADP+/NADPH, which differ by 105.
The NAD+/NADH ratio is much more oxidized in the cytosol than in the mitochondrion (∼500–1000 versus ∼5–10), which is separated from the cytosol by the highly impermeable inner mitochondrial membrane (Fig. 2A and Table S2). This difference is driven by the malate–aspartate shuttle that is able to transfer reducing equivalents into mitochondria against the NADH redox gradient by dissipating the 150-mV protonmotive force of the mitochondrial inner membrane. Specifically, this shuttle system relies on a co-transporter whereby extra-mitochondrial glutamate and a proton are imported into the mitochondrial matrix in exchange for the export of aspartate (22, 23).
Based on our literature review there are surprisingly few if any empirical measurements of the hepatic mitochondrial NADP+/NADPH ratio (Table S2). There are a number of different enzyme systems within the mitochondrion capable of transferring net reducing equivalents between the NAD+/NADH and NADP+/NADPH, such as glutamate dehydrogenase, a highly abundant liver enzyme and one of the few enzymes capable of using either NADH or NADPH (24). Given this, it was initially hypothesized that intramitochondrial NADP+/NADPH and NAD+/NAPH ratios were similar (16), although subsequent data suggest that that mitochondrial free NADP+/NAPH ratio is significantly more reduced due to the action of nicotinamide nucleotide transhydrogenase, which reduces mitochondrial NADP+ while oxidizing NADH by coupling to the protonmotive force (25, 26).
Classic studies of hepatic NAD+/NADH and NADP+/NADPH free ratios reported that prolonged fasting decreased both the cytosolic NADP+/NADPH and NAD+/NADH ratios, without significantly changing mitochondrial NAD+/NADH ratios (Fig. 2 and Table S2) (16). As reviewed below, this contrasts with modern measurements of total cellular NAD+ levels that typically are increased with fasting.
Statements on the relative compartment-specific free NAD+/NADH and NADP+/NADPH ratios must be tempered with the fact that most of these measurements have been indirect, relying on the ratios of coupled ratios such as the pyruvate/lactate ratio or the acetoacetate/β-hydroxybutyrate ratio, with the underlying assumption that these chemical reactions are in near-equilibrium. To our knowledge direct measurements of these ratios in vivo under baseline conditions or with physiological perturbations are wholly lacking.
Pool sizes of NAD(H) and NADP(H) within the liver
Although the NAD+/NADH and NADP+/NADPH ratios are crucial for redox reactions, it is now clear that the total amount of each molecule (pool size) is important for enzymatic reactions that use these molecules as substrates rather than co-factors. To date, this role is most clearly defined for NAD+, which serves as a substrate for NAD+-dependent sirtuins (8) and PARPs (1). Measurements of total murine hepatic NAD(H) and NADP(H), typically performed using enzymatic coupling methods or HPLC measurements, have varied broadly and been reported between approximately 10 and 4000 nmol/g of tissue for NAD+, 100 and 300 for NADH, 50 and 600 for NADP+, and 100 and 300 for NADPH (Table S2) (27–29). Interestingly, the reported values for cellular NAD+ are significantly higher than the Km values of SIRTs and PARPs (30).
Alterations in the pool size versus ratio of individual NAD(P)+ species can have distinct biochemical consequences. For example, as the cytosolic NAD+/NADH ratio is high (500–1000) (17), doubling the cytosolic free NADH concentration would change the cytosolic NAD+ levels by less than 1% but would roughly halve the NAD+/NADH ratio. Such a small change in NAD+ levels would not be expected to impact sirtuins, which use NAD+ as a substrate and are likely not influenced by NADH concentrations (31). However, it would be expected to have significant metabolic effects through enzymes using NAD(H) as redox cofactors, such as halving cytosolic pyruvate levels via the activity of LDH. In contrast, a process that depletes cellular NAD+, for example through DNA damage and subsequent PARP activation, could reduce total cellular NAD+ levels and hence the activity of sirtuins (32).
Most (4, 33, 34) but not all (35, 36) studies have shown that fasting increases total cellular and mitochondrial NAD+, which conflict with classic measurements that demonstrate more reduced, compartment-specific free pools with fasting, particularly with respect to the cytosolic NADP+/NADPH ratio (Table S2) (16, 17). Given the central importance of these values to hepatic physiology, parallel measurements of in vivo free ratios and pool sizes during these feeding and fasting transitions are urgently needed.
It should also be noted that published values for total cellular NAD(P)+ provide little insight into important redox parameters such as compartment-specific pool sizes and compartment-specific ratios of free NAD+/NADH or NADP+/NADPH. Although HPLC, MS, or enzymatic kit-based assays of total amounts of NADP(H) or NAD(H) from whole-cell or tissue lysates are relatively straightforward, they do not distinguish the substantial portion of protein-bound molecules from the unbound (free) molecules (37, 38) and cannot distinguish compartment-specific values; therefore, it is difficult to infer concentrations of free dinucleotides.
Survey of the hepatic NAD(P)ome
Historically, much of the focus of NAD(H) and NADP(H) biochemistry has been on compartmentalization of anabolic and catabolic metabolism in the cytosol and mitochondrion. Genomics offers the opportunity to begin with a blank slate and to predict the extent of NAD(P)H biochemistry outside these compartments. To this end, we performed a bioinformatics survey of genes related to NAD(P)+, which we term the NAD(P)ome, with a particular focus on the hepatic NAD(P)ome (Fig. 3).
Figure 3.

Compartmentalization of the hepatic NAD(P)ome. A, hepatic NAD(P)ome is defined as the 352 members of the human NAD(P)ome that show expression in liver. B, tissue expression is shown across 15 human tissues selected from the GTEx atlas. Expression is shown as RPKM mapped reads. C, relative distribution of hepatic enzymes using NAD(P)+ as cofactors in redox reactions, as substrates, or in NAD(P)+ biosynthesis. D, subcellular distribution of the hepatic NAD(P)ome with data available from the Human Protein Atlas (HPA). E, temporal compartmentalization during fasting/feeding is shown for 105 hepatic NADPome genes showing significant differential expression changes based on the Montagner et al. (54) study in the mouse (Student's t test p value < 0.05 after Bonferroni correction). F, gene expression is shown for the 83 genes showing significant circadian periodicity from Hughes et al. (57). Gray bars indicate periods of darkness. G, circadian expression of NADK and HMGCR based on data from Hughes et al. (57).
We define the NAD(P)ome as the union of human gene products involved in NAD(P)+ biosynthesis (including de novo synthesis, salvage, repair, and turnover), all enzymes that use NAD(P)+ as redox cofactors, and all gene products that utilize NAD(P)+ as substrates. We assembled and manually reviewed a candidate list of enzymes using literature search, enzyme databases (KEGG) (39–41), the presence of NAD(P)-binding domains from protein domain databases (PFAM (42) and Interpro (43)), and automated annotation databases (NCBI Gene Ontology (44, 45)) (see under “Methods”). These methods identified a set of 426 NAD-linked human gene products that define the human NAD(P)ome.
We next focused on the hepatic NAD(P)ome, which we define as the 352/426 (83%) of proteins with evidence of liver expression in human or mouse (Fig. 3A). Indeed, the liver contains the largest number of NAD(P)ome genes of any human tissue (Fig. 3B). Moreover, the liver has the highest number of tissue-specific NAD(P)-linked enzymes, including 40 cytochrome P450 enzymes and 24 alcohol or aldehyde dehydrogenase enzymes classically associated with xenobiotic and alcohol metabolism (Fig. 3B). To our surprise, many enzymes involved in NAD+ or NADP+ de novo biosynthesis appear to be highly enriched in the liver (i.e. AFMID, NADK2, KMO, TDO2, HAAO, and QPRT), predicting a role for the liver in whole-body NAD+ biosynthesis (Fig. 4). In addition to these well-studied proteins, the hepatic NAD(P)ome contains 32 predicted NAD+- or NADP+-linked enzymes that await characterization (Table S1).
Figure 4.
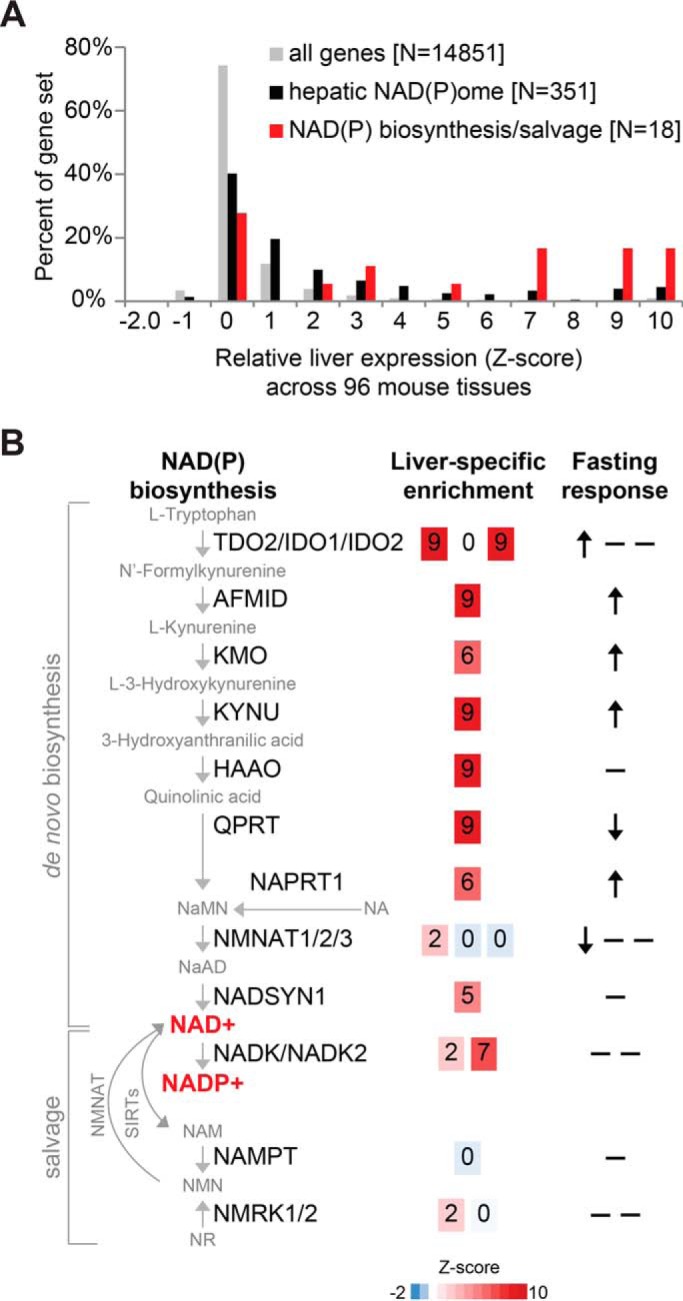
Relative hepatic expression and feeding/fasting changes of the NAD(P) biosynthesis/salvage pathway. A, histogram of liver-specific expression of all genes, hepatic NAD(P)ome genes, and the NAD(P) biosynthesis/salvage pathway based on GNFv3 mouse tissue atlas (71). B, schematic diagram of NAD(P) biosynthesis/salvage genes showing liver-specific expression (Z-score in the GNFv3 mouse tissue atlas (71)) and in fasting versus refeeding (54), where arrows indicate significant changes based on Student's t test, after Bonferroni correction.
Subcellular localization of the hepatic NAD(P)ome
We can begin to estimate the subcellular distribution of the hepatic NAD(P)ome using data from the Human Protein Atlas (Fig. 3D) (46). Although far from definitive, this resource allows initial evaluation of spatial compartmentalization, and data are available for nearly 70% of the proteins in the hepatic NAD(P)ome. Although ∼40% of the hepatic NAD(P)ome is predicted to reside within the cytosol or mitochondria, a surprising 60% is predicted to localize in other compartments, including the nucleus (62 proteins), ER (9 proteins), golgi (6 proteins), peroxisome (13 proteins), and even the lysosome (2 proteins) (Table S1). There is evidence that the membranes of the ER and Golgi are not permeable to NAD(P)H and hence likely contain pools separate from the cytosol (47–50). How compartmental levels of NAD(P)+ in these organelles are influenced, transported, or regulated are largely unknown.
Our survey reveals that the nucleus appears to be a particularly rich organelle for NAD(P)H metabolism; in addition to PARPs and SIRTs, there are over 60 NAD(P)-linked enzymes with predicted localization to the nucleus, including many with unknown function (e.g. OXNAD1). At present, it is unclear whether there are significant differences between the NAD+/NADH ratio in the cytoplasm versus the nucleus (51, 52), but it is likely that local spatial variations may influence enzyme activity (53) and may provide a metabolic rationale for localization in the cytosol versus nucleus.
Fasting/feeding variation of the expression of the hepatic NAD(P)ome
The liver exhibits dramatic transcriptional changes with fasting and feeding, and many of these varying pathways are crucial for hepatic physiology (e.g. cholesterol biosynthesis and gluconeogenesis). Nearly a third of hepatic NAD(P)ome genes display significant differences in gene expression between fasting and feeding based on a recent transcriptome survey (105/362 genes) (54), the majority of which replicate using two similar datasets (Fig. 3E and Table S1) (55, 56). For example, multiple enzymes in de novo NAD+ biosynthesis increase with fasting (TDO2, AFMID, KMO, and KYNU) (Fig. 4).
Diurnal variation in gene expression of the hepatic NAD(P)ome
Temporal (circadian) variation in gene expression serves to anticipate and orchestrate daily organismal physiology. In the liver, circadian rhythms drive periodic expression of over 3000 genes, higher than in any other tissue (57, 58), and the cellular redox state has been shown both to vary with circadian periodicity and to also itself to regulate the circadian cycle (59). For example, both total NAD+ levels and the rate-limiting enzyme of NAD+ salvage, nicotinamide phosphoribosyltransferase (NAMPT), display circadian oscillations (60). In addition, the NAD+-dependent deacetylase SIRT1 modulates activity of the CLOCK–BMAL1 complex that drives circadian oscillations.
Based on one representative liver transcriptome study (57), we find that nearly ¼ of the hepatic NAD(P)ome shows circadian variation (Fig. 3F). For example, strong circadian expression is observed for NADK, a cytosolic enzyme that converts NAD+ to NADP+ (61) and is thought be a major determinant of cytosolic NADPH versus NADH (62–64). These expression dynamics match those of 3-hydroxy-3-methylglutaryl-CoA reductase (Fig. 3G), the rate-limiting step of cholesterol biosynthesis and an avid consumer of NADPH in the cytosol, raising the hypothesis that NADK may temporally influence NAD+ and NADP+ levels to optimize temporal changes in cholesterol biosynthesis. Mitochondrial NAD kinase (NADK2) (65) does not exhibit circadian variation.
Ongoing challenges and future opportunities
Historically, investigations of hepatic NADH and NADPH have been largely limited to differences between mitochondria and cytosol and the paradigm that cytosolic NADPH is used for reductive biosynthesis, whereas mitochondrial NAD+ is utilized for catabolism. Studies over the past decade have indicated that NAD+ can also serve as a key substrate for protein modifications and for the DNA damage response. Our genomic survey here demonstrates a surprisingly large number of NAD(P)+-linked enzymes that are predicted to be localized to other compartments, notably the nucleus and ER, and that many of these NAD(P)+-linked processes show diurnal or feeding/fasting variation, predicting they may be highly regulated to control physiology.
It is clear that NAD(P)H play a much broader role than the traditional paradigm, yet there are important gaps in our further understanding of this expanded role. First, little is known about NAD(P)H redox ratios and pools sizes in these other subcellular compartments, and even within mitochondria and cytosol, more direct measurements are required. Second, the dynamics of subcellular compartmental hepatic NAD(P)+ levels in different nutritional states (such as with feeding and fasting) remain poorly understood. Although classic studies estimated these ratios using coupled metabolites, most modern measurements have resorted to measuring total cellular NAD+ or NADH pools (4, 33, 34). However, because of NAD(P)+ compartmentalization and complexity of free-versus-bound pools, these modern cellular measurements are an incomplete assessment of relevant compartment-specific redox states, which should involve measurements of both total pool sizes and free ratios. These limitations underscore the need for revisiting this problem to more precisely measure compartment-specific free ratios and pool sizes in vivo. Finally, given the central role NAD(P)+ plays in metabolism, it is unclear to what extent compartmental NAD(P)+ is the determinant of rather than the indicator of different aspects of cellular metabolism, which can only be clarified through direct, compartment-specific manipulation of NAD(P)+ redox ratios and pool sizes.
Although these challenges seem daunting, the last several years have seen the development of genetic tools for measuring and manipulating NADH and NADPH metabolism that should facilitate these investigations. These tools can be genetically targeted to different subcellular compartments and can thus overcome many of the traditional limitations of existing tools. For example, fluorescence protein reporters have been developed to directly measure NADH (66), the NAD+/NADH ratio (52, 67–69), and NADPH (51) in the cytosol, as well as NAD+ (70) and the NAD+/NADH ratio in the mitochondria (68, 70). Application of such tools is beginning to reveal new insights, including subcellular dynamics of NAD+ synthesis in the nucleus and cytoplasm (70) and preferential pathways supporting cytosolic NADPH over NADH production in glucose-limiting conditions in a cancer cell line (51). Concurrently, new genetic tools are being developed to directly manipulate compartment-specific NADH or NAD redox metabolism. For example, we have targeted a bacterial water-forming NADH oxidase from Lactobacillus brevis (LbNOX) to the cytosol and to mitochondria to manipulate NAD+/NADH levels in living cells (73), and more recently, we rationally engineered a quintuple mutant of this enzyme, called TPNOX, that is highly specific for compartment-specific oxidation of NADPH (74). In the future, it should be possible to render these enzymes to be under the control of light or small molecules to allow for temporal analysis (75, 76). These methods will needed to be combined with methods to alter pool sizes, for example by providing biosynthetic precursors, to tease apart the relative contributions of NAD(P) redox ratios versus pool sizes in driving physiology.
The insights derived from such basic studies are likely to prove invaluable in furthering our understanding of the pathogenesis of common liver diseases that have been linked to derangements in hepatic NAD(P)+, such as alcoholic liver disease, nonalcoholic fatty liver disease, and diabetes (10, 11, 77–80). How can we reconcile, for example, that boosting total hepatic NAD+ levels by providing precursors improves glucose homeostasis in mice (80), but that metformin, one of the most widely prescribed diabetic drugs in the world, exerts its effect through decreasing the cytosolic hepatic NAD+/NADH ratio (15). Such examples illustrate the complexities that underlie measurements of total cellular NAD(P)+ and how compartmental approaches to understanding NAD(P)+ biology will be required to dissect organ level pathophysiology.
Methods
Identifying NAD(P) reactions
The KEGG database of reactions, enzymes, and genes was downloaded (5/30/2017) (39–41). To limit to human metabolic reactions, human gene identifiers were mapped to enzyme commission identifiers and then to KEGG reaction identifiers, yielding a total of 2444 unique human reactions, containing a total of 2268 compounds. Thus, by using KEGG, each compound was linked to one or more human reactions: 990 reactions linked to H2O, 543 to H+, 488 to NAD(P)(H) (Table S1), 323 to oxygen, 262 to ATP, etc.
Building the NAD(P)ome
Human and mouse RefSeq proteins (release 63) were downloaded from NCBI and mapped to NCBI Gene loci (81). Human and mouse orthologs were assigned via best bidirectional hit (BlastP, Expect <1e-3) (82). Human genes were linked to enzyme commission (EC) numbers via a union of annotations in KEGG (5/30/2017) (39–41) and UniProt Description (DE) annotations (2/22/2017) (83). A candidate NAD(P)+ list was generated from the union of four methods (see Table S1): 1) identify human enzymes linked to NAD metabolism by first mapping each human gene to a set of EC identifiers and then mapping EC identifiers to KEGG reactions that utilized NAD(P)+ (specifically, KEGG chemical identifiers C00003, C00004, C00005, or C00006); 2) identify human protein sequences containing NAD-related binding domains based on PFAM or Interpro (annotated in UniProt), where protein domains with descriptions that contained “NAD” were manually reviewed for inclusion (e.g. “Oxidoreductase NAD-binding domain” and “NAD-dependent epimerase/dehydratase family”); 3) identify human genes associated with NAD, in the Gene Ontology (GO) molecular function database from NCBI (09/14/2017), where annotations containing “NAD” were manually reviewed for inclusion; and 4) manual inclusion of all genes related to NAD(P) biosynthesis, subunits of large NAD dehydrogenase complexes (e.g. complex I, BCKD), and cytochromes P450. This candidate list of 540 human genes was manually reviewed to exclude genes with weak evidence, yielding a final list of 426 genes in the human NAD(P)ome. Most of these 426 genes were identified by multiple sources: 335 enzymes were linked to NAD(P) in KEGG; 271 contained NAD-related protein domains; 254 had NAD-related GO annotations; and 29 were added by manual review (see Table S1 for complete details).
Hepatic NAD(P)ome
The hepatic NAD(P)ome was defined as those genes showing minimal liver expression in any of three experimental tissue atlases from human or mouse: 1) human mRNA transcripts with median RPKM ≥2 in the GTEx v6p RNA-Seq tissue atlas (84) (including 53 tissues from 544 human autopsy donors; Ensembl gene identifiers were mapped to NCBI gene identifiers via Ensembl BioMart (85)); 2) proteins detected by MS in mouse liver with log10 (total intensity) ≥5 within a 28-tissue protein atlas (86); 3) mouse mRNA transcripts with log2(expression) ≥5 based on the GNFv3 microarray atlas surveying 91 mouse tissues (71). The 352 hepatic NAD(P)ome genes were manually reviewed, and 32 proteins were annotated as “unstudied” based on the numbers of publications in PubMed, automated annotations using the GO biological process, and manual literature review. The liver expressed more NAD(P)ome genes compared with other GTEx tissues, based on counting the total number of NAD(P)ome genes expressed in each GTEx tissue (defined as RPKM >2). Liver-specific genes were defined as those with liver expression at least three standard deviations higher than mean expression across all tissues (i.e. liver Z-score >3).
Integrating datasets
Subcellular localization was defined using the Human Protein Atlas (46). Categories were assigned based on the “main locations” from Table 6 in Ref. 46, and then mapped to 13 locations as shown in Fig. 1A in Ref 46. For organelles not present in the Human Protein Atlas (e.g. peroxisome and lysosome), subcellular localizations were systematically identified from UniProt (downloaded 2/22/2017). Circadian data were obtained from a Hughes et al. (57) microarray time course experiment where mouse livers were obtained hourly over 48 h. The gene expression series GSE11923 was obtained from the Gene Expression Omnibus (72). Probe sets were mapped to genes via Affymetrix mapping files, and for each gene the best probe set was retained based on the probe set annotation suffix (preferentially using probe sets ending in_at, then a_at, then x_at then s_at) and then the highest mean expression; Z-scores were computed for each dataset. Genes showing circadian patterns were defined as those showing significant circadian patterns at 8, 12, or 24 h based on the supporting data in Hughes et al. (57). Fasting/feeding data were obtained from Montagner et al. (54) that interrogated liver gene expression in mice fed ad libitum, fasted for 24 h, and fasted for 24 h and then refed for 24 h (with a minimum of four biological replicates per condition). Genes that showed differential fasting/feeding expression were defined as those with a p value ≤0.05 (after Bonferroni correction), based on the mean across five fasting time points versus five refeeding time points (two-sided, homoscedastic t test). These 105 genes were also investigated using two independent datasets of mouse fasting/refeeding (GSE13093 (55) and GDS4872 (56)), and 65 showed concordant fasting/feeding changes in either study (same direction and nominal p value <0.05).
Supplementary Material
Acknowledgments
We thank Rohit Sharma, Denis Titov, and Patrick Ward for critical reading of the manuscript.
This is the third article in the Thematic Minireview Series “Redox metabolism and signaling.” The authors declare that they have no conflicts of interest with the contents of this article.
This article contains Tables S1–S2.
- SIRT
- sirtuin
- PARP
- poly(ADP-ribose) polymerase
- ER
- endoplasmic reticulum
- NADK
- NAD kinase
- LDH
- lactate dehydrogenase
- RPKM
- reads per kilobase of transcript per million
- ME
- malic enzyme.
References
- 1. Chambon P., Weill J. D., and Mandel P. (1963) Nicotinamide mononucleotide activation of new DNA-dependent polyadenylic acid synthesizing nuclear enzyme. Biochem. Biophys. Res. Commun. 11, 39–43 10.1016/0006-291X(63)90024-X [DOI] [PubMed] [Google Scholar]
- 2. Takamura-Enya T., Watanabe M., Totsuka Y., Kanazawa T., Matsushima-Hibiya Y., Koyama K., Sugimura T., and Wakabayashi K. (2001) Mono(ADP-ribosyl)ation of 2′-deoxyguanosine residue in DNA by an apoptosis-inducing protein, pierisin-1, from cabbage butterfly. Proc. Natl. Acad. Sci. U.S.A. 98, 12414–12419 10.1073/pnas.221444598 [DOI] [PMC free article] [PubMed] [Google Scholar]
- 3. Hirschey M. D., Shimazu T., Goetzman E., Jing E., Schwer B., Lombard D. B., Grueter C. A., Harris C., Biddinger S., Ilkayeva O. R., Stevens R. D., Li Y., Saha A. K., Ruderman N. B., Bain J. R., Newgard C. B., et al. (2010) SIRT3 regulates mitochondrial fatty-acid oxidation by reversible enzyme deacetylation. Nature 464, 121–125 10.1038/nature08778 [DOI] [PMC free article] [PubMed] [Google Scholar]
- 4. Nakagawa T., Lomb D. J., Haigis M. C., and Guarente L. (2009) SIRT5 deacetylates carbamoyl phosphate synthetase 1 and regulates the urea cycle. Cell 137, 560–570 10.1016/j.cell.2009.02.026 [DOI] [PMC free article] [PubMed] [Google Scholar]
- 5. Bai P., and Cantó C. (2012) The role of PARP-1 and PARP-2 enzymes in metabolic regulation and disease. Cell Metab. 16, 290–295 10.1016/j.cmet.2012.06.016 [DOI] [PubMed] [Google Scholar]
- 6. Fliegert R., Gasser A., and Guse A. H. (2007) Regulation of calcium signalling by adenine-based second messengers. Biochem. Soc. Trans. 35, 109–114 10.1042/BST0350109 [DOI] [PubMed] [Google Scholar]
- 7. Koch-Nolte F., Haag F., Guse A. H., Lund F., and Ziegler M. (2009) Emerging roles of NAD+ and its metabolites in cell signaling. Sci. Signal. 2, mr1. 10.1126/scisignal.257mr1 [DOI] [PubMed] [Google Scholar]
- 8. Lin S. J., and Guarente L. (2003) Nicotinamide adenine dinucleotide, a metabolic regulator of transcription, longevity and disease. Curr. Opin. Cell Biol. 15, 241–246 10.1016/S0955-0674(03)00006-1 [DOI] [PubMed] [Google Scholar]
- 9. Kersten S., Seydoux J., Peters J. M., Gonzalez F. J., Desvergne B., and Wahli W. (1999) Peroxisome proliferator-activated receptor α mediates the adaptive response to fasting. J. Clin. Invest. 103, 1489–1498 10.1172/JCI6223 [DOI] [PMC free article] [PubMed] [Google Scholar]
- 10. Isselbacher K. J., and Greenberger N. J. (1964) Metabolic effects of alcohol on the live. N. Engl. J. Med. 270, 351–356 10.1056/NEJM196402132700707 [DOI] [PubMed] [Google Scholar]
- 11. Isselbacher K. J., and Greenberger N. J. (1964) Metabolic effects of alcohol on the liver. N. Engl. J. Med. 270, 403–410 [DOI] [PubMed] [Google Scholar]
- 12. Riddick D. S., Ding X., Wolf C. R., Porter T. D., Pandey A. V, Zhang Q.-Y., Gu J., Finn R. D., Ronseaux S., McLaughlin L. A., Henderson C. J., Zou L., and Flück C. E. (2013) NADPH-cytochrome P450 oxidoreductase: roles in physiology, pharmacology, and toxicology. Drug Metab. Dispos. 41, 12–23 10.1124/dmd.112.048991 [DOI] [PMC free article] [PubMed] [Google Scholar]
- 13. El-Mir M. Y., Nogueira V., Fontaine E., Avéret N., Rigoulet M., and Leverve X. (2000) Dimethylbiguanide inhibits cell respiration via an indirect effect targeted on the respiratory chain complex I. J. Biol. Chem. 275, 223–228 10.1074/jbc.275.1.223 [DOI] [PubMed] [Google Scholar]
- 14. Owen M. R., Doran E., and Halestrap A. P. (2000) Evidence that metformin exerts its anti-diabetic effects through inhibition of complex 1 of the mitochondrial respiratory chain. Biochem. J. 348, 607–614 10.1042/0264-6021:3480607,10.1042/bj3480607 [DOI] [PMC free article] [PubMed] [Google Scholar]
- 15. Madiraju A. K., Erion D. M., Rahimi Y., Zhang X.-M., Braddock D. T., Albright R. A., Prigaro B. J., Wood J. L., Bhanot S., MacDonald M. J., Jurczak M. J., Camporez J.-P., Lee H.-Y., Cline G. W., Samuel V. T., et al. (2014) Metformin suppresses gluconeogenesis by inhibiting mitochondrial glycerophosphate dehydrogenase. Nature 510, 542–546 10.1038/nature13270 [DOI] [PMC free article] [PubMed] [Google Scholar]
- 16. Veech R. L., Eggleston L. V, and Krebs H. A. (1969) The redox state of free nicotinamide-adenine dinucleotide phosphate in the cytoplasm of rat liver. Biochem. J. 115, 609–619 10.1042/bj1150609a [DOI] [PMC free article] [PubMed] [Google Scholar]
- 17. Williamson D. H., Lund P., and Krebs H. A. (1967) The redox state of free nicotinamide-adenine dinucleotide in the cytoplasm and mitochondria of rat liver. Biochem. J. 103, 514–527 10.1042/bj1030514 [DOI] [PMC free article] [PubMed] [Google Scholar]
- 18. Krebs H. A., and Gascoyne T. (1968) The redox state of the nicotinamide-adenine dinucleotides in rat liver homogenates. Biochem. J. 108, 513–520 10.1042/bj1080513 [DOI] [PMC free article] [PubMed] [Google Scholar]
- 19. Stubbs M., Veech R. L., and Krebs H. A. (1972) Control of the redox state of the nicotinamide-adenine dinucleotide couple in rat liver cytoplasm. Biochem. J. 126, 59–65 10.1042/bj1260059 [DOI] [PMC free article] [PubMed] [Google Scholar]
- 20. Siess E. A., Brocks D. G., Lattke H. K., and Wieland O. H. (1977) Effect of glucagon on metabolite compartmentation in isolated rat liver cells during gluconeogenesis from lactate. Biochem. J. 166, 225–235 10.1042/bj1660225 [DOI] [PMC free article] [PubMed] [Google Scholar]
- 21. Langdon R. G. (1955) The requirement of triphosphopyridine nucleotide in fatty acid synthesis. J. Am. Chem. Soc. 77, 5190–5192 10.1021/ja01624a085 [DOI] [Google Scholar]
- 22. LaNoue K. F., and Tischler M. E. (1974) Electrogenic characteristics of the mitochondrial glutamate-aspartate antiporter. J. Biol. Chem. 249, 7522–7528 [PubMed] [Google Scholar]
- 23. Davis E. J., Bremer J., and Akerman K. E. (1980) Thermodynamic aspects of translocation of reducing equivalents by mitochondria. J. Biol. Chem. 255, 2277–2283 [PubMed] [Google Scholar]
- 24. Rothe F., Brosz M., and Storm-Mathisen J. (1995) Quantitative ultrastructural localization of glutamate dehydrogenase in the rat cerebellar cortex. Neuroscience 64, iii–xvi [DOI] [PubMed] [Google Scholar]
- 25. Schägger H., Cramer W. A., and von Jagow G. (1994) Physiological roles of nicotinamide nucleotide transhydrogenase. Anal. Biochem. 217, 220–230 10.1006/abio.1994.1112 [DOI] [PubMed] [Google Scholar]
- 26. Rydström J. (2006) Mitochondrial NADPH, transhydrogenase and disease. Biochim. Biophys. Acta 1757, 721–726 10.1016/j.bbabio.2006.03.010 [DOI] [PubMed] [Google Scholar]
- 27. Glock G. E., and Mclean P. (1955) The determination of oxidized and reduced diphosphopyridine nucleotide and triphosphopyridine nucleotide in animal tissues. Biochem. J. 61, 381–388 10.1042/bj0610381 [DOI] [PMC free article] [PubMed] [Google Scholar]
- 28. Gaikwad A., Long D. J. 2nd., Stringer J. L., and Jaiswal A. K. (2001) In vivo role of NAD(P)H:quinone oxidoreductase 1 (NQO1) in the regulation of intracellular redox state and accumulation of abdominal adipose tissue. J. Biol. Chem. 276, 22559–22564 10.1074/jbc.M101053200 [DOI] [PubMed] [Google Scholar]
- 29. Chen D., Bruno J., Easlon E., Lin S. J., Cheng H. L., Alt F. W., and Guarente L. (2008) Tissue-specific regulation of SIRT1 by calorie restriction. Genes Dev. 22, 1753–1757 10.1101/gad.1650608 [DOI] [PMC free article] [PubMed] [Google Scholar]
- 30. Houtkooper R. H., Cantó C., Wanders R. J., and Auwerx J. (2010) The secret life of NAD+: an old metabolite controlling new metabolic signaling pathways. Endocr. Rev. 31, 194–223 10.1210/er.2009-0026 [DOI] [PMC free article] [PubMed] [Google Scholar]
- 31. Madsen A. S., Andersen C., Daoud M., Anderson K. A., Laursen J. S., Chakladar S., Huynh F. K., Colaço A. R., Backos D. S., Fristrup P., Hirschey M. D., and Olsen C. A. (2016) Investigating the sensitivity of NAD+-dependent sirtuin deacylation activities to NADH. J. Biol. Chem. 291, 7128–7141 10.1074/jbc.M115.668699 [DOI] [PMC free article] [PubMed] [Google Scholar]
- 32. Kolthur-Seetharam U., Dantzer F., McBurney M. W., de Murcia G., and Sassone-Corsi P. (2006) Control of AIF-mediated cell death by the functional interplay of SIRT1 and PARP-1 in response to DNA damage. Cell Cycle 5, 873–877 10.4161/cc.5.8.2690 [DOI] [PubMed] [Google Scholar]
- 33. Hayashida S., Arimoto A., Kuramoto Y., Kozako T., Honda S., Shimeno H., and Soeda S. (2010) Fasting promotes the expression of SIRT1, an NAD+-dependent protein deacetylase, via activation of PPARα in mice. Mol. Cell. Biochem. 339, 285–292 10.1007/s11010-010-0391-z [DOI] [PubMed] [Google Scholar]
- 34. Rodgers J. T., Lerin C., Haas W., Gygi S. P., Spiegelman B. M., and Puigserver P. (2005) Nutrient control of glucose homeostasis through a complex of PGC-1α and SIRT1. Nature 434, 113–118 10.1038/nature03354 [DOI] [PubMed] [Google Scholar]
- 35. Qiao A., Jin X., Pang J., Moskophidis D., and Mivechi N. F. (2017) The transcriptional regulator of the chaperone response HSF1 controls hepatic bioenergetics and protein homeostasis. J. Cell Biol. 216, 723–741 10.1083/jcb.201607091 [DOI] [PMC free article] [PubMed] [Google Scholar]
- 36. Shimoyama M., Ohota M., Kakehi K., and Ueda I. (1970) Increase of NAD glycohydrolase activity and decrease of NAD concentration in rat liver during fasting. Biochim. Biophys. Acta 215, 207–209 10.1016/0304-4165(70)90410-1 [DOI] [PubMed] [Google Scholar]
- 37. Palero J. A., Bader A. N., de Bruijn H. S., der Ploeg van den Heuvel Av., Sterenborg H. J., and Gerritsen H. C. (2011) In vivo monitoring of protein-bound and free NADH during ischemia by nonlinear spectral imaging microscopy. Biomed. Opt. Express 2, 1030–1039 10.1364/BOE.2.001030 [DOI] [PMC free article] [PubMed] [Google Scholar]
- 38. Vishwasrao H. D., Heikal A. A., Kasischke K. A., and Webb W. W. (2005) Conformational dependence of intracellular NADH on metabolic state revealed by associated fluorescence anisotropy. J. Biol. Chem. 280, 25119–25126 10.1074/jbc.M502475200 [DOI] [PubMed] [Google Scholar]
- 39. Kanehisa M., and Goto S. (2000) KEGG: kyoto encyclopedia of genes and genomes. Nucleic Acids Res. 28, 27–30 10.1093/nar/28.1.27 [DOI] [PMC free article] [PubMed] [Google Scholar]
- 40. Kanehisa M., Sato Y., Kawashima M., Furumichi M., and Tanabe M. (2016) KEGG as a reference resource for gene and protein annotation. Nucleic Acids Res. 44, D457–D462 10.1093/nar/gkv1070 [DOI] [PMC free article] [PubMed] [Google Scholar]
- 41. Kanehisa M., Furumichi M., Tanabe M., Sato Y., and Morishima K. (2017) KEGG: new perspectives on genomes, pathways, diseases and drugs. Nucleic Acids Res. 45, D353–D361 10.1093/nar/gkw1092 [DOI] [PMC free article] [PubMed] [Google Scholar]
- 42. Finn R. D., Coggill P., Eberhardt R. Y., Eddy S. R., Mistry J., Mitchell A. L., Potter S. C., Punta M., Qureshi M., Sangrador-Vegas A., Salazar G. A., Tate J., and Bateman A. (2016) The Pfam protein families database: towards a more sustainable future. Nucleic Acids Res. 44, D279–D285 10.1093/nar/gkv1344 [DOI] [PMC free article] [PubMed] [Google Scholar]
- 43. Finn R. D., Attwood T. K., Babbitt P. C., Bateman A., Bork P., Bridge A. J., Chang H. Y., Dosztányi Z., El-Gebali S., Fraser M., Gough J., Haft D., Holliday G. L., Huang H., Huang X., et al. (2017) InterPro in 2017-beyond protein family and domain annotations. Nucleic Acids Res. 45, D190–D199 10.1093/nar/gkw1107 [DOI] [PMC free article] [PubMed] [Google Scholar]
- 44. The Gene Ontology Consortium. (2017) Expansion of the gene ontology knowledgebase and resources. Nucleic Acids Res. 45, D331–D338 10.1093/nar/gkw1108 [DOI] [PMC free article] [PubMed] [Google Scholar]
- 45. Ashburner M., Ball C. A., Blake J. A., Botstein D., Butler H., Cherry J. M., Davis A. P., Dolinski K., Dwight S. S., Eppig J. T., Harris M. A., Hill D. P., Issel-Tarver L., Kasarskis A., Lewis S., et al. (2000) Gene ontology: tool for the unification of biology. The Gene Ontology Consortium. Nat. Genet. 25, 25–29 10.1038/75556 [DOI] [PMC free article] [PubMed] [Google Scholar]
- 46. Thul P. J., Åkesson L., Wiking M., Mahdessian D., Geladaki A., Ait Blal H., Alm T., Asplund A., Björk L., Breckels L. M., Bäckström A., Danielsson F., Fagerberg L., Fall J., Gatto L., et al. (2017) A subcellular map of the human proteome. Science 356, eaal3321 10.1126/science.aal3321 [DOI] [PubMed] [Google Scholar]
- 47. Bublitz C., and Lawler C. A. (1987) The levels of nicotinamide nucleotides in liver microsomes and their possible significance to the function of hexose phosphate dehydrogenase. Biochem. J. 245, 263–267 10.1042/bj2450263 [DOI] [PMC free article] [PubMed] [Google Scholar]
- 48. Tucker K. R., Cavolo S. L., and Levitan E. S. (2016) Elevated mitochondria-coupled NAD(P)H in endoplasmic reticulum of dopamine neurons. Mol. Biol. Cell 27, 3214–3220 10.1091/mbc.E16-07-0479 [DOI] [PMC free article] [PubMed] [Google Scholar]
- 49. Csala M., Bánhegyi G., and Benedetti A. (2006) Endoplasmic reticulum: a metabolic compartment. FEBS Lett. 580, 2160–2165 10.1016/j.febslet.2006.03.050 [DOI] [PubMed] [Google Scholar]
- 50. Piccirella S., Czegle I., Lizák B., Margittai E., Senesi S., Papp E., Csala M., Fulceri R., Csermely P., Mandl J., Benedetti A., and Bánhegyi G. (2006) Uncoupled redox systems in the lumen of the endoplasmic reticulum: pyridine nucleotides stay reduced in an oxidative environment. J. Biol. Chem. 281, 4671–4677 10.1074/jbc.M509406200 [DOI] [PubMed] [Google Scholar]
- 51. Tao R., Zhao Y., Chu H., Wang A., Zhu J., Chen X., Zou Y., Shi M., Liu R., Su N., Du J., Zhou H.-M., Zhu L., Qian X., Liu H., Loscalzo J., and Yang Y. (2017) Genetically encoded fluorescent sensors reveal dynamic regulation of NADPH metabolism. Nat. Methods 14, 720–728 10.1038/nmeth.4306 [DOI] [PMC free article] [PubMed] [Google Scholar]
- 52. Zhao Y., Hu Q., Cheng F., Su N., Wang A., Zou Y., Hu H., Chen X., Zhou H.-M., Huang X., Yang K., Zhu Q., Wang X., Yi J., Zhu L., et al. (2015) SoNar, a highly responsive NAD+/NADH sensor, allows high-throughput metabolic screening of anti-tumor agents. Cell Metab. 21, 777–789 10.1016/j.cmet.2015.04.009 [DOI] [PMC free article] [PubMed] [Google Scholar]
- 53. Aguilar-Arnal L., Ranjit S., Stringari C., Orozco-Solis R., Gratton E., and Sassone-Corsi P. (2016) Spatial dynamics of SIRT1 and the subnuclear distribution of NADH species. Proc. Natl. Acad. Sci. U.S.A. 113, 12715–12720 10.1073/pnas.1609227113 [DOI] [PMC free article] [PubMed] [Google Scholar]
- 54. Montagner A., Polizzi A., Fouché E., Ducheix S., Lippi Y., Lasserre F., Barquissau V., Régnier M., Lukowicz C., Benhamed F., Iroz A., Bertrand-Michel J., Al Saati T., Cano P., Mselli-Lakhal L., et al. (2016) Liver PPARα is crucial for whole-body fatty acid homeostasis and is protective against NAFLD. Gut 65, 1202–1214 10.1136/gutjnl-2015-310798 [DOI] [PMC free article] [PubMed] [Google Scholar]
- 55. Vollmers C., Gill S., DiTacchio L., Pulivarthy S. R., Le H. D., and Panda S. (2009) Time of feeding and the intrinsic circadian clock drive rhythms in hepatic gene expression. Proc. Natl. Acad. Sci. U.S.A. 106, 21453–21458 10.1073/pnas.0909591106 [DOI] [PMC free article] [PubMed] [Google Scholar]
- 56. van Diepen J. A., Jansen P. A., Ballak D. B., Hijmans A., Hooiveld G. J., Rommelaere S., Galland F., Naquet P., Rutjes F. P., Mensink R. P., Schrauwen P., Tack C. J., Netea M. G., Kersten S., Schalkwijk J., and Stienstra R. (2014) PPAR-α dependent regulation of vanin-1 mediates hepatic lipid metabolism. J. Hepatol. 61, 366–372 10.1016/j.jhep.2014.04.013 [DOI] [PubMed] [Google Scholar]
- 57. Hughes M. E., DiTacchio L., Hayes K. R., Vollmers C., Pulivarthy S., Baggs J. E., Panda S., and Hogenesch J. B. (2009) Harmonics of circadian gene transcription in mammals. PLoS Genet. 5, e1000442 10.1371/journal.pgen.1000442 [DOI] [PMC free article] [PubMed] [Google Scholar]
- 58. Zhang R., Lahens N. F., Ballance H. I., Hughes M. E., and Hogenesch J. B. (2014) A circadian gene expression atlas in mammals: implications for biology and medicine. Proc. Natl. Acad. Sci. U.S.A. 111, 16219–16224 10.1073/pnas.1408886111 [DOI] [PMC free article] [PubMed] [Google Scholar]
- 59. Rutter J., Reick M., Wu L. C., and McKnight S. L. (2001) Regulation of clock and NPAS2 DNA binding by the redox state of NAD cofactors. Science 293, 510–514 10.1126/science.1060698 [DOI] [PubMed] [Google Scholar]
- 60. Ramsey K. M., Yoshino J., Brace C. S., Abrassart D., Kobayashi Y., Marcheva B., Hong H. K., Chong J. L., Buhr E. D., Lee C., Takahashi J. S., Imai S., and Bass J. (2009) Circadian clock feedback cycle through NAMPT-mediated NAD+ biosynthesis. Science 324, 651–654 10.1126/science.1171641 [DOI] [PMC free article] [PubMed] [Google Scholar]
- 61. Lerner F., Niere M., Ludwig A., and Ziegler M. (2001) Structural and functional characterization of human NAD kinase. Biochem. Biophys. Res. Commun. 288, 69–74 10.1006/bbrc.2001.5735 [DOI] [PubMed] [Google Scholar]
- 62. Love N. R., Pollak N., Dölle C., Niere M., Chen Y., Oliveri P., Amaya E., Patel S., and Ziegler M. (2015) NAD kinase controls animal NADP biosynthesis and is modulated via evolutionarily divergent calmodulin-dependent mechanisms. Proc. Natl. Acad. Sci. U.S.A. 112, 1–2 10.1073/pnas.1417290112 [DOI] [PMC free article] [PubMed] [Google Scholar]
- 63. Shi F., Li Y., Li Y., and Wang X. (2009) Molecular properties, functions, and potential applications of NAD kinases. Acta Biochim. Biophys. Sin. 41, 352–361 10.1093/abbs/gmp029 [DOI] [PubMed] [Google Scholar]
- 64. Pollak N., Niere M., and Ziegler M. (2007) NAD kinase levels control the NADPH concentration in human cells. J. Biol. Chem. 282, 33562–33571 10.1074/jbc.M704442200 [DOI] [PubMed] [Google Scholar]
- 65. Ohashi K., Kawai S., and Murata K. (2012) Identification and characterization of a human mitochondrial NAD kinase. Nat. Commun. 3, 1248 10.1038/ncomms2262 [DOI] [PMC free article] [PubMed] [Google Scholar]
- 66. Zhao Y., Jin J., Hu Q., Zhou H. M., Yi J., Yu Z., Xu L., Wang X., Yang Y., and Loscalzo J. (2011) Genetically encoded fluorescent sensors for intracellular NADH detection. Cell Metab. 14, 555–566 10.1016/j.cmet.2011.09.004 [DOI] [PMC free article] [PubMed] [Google Scholar]
- 67. Hung Y. P., Albeck J. G., Tantama M., and Yellen G. (2011) Imaging cytosolic NADH-NAD+ redox state with a genetically encoded fluorescent biosensor Yin. Cell Metab. 14, 545–554 10.1016/j.cmet.2011.08.012 [DOI] [PMC free article] [PubMed] [Google Scholar]
- 68. Bilan D. S., Matlashov M. E., Gorokhovatsky A. Y., Schultz C., Enikolopov G., and Belousov V. V. (2014) Genetically encoded fluorescent indicator for imaging NAD+/NADH ratio changes in different cellular compartments. Biochim. Biophys. Acta 1840, 951–957 10.1016/j.bbagen.2013.11.018 [DOI] [PMC free article] [PubMed] [Google Scholar]
- 69. Masia R., McCarty W. J., Lahmann C., Luther J., Chung R. T., Yarmush M. L., and Yellen G. (2018) Live cell imaging of cytosolic NADH/NAD+ ratio in hepatocytes and liver slices. Am. J. Physiol. Gastrointest. Liver Physiol. 314, G97–G108 10.1152/ajpgi.00093.2017 [DOI] [PMC free article] [PubMed] [Google Scholar]
- 70. Cambronne X. A., Stewart M. L., Kim D., Jones-Brunette A. M., Morgan R. K., Farrens D. L., Cohen M. S., and Goodman R. H. (2016) Biosensor reveals multiple sources for mitochondrial NAD+. Science 352, 1474–1477 10.1126/science.aad5168 [DOI] [PMC free article] [PubMed] [Google Scholar]
- 71. Lattin J. E., Schroder K., Su A. I., Walker J. R., Zhang J., Wiltshire T., Saijo K., Glass C. K., Hume D. A., Kellie S., and Sweet M. J. (2008) Expression analysis of G protein-coupled receptors in mouse macrophages. Immunome Res. 4, 1–13 [DOI] [PMC free article] [PubMed] [Google Scholar]
- 72. Edgar R., Domrachev M., and Lash A. E. (2002) Gene expression omnibus: NCBI gene expression and hybridization array data repository. Nucleic Acids Res. 30, 207–210 10.1093/nar/30.1.207 [DOI] [PMC free article] [PubMed] [Google Scholar]
- 73. Titov D. V, Cracan V., Goodman R. P., Peng J., Grabarek Z., and Mootha V. K. (2016) Complementation of mitochondrial electron transport chain by manipulation of the NAD+/NADH ratio. Science 352, 231–235 10.1126/science.aad4017 [DOI] [PMC free article] [PubMed] [Google Scholar]
- 74. Cracan V., Titov D. V, Shen H., Grabarek Z., and Mootha V. K. (2017) A genetically encoded tool for manipulation of NADP+/NADPH in living cells. Nat. Chem. Biol. 13, 1088–1095 10.1038/nchembio.2454 [DOI] [PMC free article] [PubMed] [Google Scholar]
- 75. Glantz S. T., Carpenter E. J., Melkonian M., Gardner K. H., Boyden E. S., Wong G. K., and Chow B. Y. (2016) Functional and topological diversity of LOV domain photoreceptors. Proc. Natl. Acad. Sci. U.S.A. 113, E1442–E1451 10.1073/pnas.1509428113 [DOI] [PMC free article] [PubMed] [Google Scholar]
- 76. Sando R. 3rd., Baumgaertel K., Pieraut S., Torabi-Rander N., Wandless T. J., Mayford M., and Maximov A. (2013) Inducible control of gene expression with destabilized Cre. Nat. Methods 10, 1085–1088 10.1038/nmeth.2640 [DOI] [PMC free article] [PubMed] [Google Scholar]
- 77. Bailey S. M., Pietsch E. C., and Cunningham C. C. (1999) Ethanol stimulates the production of reactive oxygen species at mitochondrial complexes I and III. Free Radic. Biol. Med. 27, 891–900 10.1016/S0891-5849(99)00138-0 [DOI] [PubMed] [Google Scholar]
- 78. Gariani K., Menzies K. J., Ryu D., Wegner C. J., Wang X., Ropelle E. R., Moullan N., Zhang H., Perino A., Lemos V., Kim B., Park Y. K., Piersigilli A., Pham T. X., Yang Y., et al. (2016) Eliciting the mitochondrial unfolded protein response by nicotinamide adenine dinucleotide repletion reverses fatty liver disease in mice. Hepatology 63, 1190–1204 10.1002/hep.28245 [DOI] [PMC free article] [PubMed] [Google Scholar]
- 79. Grunnet N., and Kondrup J. (1986) The effect of ethanol on the β-oxidation of fatty acids. Alcohol. Clin. Exp. Res. 10, 64S–68S 10.1111/j.1530-0277.1986.tb05182.x [DOI] [PubMed] [Google Scholar]
- 80. Yoshino J., Mills K. F., Yoon M. J., and Imai S. (2011) Nicotinamide mononucleotide, a key NAD+ intermediate, treats the pathophysiology of diet- and age-induced diabetes in mice. Cell Metab. 14, 528–536 10.1016/j.cmet.2011.08.014 [DOI] [PMC free article] [PubMed] [Google Scholar]
- 81. Brown G. R., Hem V., Katz K. S., Ovetsky M., Wallin C., Ermolaeva O., Tolstoy I., Tatusova T., Pruitt K. D., Maglott D. R., and Murphy T. D. (2015) Gene: a gene-centered information resource at NCBI. Nucleic Acids Res. 43, D36–D42 10.1093/nar/gku1055 [DOI] [PMC free article] [PubMed] [Google Scholar]
- 82. Camacho C., Coulouris G., Avagyan V., Ma N., Papadopoulos J., Bealer K., and Madden T. L. (2009) BLAST+: architecture and applications. BMC Bioinformatics 10, 421 10.1186/1471-2105-10-421 [DOI] [PMC free article] [PubMed] [Google Scholar]
- 83. Wasmuth E. V, and Lima C. D. (2017) UniProt: the universal protein knowledgebase. Nucleic Acids Res. 45, 1–12 10.1093/nar/gkw1099 [DOI] [PMC free article] [PubMed] [Google Scholar]
- 84. GTEx Consortium. (2013) The genotype-tissue expression (GTEx) project. Nat. Genet. 45, 580–585 10.1038/ng.2653 [DOI] [PMC free article] [PubMed] [Google Scholar]
- 85. Yates A., Akanni W., Amode M. R., Barrell D., Billis K., Carvalho-Silva D., Cummins C., Clapham P., Fitzgerald S., Gil L., Girón C. G., Gordon L., Hourlier T., Hunt S. E., Janacek S. H., et al. (2016) Ensembl 2016. Nucleic Acids Res. 44, D710–D716 10.1093/nar/gkv1157 [DOI] [PMC free article] [PubMed] [Google Scholar]
- 86. Geiger T., Velic A., Macek B., Lundberg E., Kampf C., Nagaraj N., Uhlen M., Cox J., and Mann M. (2013) Initial quantitative proteomic map of 28 mouse tissues using the SILAC mouse. Mol. Cell. Proteomics 12, 1709–1722 10.1074/mcp.M112.024919 [DOI] [PMC free article] [PubMed] [Google Scholar]
Associated Data
This section collects any data citations, data availability statements, or supplementary materials included in this article.