

Abstract
This study examined the impact of disclosing sub-classifications of genetic variants of uncertain significance (VUS) on behavioral intentions. We studied return of VUS results to 79 individuals with a cardiomyopathy-associated VUS, sub-classified into VUS-high or VUS-low. Primary outcomes were perceived risk (absolute and comparative), perceived severity, perceived value of information, self-efficacy, decision regret, and behavioral intentions to share results and change behaviors. There was no significant difference between the two sub-classes in overall behavioral intentions (t=0.023, p=0.982) and each of the individual items on the behavioral intentions scale; absolute (t=−1.138, p=0.259) or comparative (t=−0.463, p=0.645) risk perceptions; perceived value of information (t=0.582, p=0.563) and self-efficacy (t=−0.733, p=0.466). Decision regret was significantly different (t=2.148, p=0.035), with VUS-low (mean= 17.24, SD= 16.08) reporting greater regret. Combining the sub-classes, perceived value of information was the strongest predictor of behavioral intentions (β = 0.524, p <0.001). Participants generally understood the meaning of a genetic VUS result classification and reported satisfaction with result disclosure. No differences in behavioral intentions were found, but differences in decision regret suggest participants distinguish sub-classes of VUS results. The perceived value of VUS may motivate recipients to pursue health-related behaviors.
Keywords: decision regret, exome sequencing, result disclosure, variant of uncertain significance, VUS sub-classification
Graphical abstract
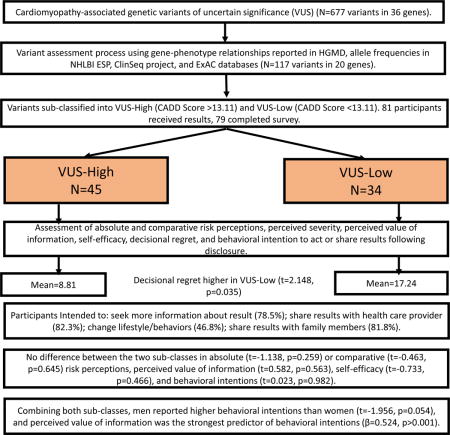
Disclosure of Cardiac Variants of Uncertain Significance Results in an Exome Cohort. HGMD: Human Gene Mutation Database; NHLBI ESP: National Heart, Lung, & Blood Institute Exome Sequencing Project; ExAC: Exome Aggregation Consortium; CADD: Combined Annotation Dependent Depletion. Statistical significance set at p<0.05.
INTRODUCTION
Variants of uncertain significance (VUS) are a complex aspect of the debate over which results should be disclosed to individuals from next-generation sequencing (NGS). A VUS is defined by the joint American College of Medical Genetics and Genomics and the Association for Molecular Pathology (ACMG/AMP)1 as variants that have a probability of pathogenicity between 10 and 90%. The intermediate pathogenicity probability of a VUS gives ambiguous indication of disease risk, leaving participants and providers uncertain about the clinical significance of the variant in question2. Indeed, few results can be classified as absolute in medicine or genetics.3 The majority of results from NGS are interpreted as VUS, yet VUS results can have variable levels of evidence supporting pathogenicity. Some variants with pathogenicity evidence approach classification standards for “likely or definitely pathogenic”, whereas others with no evidence of pathogenicity approach classifications for “likely or definitely benign”. The former may be described as a high VUS, VUS-high and the latter, low VUS, VUS-low.
Perceptions of uncertainty can affect individuals’ decisions to learn, interpret, and act on sequencing results4. Although the negative impact of VUS results on recipients’ risk perceptions, surgical decisions, and disease-specific distress5 have been demonstrated in breast cancer patients, there is limited evidence on how recipients respond to VUS results disclosure in other genetic diseases. Greater understanding of how participants perceive VUS and what they intend to do with them can help frame discussion of the benefits and harms associated with returning VUS results.6
Although the ACMG/AMP system does not differentiate VUS results into sub-groups1, if recipients interpret sub-classifications of VUS results differently, it may be reasonable to use an expanded scoring system. One way to assess discrimination in perceptions is to explore whether division or sub-classifications of VUS results into high and low groups leads to different outcomes. Accordingly, we conducted an experiment to test whether participants in a genome sequencing study who received VUS results divided into one of two sub-groups (VUS-high and VUS-low) had different intentions to change their behaviors. The VUS results selected for this sub-classification had no available published information in the literature and were divided into VUS-high and VUS-low sub-groups based solely on a predictive algorithm score. How participants make cognitive, affective and behavioral distinctions among VUS results is largely unknown, but experimental results suggest that in the face of VUS results, research participants imbue them with meaning that may eventually have clinical consequences.7,8 Previous studies evaluating perceptions and treatment related decisions following VUS disclosure are predominantly focused on BRCA1/2 genes.9,10 To our knowledge, there are no published studies on disclosure of VUS sub-classification results and their impact on perceptions and behaviors. We aim to contribute to the literature on classification of uncertainties as they gain in complexity in the context of genome sequencing.
We used the Health Belief Model11 (HBM) as a framework to examine the effect of disclosing the two VUS sub-classes on recipients’ intentions to pursue health-related behaviors. The HBM hypothesizes that health-related actions depend on the occurrence of four factors: sufficient concern to make a health issue relevant (severity or seriousness); the belief that one is susceptible to a serious health concern (risk or susceptibility); and the belief that following a particular health recommendation would be beneficial in reducing the perceived threat (benefits); at a subjectively-acceptable cost. There is well-established support for the role of self-efficacy in the initiation and maintenance of behavioral change.12,13 For a behavior change to succeed, people must believe themselves competent to implement that change.
A recent meta-analysis shows that experimental manipulations of risk perception have significant effects on health intentions (d = .31) and behaviors (d = .23)14, therefore, we included two well-validated assessments of risk perception that have been shown to be conceptually and empirically distinguishable from each other. The first is a measure of “absolute risk” or the subjective likelihood of succumbing to a cardiomyopathy, and the second measures the subjective likelihood of developing cardiomyopathy compared to a person with similar characteristics (comparative risk). To predict behavioral intentions, perceived risk (absolute and comparative), perceived severity, perceived benefit (information value) and self-efficacy were measured in VUS recipients. Moreover, differences between the two VUS subgroups were assessed.
MATERIALS AND METHODS
The ClinSeq® Study (ClinicalTrials.gov NCT00410241) is a cohort selected for a range of atherosclerosis phenotypes. Participants were classified for coronary artery disease (CAD) risk based on their 10-year Framingham risk score (Table 1). Participants in Bins 1-3 (81%) were considered “healthy volunteers” whereas those in Bin 4 (19%) had CAD15.
Table 1.
Participant demographic characteristics
| Characteristic | Participant, n (%) |
|---|---|
| Race/Ethnicity | |
| Caucasian | 65 (80.2) |
| Asian | 9 (11.1) |
| Other, not Hispanic or Latino | 2(2.5) |
| Other, Hispanic or Latino | 2 (2.5) |
| African-American | 3 (3.7) |
| Education | |
| High school | 2 (2.5) |
| Some college/Technical school | 11 (13.6) |
| College | 26 (32.1) |
| Postgraduate | 39 (48.1) |
| Not reported | 3 (3.7) |
| Age (years) | |
| 50-65 | 51 (63.0) |
| 66-75 | 30 (37.0) |
| Sex | |
| Female | 39 (48.1) |
| VUS | |
| Low | 35 (43.2) |
| High | 46 (56.8) |
| Bins | |
| 1-3 | 66 (81.5) |
| 4 | 15* (18.5) |
VUS = variant of uncertain significance, sub-classified into high versus low; Bins = based on 10-year Framingham risk calculation (1 = <5%, 2 = 5%-10%, 3 = >10%, 4 = known coronary artery disease).
14 males and 1 female.
Participants (including both “healthy volunteers” and those with CAD) with a VUS in one of 36 genes were identified from a prior study of 870 individuals in the ClinSeq® cohort.16 Although identifying VUS results in participants with CAD may not directly influence their ongoing treatment, it could still influence their perceptions of risk and intentions to pursue health related behaviors. Eligible ClinSeq® participants completed a cardiomyopathy screening questionnaire that included questions on personal and family history related to heart failure, enlarged heart, and sudden death. Individuals with abnormal ECHO findings (i.e., septal wall thickness ≥12 mm, left ventricular ejection fraction <50%, abnormal chamber size) and no identifiable cause (i.e., hypertension, CAD, myocardial infarction, and valvular abnormalities) suggestive of a possible genetic cardiomyopathy were excluded. Participant eligibility for this experiment was determined based on variant characteristics. We included missense and canonical splice site variants from 36 cardiomyopathy-associated genes identified from the exome sequencing data and characterized as VUS with no available published information in the literature. Variants in genes with weak disease-gene association (<10 published variants associated with cardiomyopathy, 16 genes) were excluded from this study. Variants with allele frequencies in any population in the Exome Aggregation Consortium (ExAC) database17 greater than the prevalence of hypertrophic (1/500)18, dilated (1/250)19, arrhythmogenic right ventricular (1/1000)20 and left ventricular non-compaction (1/10,000)21 cardiomyopathy and the estimated disease contribution attributable to the specific gene18,19 were excluded. A total of 117 participants had variants that met these filter criteria (Supplementary Figure 1).
A predictive algorithm (Combined Annotation Dependent Depletion – CADD)22 was used to artificially stratify the cardiomyopathy-associated genetic VUS into VUS-high (CADD score>13.11) and VUS-low (CADD score<13.11) sub-groups to test whether participants could recognize the difference and if it changed their health behavior intentions. A cutoff on deleteriousness between scaled CADD scores of 10 and 20 is suggested to identify potentially pathogenic variants, but the exact point is arbitrary.22 CADD score of 13.11 in our dataset provided a similar number of variants for each subcategory.
Results were validated in a Clinical Laboratory Improvement Act (CLIA)-compliant process and were disclosed during an in-person visit to the NIH Clinical Center lasting about one hour. Participants gave written consent to learn their results and permission to audiotape their sessions. The EKG and echocardiogram findings (septal and posterior wall thickness, chamber diameter) performed at initial ClinSeq® enrollment were reviewed with participants. Participants were told whether their variant was classified as a VUS-high or VUS-low and informed that the sub-classifications were created solely for research purposes and were not useful for guiding clinical care. Participants with a positive family history of cardiomyopathy were advised to share results with their healthcare providers. All participants were advised to follow up with their healthcare providers if they were concerned about their VUS, and testing of family members for the variant was not recommended.
Participants received a copy of their test report at the end of the session and were sent a letter summarizing their session and asking them to complete an online survey two weeks following their visit. Data for the analyses came from this online survey, which included scales assessing behavioral intentions, perceived risk, perceived severity, perceived value of information, self-efficacy, and decision regret.
The behavioral intentions scale examined the intentions of recipients of genetic test results. The scale was used to capture whether participants perceived sufficient risk of a VUS sub-class to promote intentions to pursue recommendations associated with their VUS results. The scale used an average score on four items (Cronbach’s α = 0.83) to assess intentions to: seek additional information about received information; use information to change lifestyle/health behaviors; share result with healthcare provider/utilize recommended healthcare screening; and share results with valued others. Two of these items (intentions to change health behaviors and intentions to share results) have been used in previous publications7,23. Each item was rated on a five-point Likert scale from “1-definitely no” to “5-definitely yes” following VUS disclosure.
Perceived risk was measured two ways using two distinct one-item statements designed to assess absolute and comparative risks23 to develop cardiomyopathy. A similar item has been used for nearly 15 years in the nationally representative Health Information National Trends Survey (HINTS; hints.cancer.gov) and has been shown to be predictive of many related constructs such as worry24. Participants rated how likely they were to get cardiomyopathy in their lifetime on a seven-point Likert scale from ‘1-extremely unlikely’ to ‘7-extremely likely’. The second is a measure of comparative risk, which was included based on research demonstrating that people often attend more to how their risk compares with that of similar others than they do to their absolute risk25. Participants were asked how their risk compared to that of others their same age and sex on a seven-point scale ranging from ‘1-much less likely than the average person’ to ‘7-much more likely than the average person.’ Comparative risk measures are often only moderately correlated with absolute risk measures, and in some studies, they explain additional (and sometimes more) variance in behavior relative to absolute risk perceptions26,27. The single item measure of comparative risk used here has also been shown to be predictive of other related constructs, reliable over time and across contexts28, and distinguishable from the absolute risk measure24. Both of these measures have been used and validated in previous ClinSeq® analyses.23
Perceived severity was measured using a scale that was adapted from Champions’ Perceived Severity Scale, a 12-item scale that measures the perceived impact an illness would have on respondents as well as the severity of the disease. Items are rated on a five-item scale from “1-strongly disagree” to “5-strongly agree” with a Cronbach’s α score of 0.78 and test-retest reliability of 0.76 across an interval of two weeks11.
Perceived value or benefit of information can be defined as an individual’s overall assessment of the utility of a product based on perceptions of what was received and what was given.29 The value (utility) derived from information received will depend on the recipient’s perception of the quality of the information, the ability of the information to enhance recipient’s social self-concept, and the feelings (positive or negative) the information generates. The scale consisted of eight items (Cronbach’s α= 0.87) with five-point Likert items from “1-strongly disagree” to “5-strongly agree” that measured attitudes (Cronbach’s α= 0.88 to 0.96), social norms (Cronbach’s α= 0.82 to 0.93), and expected benefits (Cronbach’s α= 0.82 to 0.93) of disclosed result7.
Perceived self-efficacy predicts intention and behavior, reflecting a sense of control of one’s environment and behavior12 and was measured with responses to two questions: “I feel confident and competent to pursue health-related behaviors that could help manage and monitor my susceptibility to cardiomyopathy”, and “I am certain my efforts to pursue health-related behaviors will be successful”. Both questions were rated on a Likert scale of “1-very uncertain” to “5-very certain” with high internal consistency (Cronbach’s α= 0.89).
The Decision Regret Scale (DRS) is a five-item scale that measures regret associated with health care decisions. It is a well-validated scale with good internal consistency (Cronbach’s α = 0.81-0.92) and a strong correlation with decision satisfaction (r = −0.40 to −0.60) and decision conflict (0.31 to 0.52)30. The DRS was added after 11 participants had completed their survey. The scale was modified to refer to regret associated with decision to learn VUS results (Cronbach’s α = 0.89). The five items that make up the DRS are scored on a Likert scale from 1 (strongly agree) to 5 (strongly disagree). Items 2 and 4 were reverse-coded so that a higher number indicated more regret. The mean score across items was computed and converted to a total score out of 100 with a score of 0 meaning no regret, scores between 0-30 interpreted as mild regret, and scores from 30 to 100 interpreted as moderate to high regret.31
Participants were asked three open-ended questions to assess their understanding of VUS, if and how the result was shared with family members, and the ways in which they were satisfied and dissatisfied with the result disclosure process.
Statistical Analyses
Descriptive statistics were performed to characterize the demographics of the study sample. A series of t-tests was performed to investigate the effect of VUS sub-classification (VUS-high and VUS-low) on perceived risk, perceived severity, perceived value of information, self-efficacy, decision regret, and behavioral intentions. Bivariate correlations were examined for variables predicted to explain behavioral intentions. Finally, combining both sub-classes, the extent to which behavioral intentions could be considered a function of perceived risk, perceived severity, perceived value of information, self-efficacy, and sex was assessed through multiple linear regression analyses. All analyses for this study were accomplished using STATA 14 (StataCorp. College Station, Texas) and Microsoft Excel (Microsoft, Redmond, WA). Statistical significance for all analyses was set at p<0.05.
Qualitative Analyses
The responses to three open-ended survey questions were independently coded and thematically analyzed by two team members (KL, AH) who were not involved in the return of result sessions and were blinded to participants’ VUS sub-classification. A codebook was developed by the first coder and revised through coding a portion of the data and discussion with the second coder led to a final version used by both coders. Discrepancies were reviewed and reconciled, and the coded data were analyzed to identify themes.
The National Human Genome Research Institute’s institutional review board approved this study. Participants were not compensated for their participation.
RESULTS
Participants
Out of the 117 eligible participants, 81 (69%) enrolled in this study and were provided verbal consent via telephone. Individuals were excluded due to concurrent enrollment in other ongoing ClinSeq® projects (n=5), septal wall thickness ≥12mm without an identifiable cause (n=3), and inability to validate variant using Sanger sequencing (n=4). Nine individuals were lost to follow-up or withdrew from the ClinSeq® project. Fifteen individuals declined for reasons including travel requirement (n=12) and uncertainty of the result (n=3). Seventy-nine participants (VUS-high = 45; VUS-low = 34) completed the follow up survey (response rate = 97.5%), and so all analyses are based on n=79. Average survey completion time from result disclosure was 5.33 weeks (SD = 4.95).
Eighty percent of the participants in this study were white and had at least a college education. They ranged in age from 51 to 73 years and 48% were female (Table 1). Prior to enrollment, 19% of study participants had a personal history of coronary artery disease (Bin 4). These demographic characteristics are consistent with those of larger samples of the ClinSeq® population.15 Of the 79 survey respondents, 33 were first-time ClinSeq® result recipients and 46 had received genetic results from ClinSeq® prior to participation in this project. Nine respondents reported a family history of cardiomyopathy (see supplemental material S1).
VUS sub-classification and Behavioral Intentions
Analyses were conducted on the 4-item behavioral intentions index and each individual item on the scale. Overall, most participants intended to seek more information about their results (62/78, 79.5%), share results with their healthcare provider (65/79, 82.3%), and share their results with family members (63/77, 81.8%) (Table 2). There were no statistically significant differences in overall behavioral intentions between the two VUS sub-classes (t=0.023, p=0.982). Additionally, no statistically significant differences were identified between the two VUS sub-classes in each of the four items that make up the behavioral intentions scale (seek more information (t=0.533, p=0.595); share results with health care provider (t=−0.692, p=0.491); change lifestyle/behavior (t=−0.172, p=0.864); share results with family (t=0.555, p=0.581)) and the VUS sub-classes. When VUS-high and VUS-low were combined, there was no statistically significant difference in overall behavioral intentions between individuals with and without family history of cardiomyopathy (t=0.557, p=0.579) and those with and without personal history of CAD (t=0.746, p=0.458). First-time result recipients reported higher intentions to change their lifestyle/health behaviors (t=2.263, p=0.026) following result disclosure than prior result recipients. However, there were no statistically significant difference in intentions to seek more information (t=1.942, p=0.056), or to share results with healthcare providers (t=0.620, p=0.537) and family members (t=0.555, p=0.581).
Table 2.
Behavior Intentions
| Intentions | Definitely no (1) | Probably no (2) | Unsure (3) | Probably yes (4) | Definitely yes (5) | Weighted Average* (SD) | |||||
|---|---|---|---|---|---|---|---|---|---|---|---|
| VUS-L | VUS-H | VUS-L | VUS-H | VUS-L | VUS-H | VUS-L | VUS-H | VUS-L | VUS-H | ||
| Seek more information (n=78) | 0 | 1 | 3 | 5 | 4 | 3 | 12 | 18 | 15 | 17 | 4.08 (1.01) |
| Share with healthcare provider (n=79) | 1 | 1 | 3 | 4 | 3 | 2 | 8 | 8 | 19 | 30 | 4.30 (1.09) |
| Change lifestyle/health behaviors (n=79) | 3 | 1 | 6 | 14 | 11 | 7 | 7 | 16 | 7 | 7 | 3.29 (1.17) |
| Share with family/valued others (n=77) | 0 | 1 | 2 | 2 | 3 | 6 | 11 | 14 | 17 | 21 | 4.23 (0.94) |
Sub-classification: VUS-L (Low) and VUS-H (High).
Average rating or sentiment among respondents. Calculated as follows: w1x1 + w2x2 +w3x3 +….wnxn/Total; w= weight assigned to each answer choice (in parenthesis), and x= response count for answer choice.
VUS sub-classification and Risk Perceptions
There were no differences in absolute (t=−1.138, p=0.259) and comparative (t=−0.463, p=0.645) risk perceptions, perceived severity (t=0.675, p=0.502), perceived information value (t=0.582, p=0.563), and self-efficacy (t=−0.733, p=0.466) between the VUS sub-classes. Absolute risk perception was moderately correlated with comparative risk perception (r=0.503, p<0.001), irrespective of VUS sub-class.
VUS sub-classification and Decision Regret
A total of 68 participants completed the DRS (Table 3). Overall, the scores were skewed towards less regret (mean = 12.40, SD = 16.42, possible range 0-100), and 57 participants (83.8%) reported no or mild regret (scores= 0-30). Upon sub-classification (Figure 1), participants in the VUS-low sub-class reported higher regret (mean= 17.24, SD= 16.08 [95% CI: 11.13 – 23.36]) compared to those in the VUS-high sub-class (mean= 8.81, SD= 15.95 [95% CI: 3.64 – 13.98]) (t= 2.148, p= 0.035).
Table 3.
Decision Regret Scale
| Statements N=68 |
Extent of agreement or disagreement (%) | |||||
|---|---|---|---|---|---|---|
| Strongly agree (1) | Agree (2) | Neither agree nor disagree (3) | Disagree (4) | Strongly disagree (5) | Weighted Average* (SD) | |
| It was the right decision | 42(61.76) | 16(23.53) | 7(10.29) | 1(1.47) | 2(2.94) | 1.60 (0.94) |
| I regret the choice that was made | 1(1.47) | 2(2.94) | 5(7.35) | 18(26.47) | 42(61.76) | 4.44 (0.86) |
| I would go for the same choice if I had to do it over again | 46(67.65) | 17(25.0) | 2(2.94) | 1(1.47) | 2(2.94) | 1.47 (0.86) |
| The choice did me a lot of harm | 1(1.47) | 1(1.47) | 4(5.88) | 20(29.41) | 42(61.76) | 4.49 (0.79) |
| The decision was a wise one | 42(61.76) | 13(19.12) | 10(14.71) | 1(1.47) | 2(2.94) | 1.65 (0.98) |
Average rating or sentiment among respondents. Calculated as follows: w1x1 + w2x2 +w3x3 +….wnxn/Total; w= weight assigned to each answer choice (in parenthesis), and x= response count for answer choice.
Figure 1.
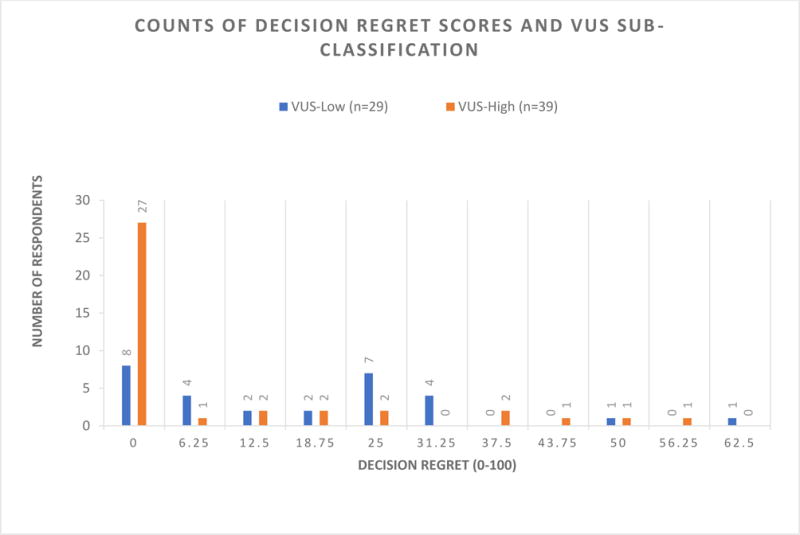
Counts of decision regret scores and VUS sub-classification. Overall scores are skewed towards less decision regret. Participants in the VUS-low sub-class reported higher regret (mean= 17.24, SD= 16.08 [95% CI: 11.13 – 23.36]) compared to those in the VUS-high sub-class (mean= 8.81, SD= 15.95 [95% CI: 3.64 – 13.98]) (t= 2.148, p= 0.035).
Predictors of Overall Behavioral Intentions
Combining both sub-classes, perceived value of information was highly correlated with (r=0.60, p<0.001), and the strongest predictor of, overall behavioral intentions (β = 0.524, p <0.001) in a multivariate regression model. Perceived risk, perceived severity, and self-efficacy had weak, statistically insignificant effects in the regression model. Men reported greater behavioral intentions following VUS disclosure than women (t= −1.956, p = 0.054), but sex was not a statistically significant predictor in the multivariate model and so was not further explored. The model explained 43.1% (adjusted R2 = 38.4%) of the variance in behavioral intentions of VUS recipients.
Qualitative data
VUS Meaning
Sixty-one individuals responded to the question “What do you understand your VUS to mean?”. Most participants explained that it meant that the significance of the variant for their health was uncertain (n=31) or made some reference to having a genetic ‘variant’, ‘change’, or anomaly (n=26). One participant stated, “In other words, a gene variant was found but there is no information to say if it is benign or harmful” (Male, 70, VUS-low). Thirteen participants (five VUS-low, eight VUS-high) used stronger language to describe the association of their variant and health risks, stating that the variant “may” or “could” put them at risk for a health condition without any qualifiers that the risk was unknown or uncertain at this time.
Sharing result with family members
Fifty-three individuals (21 VUS-low, 32 VUS-high) responded to the question “If you shared your result, how did you describe it your family members?”. Twelve participants (eight VUS-low, four VUS-high) responded that they had not yet shared their result with family members. Twenty-one participants provided detail on how they shared their result or with which family members they shared them. The most common methods for disclosing the results were sharing the result report or summary letter (N=9) or describing the result in a conversation (N=7). Twelve participants (two VUS-low, ten VUS-high) informed their family members that the variant has unknown or unclear ramifications for their personal health. One individual said, “I have a variation in a large gene but no one knows if that variation causes any problems” (Male, 55, VUS-high). Three participants (two VUS-low, one VUS-high) used stronger language to describe the association between their variant and health risks, with two of those participants seeming to state that the variant explained an existing health problem, such as “Son already has this condition, already aware” (Female, 62, VUS-low).
Satisfaction with result
Sixty individuals (24 VUS-low, 36 VUS-high) responded to the question “In what ways were you satisfied with the result you received and in what ways were you not?” Thirty-six participants (60%) (14 VUS-low, 22 VUS-high) expressed some degree of satisfaction with receiving their result. Fourteen participants (seven VUS-low, seven VUS-high) described their satisfaction as stemming from an increased ability to be proactive about their health after receiving this result. The majority of participants were satisfied with their decision to learn VUS results (58% VUS-low, 61% VUS-high). Reported satisfaction ranged from satisfying curiosity, altruism, engagement with research, contribution to future knowledge, information utility and sense of awareness about overall health. Ten participants (17%) (six VUS-low, four VUS-high) expressed some degree of dissatisfaction. The most common source of dissatisfaction related to the uncertainty of the significance of the results for personal health. As one individual stated “The information is very impractical to provide to my doctor. I’m not sure what she would do with the results” (Female, 66, VUS-high).
DISCUSSION
The five-category classification system recommended by the ACMG/AMP1 defined a wide range of probabilities of pathogenicity (0.10 – 0.90) for VUS, which makes it challenging to provide clinical recommendations to participants who receive them. We set out to test if individuals could appreciate differences in sub-classification of such results by examining the difference in behavioral intentions and factors predictive of behavioral intentions after receiving such results.
There were no significant differences in overall behavioral intentions nor amongst the four items that make up the behavioral intentions scale (seek more information; share results with health care provider; change lifestyle/behavior; share results with family) between the two VUS sub-classes. Thus, we cannot reject the null hypothesis that splitting VUS into VUS-high and VUS-low has no effect on health intentions. There were no significant differences in absolute and comparative risk perceptions, perceived severity, perceived information value, and self-efficacy between the VUS sub-classes, which again does not allow us to reject the null hypothesis. There was a significant difference in decision regret, with regret being higher in those who received a VUS-low result (t= 2.148, p= 0.035). This result does provide some evidence that participants were able to recognize a meaningful difference in the two sub-classes of results. The higher intentions among first-time result recipients to change their lifestyle and behaviors may indicate their initial readiness to act on the disclosed information, or better understanding of the implications of VUS results by prior recipients of genetic results. To further explore our data to better understand these results, we combined the two results sub-classes and searched for predictors of behavioral intentions. The perceived value of the information was highly correlated with (r=0.60, p<0.001), and the strongest predictor of, behavioral intentions (β = 0.524, p <0.001) in a multivariate regression model, with perceived risk, perceived severity, and self-efficacy showing no association. Overall, our results do not provide strong support for the hypothesis that individuals can perceive a difference in VUS-high vs. VUS-low results and suggests that the perceived value of the result (independent of VUS-high or VUS-low) may be a stronger predictor of intentions than is VUS sub-classification.
Our qualitative data showed that participants had a good overall understanding of the meaning of a VUS by expressing nuance and sophistication regarding the results. There was a great degree of variation as to whether and if so, how the participants shared the result with family members. The qualitative responses on satisfaction of learning their result were also highly variable but did not obviously explain the association of VUS-high and VUS-low and decision regret that was noted above.
Our observation that satisfaction was more correlated with perceived value is of interest. This is consistent with our participants’ self-reported positive attitudes and intentions toward receiving VUS results that were reported prior to joining this study and before they received any results.32 Uncertainty resulting from lack of information about their variants was the most commonly reported source of dissatisfaction with these results, as would be expected.
Intention is the most proximal predictor of behavior33. In this sample, perceived benefit, operationalized as perceived value of information emerged as the only significant predictor of behavioral intentions (β = 0.530, p <0.001). Similar to our findings, previous studies conducted to determine whether the dimensions of the HBM could longitudinally predict behavior showed that perceived benefits are stronger predictors of behavior than perceived risk and severity.34
Limitations of this study include the fact that we collected data from a relatively small number of participants who were predominantly white, highly educated, and older than reproductive age, and as such may not be representative of the general public’s reaction to VUS sub-classification. Participants self-selected to participate in a genetics study and therefore could be more motivated to learn and act on their results than other groups of individuals. Changes to ongoing medical management resulting from VUS disclosures to healthcare providers were not assessed in this study. These changes could have included recommendations for lifestyle/behavior modifications especially in recipients with CAD. An exclusion criterion for participation in the ClinSeq® study was prior exome or genome sequencing; however, these participants could have undergone other genetic testing that exposed them to the concept of VUS results. The small number of participants with family history of cardiomyopathy may have affected the ability to measure the potential influence of family history on behavioral intentions. An open-ended question that allowed participants to express satisfaction or dissatisfaction with any aspects of their experience with the VUS disclosure can be context-specific and not yield similar results when compared with using standardized surveys. Because the study was enriched for participants with atherosclerosis, there may be an overrepresentation of individuals with a family history of sudden cardiac death which may affect their interpretation of utility for a cardiomyopathy variant. In this study, we selected two assessments of risk perception that have been validated in past ClinSeq® analyses,23 absolute risk and comparative risk. Although comparative risk perceptions are predictive of protective behaviors and health information processing in cancer24,25, they were not predictive of behavioral intentions in this study. Going forward, adopting the TRIRISK model35 to assess deliberative, affective, and experiential risk perceptions and their relations to downstream health behaviors may be warranted.
CONCLUSION
There were no differences in behavioral intentions between the two cardiomyopathy-associated VUS sub-classes. The difference in decision regret between VUS sub-classes provides some support that recipients can distinguish VUS-high from VUS-low, but additional work is needed. Furthermore, a majority of VUS result recipients were satisfied with their experience and did not regret the decision despite the uncertainty associated with the disclosed information. The perceived value of information was a strong positive predictor of participants’ intentions to pursue health related behaviors following disclosure of uncertain genetic information, irrespective of VUS sub-class.
Supplementary Material
Supplementary Figure 1: Variant assessment process. Variants in genes with low quality (less than 10 published variants associated with cardiomyopathy) disease-gene association; with allele frequencies in any population in the Exome Aggregation Consortium (ExAC) database greater than the prevalence of hypertrophic, dilated, arrhythmogenic right ventricular, and left ventricular noncompaction cardiomyopathy and the estimated disease contribution attributable to the specific gene, and; those previously reported in the literature were excluded.
Acknowledgments
The authors thank the dedicated ClinSeq® participants who were part of this study. We also recognize Dr. Chakra Budhathoki, Dr. Jennifer M. Taber, John H. Patton, and Kristen Fishler for their contributions. This research was funded by the Intramural Research Programs of the National Institute of Nursing Research and National Human Genome Research Institute, National Institutes of Health.
Footnotes
DISCLOSURE
T.A.L., K.L.L., J.J.J., A.H., D.N., F.G.J., W.M.P.K., and B.B.B. have no conflicts of interest to declare. L.G.B. is an uncompensated consultant to the Illumina Corporation and receives royalties from the Genentech and Amgen Corporations.
References
- 1.Richards S, Aziz N, Bale S, et al. Standards and guidelines for the interpretation of sequence variants: a joint consensus recommendation of the American College of Medical Genetics and Genomics and the Association for Molecular Pathology. Genet Med. 2015;17(5):405–424. doi: 10.1038/gim.2015.30. [DOI] [PMC free article] [PubMed] [Google Scholar]
- 2.Cheon JY, Mozersky J, Cook-Deegan R. Variants of uncertain significance in BRCA: a harbinger of ethical and policy issues to come? Genome Med. 2014;6(12):121. doi: 10.1186/s13073-014-0121-3. [DOI] [PMC free article] [PubMed] [Google Scholar]
- 3.Han PK, Umstead KL, Bernhardt BA, et al. A taxonomy of medical uncertainties in clinical genome sequencing. Genet Med. 2017 Jan 19; doi: 10.1038/gim.2016.212. [DOI] [PMC free article] [PubMed] [Google Scholar]
- 4.Biesecker BB, Klein W, Lewis KL, et al. How do research participants perceive “uncertainty” in genome sequencing? Genet Med. 2014;16:977–980. doi: 10.1038/gim.2014.57. [DOI] [PMC free article] [PubMed] [Google Scholar]
- 5.Culver JO, Brinkerhoff CD, Clague J, et al. Variants of uncertain significance in BRCA testing: evaluation of surgical decisions, risk perception, and cancer distress. Clin Genet. 2013;84(5):464–472. doi: 10.1111/cge.12097. [DOI] [PMC free article] [PubMed] [Google Scholar]
- 6.Kohane IS, Taylor PL. Multidimensional results reporting to participants in genomic studies: getting it right. Sci Transl Med. 2010;2:37cm19. doi: 10.1126/scitranslmed.3000809. [DOI] [PubMed] [Google Scholar]
- 7.Taber JM, Klein WMP, Ferrer RA, et al. Perceived ambiguity as a barrier to intentions to learn genome sequencing results. J Behav Med. 2015;38(5):715–726. doi: 10.1007/s10865-015-9642-5. [DOI] [PMC free article] [PubMed] [Google Scholar]
- 8.Hellwig L. Master’s thesis. Baltimore: Johns Hopkins University; 2017. Likely Pathogenic, Possibly Pathogenic, or VUS: What’s the Difference? An Experimental Approach to Assess Whether Individuals Discern Differences Between Uncertain Genetic Variant Classifications. [Google Scholar]
- 9.Vos J, Otten W, van Asperen C, et al. The counsellees’ view of an unclassified variant in BRCA1/2: recall, interpretation, and impact on life. Psycho-Oncol. 2008;17:822–830. doi: 10.1002/pon.1311. [DOI] [PubMed] [Google Scholar]
- 10.van Dijk S, van Asperen CJ, Jacobi CE, et al. Variants of uncertain clinical significance as a result of BRCA1/2 testing: impact of an ambiguous breast cancer risk message. Genet Test. 2004;8:235–239. doi: 10.1089/gte.2004.8.235. [DOI] [PubMed] [Google Scholar]
- 11.Champion VL, Skinner CS. The health belief model. In: Glanz K, Rimer BK, Viswanath K, editors. Health behavior and health education: theory, research, and practice. San Francisco, CA: Jossey-Bass; 2008. [Google Scholar]
- 12.Bandura A. Self-efficacy: toward a unifying theory of behavioral change. Psychol Rev. 1977;84(2):191–215. doi: 10.1037//0033-295x.84.2.191. [DOI] [PubMed] [Google Scholar]
- 13.Janz NK, Becker MH. The health belief model: a decade later. Health Educ Q. 1984;11(1):1–47. doi: 10.1177/109019818401100101. [DOI] [PubMed] [Google Scholar]
- 14.Sheeran P, Harris PR, Epton T. Does heightening risk appraisals change people’s intentions and behavior? A meta-analysis of experimental studies. Psychol Bull. 2014;140(2):511–543. doi: 10.1037/a0033065. [DOI] [PubMed] [Google Scholar]
- 15.Lewis KL, Han PK, Hooker GW, Klein WMP, Biesecker LG, Biesecker BB. Characterizing participants in the ClinSeq genome sequencing cohort as early adopters of a new health technology. PLoS One. 2015 doi: 10.1371/journal.pone.0132690. [DOI] [PMC free article] [PubMed] [Google Scholar]
- 16.Ng D, Johnston JJ, Teer JK, et al. Interpreting secondary cardiac disease variants in an exome cohort. Circ Cardiovasc Genet. 2013;6(4):337–346. doi: 10.1161/CIRCGENETICS.113.000039. [DOI] [PMC free article] [PubMed] [Google Scholar]
- 17.Lek M, Karczewski KJ, Minikel EV, et al. Analysis of protein-coding genetic variation in 60,706 humans. Nature. 2016;17:285–291. doi: 10.1038/nature19057. [DOI] [PMC free article] [PubMed] [Google Scholar]
- 18.Maron BJ, Gardin JM, Flack JM, et al. Prevalence of hypertrophic cardiomyopathy in a general population of young adults. Echocardiographic analysis of 4111 subjects in the CARDIA Study. Coronary artery risk development in (young) adults. Circulation. 1995;92(4):785–789. doi: 10.1161/01.cir.92.4.785. [DOI] [PubMed] [Google Scholar]
- 19.Hershberger RE, Hedges DJ, Morales A. Dilated cardiomyopathy: the complexity of a diverse genetic architecture. Nat Rev Cardiol. 2013;10(9):531–547. doi: 10.1038/nrcardio.2013.105. [DOI] [PubMed] [Google Scholar]
- 20.Francés RJ. Arrhythmogenic right ventricular dysplasia/cardiomyopathy. A review and update. Int J Cardiol. 2006;110(3):279–287. doi: 10.1016/j.ijcard.2005.07.004. [DOI] [PubMed] [Google Scholar]
- 21.Ritter M, Oechslin E, Sütsch G, Attenhofer C, Schneider J, Jenni R. Isolated noncompaction of the myocardium in adults. Mayo Clin Proc. 1997;72(1):26–31. doi: 10.4065/72.1.26. [DOI] [PubMed] [Google Scholar]
- 22.Kircher M, Witten DM, Jain P, O’Roak BJ, Cooper GM, Shendure J. A general framework for estimating the relative pathogenicity of human genetic variants. Nat Genet. 2014;46(3):310–315. doi: 10.1038/ng.2892. [DOI] [PMC free article] [PubMed] [Google Scholar]
- 23.Taber JM, Klein WMP, Ferrer RA, Lewis KL, Biesecker LG, Biesecker BB. Dispositional optimism and perceived risk interact to predict intentions to learn genome sequencing results. Health Psychol. 2015;34(7):718–728. doi: 10.1037/hea0000159. [DOI] [PMC free article] [PubMed] [Google Scholar]
- 24.Zajac LE, Klein WMP, McCaul KD. Absolute and comparative risk perceptions as predictors of cancer worry: Moderating effects of gender and psychological distress. J Health Commun. 2006;11(S1):37–49. doi: 10.1080/10810730600637301. [DOI] [PubMed] [Google Scholar]
- 25.Klein WMP, Rice E. Health cognitions, decision-making and behavior: The ubiquity of social comparison. In: Suls J, Collins RL, Wheeler L, editors. Social comparison in judgment and behavior. NY: Oxford University Press; (in press) [Google Scholar]
- 26.Blalock SJ, DeVellis BM, Afifi RA, Sandler RS. Risk perceptions and participation in colorectal cancer screening. Health Psychol. 1990;9(6):792–806. doi: 10.1037//0278-6133.9.6.792. [DOI] [PubMed] [Google Scholar]
- 27.Klein WMP. Comparative risk estimates relative to the average peer predict behavioral intentions and concern about absolute risk. Risk, Decision and Policy. 2002;7(2):193–202. [Google Scholar]
- 28.Shepperd JA, Helweg-Larsen M, Ortega L. Are comparative risk judgments consistent across time and events? J Pers Soc Psychol. 2003;29(9):1169–1180. doi: 10.1177/0146167203254598. [DOI] [PubMed] [Google Scholar]
- 29.Sweeney JC, Soutar GN. Consumer Perceived Value: The development of a multiple item scale. J Retailing. 2001;77(2):203–220. [Google Scholar]
- 30.Brehaut JC, O’Connor AM, Wood TJ, et al. Validation of a decision regret scale. Med Decis Making. 2003;23:281–292. doi: 10.1177/0272989X03256005. [DOI] [PubMed] [Google Scholar]
- 31.Becerra-Perez MM, Menear M, Turcotte S, Labrecque M, Legare F. More primary care patients regret health decisions if they experienced decision conflict in the consultation: a secondary analysis of a multicenter descriptive study. BMC Fam Pract. 2016;17(1):156. doi: 10.1186/s12875-016-0558-0. [DOI] [PMC free article] [PubMed] [Google Scholar]
- 32.Facio FM, Eidem H, Fisher T, et al. Intentions to receive individual results from whole-genome sequencing among participants in the ClinSeq study. Eur J Hum Genet. 2013;21(3):261–265. doi: 10.1038/ejhg.2012.179. [DOI] [PMC free article] [PubMed] [Google Scholar]
- 33.Sniehotta FF, Scholz U, Schwarzer R. Bridging the intention-behavior gap: planning, self-efficacy, and action control in the adoption and maintenance of physical exercise. Psychol & Health. 2005;20(2):143–160. [Google Scholar]
- 34.Carpenter CJ. A meta-analysis of the effectiveness of health belief model variables in predicting behavior. Health Commun. 2010;25(8):661–669. doi: 10.1080/10410236.2010.521906. [DOI] [PubMed] [Google Scholar]
- 35.Ferrer RA, Klein WMP, Persoskie A, Avishai-Yitshak A, Sheeran P. The tripartite model of risk perception (TRIRISK): distinguishing deliberative, affective, and experiential components of perceived risk. Ann Behav Med. 2016;50(5):653–663. doi: 10.1007/s12160-016-9790-z. [DOI] [PubMed] [Google Scholar]
Associated Data
This section collects any data citations, data availability statements, or supplementary materials included in this article.
Supplementary Materials
Supplementary Figure 1: Variant assessment process. Variants in genes with low quality (less than 10 published variants associated with cardiomyopathy) disease-gene association; with allele frequencies in any population in the Exome Aggregation Consortium (ExAC) database greater than the prevalence of hypertrophic, dilated, arrhythmogenic right ventricular, and left ventricular noncompaction cardiomyopathy and the estimated disease contribution attributable to the specific gene, and; those previously reported in the literature were excluded.