Summary
The N-methyl-D-aspartate (NMDA) receptor transduces the binding of glutamate and glycine into the opening of a calcium-permeable ion channel1. Because the NMDA receptor has proven recalcitrant to high resolution structural studies, the mechanism by which ion channel blockers occlude ion permeation is not well understood. Here we show that removal of the ATD domains from the GluN1/GluN2B NMDA receptor (∆ATD) yields a functional receptor and well diffracting crystals, allowing us to map the binding site of the iconic NMDA receptor blocker, MK-801. Together with long-timescale molecular dynamics simulations, we illustrate how MK-801 and memantine, a drug approved for the treatment of Alzheimer’s disease, bind within the ion channel vestibule, promote closure of the ion channel gate and lodge between the M3 helix bundle crossing and the M2 pore loops, physically blocking ion permeation.
NMDA receptors comprise a heterotetrameric complex of two GluN1 subunits and two GluN2 subunits (GluN2A-2D)2 and have a domain-layered architecture, with the amino-terminal domain (ATD) and the ligand or agonist binding domain (LBD) residing in the synaptic space and the transmembrane domain (TMD) spanning the membrane 3,4. Activation requires binding of glutamate and glycine together with voltage-dependent relief of magnesium block5,6, resulting in membrane depolarization and calcium influx7, both of which are critical in synaptic transmission and plasticity as well as in cellular mechanisms for learning and memory8. Neurodegenerative disorders, chronic pain, stroke and schizophrenia are attributed to the dysfunction of NMDA receptors9. Over-activation of NMDA receptors is excitotoxic and contributes to neuronal damage after stroke or traumatic injury10. Furthermore, chronic NMDA receptor hyperactivity gives rise to a loss of neurons associated with Huntington’s, Parkinson’s and Alzheimer's disease11.
The ATDs are central to subunit-specific receptor assembly and to channel open probability, duration and deactivation rate12 and to the binding of allosteric modulators such as ifenprodil and Ro 25-69813, molecules that inhibit GluN1/GluN2B NMDA receptors and show promise in treatment of Parkinson’s and Alzheimer’s diseases14. pH-dependent GluN2B-selective inhibitors show neuroprotection in traumatic brain injury, creating a strategy for exploring therapy for brain injury with minimal side effects15. Moreover, small molecules that target the TMD, including dizolcipine (MK-801) and memantine, show promise in the treatment of excitotoxicity-related disorders16. MK-801 is a neuroprotective agent in models of stroke, trauma and Parkinsonism but it can induce psychotic behavior and neuronal degeneration17. The side effects of MK-801, likely due to its high affinity and long dwell time, preclude its clinical application. By contrast, memantine, which binds more weakly to the ion channel, is well tolerated in clinical use. Memantine is used in the treatment of Alzheimer’s disease and in early-onset epileptic encephalopathy18,19. Here we combine crystallography with long-timescale molecular dynamics (MD) simulations to reveal how the GluN1/GluN2B NMDA receptor is blocked by MK-801 and memantine.
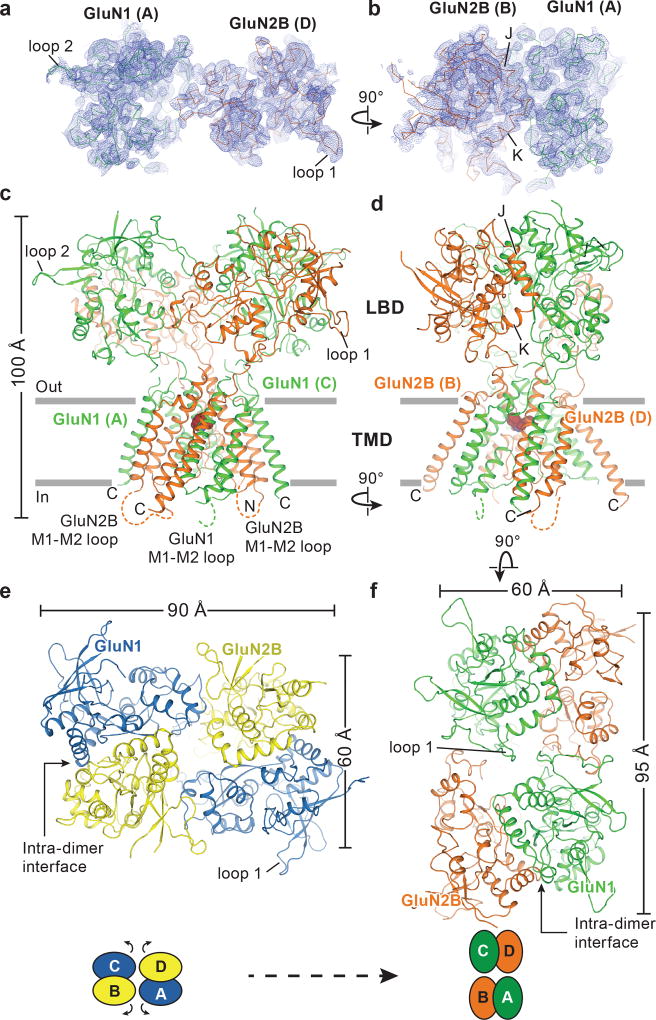
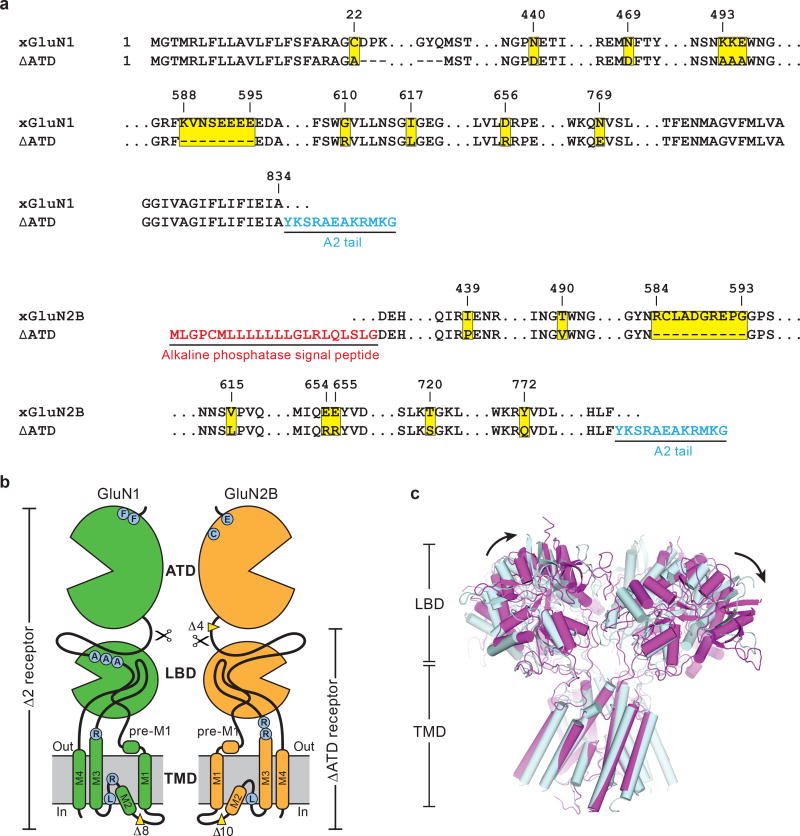
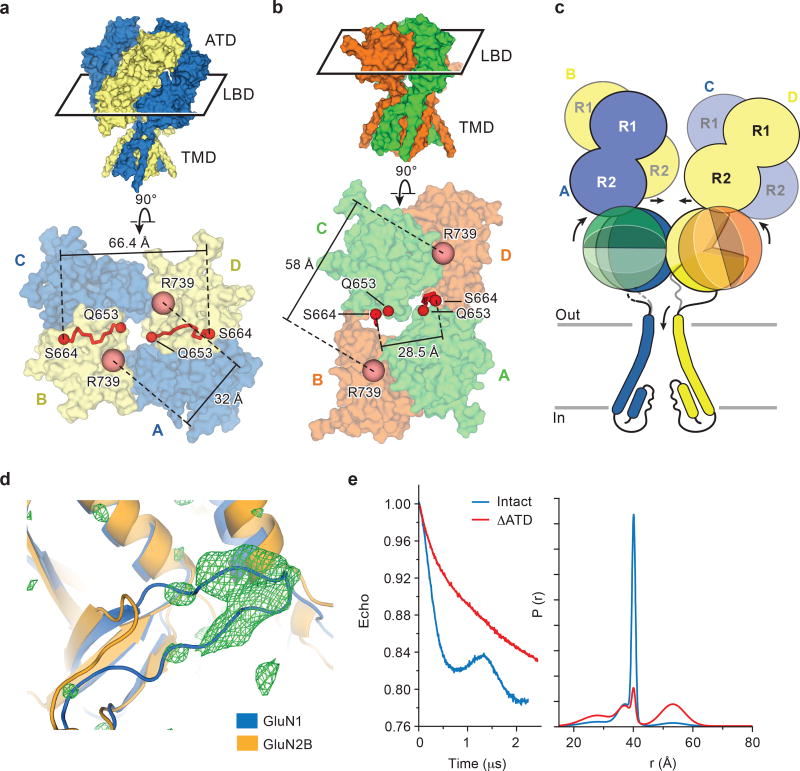
To facilitate structural analysis, the ATDs were genetically excised from the GluN1/GluN2B NMDA receptor subunits3 to yield the ∆ATD receptor (Extended Data Fig. 1a-b) which was crystallized with glycine, glutamate and MK-801 (Fig. 1a-b). The receptor crystallizes with two receptor complexes in the crystallographic asymmetric unit and, although each complex has a similar overall structure, there are differences in the relative positions of the LBD and TMD layers due to the flexible nature of the LBD-TMD linkers (Fig. 1c-f; Extended Data Fig. 1c). The LBD layer hews to a ‘dimer of dimers’ organization, maintaining the same intra-dimer interface as the intact GluN1/GluN2B NMDA receptor (∆2 receptor)3. In this ∆ATD receptor structure, the LBD subunits have swapped partners relative to the intact receptor LBD arrangement (Fig. 1e-f), thus relaxing the GluN2B LBD – TMD linkers and precluding them from transmitting conformational changes of the LBD to the TMD20 (Extended Data Fig. 2a-d, Supplementary Video 1). Double electron-electron resonance (DEER) experiments show that the LBD layer of the ∆ATD receptor, in solution, adopts two arrangements of the LBD subunits, one that is consistent with the intact ∆2 NMDA receptor3 and one that is consistent with that observed in the ∆ATD crystal structure (Extended Data Fig. 2e). We hypothesize that, because a fraction of the ∆ATD receptor molecules populate an intact receptor-like LBD layer arrangement, the ∆ATD receptor retains agonist-induced ion channel gating. However, the ∆ATD receptor also populates a conformation with a subunit-swapped LBD layer, a putatively inactive conformation that preferentially forms crystals. The propensity of the ∆ATD receptor to adopt a LBD-swapped arrangement emphasizes the role of the ATD in defining the subunit arrangement of the LBD layer.
Figure 1. Architecture of the GluN1/GluN2B ∆ATD NMDA receptor.
a-b, Composite omit maps (blue mesh) of GluN1 (green ribbon) and GluN2B (red ribbon) LBDs contoured at 1.0 σ, showing the inter-dimer (a) and intra-dimer interfaces (b). c, d, Side views of the ∆ATD receptor with GluN1 (green) and GluN2B (orange) subunits. e-f, Top-down views of the ∆2 receptor (e) and the ∆ATD receptor (f) from the extracellular side of the membrane.
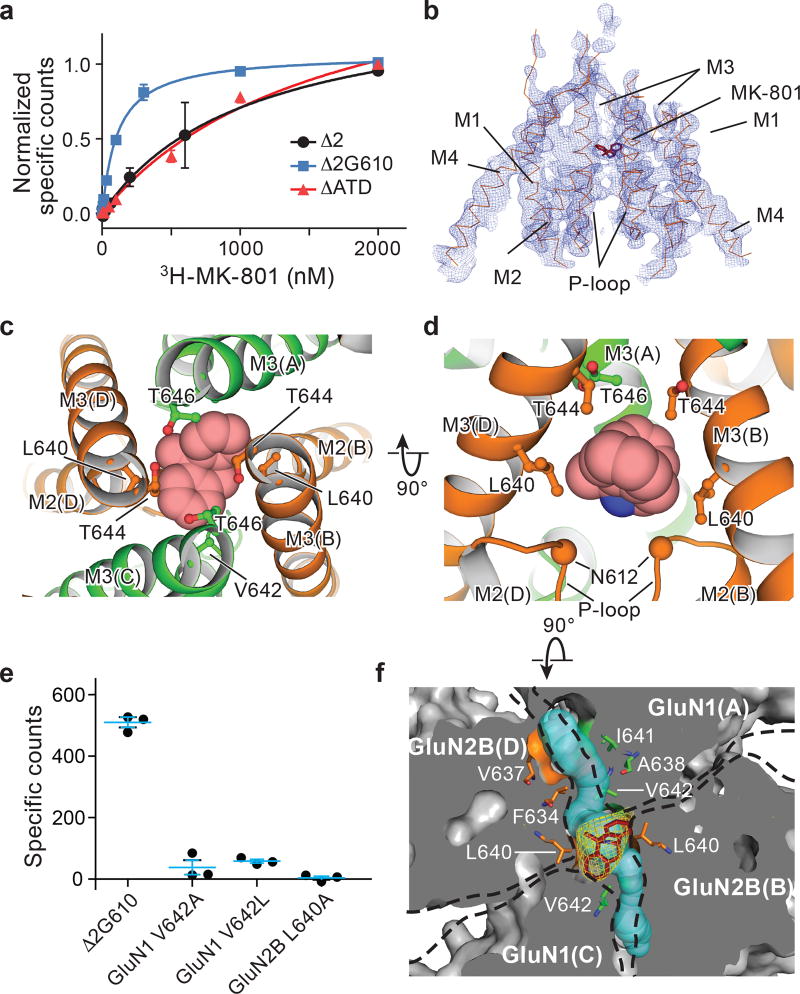
The ∆ATD receptor retains agonist-induced ion channel activity, demonstrating that the ion channel is gated by glycine and glutamate (Extended Data Fig. 3a). Because the ∆ATD receptor harbors a thermostabilizing mutation of G610R within the TMD, the Kd for MK-801 of 1.6 ± 0.3 μM is higher than that of the intact receptor, which has a Kd for MK-801 of 111.3 ± 8.5 nM (Fig. 2a). Indeed, when the G610R substitution is introduced into the intact receptor the MK-801 Kd rises to 1.1 ± 0.4 μM, similar to the ∆ATD MK-801 Kd (Fig. 2a). To ensure MK-801 occupancy within the ∆ATD receptor TMD, we incubated the ∆ATD receptor with a saturating concentration of MK-801 prior to crystallization. Diffraction-quality crystals emerged after 2 weeks and we solved the structure by molecular replacement (Extended Data Table 1).
Figure 2. MK-801 binding site defined by x-ray crystallography.
a, Saturation binding of 3H-MK-801 to the intact ∆2 NMDA receptor and to the ∆ATD receptor, which both feature the GluN1 G610R mutation, compared to the intact ∆2 G610 receptor, which harbors the native glycine residue at position 610. Error bars represent standard errors of the mean (s.e.m.) from triplicate measurements. b, Composite omit map (blue mesh) in the TMD region of the ∆ATD GluN2B subunits (orange ribbon) and MK-801 (red stick), contoured at 1.0 σ. c-d, Top-down (c) and side views (d) of MK-801 bound (carbon atoms in red, nitrogen atom in blue) in the central vestibule, with the residues involved in the binding pocket shown in sticks and the α-carbons of the N612 residues (GluN2B) shown as spheres (d). e, Single point binding of 3H-MK-801 to the ∆2 G610 receptor and to site-directed mutants. Error bars represent s.e.m. from triplicate measurements. f, Top-down view of a slice through the TMD, where the protein surface is in solvent accessible surface representation, showing the Fo-Fc electron density (3.0σ, yellow mesh) of MK-801, the residues (sticks) involved in the binding pocket, and two tunnels (cyan) which connect the central vestibule to the cell membrane.
The transmembrane structure of the ∆ATD NMDA receptor exhibits a similar closed-blocked state and pore radius as the intact receptor3 (Extended Data Fig. 3b-c). Moreover, the electron density of the ∆ATD receptor TMD is superior to that of previously solved NMDA receptor structures, as evidenced by atomic B-factors that are ~50% lower than those for the intact receptor structure. Because of the better resolved electron density, we are able to define the binding site of MK-801 (Fig. 2b).
MK-801 resides within the channel vestibule and snuggly fits in the binding pocket, with its nitrogen atom near N612 (GluN2B) (Fig. 2c-d). The omit electron density map showed only electron density for the β-carbon of N612 and hence we did not build the complete side chain. Nevertheless, we modeled the side chain and determined that there is space for the complete side chain and that the oxygen of the primary amide can be positioned to interact with the amino group of MK-801. The two aromatic rings of MK-801 are juxtaposed next to the M3 helix of the GluN1 subunit, close to V642 residues (GluN1), while the methyl substituent is near L640 on the M3 helix (GluN2B; Fig. 2c-d). Accordingly, the substitutions of GluN1 V642A, V642L and GluN2B L640A extinguish MK-801 binding, consistent with previous studies21 and with the importance of these residues in lining the binding pocket (Fig. 2e).
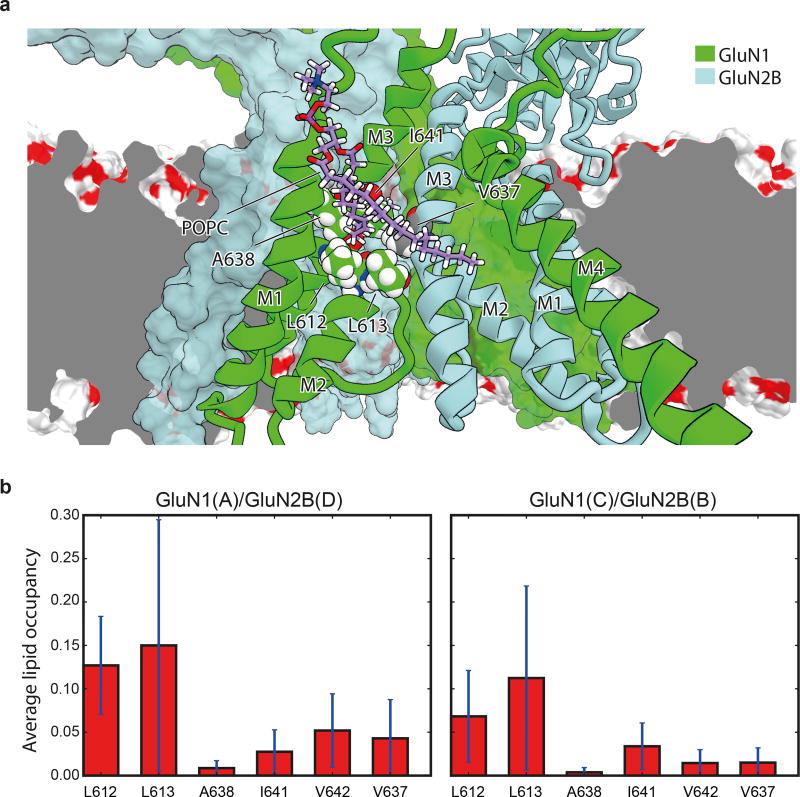
Near the M2 helices of the TMD structure there are two “tunnels” connecting the central vestibule to the interior of the membrane bilayer (Fig. 2f). The tunnels begin from the central vestibule and pass through cavities between the GluN1 M2 and M3 helices and the adjacent GluN2B M3 helices (Extended Data Fig. 4). The radii of the two tunnels range from 1.3–2.9 Å and 1.8–2.9 Å, respectively (Fig. 2f), being large enough to accommodate the aliphatic tails of lipids; indeed, the tails transiently entered these tunnels in our MD simulations (Extended Data Figs. 4). We hypothesize that these tunnels could be transiently large enough to allow the diffusion of small molecules into the pore, perhaps explaining how small molecules leave the closed, deactivated channel 22. Nevertheless, our simulations find that binding of both memantine and MK-801 to the open, activated, intact receptor occurs through the aqueous phase (Supplementary Video 2–5).
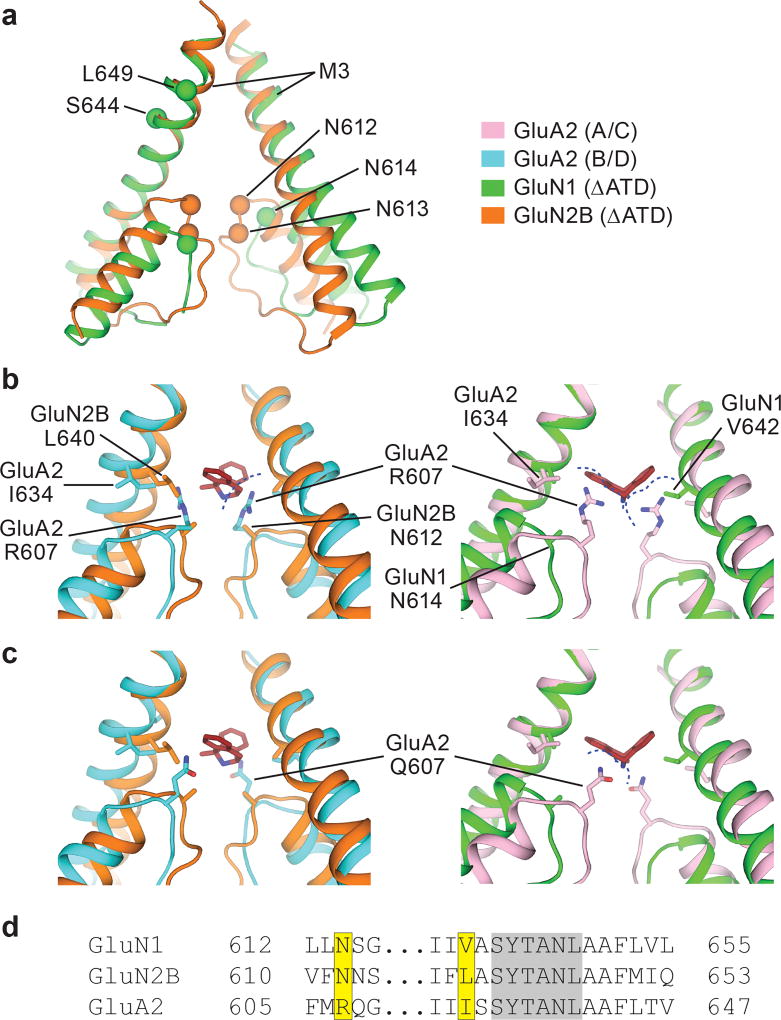
The conformation of the ion channel region, consisting of the M2 helices, the pore loops, and the M3 helices, is different between GluN1 and GluN2B subunits (Fig. 3a). Residing on the tips of the pore loops, the long studied N site asparagines23–24, N614 (GluN1) and N612 (GluN2B), together with the N+1 site asparagines, N613 (GluN2B), have marked effects on MK-801 blockage21 because they project their side chains into the vestibule to interact with the small molecule blocker (Fig. 3b-c). These asparagines also contribute to the selectivity filter, modulating calcium permeability and voltage-dependent magnesium block23–24. The proximal pair of GluN2B subunits have M2 helices that protrude more deeply into the ion channel vestibule in comparison to the GluN1 subunits, and therefore the GluN2B N+1 site asparagine residues are located at the same level as the GluN1 N site asparagines, such that their side chains form a narrow constriction, in accord with previous studies (Fig. 3a)23.
Figure 3. Steric clashes block MK-801 binding at AMPA receptors.
a, Superposition of the M2, pore loop and M3 elements of the GluN1 (green) and GluN2B (orange) subunits from the ∆ATD receptor crystal structure. The α carbons of key asparagine residues are shown as spheres. b-c, Superposition of elements of the ∆ATD receptor from panel a with the equivalent elements of the GluA2 AMPA receptor (PDB code: 5VOT) with R607 (b) or Q607 (c). The NMDA receptor GluN2B subunits (orange) and GluN1 subunits (green) are superposed on the equivalent regions of the GluA2 AMPA receptor B/D subunits (cyan) or the A/C subunits (pink), respectively. All superpositions are based on the Cα atoms of the conserved ‘SYTANL’ region. Dashed lines show likely steric clashes. d, Sequence alignment of the channel region between the NMDA receptor and AMPA receptor subunits. The residues involved in MK-801 binding and the corresponding GluA2 residues are highlighted in yellow. Residues of the ‘SYTANL’ motif are highlighted in gray.
Superposition of the NMDA receptor and the AMPA receptor channels shows the relevant colocalization of the AMPA receptor GluA2 R607 (Q/R site) with the critical N site asparagines of GluN2B N612, whereby glutamine substitution eliminates blocker binding21 (Fig. 3b-c). We speculate that the longer side chains of R607 or Q607 and the proximal pore loop of the AMPA receptor A/C pair sterically hinder MK-801 binding (Fig. 3b-c). Sequence alignment also shows a dissimilarity in the residues involved in MK-801 binding by NMDA receptors at the equivalent positions in AMPA receptors (Fig. 3d). Indeed, these residues are critical for MK-801 binding as alanine substitutions or AMPA-like leucine substitutions eliminate MK-801 binding (Fig. 2f). These structural and amino acid differences explain why MK-801 selectively binds to NMDA receptors and why simple substitution of NMDA receptor residues into the corresponding positions of AMPA receptors does not confer MK-801 binding and block.
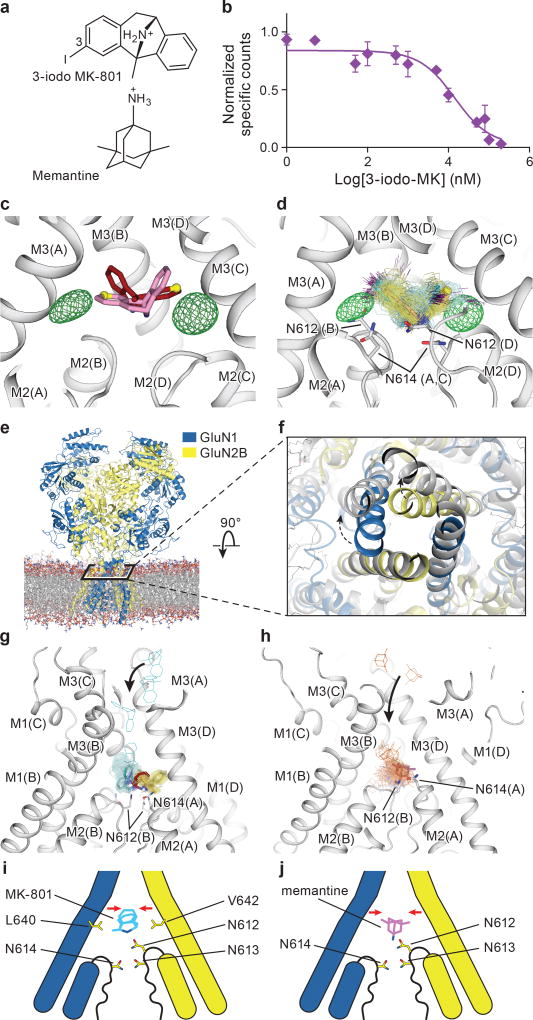
To substantiate the binding position of MK-801, we employed 3-iodo MK-801 (Fig. 4a), showing that the halogenated analog binds to the intact receptor with a Ki of 742 ± 1.3 nM (Fig. 4b). Despite extensive crystallization trials we were unable to crystallize the 3-iodo MK- - ∆ATD receptor complex. Cocrystallization of the full length ∆2 NMDA receptor was successful, however, and subsequent anomalous diffraction studies allowed us to confirm the MK-801 binding site derived from the ∆ATD structure, and to validate ligand placement (Extended Data Table 1, Data Set 2; C2 space group). The anomalous difference Fourier maps show two prominent peaks in the channel vestibule (Fig. 4c-d), related to one another by the 2-fold axis along the ion channel pore and situated ‘above’ the pore loops of GluN1 and GluN2B subunits. This pose is consistent with the conclusion that MK-801 resides in the channel vestibule in two equivalent orientations, with position ‘3’ of the MK-801 ring system on either side of the 2-fold axis (Fig. 4c-d).
Figure 4. Mechanism of MK-801 and memantine binding.
a, The chemical structures of 3-iodo MK-801 and memantine. b, Plots of competition binding of cold 3-iodo MK-801 to the 3H-MK-801 bound ∆2 G610 receptor. The plot shows data from a representative experiment with error bars representing s.e.m. from triplicate measurements. c, The iodine anomalous density (green mesh) shown together with the positions of the MK-801 molecule in the crystal structure (red sticks) and the pseudo-2-fold related binding pose (salmon sticks). The carbon atoms at the 3 position are shown in yellow spheres. d, Positions of 3-iodo MK-801 obtained from MD simulations (Sim. 1) initiated from 3-iodo MK-801 docked in the binding pocket of the ∆2 structure. The movement of the iodine atoms (purple) of 3-iodo MK-801 clustered into two populations, in agreement with the anomalous difference densities (green mesh). In each of its two predominant poses (cyan and yellow sticks), MK-801 forms hydrogen bonds with N614 (GluN1) and N612 (GluN2B) (gray sticks). e, Simulation snapshot of ∆2 NMDA receptor (GluN1 in blue and GluN2B in yellow) embedded in POPC lipid membrane (red and gray lines). f, The open pore (gray) obtained in simulation 3, superposed onto the closed pore of the ∆2 receptor crystal structure. Arrows indicate the transition of gate opening. g-h, MD simulation snapshots of MK-801 (g, cyan, Sim. 20) and memantine (h, orange, Sim. 24) during free-binding simulations in which they bound to the open state of the ∆2 receptor (at zero transmembrane voltage). The blockers enter the pore by the aqueous path (black arrows). MK-801 demonstrates two distributions of binding poses (cyan and yellow sticks), overlapping with MK-801 in the crystal structure (red stick) but memantine shows a predominant pose (purple). Both of them interact with asparagine residues (gray sticks) on the pore loops. i-j, Schematic representations of MK-801 and memantine binding sites, respectively. Both channel blockers induce channel closure (red arrows) while blocking the pore and adopting similar interactions with key asparagine residues.
We performed atomic-level, long-timescale MD simulations25 to assess the binding position of MK-801 and its 3-iodo derivative. We began a simulation starting from the intact ∆2 NMDA receptor crystal structure inserted into a POPC membrane, with 3-iodo MK-801 placed in the central vestibule at a position suggested by the anomalous difference densities and by the MK-801-∆ATD receptor complex structure (Fig. 4, Sim. 1 in Supplementary Table 1). During this 30-µs MD simulation, we observed two predominant poses of 3-iodo MK-801, in overall agreement with the crystallographic results (Fig. 4d). In both poses the amine group of the ligand points toward the selectivity filter, where it forms stable hydrogen bonds with the two pore-loop asparagine residues N614 (GluN1) and N612 (GluN2B) (Fig. 4d).
To gain insight into binding of MK-801 to the ion channel without starting from a pose derived from the crystal structure, we performed long-timescale simulations of ‘free’ MK-801 binding to a model of the open, activated state of the receptor. We obtained a model of the open state by computationally introducing two mutations, A650R (GluN1) and A648R (GluN2B), within the nine-residue SYTANLAAF “Lurcher” motif26. These mutations are known to increase the open probability of the wild-type receptor27, and led to the opening of the ion channel pore within a few microseconds (Fig. 4e-d, Sim. 3), presumably due to increased charge repulsion at the M3 bundle–crossing region. After observing that the resulting open, but still non-permeating, mutant channel maintained hydration of its pore cavity on a microsecond timescale, we reversed the mutations and verified that the wild-type channel remained in a stable open and now conducting state, with an average conductance of 4.8 ± 1.4 pS (Sims. 4–17). The experimental permeation rate is 51.4 ± 2.4 pS28; this disagreement is unsurprising, as it is known that MD simulations typically do not accurately reproduce experimental ion permeation rates29, due to force field shortcomings.
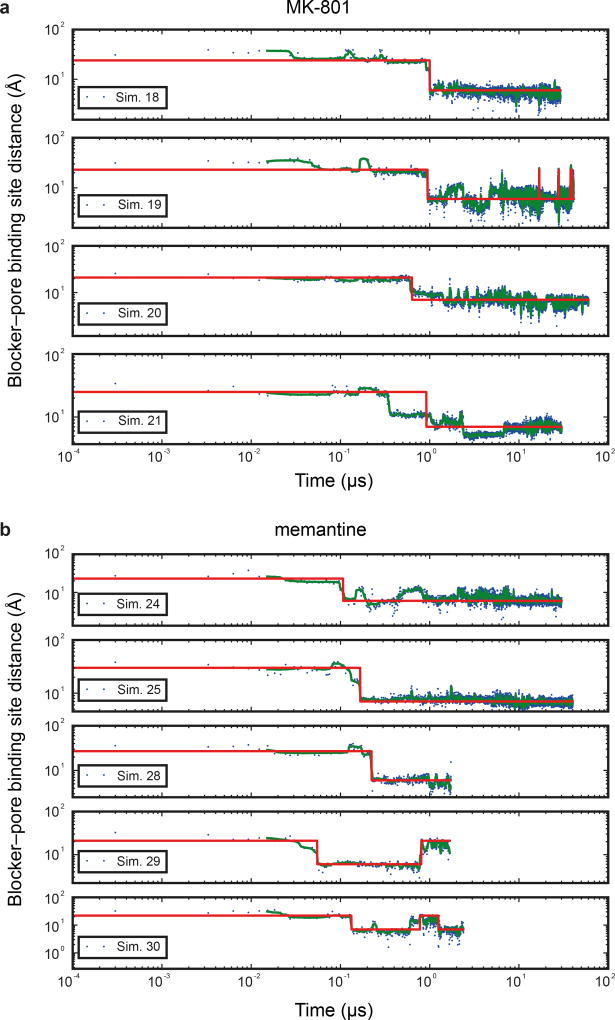
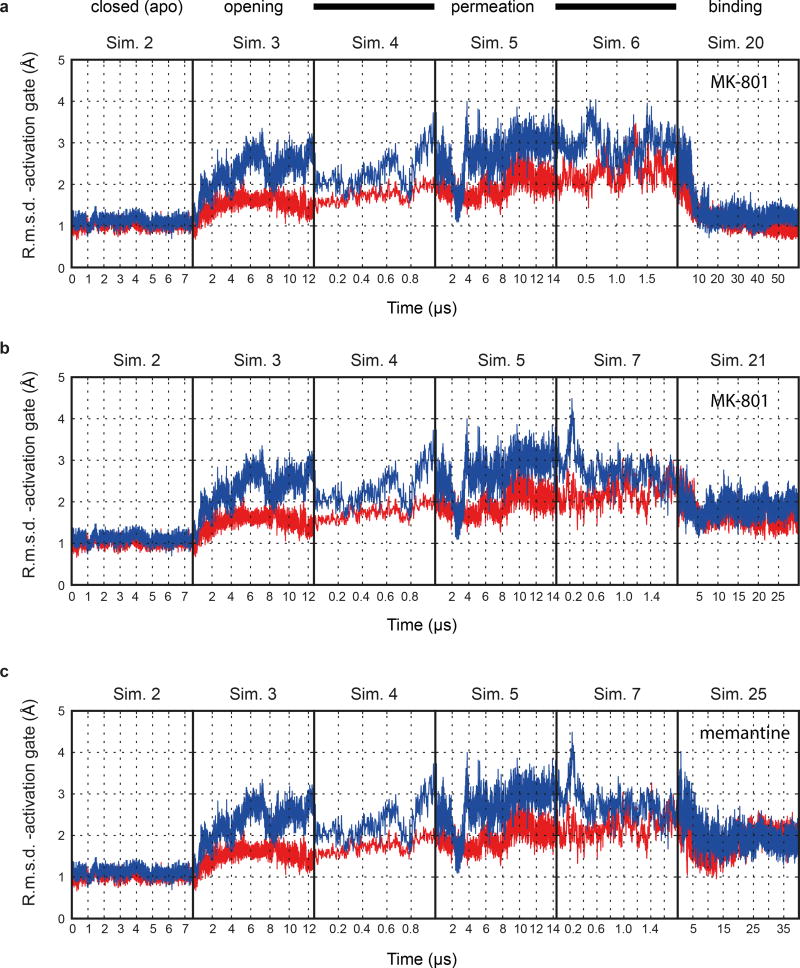
Subsequently, we introduced MK-801 into the aqueous phase of the system and performed simulations of MK-801 binding to the intact, open receptor (Sims. 18–21). Binding of MK-801 to the pore vestibule occurred along the ion permeation pathway and with a mean binding time of 0.78 ± 0.10 µs. (Sims. 20 and 21 were conducted at zero transmembrane voltage; application of voltage in Sims. 18 and 19 did not significantly decrease the binding time, as can be seen in Extended Data Fig. 5.) The binding event was followed by closure of the pore at the bundle-crossing region, likely driven by a hydrophobic collapse of residues around the nonpolar part of the blocker, thus giving rise to a “closed blocked” state of the receptor, which can be discerned from the r.m.s.d. of the M3 bundle–crossing region with respect to the closed-state ∆2 crystal structure (Extended Data Fig. 6a-b). The r.m.s.d. value increases, in proportion to the applied voltage, when the pore assumes its open, non-permeating and open, permeating states, whereas upon MK-801 binding, the r.m.s.d. value drops, approaching the value obtained in our simulations of the closed apo pore (Sim. 2). Over the last part of each binding simulation (e.g., the last 40 µs of simulation time in Sim. 20, a 60-µs simulation), MK-801 predominantly assumed two distinct binding poses, similar to those found for 3-iodo MK-801 in Sim. 1, where the amine group of MK-801 formed stable hydrogen bonds with the two pore-loop asparagine residues (Fig. 4g,4i).
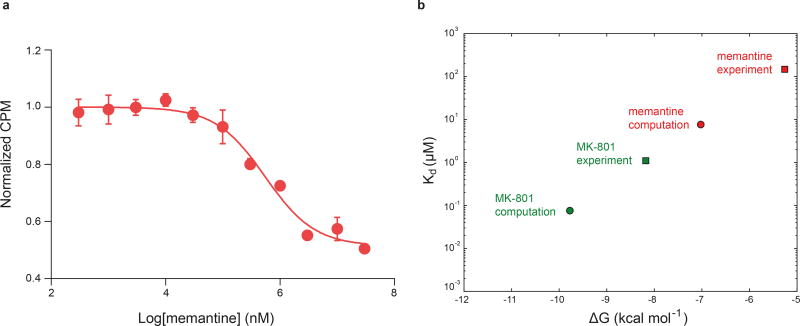
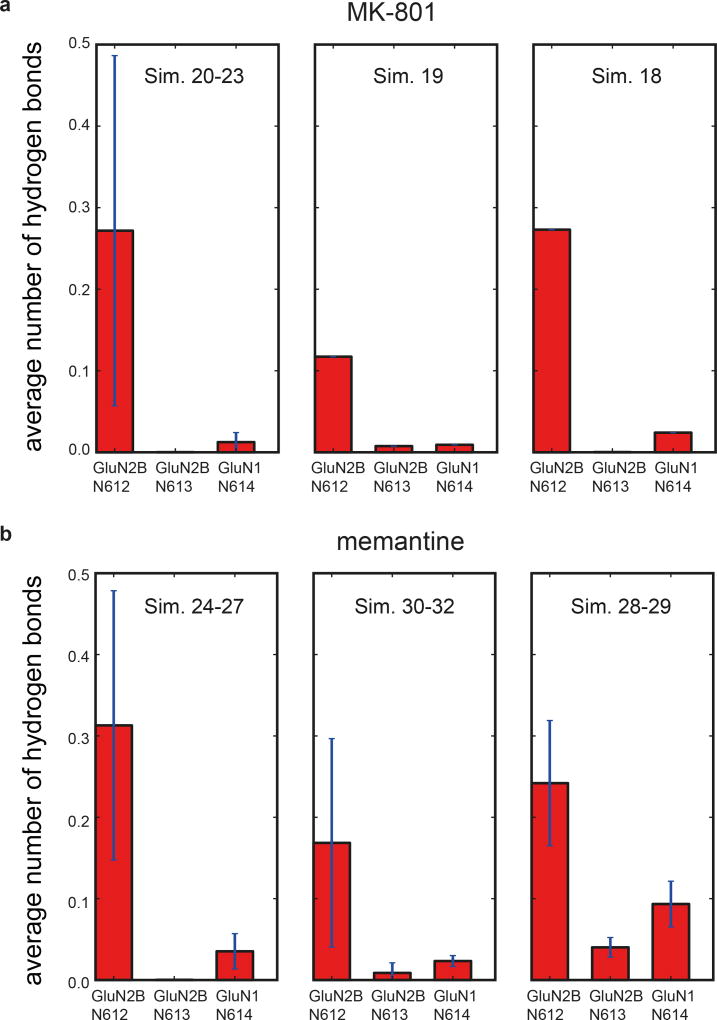
Upon comparison of the simulated MK-801-bound receptor with the experimental structure, we noticed that MK-801 in the crystal structure resides in an intermediate pose between the two predominant binding poses observed in the simulations, indicating the MK-801 electron density in the crystal structure is an average of the two distinct poses related by two-fold symmetry (Fig. 4g,4i). Additional simulations of memantine, a well-known NMDA ion channel blocker (Fig. 4h, Sims. 24–27), indicates that this compound binds at a location nearly identical to the binding location of MK-801. Rapid entry (mean binding time 0.14 ± 0.02 µs) was again followed by a hydrophobic collapse of residues around the blocker, giving rise to a “closed blocked” state of the receptor (Extended Data Figs. 5 and 6c). Memantine, however, predominantly assumes a single binding pose, perhaps due to its pseudo-symmetrical structure (Fig. 4h). We estimated the absolute free energy of binding to the ∆2 receptor, and found Kd ≈ 7.6 µM for memantine and Kd ≈ 0.08 µM for MK-801, showing a similar 100-fold relative affinity as the experimental values of 147.4 μM (Extended Data Fig. 7a) and 1.1 μM for memantine and MK-801, noting that the errors in the free energies are substantial (Extended Data Fig. 7). We speculate that the off-rate of memantine is ~100-fold faster than that of MK-801, because the on-rates, as well as the experimental and computational binding constants, are similar. The faster off-rate of memantine is important for its clinical efficacy30. Both MK-801 and memantine readily entered and bound to the pore cavity regardless of voltage, but an applied voltage drove the blockers deeper into the selectivity filter, where they formed hydrogen bonds with the N+1 asparagine residue (N613 of GluN2B) (Extended Data Fig. 8). This might explain the experimental observation that the presence of the N+1 asparagine residue leads to voltage dependency in MK-801 and memantine binding.
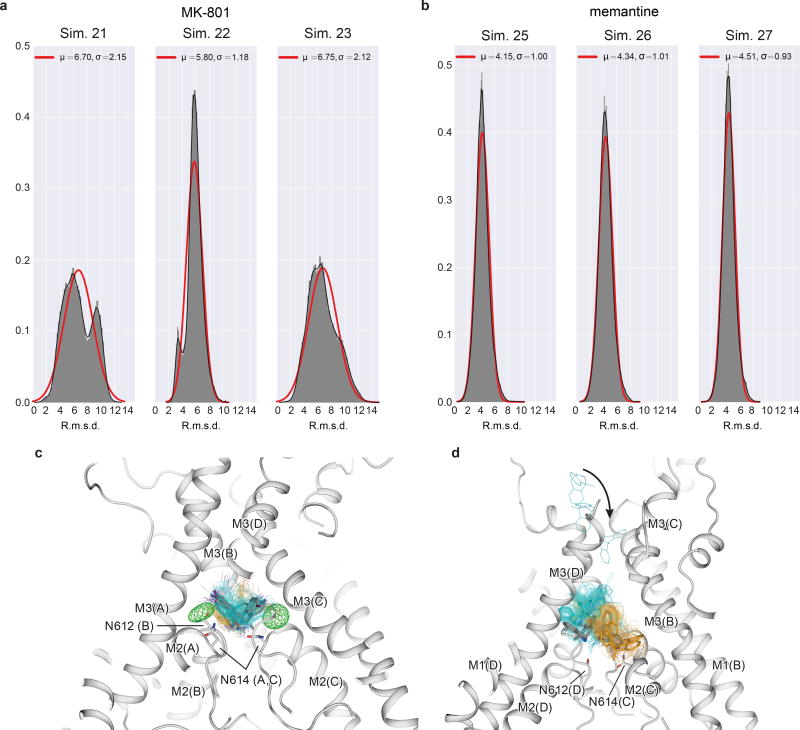
We observed large fluctuations of the selectivity filter in these long-timescale simulations, both because of force field deficiencies and potentially because our simulations start from structures for which the experimental information in the selectivity filter is incomplete. We thus investigated whether restraining the selectivity filter close to the crystal structure would affect the binding poses of MK-801 and memantine (Extended Data Fig. 9). We conclude that conformational distributions of the selectivity filter do not affect the overall pose or position of memantine and that it blocks the pore in predominantly one pose, whereas MK-801 blocks the pore in two symmetry-related poses, with the same key interactions between the selectivity filter and each pore blocker. Additional control simulations show that MK-801 also adopts these two symmetry-related binding poses in the absence of selectivity filter torsional corrections (see Materials and Methods and Extended Data Fig. 9.)
The ∆ATD GluN1/GluN2B receptor shows how the absence of the ATDs allows the LBD layer to adopt a previously unseen conformation (Supplementary Video 1) and enables formation of crystals that diffract to sufficiently high resolution to position ion channel blockers. MK-801 and memantine bind within the TMD vestibule and block ion conduction by physical occlusion of the permeation pathway and by promoting closure of the ion channel gate at the M3 bundle crossing, yielding a closed-blocked state. MK-801 binds in two, 2-fold related poses whereas memantine binds in a single predominant pose. Our studies define the molecular basis for ion channel block by MK-801 and memantine and lay the foundation for development of small molecules with desired properties, such as receptor subunit selectivity and affinity.
Material and Methods
Receptor constructs
The construct of the ∆ATD NMDA receptor is derived from the previously reported Xenopus laevis GluN1-GluN2B NMDA receptor ∆2 construct3 and cloned into pEG BacMam31,32 for virus-mediated expression in suspension-adapted cells. Residues 23-393 were removed from GluN1, residues 1-399 were removed from GluN2B, and the human placental alkaline phosphatase signal sequence (MLGPCMLLLLLLLGLRLQLSLG) was added to the N-terminus of the ∆ATD GluN2B subunit33. The ∆2 construct was used for co-crystallization with iodo-MK-801 (Sanofi) for the anomalous diffraction studies. The DEER construct was designed with alanine substitutions of the endogenous cysteines, GluN1-C457 and GluN2B-C458, and a single cysteine GluN2B-R739C substitution.
Expression and purification
HEK293S GnTI- cells34 were transduced using P2 or P3 BacMam virus (the titer above 3 × 10⁶ pfu) when the cell density reached 3 × 10⁶ cells/ml at a multiplicity of infection (MOI) of 1:1 (GluN1:GluN2B) and incubated at 37 °C. At 14 hrs post transduction, 10 mM sodium butyrate was added to the cultures and the cultures were incubated at 30 °C for another 46 hours.
Cells were harvested and collected by centrifugation at 6,200 × g for 20 min. Cells were disrupted by sonication (4 sec on, 8 sec off for 10 min, power level 6.5) in 150 mM NaCl, 20mM Tris-HCl pH8.0, at a v/v ratio of 25 ml of buffer per L of culture. The cell debris was removed by centrifugation at 6,000 × g for 20 min and the membrane was collected by ultracentrifugation at 125,000 × g for 1 hr, at 4 °C. Membranes were homogenized in 150 mM NaCl, 20 mM Tris-HCl pH 8.0 and solubilized in a buffer containing 1% lauryl maltose neopentyl glycol (MNG-3; Anatrace, part#: NG310), 0.8 mM aprotinin, 2 mg ml-1 leupeptin, 2 mM pepstatin A, 1 mM phenylmethylsulfonyl fluoride, 1 mM glutamate, 1 mM glycine, and 2 mM cholesteryl hemisuccinate (CHS, Anatrace, part #: CH210) for 2 hours, stirring at 4 °C. Insoluble material was removed by centrifugation at 125,000 × g. The supernatant was loaded onto a Streptactin column (~1 ml resin per liter culture, IBA, Cat #: 2-4010-025) and eluted with buffer containing 5 mM desthiobiotin. The receptor was concentrated and the GFP, octa-histidine and StrepII tags were removed by treatment with 3C protease at 1:20 ratio (w:w) in tandem with endoglycosidase H treatment for 8 hr at 4 °C prior to size-exclusion chromatography (SEC). The concentrated GluN1/GluN2B receptor was loaded onto a Superose 6 16/300 column equilibrated with 400 mM NaCl, 20 mM MES pH 6.5, 1 mM dodecyl maltoside (C12M), and 0.2 mM CHS. Peak fractions were pooled and concentrated to 2 mg/ml.
Crystallization and cryoprotection
Prior to crystallization, 10 mM 6-cyclohexyl-hexyl-β-D-maltoside (CYMAL-6, Anatrace, part #: C326LA), 10 mM glutamate, 10 mM glycine and 1mM MK-801 were added to the GluN1/GluN2B protein, incubated on ice for 14–16 hrs, and then the protein solution was centrifuged at 70,000 × g for 40 min at 4 °C. Crystals were grown by vapor diffusion using a reservoir solution composed of 100 mM MES pH6.5, 200 mM NaF and 19–20% polyethylene glycol 3350. Crystals were cryoprotected by mother liquor supplemented with 14% ethylene glycol. To obtain iodo-MK-801-complexed crystals, 1 mM iodo-MK-801was co-crystallized with the protein in 18–20% pentaerythritol ethoxylate, 100 mM NaCl, 100 mM MgCl2, and 100 mM MES pH 6.5. Crystals were cryoprotected by crystallization buffer supplemented with 12% ethylene glycol. All crystals were obtained by hanging drop vapor diffusion with a drop ratio of 1 or 2 μl of protein to 1μl of reservoir solution at 20 °C.
Structure determination and analysis
X-ray diffraction data sets were collected at the Advanced Light Source on beamlines 8.2.1 and 5.0.2 and the Advanced Photon Source (APS) on beamlines 24ID-E and 24ID-C. Diffraction images were indexed, integrated, and scaled by XDS35 or HKL2000 together with the microdiffraction assembly method36. The best data set was collected at APS 24ID-E and the data extended to Bragg spacings at 3.9 Å, 3.7 Å and 3.4 Å resolution along a*, b* and c*37. The structure was determined by molecular replacement with Phaser38. Model building and crystallographic refinement were carried out using the computer graphic program Coot39 and the crystallographic refinement software package Phenix40. We were guided in building the ∆ATD TMD by referring to the intact receptor structure3, using aromatic side chains to define sequence register. The model was refined to a nominal resolution of 3.6 Å with reasonable R-factors. Stereochemistry of the model was evaluated by MolProbity41 and figures were created using Pymol. In analyzing the tunnels of the transmembrane domain, because multiple side chain groups were truncated upon model building due to insufficient electron density, we incorporated the side chains in order to analyze the path and radii of the tunnels. The side chains were built using SWISS-MODEL42, and the tunnel size and radius were measured by CAVER43.
Two-electrode voltage-clamp
Recombinant NMDARs were expressed in Xenopus laevis oocytes after cytoplasmic injection of 50 nl of a mixture RNA encoding the particular GluN1 and GluN2B subunits (at 500 ng/µl concentration, ratio 1:1), and stored at 16°C in Barth’s solution, in mM (10 HEPES, pH 7.5, 88 NaCl, 2.4 NaHCO3, 1 KCl, 0.33 Ca(NO3)2, 0.91 CaCl2, 0.82 MgSO4) supplemented with 50 µM AP5 and 100 µg/ml gentamicin. Recordings were performed using a bath solution containing (in mM) 5 HEPES, pH 7.3, 100 NaCl, 2.8 KCl, and 0.3 BaCl2. Ethylenediaminetetraacetic acid (EDTA, 10 μM final concentration) was added to all bath solutions. Currents were elicited by simultaneous application of 300 µM glycine and 300 µM glutamate. The holding potential was −60 mV.
Ligand binding assays
Binding constants were measured by the scintillation proximity assay (SPA)44. SPA were set up in triplicate at a final volume of 100 µl in SPA buffer (20 mM Tris pH 8.0, 150 mM NaCl, 0.01% MNG-3 and 0.02 mM CHS). NMDA receptor (50 nM) purified from affinity chromatography was incubated with 0.5 mg/ml of Ysi-Cu SPA beads, 3H-MK-801 and 1 mM each of glutamate and glycine. Non-specific binding was determined by the addition of 400 µM phencyclidine (PCP). Inhibition constants were determined by the SPA using 50 nM receptor, 0.5 mg/ml of Ysi-Cu SPA beads, 2 µM 3H-MK-801, 1 mM each of glutamate and glycine and varying concentrations of cold iodo-MK-801. The samples were gently mixed and incubated at room temperature for 2 hours before the counts were measured. The counts were analyzed using GraphPad Prism.
MD simulations
All MD simulations were based on the crystal structure of the ∆2 GluN1/GluN2B intact, heterotetrameric receptor (PDB code: 4TLM); GluN1: chains A and C; GluN2B: chains B and D). Missing loops (chain A: 547–549, 583–590, 650–653; chain B: 532–540, 576–584, 638–649, 789–797; chain C: 482–502, 540–550, 583–591, 786–796; chain D: 383–396, 434–445, 534–540, 789–793) were built using MOE45. Protonation states of all residues were chosen to correspond to a pH value of 7. The receptor was embedded in a palmitoyl oleoyl phosphatidylcholine lipid bilayer hydrated by 0.2 M NaCl. The system contained ~507,000 atoms and measured ~160 × 160 × 188 Å3. To impose a transmembrane voltage difference, V, we applied constant electric fields of −0.025 ≤ E ≤ −0.075 kcal mol−1 Å−1 e−1), corresponding to −200 ≤ V ≤ −600 mV29. To study the binding of the endogenous ligand analogs 1AC (1-aminocyclopropane-1-carboxylic acid) and JEG (trans-1-aminocyclobutane-1,3-dicarboxylic acid), we simulated the LBD of the GluN1 subunit in isolation (Sims. 28 and 29) and the LBD dimer (LBD1: residues 397–544, 661–789; LBD2: residues 399–534 and 647–785; Sims. 31–34); both constructs were derived from Sim. 2 of the intact heterotetrameric receptor. All simulations were performed in the NPT ensemble at 310 K using Anton46.
Simulations of receptor-bound, 3-iodo MK-801 (MK-801-I; Sim. 1) were initiated with the ligand docked into the vestibule such that the ligand iodine atom initially occupied one of the two experimentally obtained anomalous difference densities (Fig. 4). A control simulation (Sim. 2) of the same system in the absence of MK-801 was performed for comparison and showed no notable differences with Sim. 1 in either the pore vestibule or elsewhere in the receptor.
To simulate free binding of MK-801 to a model of the open-state receptor, we performed a series of simulations (Sims. 3–6) to open the closed pore by introducing two mutations, A650R (GluN1) and A648R (GluN2B), near the M3 helix bundle–crossing region, within the nine-residue SYTANLAAF “lurcher” motif26. Such mutations are known to enhance the constitutive activity of the receptor27. These simulations were performed at negative transmembrane voltage. Subsequently, simulations of free binding of MK-801 to the opened pore were carried out on the back-mutated wild-type receptor with and without a negative voltage (Sims. 7–9). To increase the ligand-binding on-rate, we imposed a spherical flat-bottom harmonic restraint between MK-801 and the receptor vestibule, centered at the midpoint of 642 (GluN1) and 640 (GluN2B) with a 30.0 Å radius. Finally, we performed a comparative simulation of free binding of memantine, a known NMDA receptor antagonist closely related to MK-801 (Sim. 10).
In all simulations, harmonic restraints were imposed on the endogenous ligand analogs (4-[(1R,2S)-3-(4-benzylpiperidin-1-yl)-1-hydroxy-2-methylpropyl]phenol (QEM), trans-1-aminocyclobutane-1,3-dicarboxylic acid (JEG), and 1-aminocyclopropanecarboxylic acid (1AC), which are present in the crystal structure) in order to prevent unbinding from their respective binding sites within the extracellular LBD. In separate simulations of the intact receptor (Sim. 30), a single LBD (Sims. 28 and 29), and the LBD dimer (Sims. 31–34), all without ligand restraints, the two charged ligands (JEG and 1AC) consistently unbound too rapidly, with mean unbinding times of 0.4 ± 0.1 µs (JEG, n = 5) and 5.1 ± 1.9 µs (1AC, n = 7). The uncharged QEM did not unbind. An additional control simulation (Sim. 37) of a crystal structure of the GluN1/GluN2A LBD dimer, co-crystallized with glutamate and glycine (PDB code: 5H8F47), consistently resulted in too-rapid unbinding of the charged ligand (glutamate).
Backbone torsional corrections to residues 614–618 (chains A and C) and 612–616 (chains B and D) (which lowered the backbone torsional potential by 4.6 kcal mol−1 at the crystallographic φ and ψ values, θ0, relative to the value of the potential at θ0 + 180°) were applied to ensure that the conformation of the selectivity filter remained intact during the simulations. We imposed these corrections because the free energy minimum in the force field at the (correct) crystal structure is unfortunately too shallow to ensure structural integrity of the filter region on the simulation timescales reported here29. In a subset of the simulations, additional r.m.s.d. restraints were imposed on the selectivity filter residues to study the effect of restraints on the binding poses. We found that the resulting conformational distributions of the selectivity filter influenced some details of the pore-blocker binding poses. We also performed a set of 13 control simulations (Sims. 42–54; lengths ranging from 10–30 µs) of the full-length ∆2 receptor without backbone torsional corrections, and analyzed the binding poses of MK-801-I and MK-801 prior to deterioration of the filter region. We found that the resulting binding poses were similar to those obtained in the simulations with the filter corrections (Extended Data Fig. 9).
We used the CHARMM27 force field for the protein, ions, and water48,49, and the CHARMM36 force field for POPC50. Modified partial charges were used for residues Glu, Asp, and Arg51. We used the CHARMM General Force Field52,53 for all ligands, and reparameterized all partial charges and torsional angles.
The aggregate simulation time was ~900 µs, and individual simulations ranged from 12 µs to 60 µs. Additional simulation details are given in Supplementary Table 1.
Spin labeling and DEER experiments
The DEER construct was expressed with HEK293S GnTI- cells via the same protocol as the ∆ATD receptor. The strep-purified GFP-fused protein was digested with 3C protease at 4°C when dialyzed overnight against labeling buffer: 150 mM NaCl, 20 mM Tris-HCl pH 7.2, 0.1% MNG-3, and 0.2 mM CHS. The labeling reaction was started by adding a 10-fold molar excess of 1-oxyl-2,2,5,5-tetramethylpyrroline-3-methyl-methanethiosulfonate (MTSSL) and incubating at room temperature in the dark. After 1 hour, another 10-fold MTSSL was added and incubated for an additional 1 hour. The protein was kept on ice overnight, followed by gel filtration the next day. Peak fractions were pooled and concentrated. Electron paramagnetic resonance (EPR) spectra were obtained using continuous wave EPR as described previously54. DEER experiments were performed using a standard four-pulse protocol55, and the resulting signals were analyzed assuming that the distance distributions, P(r), consist of a sum of Gaussians56.
Data availability statement
The coordinates for the ∆ATD NMDA receptor structure have been deposited in the Protein Data Bank under the accession code 5UN1. The simulation results are available from the corresponding authors upon request.
Extended Data
Extended Data Figure 1. The ∆ATD NMDA receptor construct and structure.
a, Selected amino acid sequences of constructs used in these studies are compared to the wild-type sequence to highlight mutations in both subunits. Locations of mutated sites and deletions are highlighted in yellow squares. Insertions of sequence are in blue or red. The ‘A2 tail’ is derived from residues 837-847 of GluA2 AMPA receptor carboxy terminus (NP_058957). b, Cartoon representation shows the GluN1 and GluN2B subunit constructs and modifications of the ∆ATD receptor. The locations of point mutations are highlighted in blue circles and the deletions are defined by yellow wedges. c, Superposition of the two ∆ATD NMDA receptors in the crystallographic asymmetric unit, aligned by the TMD. Black arrows show the shift between receptor 1 (light blue) and receptor 2 (magenta).
Extended Data Figure 2. LBD dimer rearrangement and dynamics.
a-b, Top down view from the extracellular side of the membrane, showing the LBD layer of the intact ∆2 NMDA receptor (a) with GluN1 in blue and GluN2B in yellow, and of the ∆ATD NMDA receptor (b) with GluN1 in green and GluN2B in orange. The M3-LBD linkers of GluN2B (red ribbon, Q653-S664) adopt distinct conformations in the two receptors. Shown are distances between GluN2B R739 residues (β carbon atoms; salmon spheres), the residue selected for the DEER experiments (in Å) in both the intact and ∆ATD receptors. c, Cartoon emphasizing how the ATDs participate in defining the conformation of the LBD layer and how this, in turn, keeps the GluN2B M3-D2 linker in a conformation capable of opening the channel gate. d, The Fo-Fc density (3σ, green mesh) fits loop 1 of the GluN1 subunit (blue cartoon) but not of the GluN2B subunit (orange cartoon). e, DEER data of MTSSL-labeled GluN2B R739C ∆ATD (red) (sample size n=2) and intact NMDA receptor (blue) (sample size n=1). Peak-normalized echo decay and the fits are shown on the left, and probability distributions of DEER distances are shown on the right. The probability distributions of the DEER distances show two major peaks, one centered at 35–40 Å and a second broad peak at ~55 Å. The amplitude of the two peaks in the ∆ATD receptor are comparable, with the 55 Å peak corresponding to the ‘rearranged’ LBD layer as seen in the ∆ATD crystal structure, whereas the shorter distance (~35–40 Å) indicates the canonical LBD arrangement, like that observed in the intact receptor structure. The intact receptor, by contrast, shows one major narrow peak at ~40 Å which corresponds nicely to the predicted distance based on the intact receptor crystal structure, whereas the small peak centered around 55 Å suggests the intact receptor may harbor a minor population with a ∆ATD-like LBD arrangement.
Extended Data Figure 3. The ∆ATD NMDA receptor channel.
a, Inhibition of agonist (300 μM glutamate and 300 μM glycine) induced current by 1 μM MK-801 for the ∆ATD NMDA receptor by TEVC. The inhibition ratio is 0.37 ± 0.06 (mean ± s.d., n=5). The holding potential is −60 mV. b, Superposition of the ∆2 and ∆ATD receptor TMDs shows that they adopt similar conformations. c, Side view of the ion pore with GluN2B subunits (orange ribbons) showing the van der Waals radius along the pore (magenta dots). The α carbons of selected residues facing the pore are shown as spheres. The radius is plotted against the distance along the pore axis.
Extended Data Figure 4. Lipid accessibility of the TMD “tunnel”.
a, Simulation snapshot (Sim. 2) of a lipid molecule with one of its tails trapped between the M2 and M3 helices of the GluN1 subunit (chain A, green ribbons) and the M3 helix of the adjacent GluN2B subunit (light blue ribbons) viewed from within the membrane and toward the pore. Residues L612, L613, A638, I641, and V642 of GluN1 (chain A) and V637 of GluN2B (chain D) of the tunnel walls (see main text) are shown as spheres with the carbon atoms being colored green and gray, respectively. GluN1 (chain C) and GluN2B (chain B) subunits are shown as green and light blue solid surfaces. The dark gray plane represents a cut across the lipid membrane, the remainder of which is shown as a red-white surface. b, Average lipid occupancy (number of lipid atoms) within 3.5 Å of the tunnel “walls,” defined by residues L612, L613, A638, I641, and V642 of GluN1 (chains A, C) and residue V637 of the GluN2B (chains B, D) subunit lining. The occupancy was calculated across the closed-pore and pore-opening simulations (Sims. 2 and 3) and all permeation simulations (Sims. 4–17). All individual simulations within a given panel = N; all individual data points aggregated across all simulations = n. N=16 (Sim. 2, 3, 4–17); n>>10. The error bars are standard deviations of the mean calculated from all individual data points aggregated across all simulations.
Extended Data Figure 5. Binding time of MK-801 and memantine.
a, Binding time of MK-801 in simulations 18–21. Green lines are 30-ns running medians, and red lines indicate bound and unbound states. (Binding was defined as the ligand heavy-atom center of mass being within 10 Å of the center of mass of the Cα atoms of the N612 residues of the two GluN2B subunits.) The mean binding time of simulations 20 and 21 at 0 mV was 0.78 ± 0.10 µs; application of voltage in simulations 18 and 19 (593.9 ± 3.8 and 197.9 ± 1.2 mV) did not significantly decrease the binding time. b, Binding time of memantine in simulations 24, 25, 28, 29, and 30. Simulations 26 and 27 were initiated with memantine already bound, and the binding curves from these simulations were thus omitted in the determination of the on-rates for this pore blocker. Green lines are 30-ns running medians, and red lines indicate bound and unbound states. The mean binding time in simulations 24 and 25 (at 0 mV) was 0.14 µs; application of voltage in simulations 28–30 (592.6 ± 0.3, 592.7 ± 0.3, and 196.9 ± 0.1 mV) did not significantly decrease the binding time. In simulations 29 and 30, “unbound” states following binding are artifacts due to the voltage driving memantine through the selectivity filter. N=1 in each panel.
Extended Data Figure 6. Blocker-induced channel closure.
The resemblance between the closed, deactivated receptor (leftmost panels) and the closed, pore-blocked receptor (rightmost panels) is shown. a-c, R.m.s.d. (Å; GluN1, red; GluN2B, blue) of the M3 bundle–crossing region (i.e., the activation gate) relative to the closed-state ∆2 crystal structure obtained from simulations of the closed pore (Sim. 2), pore opening (Sim. 3), permeation (Sim. 4 at 396.6 ± 2.7 mV, Sim. 5 at 593.8 ± 3.8 mV, and Sim. 6 (a) at 396.1 ± 2.7 mV or Sim. 7 (b, andc) at 415.1 ± 6.4 mV), two MK-801 binding simulations (Sims. 20 (a) and 21 (b)), and one memantine binding simulation (Sim. 25 (c)). N=1 in each panel.
Extended Data Figure 7. Free energy estimates of MK-801 and memantine binding.
a, Competition binding of memantine to the ∆2 receptor in the presence of 3 μM 3H MK-801, measured by the scintillation proximity assay. The plot shows data from a representative experiment with error bars representing s.e.m. from triplicate measurements. b, Dissociation constants (Kd, circles), derived from free energy estimates of binding of memantine and MK-801 to the open, intact, activated ∆2 receptor in which the pore has collapsed onto the ligand. The absolute experimental affinities of MK-801 (green) and memantine (red) for the ∆2 receptors are shown as squares. The free energies were calculated for four independent, ligand-bound configurations, all taken from binding simulations at zero transmembrane voltage (MK-801: Sims. 20 and 21; memantine: Sims. 24, 25, and 27). Each calculation consisted of 0.5 µs of simulation to solvate the ligand in water, followed by 3.0 µs of simulation of the protein-ligand complex. The average Kd values for MK-801 and memantine of ≈ 0.08 and ≈ 7.64 µM for the ∆2 receptor show a 100-fold difference in the affinities of these two ligands; the similar relative affinity of these two ligands has been found experimentally against the ∆2 receptor with Kd value of ≈ 1.1 μM for MK-801 and Ki value of ≈ 147.4 μM for memantine. The calculated binding free energies −9.78 ± 1.61 (MK-801) and −7.02 ± 1.24 kcal mol−1 (memantine), and thus the free energy–derived dissociation constants, are subject to large errors, estimated as standard errors of the mean, due to lack of convergence of including long-range effects from lipid molecules surrounding the pore. We note that the contribution of pore-cavity collapse upon ligand binding to the binding free energy is not included in the free energy calculations, which were performed with the pore-collapsed, intact, agonist-bound receptor. Also not included is the contribution of −ln(2)kBT arising from the two poses available to MK-801.
Extended Data Figure 8. Hydrogen bonding propensity between MK-801 (a) and memantine (b) and the selectivity filter asparagine residues.
a-b, The two N-site asparagine residues N614 (GluN1) and N612 (GluN2B) of the pore-loop tips, and the N+1 asparagine residue, N613, of the GluN2B subunit, which is believed to be involved in the voltage dependence of memantine binding. For MK-801 (a), the first panel shows data obtained at zero transmembrane voltage (Sims. 20–23), the second at 197.9 ± 1.2 mV (Sim. 19), and the third at 593.9 ± 3.8 mV (Sim. 18). N=4, N=1, N=1; n>>10. For memantine (b), the first panel shows data obtained at zero transmembrane voltage (Sims. 24–27), the second at 196.9 ± 0.1 mV (Sims. 30–32), and the third at 592.6 ± 0.3 and 592.7 ± 0.3 mV (Sims. 28 and 29). N=4, N=3, N=2; n>>10. Hydrogen bonding propensity is relatively low for N614 of GluN1, except at high voltage, suggesting that N612 and N613 of GluN2B are more important for pore-blocker binding and its voltage dependence, respectively; at nonzero transmembrane voltage, hydrogen bonding propensity increases at the N+1 site asparagine N613 of GluN2B. The error bars are standard deviations of the mean calculated from all individual data points aggregated across all simulations.
Extended Data Figure 9. Binding mode distributions of MK-801 and memantine.
a, MK-801 r.m.s.d. distributions (Å; heavy atoms only) obtained from MK-801 binding simulations 21–23, with respect to all MK-801 poses obtained in binding simulation 20. Mean (µ) and standard deviation (σ) are indicated in Å; solid red lines are best fits to a normal distribution, but the distributions for simulations 21 and 23 show clear evidence of two r.m.s.d. populations, consistent with the observation that MK-801 can block the pore in two symmetry-related poses. The degree of asymmetry of the distributions observed for simulations 21 and 23 indicates nonequal occupancy of the two poses, a result of incomplete sampling. We note that in simulation 22, one of the two poses almost completely predominates. N=1 for each panel; n>>10. b, Memantine r.m.s.d. distributions (Å; heavy atoms only), obtained from binding simulations 25–27, with respect to all poses obtained in memantine binding simulation 24. Mean (µ) and standard deviation (σ) are indicated in Å; solid lines are best fits to a normal distribution. The relatively narrow and unimodal distributions reflect that memantine appears to predominantly block the pore in a single pose. The heavy-atom average r.m.s.d. of the main poses of memantine was 3.7 ± 0.2 Å, less than that observed for MK-801. N=1 for each panel; n>>10. c, MK-801-I poses obtained in simulations with and without selectivity filter backbone torsional corrections. Gray: the two predominant poses observed with corrections (Sim. 1); cyan and orange: predominant poses identified from the initial portion (1–3 µs), before the filter deteriorated too extensively, of two different simulations without torsional corrections (pose 1: Sim. 42; pose 2: Sim. 47). 100 individual poses from the initial portion (1–3 µs, uniformly separated by 0.02 µs) are shown as cyan and orange lines with the iodine atoms shown as spheres. Both poses of MK-801-I observed in our simulations with torsional backbone corrections (Sim. 1) were thus also observed, with comparable stability, in these additional simulations without these corrections. d, MK-801 poses obtained in free binding simulations with and without filter backbone torsional corrections. Gray: the two distinct poses observed in a free binding simulation with backbone corrections (Sim. 20); cyan and orange: poses in the three independent simulations without corrections in which MK-801 bound stably (Sim. 50: pose identification period: 4–18 µs; Sim. 51: pose identification period: 9–12 µs; Sim. 53: pose identification period: 3–4 µs). MK-801 bound stably to the receptor in three (Sims. 50, 51, and 53) out of five simulations performed without corrections—again in two distinct poses, as observed in our simulations with torsional corrections—and some closure of the activation gate (i.e., the bundle-crossing region) was also observed in these three simulations before the filter deteriorated.
Extended Data Table 1.
Crystallographic and structure refinement statistics
| Dataset 1 | Dataset 2 | |
|---|---|---|
| Data collection | APS-IDE | APS-IDC |
| Space group | P21 | C2 |
| Cell dimensions a, b, c (Å) | 181.6, 108.5, 182.5 | 207.5, 120.5, 231.3 |
| Cell angles α, β, γ (°) | 90.0, 111.4, 90.0 | 90.0, 102.8, 90.0 |
| Wavelength (Å) | 0.98 | 1.5 |
| Resolution (Å)* | 50-3.58 (3.68-3.58)# | 50-5.95 (6.31-5.95) |
| Completeness* | 97.5 (97.9) | 97.0 (96.3) |
| Multiplicity* | 5.0 (3.9) | 3.5 (3.5) |
| I/σI* | 7.64 (1.91) | 9.85 (0.94) |
| Rmeas (%)* | 10.0 (58.8) | 8.0 (164.3) |
| CC1/2 (%)* | 99.6 (14.6) | 99.8 (50.6) |
| Anisotropy (Å: a*/b*/c*)# | 3.9 / 3.7 / 3.4 | |
| Refinement | ||
| Resolution (Å) | 50-3.6 (3.65-3.6) | |
| No. of reflections | 69975 | |
| Rwork/Rfree (%) | 29.2(35.1)/31.8 (40.1) | |
| No. of atoms total | 20205 | |
| Ligand | 222 | |
| Average B-factor (A2) | ||
| Protein | 124 | |
| Ligand | 119 | |
| R.m.s. deviations | ||
| Bond lengths (Å) | 0.006 | |
| Bond angles (°) | 0.770 | |
| Ramachandran plot | ||
| Favored (%) | 93.9 | |
| Allowed (%) | 6.1 | |
| Disallowed (%) | 0 | |
| Rotamer outliers (%) | 4.4 |
Highest resolution shell in parentheses.
Estimates of anisotropy calculated using the diffraction anisotropy server (http://services.mbi.ucla.edu/anisoscale/).
Rsym is reported.
5% of reflections were used for calculation of Rfree.
Supplementary Material
Acknowledgments
We thank L. Vaskalis and H. Owen for manuscript preparation, Gouaux lab members, S. Piana, and M. Eastwood for discussion, and the Berkeley Center for Structural Biology (5.0.2) and the Advanced Photon Source (24ID-C and 24ID-E) for assistance with data collection. This work was supported by the National Institutes of Health (R01 NS038631). E.G. is an investigator of the Howard Hughes Medical Institute.
Footnotes
Author contributions
X.S. and E.G. designed the project; X.S. and C.H.L. developed the constructs for crystallization; X.S. performed protein purification, crystallography, electrophysiology and biochemical analysis; M.Ø.J. and V.J. performed and analyzed, and D.E.S. participated in the oversight of, the MD simulations. R.A.S. and H.S.M. carried out the DEER experiments; X.S. and E.G. wrote the manuscript with contributions from all authors.
The authors declare no competing financial interests.
References
- 1.Traynelis SF, et al. Glutamate receptor ion channels: structure, regulation, and function. Pharmacol. Rev. 2010;62:405–496. doi: 10.1124/pr.109.002451. [DOI] [PMC free article] [PubMed] [Google Scholar]
- 2.Paoletti P. Molecular basis of NMDA receptor functional diversity. Eur. J. Neurosci. 2011;33:1351–1365. doi: 10.1111/j.1460-9568.2011.07628.x. [DOI] [PubMed] [Google Scholar]
- 3.Lee CH, et al. NMDA receptor structures reveal subunit arrangement and pore architecture. Nature. 2014;511:191–197. doi: 10.1038/nature13548. [DOI] [PMC free article] [PubMed] [Google Scholar]
- 4.Karakas E, Furukawa H. Crystal structure of a heteromeric NMDA receptor ion channel. Science. 2014;344:992–997. doi: 10.1126/science.1251915. [DOI] [PMC free article] [PubMed] [Google Scholar]
- 5.Mayer ML, Westbrook GL, Guthrie PB. Voltage-dependent block by Mg2+ of NMDA responses in spinal cord neurones. Nature. 1984;309:261–263. doi: 10.1038/309261a0. [DOI] [PubMed] [Google Scholar]
- 6.Nowak L, Bregestovski P, Ascher P, Herbet A, Prochiantz A. Magnesium gates glutamate-activated channels in mouse central neurones. Nature. 1984;307:462–465. doi: 10.1038/307462a0. [DOI] [PubMed] [Google Scholar]
- 7.Johnson JW, Ascher P. Glycine potentiates the NMDA response in cultured mouse brain neurons. Nature. 1987;325:529–531. doi: 10.1038/325529a0. [DOI] [PubMed] [Google Scholar]
- 8.Bliss TVP, Collingridge GLA. synaptic model of memory: long-term potentiation in the hippocampus. Nature. 1993;361:31–39. doi: 10.1038/361031a0. [DOI] [PubMed] [Google Scholar]
- 9.Paoletti P, Bellone C, Zhou Q. NMDA receptor subunit diversity: impact on receptor properties, synaptic plasticity and disease. Nat. Rev. Neurosci. 2013;14:383–400. doi: 10.1038/nrn3504. [DOI] [PubMed] [Google Scholar]
- 10.Simon RP, Swan JH, Griffiths T, Meldrum BS. Blockade of N-methyl-D-aspartate receptors may protect against ischemic damage in the brain. Science. 1984;226:850–852. doi: 10.1126/science.6093256. [DOI] [PubMed] [Google Scholar]
- 11.Parsons MP, Raymond LA. Extrasynaptic NMDA receptor involvement in central nervous system disorders. Neuron. 2014;82:279–293. doi: 10.1016/j.neuron.2014.03.030. [DOI] [PubMed] [Google Scholar]
- 12.Yuan H, Hansen KB, Vance KM, Ogden KK, Traynelis SF. Control of NMDA receptor function by the NR2 subunit amino-terminal domain. J. Neurosci. 2009;29:12045–12058. doi: 10.1523/JNEUROSCI.1365-09.2009. [DOI] [PMC free article] [PubMed] [Google Scholar]
- 13.Karakas E, Simorowski N, Furukawa H. Subunit arrangement and phenylethanolamine binding in GluN1/GluN2 NMDA receptors. Nature. 2011;475:249–253. doi: 10.1038/nature10180. [DOI] [PMC free article] [PubMed] [Google Scholar]
- 14.Hu NW, Klyubin I, Anwyl R, Rowan MJ. GluN2B subunit-containing NMDA receptor antagonists prevent Abeta-mediated synaptic plasticity disruption in vivo. Proc. Natl. Acad. Sci. U. S. A. 2009;106:20504–20509. doi: 10.1073/pnas.0908083106. [DOI] [PMC free article] [PubMed] [Google Scholar]
- 15.Yuan H, et al. Context-dependent GluN2B-selective inhibitors of NMDA receptor function are neuroprotective with minimal side effects. Neuron. 2015;85:1305–1318. doi: 10.1016/j.neuron.2015.02.008. [DOI] [PMC free article] [PubMed] [Google Scholar]
- 16.Parsons CG, et al. Comparison of the potency, kinetics and voltage-dependency of a series of uncompetitive NMDA receptor antagonists in vitro with anticonvulsive and motor impairment activity in vivo. Neuropharmacology. 1995;34:1239–1258. doi: 10.1016/0028-3908(95)00092-k. [DOI] [PubMed] [Google Scholar]
- 17.Kovacic P, Somanathan R. Clinical physiology and mechanism of dizocilpine (MK-801): electron transfer, radicals, redox metabolites and bioactivity. Oxid. Med. Cell. Longev. 2010;3:13–22. doi: 10.4161/oxim.3.1.10028. [DOI] [PMC free article] [PubMed] [Google Scholar]
- 18.Reisberg B, et al. Memantine in moderate-to-severe Alzheimer's disease. N. Engl. J. Med. 2003;348:1333–1341. doi: 10.1056/NEJMoa013128. [DOI] [PubMed] [Google Scholar]
- 19.Pierson TM, et al. GRIN2A mutation and early-onset epileptic encephalopathy: personalized therapy with memantine. Ann Clin Transl Neurol. 2014;1:190–198. doi: 10.1002/acn3.39. [DOI] [PMC free article] [PubMed] [Google Scholar]
- 20.Wollmuth LP, Sobolevsky AI. Structure and gating of the glutamate receptor ion channel. Trends Neurosci. 2004;27:321–328. doi: 10.1016/j.tins.2004.04.005. [DOI] [PubMed] [Google Scholar]
- 21.Kashiwagi K, et al. Channel blockers acting at N-methyl-D-aspartate receptors: differential effects of mutations in the vestibule and ion channel pore. Mol. Pharmacol. 2002;61:533–545. doi: 10.1124/mol.61.3.533. [DOI] [PubMed] [Google Scholar]
- 22.Sobolevsky AI, Koshelev SG, Khodorov BI. Interaction of memantine and amantadine with agonist-unbound NMDA-receptor channels in acutely isolated rat hippocampal neurons. J. Physiol. 1998;512(Pt 1):47–60. doi: 10.1111/j.1469-7793.1998.047bf.x. [DOI] [PMC free article] [PubMed] [Google Scholar]
- 23.Wollmuth LP, Kuner T, Seeburg PH, Sakmann B. Differential contribution of the NR1- and NR2A-subunits to the selectivity filter of recombinant NMDA receptor channels. J. Physiol. 1996;491(Pt 3):779–797. doi: 10.1113/jphysiol.1996.sp021257. [DOI] [PMC free article] [PubMed] [Google Scholar]
- 24.Wollmuth LP, Kuner T, Sakmann B. Intracellular Mg2+ interacts with structural determinants of the narrow constriction contributed by the NR1-subunit in the NMDA receptor channel. J. Physiol. 1998;506(Pt 1):33–52. doi: 10.1111/j.1469-7793.1998.00033.x. [DOI] [PMC free article] [PubMed] [Google Scholar]
- 25.Klepeis JL, Lindorff-Larsen K, Dror RO, Shaw DE. Long-timescale molecular dynamics simulations of protein structure and function. Curr. Opin. Struct. Biol. 2009;19:120–127. doi: 10.1016/j.sbi.2009.03.004. [DOI] [PubMed] [Google Scholar]
- 26.Chang HR, Kuo CC. The activation gate and gating mechanism of the NMDA receptor. J. Neurosci. 2008;28:1546–1556. doi: 10.1523/JNEUROSCI.3485-07.2008. [DOI] [PMC free article] [PubMed] [Google Scholar]
- 27.Murthy SE, Shogan T, Page JC, Kasperek EM, Popescu GK. Probing the activation sequence of NMDA receptors with lurcher mutations. J. Gen. Physiol. 2012;140:267–277. doi: 10.1085/jgp.201210786. [DOI] [PMC free article] [PubMed] [Google Scholar]
- 28.Stern P, Cik M, Colquhoun D, Stephenson FA. Single channel properties of cloned NMDA receptors in a human cell line: comparison with results from Xenopus oocytes. J. Physiol. 1994;476(3):391–397. doi: 10.1113/jphysiol.1994.sp020140. [DOI] [PMC free article] [PubMed] [Google Scholar]
- 29.Jensen MØ, Jogini V, Eastwood MP, Shaw DE. Atomic-level simulation of current-voltage relationships in single-file ion channels. J. Gen. Physiol. 2013;141(5):619–632. doi: 10.1085/jgp.201210820. [DOI] [PMC free article] [PubMed] [Google Scholar]
- 30.Lipton SA. Paradigm shift in neuroprotection by NMDA receptor blockade: Memantine and beyond. Nat. Rev. Drug Discov. 2006;5:160–170. doi: 10.1038/nrd1958. [DOI] [PubMed] [Google Scholar]
- 31.Dukkipati A, Park HH, Waghray D, Fischer S, Garcia KC. BacMam system for high-level expression of recombinant soluble and membrane glycoproteins for structural studies. Protein Expr. Purif. 2008;62:160–170. doi: 10.1016/j.pep.2008.08.004. [DOI] [PMC free article] [PubMed] [Google Scholar]
- 32.Baconguis I, Gouaux E. Structural plasticity and dynamic selectivty of acid-sensing ion channel-spider toxin complexes. Nature. 2012;489:400–405. doi: 10.1038/nature11375. [DOI] [PMC free article] [PubMed] [Google Scholar]
- 33.Inouye H, Barnes W, Beckwith J. Signal sequence of alkaline phosphatase of Escherichia coli. J. Bacteriol. 1982;149:434–439. doi: 10.1128/jb.149.2.434-439.1982. [DOI] [PMC free article] [PubMed] [Google Scholar]
- 34.Reeves PJ, Callewaert N, Contreras R, Khorana HG. Structure and function in rhodopsin: high-level expression of rhodopsin with restricted and homogeneous N-glycosylation by a tetracycline-inducible N-acetylglucosaminyltransferase I-negative HEK293S stable mammalian cell line. Proc. Natl. Acad. Sci. USA. 2002;99:13419–13424. doi: 10.1073/pnas.212519299. [DOI] [PMC free article] [PubMed] [Google Scholar]
- 35.Kabsch W. XDS. Acta Crystallogr. D Biol. Crystallogr. 2010;66:125–132. doi: 10.1107/S0907444909047337. [DOI] [PMC free article] [PubMed] [Google Scholar]
- 36.Hanson MA, et al. Crystal structure of a lipid-G protein-coupled receptor. Science. 2012;335:851–855. doi: 10.1126/science.1215904. [DOI] [PMC free article] [PubMed] [Google Scholar]
- 37.Armstrong N, Jasti J, Beich-Frandsen M, Gouaux E. Measurement of conformational changes accompanying desensitization in an ionotropic glutamate receptor. Cell. 2006;127:85–97. doi: 10.1016/j.cell.2006.08.037. [DOI] [PubMed] [Google Scholar]
- 38.McCoy AJ. Solving structures of protein complexes by molecular replacement with Phaser. Acta Crystallogr. D. Biol. Crystallogr. 2007;63:32–41. doi: 10.1107/S0907444906045975. [DOI] [PMC free article] [PubMed] [Google Scholar]
- 39.Emsley P, Cowtan K. Coot: model-building tools for molecular graphics. Acta Crystallogr. D. Biol. Crystallogr. 2004;60:2126–2132. doi: 10.1107/S0907444904019158. [DOI] [PubMed] [Google Scholar]
- 40.Adams PD, et al. PHENIX: building new software for automated crystallographic structure determination. Acta Crystallogr. D. Biol. Crystallogr. 2002;58:1948–1954. doi: 10.1107/s0907444902016657. [DOI] [PubMed] [Google Scholar]
- 41.Davis IW, et al. MolProbity: all-atom contacts and structure validation for proteins and nucleic acids. Nucleic Acids Res. 2007;35:W375–383. doi: 10.1093/nar/gkm216. [DOI] [PMC free article] [PubMed] [Google Scholar]
- 42.Arnold K, Bordoli L, Kopp J, Schwede T. The SWISS-MODEL workspace: a web-based environment for protein structure and homology modelling. Bioinformatics. 2006;22:195–201. doi: 10.1093/bioinformatics/bti770. [DOI] [PubMed] [Google Scholar]
- 43.Chovancova E, et al. CAVER 3.0: a tool for the analysis of transport pathways in dynamic protein structures. PLoS Comput. Biol. 2012;8:e1002708. doi: 10.1371/journal.pcbi.1002708. [DOI] [PMC free article] [PubMed] [Google Scholar]
- 44.Hart HE, Greenwald EB. Scintillation proximity assay (SPA) - a new method of immunoassay. Direct and inhibition mode detection with human albumin and rabbit antihuman albumin. Mol. Immunol. 1979;16:265–267. doi: 10.1016/0161-5890(79)90065-8. [DOI] [PubMed] [Google Scholar]
- 45.Vilar S, Cozza G, Moro S. Medicinal chemistry and the molecular operating environment (MOE): application of QSAR and molecular docking to drug discovery. Curr. Top. Med. Chem. 2008;8:1555–1572. doi: 10.2174/156802608786786624. [DOI] [PubMed] [Google Scholar]
- 46.Shaw DE, et al. Anton 2: raising the bar for performance and programmability in a special-purpose molecular dynamics supercomputer. Proceedings of the International Conference for High Performance Computing, Networking, Storage and Analysis. 2014:41–53. doi: 10.1109/SC.2014.9. [DOI] [Google Scholar]
- 47.Hackos DH, Lupardus PJ, Grand T, Chen Y, Wang TM, Reynen P, Gustafson A, Wallweber HJ, Volgraf M, Sellers BD, Schwarz JB, Paoletti P, Sheng M, Zhou Q, Hanson JE. Positive allosteric modulators of GluN2A-containing NMDARs with distinct modes of action and impacts on circuit function. Neuron. 2016;89(5):983–999. doi: 10.1016/j.neuron.2016.01.016. [DOI] [PubMed] [Google Scholar]
- 48.MacKerell AD, et al. All-atom empirical potential for molecular modeling and dynamics studies of proteins. J. Phys. Chem. B. 1998;102:3586–3616. doi: 10.1021/jp973084f. [DOI] [PubMed] [Google Scholar]
- 49.Mackerell AD, Jr, Feig M, Brooks CL., 3rd Extending the treatment of backbone energetics in protein force fields: limitations of gas-phase quantum mechanics in reproducing protein conformational distributions in molecular dynamics simulations. J. Comput. Chem. 2004;25:1400–1415. doi: 10.1002/jcc.20065. [DOI] [PubMed] [Google Scholar]
- 50.Klauda JB, et al. Update of the CHARMM all-atom additive force field for lipids: validation on six lipid types. J. Phys. Chem. B. 2010;114:7830–7843. doi: 10.1021/jp101759q. [DOI] [PMC free article] [PubMed] [Google Scholar]
- 51.Jensen MØ, Jogini V, Borhani DW, Leffler AE, Dror RO, Shaw DE. Mechanism of voltage gating in potassium channels. Science. 2012;336(6078):229–233. doi: 10.1126/science.1216533. [DOI] [PubMed] [Google Scholar]
- 52.Vanommeslaeghe K, et al. CHARMM general force field: A force field for drug-like molecules compatible with the CHARMM all-atom additive biological force fields. J. Comput. Chem. 2010;31:671–690. doi: 10.1002/jcc.21367. [DOI] [PMC free article] [PubMed] [Google Scholar]
- 53.Yu W, He X, Vanommeslaeghe K, MacKerell AD., Jr Extension of the CHARMM General Force Field to sulfonyl-containing compounds and its utility in biomolecular simulations. J. Comput. Chem. 2012;33:2451–2468. doi: 10.1002/jcc.23067. [DOI] [PMC free article] [PubMed] [Google Scholar]
- 54.Mishra S, et al. Conformational dynamics of the nucleotide binding domains and the power stroke of a heterodimeric ABC transporter. eLife. 2014;3:e02740. doi: 10.7554/eLife.02740. [DOI] [PMC free article] [PubMed] [Google Scholar]
- 55.Jeschke G, Koch A, Jonas U, Godt A. Direct conversion of EPR dipolar time evolution data to distance distributions. J. Magn. Reson. 2002;155:72–82. doi: 10.1006/jmre.2001.2498. [DOI] [PubMed] [Google Scholar]
- 56.Stein RA, Beth AH, Hustedt EJ. A Straightforward Approach to the Analysis of Double Electron-Electron Resonance Data. Methods Enzymol. 2015;563:531–567. doi: 10.1016/bs.mie.2015.07.031. [DOI] [PMC free article] [PubMed] [Google Scholar]
- 57.Roux B. The membrane potential and its representation by a constant electric field in computer simulations. Biophys. J. 2008;95(9):4205–4216. doi: 10.1529/biophysj.108.136499. [DOI] [PMC free article] [PubMed] [Google Scholar]
Associated Data
This section collects any data citations, data availability statements, or supplementary materials included in this article.
Supplementary Materials
Data Availability Statement
The coordinates for the ∆ATD NMDA receptor structure have been deposited in the Protein Data Bank under the accession code 5UN1. The simulation results are available from the corresponding authors upon request.


