Abstract
Purpose
To couple quantitative compositional MRI, gait analysis, and machine learning multidimensional data analysis to study osteoarthritis (OA). OA is a multifactorial disorder accompanied by biochemical and morphological changes in the articular cartilage, modulated by skeletal biomechanics and gait. While we can now acquire detailed information about the knee joint structure and function, we are not yet able to leverage the multifactorial factors for diagnosis and disease management of knee OA.
Materials and Methods
We mapped 178 subjects in a multidimensional space integrating: demographic, clinical information, gait kinematics and kinetics, cartilage compositional T1ρ and T2 and R2-R1ρ (1/T2−1/T1ρ) acquired at 3T and whole-organ magnetic resonance imaging score morphological grading. Topological data analysis (TDA) and Kolmogorov–Smirnov test were adopted for data integration, analysis, and hypothesis generation. Regression models were used for hypothesis testing.
Results
The results of the TDA showed a network composed of three main patient subpopulations, thus potentially identifying new phenotypes. T2 and T1ρ values (T2 lateral femur P = 1.45*10−8, T1ρ medial tibia P = 1.05*10−5), the presence of femoral cartilage defects (P = 0.0013), lesions in the meniscus body (P = 0.0035), and race (P = 2.44*10−4) were key markers in the subpopulation classification. Within one of the subpopulations we observed an association between the composite metric R2-R1ρ and the longitudinal progression of cartilage lesions.
Conclusion
The analysis presented demonstrates some of the complex multitissue biochemical and biomechanical interactions that define joint degeneration and OA using a multidimensional approach, and potentially indicates that R2-R1ρ may be an imaging biomarker for early OA.
Level of Evidence
3
Osteoarthritis (OA) is a complex and multifactorial disorder and a leading cause of chronic disability. OA prevalence in the United States is conservatively estimated at 26.9 million US adults,1 with estimated annual costs up to $15 billion.1–3
Magnetic resonance imaging (MRI) plays a central role in OA diagnosis and research, and in the last few years has shed light on disease etiology, identifying potential treatment pathways, and prediction of long-term outcome.4 Scoring systems of knee morphological defects, such as the whole-organ magnetic resonance imaging score (WORMS), have been extensively used.5 However, these morphological assessments are not able to capture the early biochemical changes that occur in OA.6
MR-derived compositional imaging such as T1ρ and T2 relaxation time techniques can capture early degeneration and have been extensively used to assess the structural and biochemical properties of cartilage.6 While T2 relaxation times are primarily affected by hydration and collagen structure due to dipolar interactions,7 the spin-lock techniques used in T1ρ reduce dipolar interactions, obtaining a biomarker sensitive to chemical exchange on proteoglycan and water protons,8 although T1ρ changes in cartilage may be affected by hydration and collagen structure as well.9
In addition, in the last few years there was a growing interest in the analysis of relaxation rate dispersions, R1ρ (1/T1ρ) and R2 (1/T2), as possible early imaging biomarkers, which several studies have correlated with cartilage quality, specifically the chemical and diffusive exchange at higher fields.10 A recent in vivo study11 explored the usage of R2–R1ρ as a composite metric for the biochemical characterization of the articular cartilage in subjects after anterior cruciate ligament (ACL) injury and reconstruction, demonstrating that R2–R1ρ values were predictors of the change in pain perception 6 months after ACL reconstruction.
Kinematics and kinetics analyses provide additional tools for OA assessment, producing clinically relevant data.12 Increased knee adduction moment and adduction moment impulse result in higher medial tibiofemoral joint (TFJ) loading in the knee, and have been well documented to be related to the presence, severity, and progression of medial compartment TFJ OA. At the patellofemoral joint (PFJ), increased knee flexion moment is indicative of higher quadriceps force, which can result in greater compressive force at the PFJ and higher PFJ stress.25,26
Since OA involves the entire joint including interconnected morphological, biochemical, and biomechanical aspects, the separate analysis of each contributing factor is unable to fully capture the complex nature of this multifactorial disease. In this study we applied a novel multidimensional data analysis tool, based on data topology, to analyze a dataset including: cartilage compositional MRI data obtained through T1ρ and T2 relaxation time and R2-R1ρ relaxation rate, gait kinematics and kinetics, and MRI morphological grading using WORMS. The aims were 1) mining latent patterns in the complex multidimensional data, analyzing all the variables simultaneously; and 2) identifying imaging biomarkers able to predict the longitudinal progression of cartilage lesions in subjects with and without radiographic signs of OA.
Materials and Methods
Subjects
The subjects included in the analysis are part of an ongoing longitudinal case–control study aimed to study the effect of loading in subjects with and without OA. The subjects were recruited via posted flyers from the local community. The inclusion criteria for OA patients were: age >35 years, knee pain, aching, or stiffness on most days per month during the past year, or use of medication for knee pain on most days per month during the past year, and definite radiographic evidence of knee OA (Kellgren–Lawrence [KL] >1). The inclusion criteria for controls were: age >35 years, no knee pain or stiffness in either knee or use of medications for knee pain in the last year, and no radiographic evidence of OA (KL 1) on either knee. The exclusion criteria for all subjects were 1) concurrent use of an investigational drug, 2) history of fracture or surgical intervention in the studied knee, and 3) contraindications to MRI. A total of 178 subjects were included in this study. All subjects gave informed consent, and the study was carried out in accordance with the regulations of the Committee for Human Research at our institution.
Demographic information including age, gender, body mass index (BMI), and race were collected at the time of recruitment; after the first visit patients were followed up annually for 3 years. At each visit subjects filled out Patients Reported Outcomes Measures (PROMs) aimed to assess patients pain, symptoms, stiffness, function, knee-related quality of life, and physical activity levels. Specifically, PROMs surveys collected for this study were: knee outcomes in osteoarthritis scores (KOOS),13 Western Ontario and McMaster Universities osteoarthritis index (WOMAC),14 and Marx physical activity scale.15 Knee radiographs were acquired and evaluated by a musculoskeletal radiologist with more then 20 years of experience using the KL scoring system.16 KL repeatability was previously assessed with kappa score ranging between 0.67–0.98 when 1403 subjects from the Rotterdam study were considered.17,18
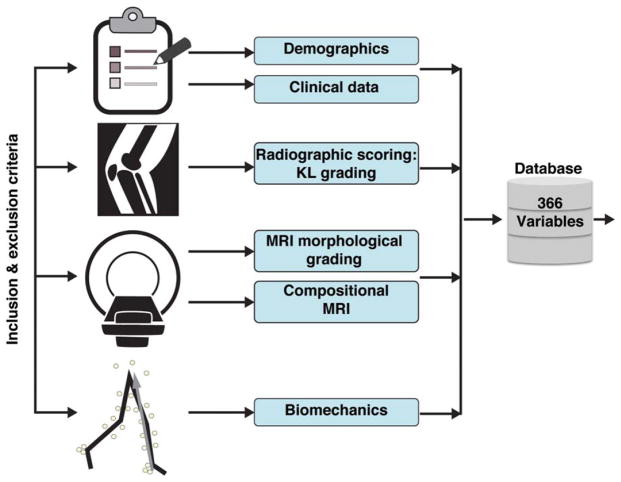
Figure 1 shows a diagram of all the data categories collected and used to built a 366D feature vector for the description of each subjects; the variables were categorized as: demographic (nine variables), clinical data or PROMs (23 variables), X-rays (two variables), morphological MRI (44 variables), compositional MRI (256 variables), and biomechanics (32 variables). Supplementary Table 1 includes a data dictionary of all variables.
FIGURE 1.
Diagram describing the data categories used to build the 366D feature vector for the description of each subject. KL grading, Kellgren-Lawrence grading.
All the information collected and results of the quantitative analysis were stored in a centralized Research Electronic Data Capture (RedCap) database.19 Supplementary Figure 1 shows a more detailed representation of the overall postprocessing pipeline.
MRI Protocol
All images were acquired using a 3T MRI scanner (GE, Milwaukee, WI) with an eight-channel knee coil (Invivo, Gainesville, FL). Our cartilage-sensitive protocol included three main sequences. 3D high-resolution fast spin-echo (FSE CUBE) used for semiautomatic soft tissues segmentation (cartilage and meniscus) and to evaluate morphological abnormalities using modified WORMS5 performed by a single reader (L.N., 5 years of musculoskeletal imaging experience). One previous study reported intra- and interobserver agreement of 0.87 (0.804–0.932) and 0.84 (0.771–0.911) for meniscus WORMS and 0.84 (0.771–0.911) and 0.79 (0.72–0.868) for cartilage WORMS.20
The 3D-FSE sequence parameters were: repetition time (TR) / echo time (TE) 1500/26.69 msec, field of view 16 cm, matrix 384 × 384, slice thickness 0.5 mm, echo train length 32, bandwidth = 37.5 kHz, number of excitations (NEX) 0.5, acquisition time 10.5 minutes. T1ρ and T2 relaxation time sequences were acquired using 3D acquisition scheme-magnetization-prepared angle-modulated partitioned-k-space SPGR snapshots (3D MAPSS).21 Both T1ρ and T2 sequences were designed containing an interchangeable preparation, in which either the T1ρ or the T2 preparation could be run for any echo.21 The following parameters were used: T1ρ TR/TE 9/2.6 msec, time of recovery 1500 msec, field of view 14 cm, matrix 256 × 128, slice thickness 4 mm, bandwidth 62.5 kHz, time of spin-lock (TSL) 0/2/4/8/12/20/40/80 msec, frequency of spin-lock 500 Hz, acquisition time 11 minutes. T2 was acquired with the same parameters as T1ρ except for magnetization preparation TE 1.8/3.67.3/14.5/29.1/43.6/58.2, acquisition time 11 minutes. Different from how presented previously,21 T1ρ and T2 sequences were run separately. The protocol was performed twice: after 45 minutes of knee unloading and with a 50% body weight load applied to the foot using MRI-compatible weights aimed to simulate static standing.
All the image postprocessing was performed using in-house developed software written in MatLab (MathWorks, Natick, MA), previously described and evaluated.22,23 Briefly, six cartilage global compartments (LF: lateral femur, MF: medial femur, LT: lateral tibia, MT: medial tibia, TrF: femoral trochlea and P: patella) were segmented semiautomatically on the CUBE image after rigid registration on the TSL = 0 image of the T1ρ. The reproducibility of the adopted relaxation time quantification technique was reported previously.24 The global compartments were subsequently divided into subcompartments and superficial and deep layers using anatomical landmarks automatically extracted from meniscus segmentation and articular and bone layers as previously described25 and shown in the postprocessing pipeline included as Supplementary Figure 1. T1ρ and T2 maps were computed using three-parameters exponential fitting after all the echoes were nonrigidly registered to correct for any subjects movement during the scan.26 T1ρ and T2 averages within global compartment subcompartments and layers were considered as quantification. R2 (1/T2) − R1ρ (1/T1ρ) were also computed on a voxel base after registration between T1ρ and T2 sequences.22
Kinematic and Kinetic Gait Analysis
Three-dimensional lower extremity kinematics were recorded using a 10-camera motion capture system (VICON, Oxford Metrics, Oxford, UK) at a sampling rate of 250 Hz. Ground reaction force data were obtained using two embedded force platforms (AMTI, Watertown, MA) at a sampling rate of 1000 Hz. Marker and ground reaction force data were collected and synchronized using motion capture software (Nexus, Oxford Metrics) while subjects walked at a self-selected speed. Kinematic and kinetic data were computed using Visual3D (C-Motion, Germantown, MD) and MatLab. Joint kinematics included: hip and knee flexion/extension, abduction/adduction and internal/external rotation angles and were not normalized to the standing calibration position. Joint kinetic data included moment and moment impulses; Joint moments were reported as external moments and normalized to each subject’s body mass (kg) and height (m). Knee moment impulses were calculated as the integral of knee moment (Nm/kg × m) with respect to time (msec).
Multidimensional Data Integration and Data Analysis
As a preliminary analysis, and for descriptive proposes only, we analyzed clinical and quantitative (MRI and biomechanics) variables comparing OA and controls subjects’ based on KL grading using an independent t-test. The distribution of morphological defects in the subjects group was assessed and reported, and the overall dataset correlation matrix was computed.
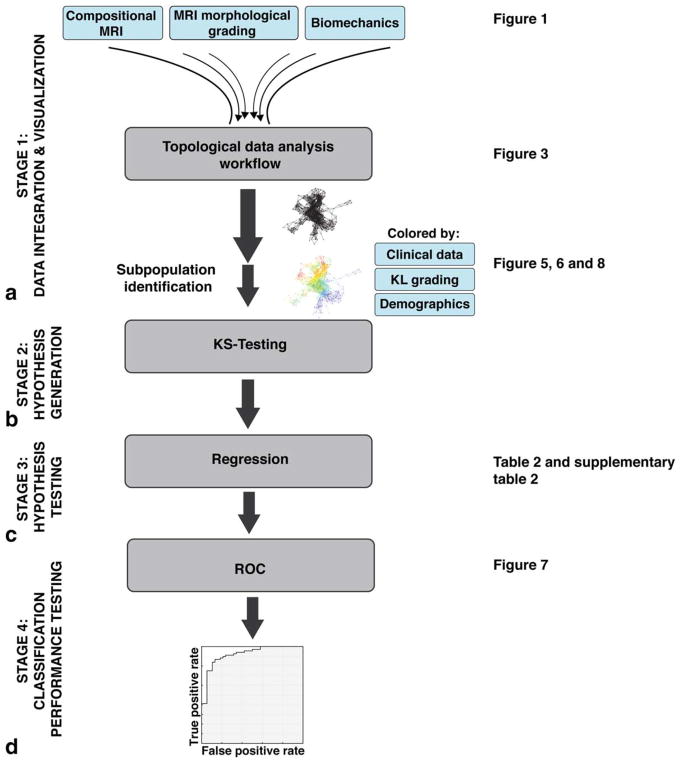
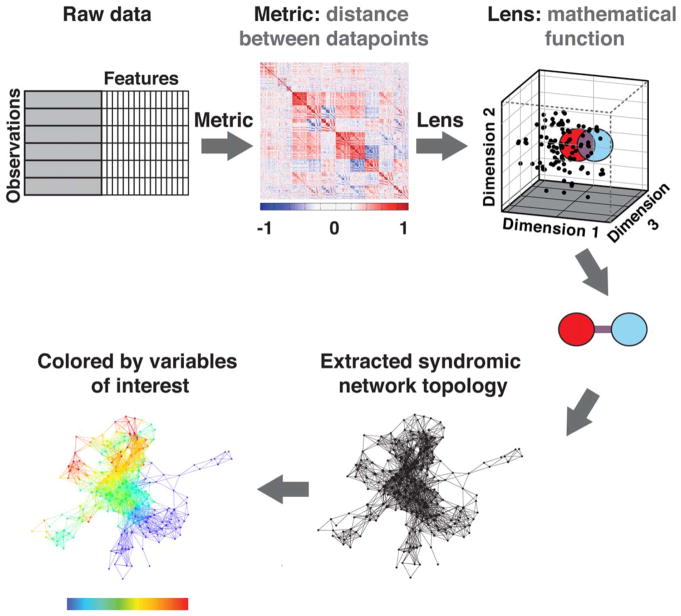
The multidimensional data integration and analysis pipeline and hypothesis testing is shown in Fig. 2. Multidimensional data integration and visualization was performed using Topological Data Analysis (TDA) on all 178 subjects at the baseline timepoint using Ayasdi cloud-based platform (Ayasdi, v. 3.0). TDA involves projecting individual patients into the “OA syndromic space” defined by all outcome variables simultaneously.27 The TDA workflow is illustrated in Fig. 3. The workflow automatically renders cross-correlations across all selected variables and places individuals into a multidimensional point cloud space viewed through a mathematical “lens” of principal component analysis. TDA clusters subjects based on their similarity where similar individuals were grouped into nodes. If individuals appear in two different nodes, a line connects the nodes. The extracted topology can then be colored by variables of interest to explore the network. The mapping of subjects based on the selected variables into this OA network is referred to as the OA syndromic space. Subjects were clustered into the OA syndromic space using a norm correlation as a metric defining the distance between data points (X, Y) in space given by:
where X and Y are describing the data points and X′, Y′ are the column-wise, mean centered, and variance normalized version of X and Y, and:
FIGURE 2.
Multidimensional data integration and analysis pipeline. A: Stage 1: Data integration and visualization. The observed compositional MRI, MRI morphological grading, and biomechanics variables were fed into a topological data analysis workflow. The extracted networks were colored by variables of interest and subpopulations were defined. B: Stage 2: Hypothesis generation. KS tests were applied and results were P-ranked to identify variables that distinguish the subpopulations of interest. C: Stage 3: Hypothesis testing. A logistic regression was used to confirm the predictive validity of the extracted variables. D: Stage 4: Classification performance testing. ROC curves were used to define the classification performance of the predictors. KL grading, Kellgren–Lawrence grading; KS-test, Kolmogorov–Smirnov test; ROC curves, receiver operating characteristic curves.
FIGURE 3.
Topological data analysis workflow. First, a cross-correlations is rendered across all selected variables. Individuals are placed into a multidimensional point cloud space viewed through a mathematical “lens” of principal component analysis. Topological data analysis clusters patients based on their similarity, where similar individuals are grouped into nodes. Here, a red circle represents one group of subjects and a blue circle represents another group of subjects. A line connects nodes (groups of subjects) that share an individual. The extracted network can then be colored by variables of interest.
In addition, we used as a mathematical lens called metric PCA 1 (resolution: 30, gain: 3.5) and metric PCA 2 (resolution: 30, gain: 3.5) to partition data into bins for clustering. Further details about TDA pipeline and theory are reported in Ref. 28.
First, morphological MRI, biomechanics, and compositional MRI were used to define the OA network. The goal was to identify distinct patient subpopulations (subnetworks) within the full multidimensional space and to analyze the distribution of outcomes variables. Outcome variables such as KL grading, KOOS, etc., were used to color the network, with the aim to evaluate the obtained OA syndromic space (Fig. 2A).
Second, we performed TDA on the quantitative measures alone, in the absence of clinical morphological MR grading information, to assess the feasibility of using TDA on quantitative measures as an automated clinical decision-support tool.
Third, we assessed the ability of the TDA to reveal insights and generate hypothesis on relaxation or biomechanical parameters able to predict disease progression. Any change in WORMS cartilage lesion score from baseline to the 2-year follow-up were considered as OA progression, and the binary outcome obtained was used to render the data topological network to explore the presence of subnetworks of progressors.
The splitting of the generated network into the subnetworks was visually guided by the structure of the topology. These subnetworks of interest were formally evaluated by the Kolmogorov–Smirnov (KS) test to generate hypothesis on the numerical predictors of the subnetworks membership (Fig. 2B). The results of the KS test were ranked by their P-value using the Benjamini–Hochberg method to correct for multiple comparisons. A separate analysis was performed for categorical predictors. For each categorical variable and for each value it can assume, we computed the percent of occurrences of that value in the first selected subnetwork as well as the percent of that value in the comparison subnetwork. From those numbers we computed hypergeometric P-values. This value reported in our analysis expresses the enrichment of that particular value in the selection vs. the comparison set.
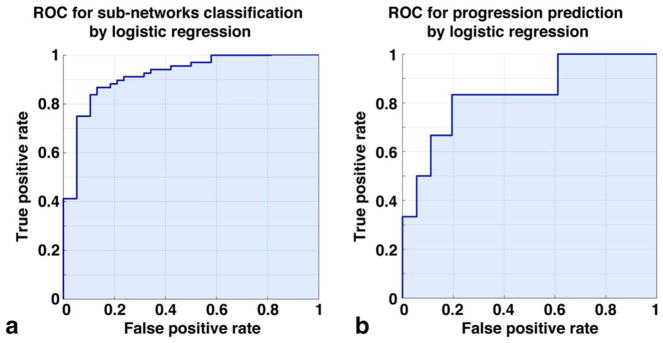
Logistic regression was then used to confirm the hypothesis generated by the TDA (Fig. 2C). The classification performances were assessed using area under the curve (AUC) in receiver operating characteristic (ROC) analysis (Fig. 2D). Logistic regression, t-test, and ROC statistical analysis were conducted using MatLab Statistics Toolbox Release 2015b. The significance level was set as P < 0.05.
Results
Of the 178 analyzed subjects, 57 (32.02%) showed radiographic signs of osteoarthritis (KL > 1). OA subjects were significantly older compared to non-OA cases (age: KL > 1 57.30 ± 8.9, KL 0–1 49.19 ± 8.33, P < 0.001); demographic distribution is reported in Table 1.
TABLE 1.
Demographics and Clinical Characteristics of the Two Osteoarthritis Severities Groups Defined as KL>1 and KL 0–1
| Demographic characteristics (N = 178) | |||
|---|---|---|---|
| Characteristics | |||
| KL > 1 (N = 57) | KL 0–1 (N = 121) | P-value | |
| Sexa | |||
| Male | 22 (38.5%) | 49 (40.5%) | 0.66 |
| Female | 35 (61.5%) | 72 (61.5%) | |
| Age (years)b | 57.30 ± 8.9 | 49.19 ± 8.33 | 6.20E-08 |
| BMI (kg/m2)b | 25.08 ± 3.37 | 24.35 ± 3.54 | 0.244 |
| Racea | |||
| Caucasian | 32 (56.1%) | 60 (49.6%) | 0.55 |
| Asian | 14 (24.6%) | 42 (33.9%) | |
| African American | 7 (12.3%) | 5 (4.1%) | |
| Latino | 4 (7.1%) | 15 (12.7%) | |
Data expressed as count (percentage %).
Data expressed as mean ± standard deviation.
OA subjects showed significantly worse outcome in all the KOOS and WOMAC categories (P < 0.001). Significantly less self-reported Marx physical activity scale running and decelerating was also observed in the KL > 1 group. Analyzing compositional MRI, we observed, consistent with a previous report, a prolongation in T1ρ and T2 relaxation time in OA subjects compared with control, with the biggest differences shown in the central posterior subcompartment of lateral femur (T1ρ: KL > 1 34.6 ± 4.6 msec, KL 0–1 32.2 ± 0.03 msec, P = 0.007; T2: KL > 1 27.00 ± 2.88 msec, KL 0–1 24.71 ± 3.10 msec, P < 0.001). Comparisons of OA to control subjects on composite metrics R2-R1ρ revealed patella articular layer as the only compartment showing significant differences, with lower R2-R1ρ observed in OA subjects compared with controls (R2-R1ρ: KL > 1 0.0079 ± 0.002 msec−1, KL 0–1 0.0095 ± 0.003 msec−1, P = 0.028). A trend toward significance was also observed in the central posterior lateral femur (R2-R1ρ: KL > 1 0.01 ± 0.005 msec−1, KL 0–1 0.0013 ± 0.006 msec−1, P = 0.088) and medial femur (R2-R1ρ: KL > 1 0.0098 ± 0.005 msec−1, KL 0–1 0.0114 ± 0.004 msec−1, P = 0.097). In kinematics and kinetics data analysis the more marked differences between OA and control subjects were observed in the peak knee abduction angle (KL > 1 3.34° ± 4.59°, KL 0–1 5.29° ± 3.31°, P = 0.012) and peak hip adduction moment (KL > 1 0.62 ± 0.14 Nm/kg*m, KL 0–1 0.69 ± 0.11 Nm/kg*m, P = 0.012).
WORMS morphological assessment in the overall dataset showed that 155 (87.07%) out of the 178 subjects showed signal abnormality in at least one cartilage compartment (WORMS > 0), while 119 (66.8%) showed definite cartilage lesion (WORMS > 1). Among those 119 showing cartilage lesion, 36 (30.25%) presented lesions in both the tibia-femoral and patella-femoral joint; 65 (54.62%) showed isolated patella-femoral lesions and only 18 (30.25%) showed isolated tibia-femoral lesions. In all, 115 (64.6%) subjects had meniscal lesions and 40 (22.47%) showed ligament abnormalities. Altogether, 94 (52.80%) subjects presented bone marrow edema lesion-like pattern and 19 (10.64%) showed the presence of subchondral cysts. Figure 4 shows the correlation matrix obtained analyzing the simple association between all the 366 different variables. Strong (R > 0.6) intradomain correlations are observed and moderate (0.4<|R|<0.6) correlations were observed between morphological MRI, compositional MRI, and biomechanics data.
FIGURE 4.
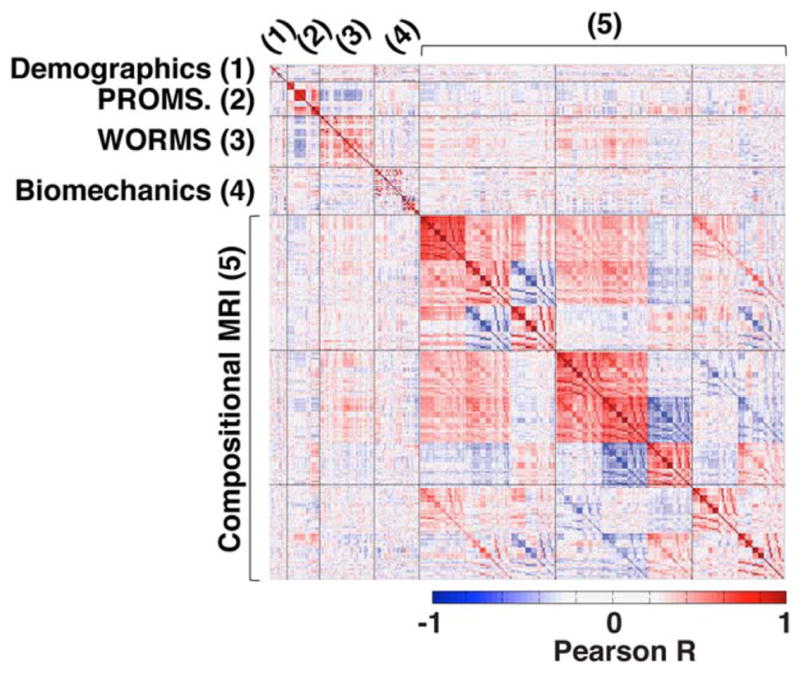
Heat map of the correlation matrix of all 366 collected endpoints. Positive correlations are shown in red and negative correlations in blue.
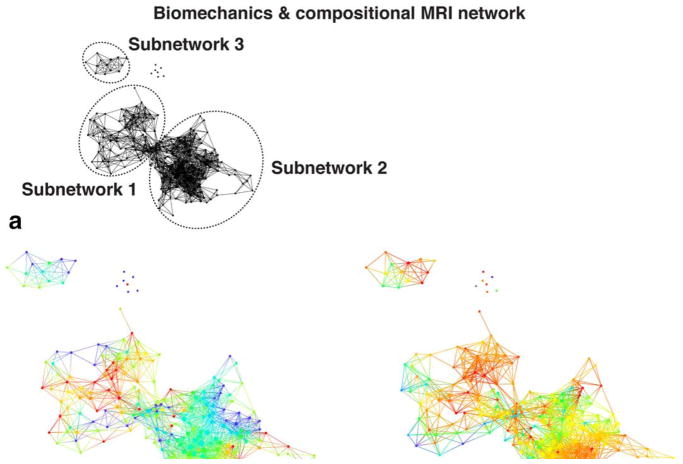
The data topology extracted on the combined outcome domains of morphological MRI grading, biomechanics, and compositional MRI produced a polarized network, with severe OA subjects (red nodes) appearing in the lower right and less severe OA (blue nodes) in the upper left (Fig. 5), demonstrating that the selected variable domains are appropriate for the analysis of OA (OA syndromic space). Considering biomechanics and compositional MRI variables alone (ie, quantitative measures only) a clear network composed of three distinct subnetworks emerged, as shown in Fig. 6A. Forty-eight (26.97%) of the subjects were observed to be part of subnetwork 1 (left) and 109 (61.24%) of subnetwork 2 (right); six (3.37%) are included in both subnetworks; and 15 (8.43%) subjects form the disconnected subnetwork 3 and the single-tons (unconnected nodes). To explore the obtained topology, the network was then colored by gender (Fig. 6B), KOOS pain patient-reported outcome (Fig. 6C), age (Fig. 6D), and KL grading (Fig. 6E). We chose to show variables known as possible risk factors of OA: as gender and age, or measures typically used as a symptomatic or radiographic definition of OA: as KOOS pain and KL grading. In addition to the topology renderings reported here, a more comprehensive visual inspection on the other outcome variable in demographics, X-ray, and PROMs categories (listed in Supplementary Material 1, variable dictionary) was performed.
FIGURE 5.
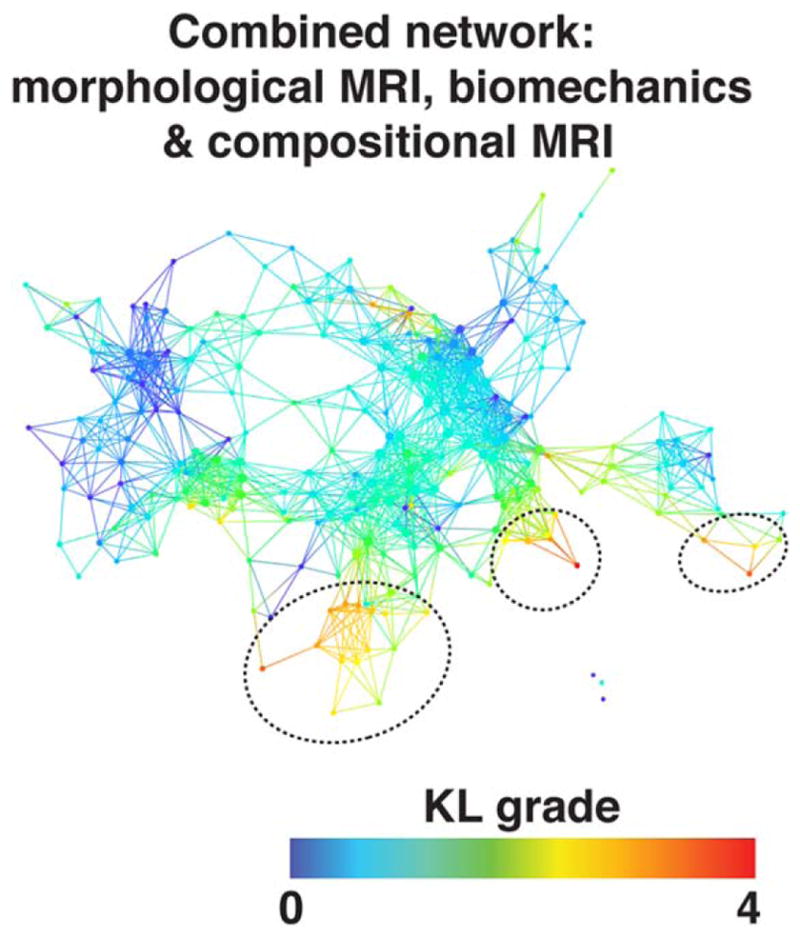
Combined network of morphological MRI, biomechanics, and compositional MRI. The network shows a gradient with severe patients appearing in the lower right (marked with dashed black circles) and less severe in the upper left based on KL grading.
FIGURE 6.
Combined biomechanics and compositional MRI topological data analysis network. A: Extracted network based on biomechanics and compositional MRI variables. The three distinct subnetworks are marked with dashed circles. B–E: The same network is colored by gender, KOOS pain, age, and KL grade. The combined network of biomechanics and compositional MRI showed differences in osteoarthritis severity defined by KL grade between the subnetwork 1 and subnetwork 2.
Based on the visual assessment of the network, subjects with radiographic signs of OA and worse self-reported pain were mostly concentrated in subnetwork 2, while KL 0–1 and KOOS > 90 (no pain) subjects were mostly located in subnetwork 1. This suggests a relationship between the subnetwork membership and OA presence. Ad hoc analysis confirmed the visual observation KL grade. Significant KL differences were observed between the two main subnetworks (KL subnetwork 1: 0.79 ± 0.95, KL subnetwork 2 1.29 ± 1.17 P = 0.010). However, no significant differences were observed in KOOS pain. The KS test was then used for a formal hypothesis generation considering all the variables as possible predictors of subnetworks membership. In all, 149 variables were significant predictors of subnetworks membership after correction for multiple comparisons (Table 2A shows the first 30 variables, the whole table is reported in Supplementary Table 2). The top-ranked variables showed a KS P range between 1.45*10−8 and 1.14*10−5; and they were mostly unloaded T2 MRI variables. It is worth noticing that most of the subcompartmental and layers values are strongly correlated with global averages, showing similar trends, as expected. Unloaded T2 lateral femur was observed as the strongest predictor of subnetwork membership (T2 LF subnetwork 1: 21.22 ± 2.52 msec; T2 LF subnetwork 2: 25.98 ± 2.6 msec KS P = 1.45*10−8). To independently confirm the predictive validity of LF T2 for OA patient clustering we performed a logistic regression model. Considering T2 LF alone we were able to accurately predict the cluster membership: ROC AUC: 91.06% (95% confidence interval [CI] 85.65%–96.46%); best balancing between sensitivity and specificity obtained using a threshold of 23.97 msec (sensitivity 86.76% specificity 86.84%) (Fig. 7A). The regression confirmed T2 LF as a predictor of OA subpopoulations. Within the categorical variables the strongest significant differences were observed in race distribution and the presence of cartilage and meniscus lesions. Patients in subnetwork 1 had 6.78% more intact medial femoral and 5.24% more lateral femoral cartilage, 6.03% more intact medial meniscus body. 8.68% more Asian subjects were observed in subnetwork 1 compared to subnetwork 2 (Table 2B). Even though we observed a KL difference in the two main subnetworks, the data-driven classification proposed by TDA does not show KL as the strongest predictor, suggesting the presence of subjects’ subpopulations that could be well characterized by T2 relaxation times but not necessarily have strong differences in OA radiographic signs. The results obtained suggest a potential new biomechanical and compositional MRI-based grouping, as TDA clearly showed the presence of distinct subjects’ subpopulations characterized by strong biochemical signatures.
TABLE 2. (A).
Results of the Kolmogorov-Smirnov Test Used to Generate Hypothesis on Possible Numerical Predictors of the Subnetworks Membership
| ID | Variable | KS statistics | Mean subnetwork2 - mean subnetwork1 | KS BH adjusted P-value |
|---|---|---|---|---|
| 239 | compMRI_unloadedT2_cartilage.LF | 0.65 | 4.592 | 1.45683E-08 |
| 240 | compMRI_unloadedT2_cartilage.cLFa | 0.69 | 4.359 | 1.45683E-08 |
| 242 | compMRI_unloadedT2_cartilage.cLFp | 0.67 | 5.384 | 1.45683E-08 |
| 245 | compMRI_unloadedT2_cartilage.cMFa | 0.66 | 3.246 | 2.50019E-08 |
| 244 | compMRI_unloadedT2_cartilage.MF | 0.64 | 3.728 | 2.50019E-08 |
| 146 | compMRI_loadedT2_cartilage.cLFp | 0.58 | 3.592 | 1.556E-07 |
| 259 | compMRI_unloadedT2_cartilage.boneLF | 0.59 | 5.315 | 2.51674E-07 |
| 241 | compMRI_unloadedT2_cartilage.cLFc | 0.61 | 5.492 | 2.51674E-07 |
| 268 | compMRI_unloadedT2_cartilage.articularMT | 0.56 | 4.355 | 2.51674E-07 |
| 247 | compMRI_unloadedT2_cartilage.cMFp | 0.61 | 4.577 | 3.29133E-07 |
| 243 | compMRI_unloadedT2_cartilage.pLF | 0.60 | 3.851 | 3.83121E-07 |
| 155 | compMRI_loadedT2_cartilage.cLTc | 0.55 | 3.980 | 7.30216E-07 |
| 249 | compMRI_unloadedT2_cartilage.LT | 0.53 | 4.221 | 1.08931E-06 |
| 267 | compMRI_unloadedT2_cartilage.articularLT | 0.53 | 4.869 | 1.44374E-06 |
| 253 | compMRI_unloadedT2_cartilage.MT | 0.53 | 3.680 | 1.44374E-06 |
| 258 | compMRI_unloadedT2_cartilage.P | 0.55 | 3.115 | 1.44374E-06 |
| 257 | compMRI_unloadedT2_cartilage.FrT | 0.53 | 3.857 | 2.68929E-06 |
| 246 | compMRI_unloadedT2_cartilage.cMFc | 0.56 | 5.076 | 3.19542E-06 |
| 271 | compMRI_unloadedR2- R1ρ_cartilage.LF | 0.55 | −0.005 | 3.19542E-06 |
| 265 | compMRI_unloadedT2_cartilage.articularLF | 0.53 | 3.883 | 3.22379E-06 |
| 171 | compMRI_loadedT2_cartilage.articularLT | 0.52 | 3.554 | 3.44033E-06 |
| 264 | compMRI_unloadedT2_cartilage.boneP | 0.51 | 3.862 | 4.60917E-06 |
| 207 | compMRI_unloadedT1ρ_cartilage.LF | 0.53 | 3.179 | 4.93226E-06 |
| 263 | compMRI_unloadedT2_cartilage.boneFrT | 0.52 | 2.936 | 5.28587E-06 |
| 251 | compMRI_unloadedT2_cartilage.cLTc | 0.54 | 4.067 | 8.82171E-06 |
| 150 | compMRI_loadedT2_cartilage.cMFc | 0.50 | 3.292 | 8.82171E-06 |
| 143 | compMRI_loadedT2_cartilage.LF | 0.50 | 2.593 | 9.11256E-06 |
| 248 | compMRI_unloadedT2_cartilage.pMF | 0.53 | 2.597 | 9.11256E-06 |
| 221 | compMRI_unloadedT1ρ _cartilage.MT | 0.49 | 3.202 | 1.05465E-05 |
| 272 | compMRI_unloadedR2- R1ρ_cartilage.cLFa | 0.54 | −0.004 | 1.13599E-05 |
FIGURE 7.
Receiver operating characteristic (ROC) curves showing the performances of: (A) subnetworks classification considering T2 relaxation time in lateral femur as a discriminative variable; (B) cartilage lesion progression prediction in subnetwork 1, considering R2-R1ρ in the medial tibia as a discriminative variable.
TABLE 2. (B).
Results of the Hypergeometric P-Value Calculation Used to Generate Hypothesis on Possible Categorical Predictors of the Subnetworks Membership
| ID | Variable | Value | Fraction in subnet1-fraction in subnet2 | Hypergeometric P-value |
|---|---|---|---|---|
| 6 | demographic_race.asian | 1 | 8.68% | 2.44E-04 |
| 6 | demographic_race.asian | 0 | −8.18% | 5.81E-04 |
| 60 | morphMRI_WORMS_cartilage.MF | 0 | 6.79% | 0.001337 |
| 28 | PROMs_IPAQ.categorical | 1 | 6.96% | 0.002840 |
| 36 | morphMRI_WORMS_meniscusLes.bodyMED | 0 | 6.03% | 0.003500 |
| 7 | demographic_race.white/caucasian | 0 | 7.15% | 0.003585 |
| 61 | morphMRI_WORMS_cartilage.LF | 0 | 5.24% | 0.004725 |
| 7 | demographic_race.white/caucasian | 1 | −6.64% | 0.006429 |
| 37 | morphMRI_WORMS_meniscusLes.PHMED | 0 | 6.54% | 0.007321 |
| 23 | PROMs_Womac.stifness | 100 | 6.37% | 0.008294 |
| 47 | morphMRI_WORMS_meniscusTot.MED | 0 | 5.72% | 0.017170 |
| 21 | PROMs_Koos.QOL | 100 | 4.92% | 0.021869 |
| 10 | Xray_KL | 3 | −3.57% | 0.024024 |
| 16 | PROMs_Marx.sum | 9 | 2.19% | 0.026122 |
| 20 | PROMs_Koos.sport | 85 | −2.52% | 0.027823 |
| 37 | morphMRI_WORMS_meniscusLes.PHMED | 3 | −2.52% | 0.027823 |
| 28 | PROMs_IPAQ.categorical | 2 | −5.11% | 0.030478 |
| 69 | morphMRI_WORMS_BMEL.LT | 0 | 3.32% | 0.032345 |
| 18 | PROMs_Koos.symtoms | 89.29 | −2.92% | 0.033614 |
| 40 | morphMRI_WORMS_meniscusLes.PHLAT | 0 | 4.79% | 0.034102 |
| 62 | morphMRI_WORMS_cartilage.MT | 0 | 3.47% | 0.037707 |
| 18 | PROMs_Koos.symtoms | 100 | 3.99% | 0.039162 |
| 10 | Xray_KL | 0 | 4.69% | 0.040054 |
| 21 | PROMs_Koos.QOL | 93.75 | −2.27% | 0.040304 |
| 47 | morphMRI_WORMS_meniscusTot.MED | 4 | −2.27% | 0.040304 |
| 23 | PROMs_Womac.stifness | 75 | −3.76% | 0.042801 |
| 57 | morphMRI_WORMS_cartilagetype.tfjOA | 3 | −3.76% | 0.042801 |
| 49 | morphMRI_WORMS_ligament.ACL | 0 | 3.91% | 0.043402 |
| 5 | demographic_gender | 2:male | 4.65% | 0.044364 |
| 68 | morphMRI_WORMS_BMEL.MT | 0 | 2.67% | 0.046153 |
Overall variables dictionary is included as Supplementary Material.
To accomplish the second aim of this study, the MRI and biomechanics network was then colored by the progression variable (Fig. 8). Subjects who showed cartilage lesion progression (n = 29) were distributed in both the main subnetworks; however, we observed a group of subjects belonging to the progression subcohort within subnetwork 1 concentrated in a specific location of the topological subnetwork 1 (subnetwork 1a, dashed circle in Fig. 8). While no demographics or KL differences were observed between the subjects in subnetwork 1a and the rest of the subnetwork 1 at the time of the first visit, composite metric R2-R1ρ in the lateral tibia, T2 relaxation time in articular layer of the lateral tibia, and T2 relaxation time in the posterior lateral tibia subcompartments were observed to be different (KS P = 0.02, 0.035, 0.044, respectively), generating the hypothesis of R2-R1ρ as a possible early predictor of cartilage lesions progression. The analysis of the categorical variable shows that the progressors in subnetwork 1 were reported significantly lower (worse) baseline KOOS sport subscores (hypergeometric P = 0.012) and a higher score for effusion category measured by WORMS (hypergeometric P = 0.027).
FIGURE 8.
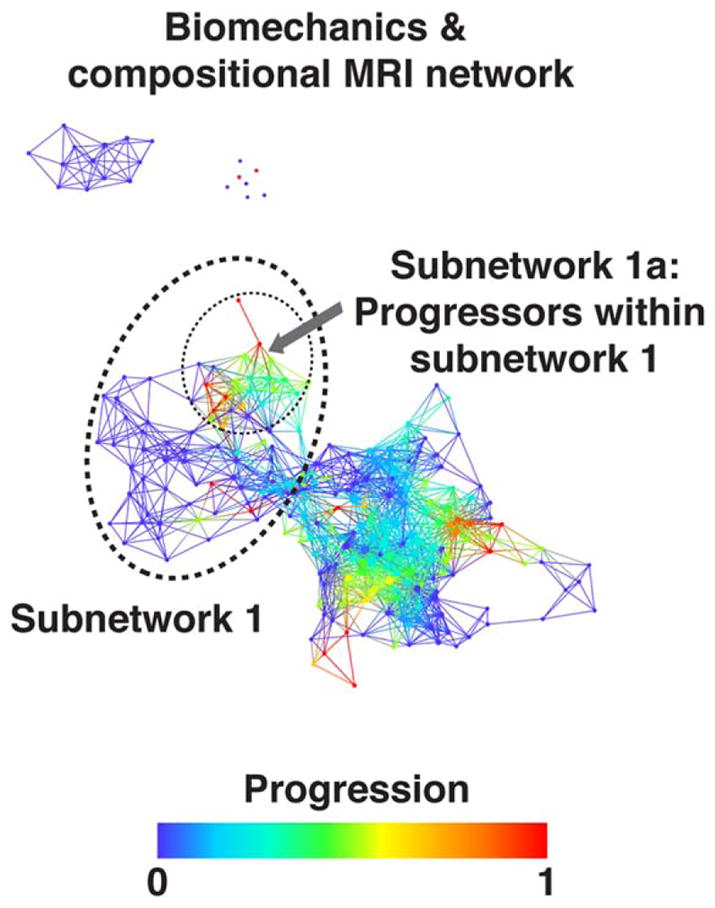
Progression cohort identified within the combined biomechanics and compositional MRI network. Combined network of biomechanics and compositional MRI colored by osteoarthritis progression defined by change in cartilage lesion WORMS subscore. Even though the progression variable is binary, each node describes a cluster of subjects and therefore intermediate shades represent the proportion of “progressors” within the subcohort. Within the less sever osteoarthritis subpopulation (subnetwork 1) the progressors are marked (dashed circle, subnetwork 1a) and statistically compared to the remaining subjects within subnetwork 1.
To confirm the hypothesis that R2-R1ρ variables are a possible predictor of cartilage lesion progression, we then performed a logistic regression considering just the subjects belonging to subnetwork 1 and assigning the progression and nonprogression group membership computed using WORMS.
R2-R1ρ in the tibia was confirmed to be different between progression and nonprogression cohorts in subnetwork 1. In particular, the strongest predictors were observed in the medial compartment. (R2-R1ρ MT progression cohort in subnetwork 1: 0.0172 ± 0.005 msec−1; R2-R1ρ MT nonprogression cohort in subnetwork 1: 0.025 ± 0.008 msec−1 P = 0.0069.) Using this feature alone to perform progression vs. nonprogression binary classification we obtained an AUC: 83.8% (Fig. 7B).
This analysis suggests R2-R1ρ as one of the possible predictors of cartilage lesion progression in just one of the two subpopulations identified by the multidimensional analysis approach, highlighting the value of using data-driven TDA-based grouping.
Discussion
This work, utilizing state of the art imaging, gait analysis, and machine-learning tools, attempts to set up a multidimensional platform for improving OA outcome prediction and patient substratification.
OA, being a polygenic, multifactorial, and complex disease, characterized by several phenotypes, seems the perfect candidate for multidimensional approaches and precision medicine.29 However, in order to accomplish this ambitious task multifactorial data-integration from diverse assessments spanning morphological, biochemical, and biomechanical features are required. This work attempts to meet the existing gap in multidimensional data analysis for precision medicine in OA, which has been considered an unsolved challenge.30
Machine-learning approaches, as the one applied in the present study, coupled with the power of compositional MRI and gait analysis techniques, open new possibilities for large-scale data integration, and multidimensional visualization to compare individual patients in a multidimensional manner. This approach overcomes the inherent limitations of single-variable analysis and represents a step towards OA precision medicine. By extracting fundamental shapes (patterns) in high-dimensional data, TDA provides visualization that have the potential of suggesting novel insights about the data, identifying meaningful subpopulations.28
While TDA has shown promising results in several fields, exploring low-density states in biomolecular folding pathways,31 phenotyping breast cancer28 and fragile X syndrome, 32 and neurotrauma,27 as a feasible strategy for feature discovery in multimodal data streams, there are no previous reports using this technique to study OA. The present study is the first example of TDA applied in the context of OA, providing large-scale integration of compositional imaging and skeletal biomechanics.
Extracting patterns in the OA syndromic space via shape-based data analysis was possible due to the three key ideas on which TDA is based: 1) coordinate-free description, 2) invariance to small deformation, and 3) compactness.28 Coordinate-free description permits the generalizability of the insights extracted from the shape of complex data. Topological constructions do not depend on the coordinate system chosen, but only on the distance function chosen to describe the similarity of two data points (patients) in the syndromic feature space. The second principle of invariance to small deformation guarantees robustness to noise while the third, compactness, allows complex data to be represented in a simple way. Topology uses finite representations of shapes, which means identifying a shape using a finite combinatorial object.
The compactness of the TDA description allowed us to visualize the OA syndromic space including biomechanical and compositional MRI data simultaneously. The analysis revealed a novel partition of OA patient subpopulations, never explored before, and that clearly showed the complex interaction between joint biomechanical and biochemical composition of the articular cartilage. A clear presence of two distinct patient subpopulations was observed in our dataset, mainly characterized by prolongation in relaxation times. Despite significant differences in KL grading observed between the two main subpopulations, the data-driven clustering obtained with TDA proposes a new phenotyping of these subjects that only partially overlaps with the radiographic-based or symptom-based classic disease status classification, but it is instead characterized by a strong cartilage compositional signature. T2 relaxation times were observed as strong predictors of the subpopulation division.
But most important, this subgrouping was essential in the identification of predictors of cartilage lesion progression. R2-R1ρ and T2 in the articular layer lateral tibia were observed as predictors of the cartilage lesion progression in subjects within subnetwork 1. This suggests separate progression pathways of the identified subnetworks and proposes the composite R2-R1ρ as a possible early biomarker of cartilage degeneration. Specifically, the differences between progression and nonprogression cohorts were observed in the superficial layer of the cartilage. These results confirm previous observations that showed early cartilage compositional changed just in the superficial layer before radiographic OA onset.33
While both T1ρ and T2 are recognized as valuable non-invasive methods for detecting cartilage compositional changes in OA subjects, the sensitivity of these parameters for detecting early-stage biochemical changes have been criticized due to experimental parameter-dependency and effects of different field strengths on relaxation times.34–36 Measuring relaxation times at different locking fields negates this frequency dependency, a phenomenon known as dispersion.34,36–38 Dispersion studies point to proton-to-proton exchange as the predominating factor mediating T1ρ dispersion, while temperature and pH influence proton exchange rate.37,39
Further analysis, on larger longitudinal datasets, are needed to confirm the results of this pilot study. Cross-validations and evaluation of the prediction performance on a separate test set are also needed to confirm our observations. In the current study, all the quantitate data was collected for all three timepoints, but a complete analysis was performed just for the baseline timepoint, the analysis of the longitudinal variation of the topology, and observing the migration of specific subnetworks could be of interest, and it is definitely in our future plan. While this study had the goal of generating new hypotheses on possible OA imaging biomarkers, designs more specifically focused on the evaluation of the combined metric R2-R1ρ as a possible predictor of cartilage lesion progression need to be performed to confirm the observations from this study, which at this stage are just preliminary. Nevertheless, this analysis provides proof-of-concept of the potential derived by the allied use of compositional MRI and multidimensional data analysis to understand pathogenesis, natural history, and predicting disease onset and progression in OA. However, it needs to be acknowledged that the unsupervised nature of the technique allows it to be applied just as a multidimensional visualization tool for hypothesis generation and not to build prediction models. By scaling on a larger sample size and longer follow ups, it would be feasible to apply supervised learning approaches to improve prediction ability and select relevant features. On the other hand, attacking a problem as complex as OA with an unsupervised technique has the potential to reveal completely unexpected patterns and latent information, finding answers to questions we have not thought to ask.
In conclusion, we have set up a pipeline and performed an initial multidimensional data integration and analysis needed to characterize OA as a multicompartment joint degenerative disease. The discovered multidimensional patterns may lead to a better understanding of the pathogenesis and natural history, may help in developing progression and prediction models, identifying modifiable risk factors, and may potentially help in prevention and early interventional studies in the future.
Through the multidimensional integration of biomechanical and compositional MRI variables, we were able to identify imaging biomarkers able to predict disease progression. Specifically, we demonstrated a possible usage of the combined compositional metric R2-R1ρ as an early predictor of cartilage lesion progression in subjects with and without radiographic signs of OA.
Supplementary Material
Acknowledgments
Contract grant sponsor: Craig H. Neilsen Foundation; contract grant numbers: R01NS067092 (to J.H. and A.R.F.), R01NS088475 (to A.R.F.); Contract grant sponsor: Wings for Life (to A.R.F.); contract grant numbers: P50 AR060752 (to S.M.), R01 AR062370 (to R.S.), R01AR046905 (to S.M.); Contract grant sponsor: National Institute of Arthritis and Musculoskeletal and Skin Diseases, National Institutes of Health, USA (NIH-NIAMS). This content is solely the responsibility of the authors and does not necessarily reflect the views of the NIH-NIAMS.
Footnotes
Additional Supporting Information may be found in the online version of this article.
References
- 1.Lawrence RC, Felson DT, Helmick CG, et al. Estimates of the prevalence of arthritis and other rheumatic conditions in the United States. Part II. Arthritis Rheum. 2008;58:26–35. doi: 10.1002/art.23176. [DOI] [PMC free article] [PubMed] [Google Scholar]
- 2.Guccione AA, Felson DT, Anderson JJ, et al. The effects of specific medical conditions on the functional limitations of elders in the Framingham Study. Am J Public Health. 1994;84:351–358. doi: 10.2105/ajph.84.3.351. [DOI] [PMC free article] [PubMed] [Google Scholar]
- 3.Helmick CG, Felson DT, Lawrence RC, et al. Estimates of the prevalence of arthritis and other rheumatic conditions in the United States. Part I. Arthritis Rheum. 2008;58:15–25. doi: 10.1002/art.23177. [DOI] [PubMed] [Google Scholar]
- 4.Joseph GB, Hou SW, Nardo L, et al. MRI findings associated with development of incident knee pain over 48 months: data from the osteoarthritis initiative. Skeletal Radiol. 2016;45:653–660. doi: 10.1007/s00256-016-2343-5. [DOI] [PMC free article] [PubMed] [Google Scholar]
- 5.Peterfy CG, Guermazi A, Zaim S, et al. Whole-organ magnetic resonance imaging score (WORMS) of the knee in osteoarthritis. Osteoarthritis Cartilage. 2004;12:177–190. doi: 10.1016/j.joca.2003.11.003. [DOI] [PubMed] [Google Scholar]
- 6.Li X, Majumdar S. Quantitative MRI of articular cartilage and its clinical applications. J Magn Reson Imaging. 2013;38:991–1008. doi: 10.1002/jmri.24313. [DOI] [PMC free article] [PubMed] [Google Scholar]
- 7.Nieminen MT, Rieppo J, Toyras J, et al. T2 relaxation reveals spatial collagen architecture in articular cartilage: a comparative quantitative MRI and polarized light microscopic study. Magn Reson Med. 2001;46:487–493. doi: 10.1002/mrm.1218. [DOI] [PubMed] [Google Scholar]
- 8.Akella SV, Regatte RR, Wheaton AJ, Borthakur A, Reddy R. Reduction of residual dipolar interaction in cartilage by spin-lock technique. Magn Reson Med. 2004;52:1103–1109. doi: 10.1002/mrm.20241. [DOI] [PubMed] [Google Scholar]
- 9.Li X, Cheng J, Lin K, et al. Quantitative MRI using T1rho and T2 in human osteoarthritic cartilage specimens: correlation with biochemical measurements and histology. Magn Reson Imaging. 2011;29:324–334. doi: 10.1016/j.mri.2010.09.004. [DOI] [PMC free article] [PubMed] [Google Scholar]
- 10.Wang P, Block J, Gore JC. Chemical exchange in knee cartilage assessed by R1rho (1/T1rho) dispersion at 3T. Magn Reson Imaging. 2015;33:38–42. doi: 10.1016/j.mri.2014.07.008. [DOI] [PMC free article] [PubMed] [Google Scholar]
- 11.Russell C, Pedoia V, Majumdar S Consortium A-A. Composite metric R2-R1rho (1/T2–1/T1rho) as a potential MR imaging biomarker associated with changes in pain after ACL reconstruction: A six-month follow-up. J Orthop Res. 2016 doi: 10.1002/jor.23400. Epub ahead of print. [DOI] [PMC free article] [PubMed] [Google Scholar]
- 12.Felson DT. Osteoarthritis as a disease of mechanics. Osteoarthritis Cartilage. 2013;21:10–15. doi: 10.1016/j.joca.2012.09.012. [DOI] [PMC free article] [PubMed] [Google Scholar]
- 13.Roos EM, Roos HP, Lohmander LS, Ekdahl C, Beynnon BD. Knee injury and osteoarthritis outcome score (KOOS)—development of a self-administered outcome measure. J Orthop Sports Phys Ther. 1998;28:88–96. doi: 10.2519/jospt.1998.28.2.88. [DOI] [PubMed] [Google Scholar]
- 14.Ackerman I. Western Ontario and McMaster Universities osteoarthritis index (WOMAC) Aust J Physiother. 2009;55:213. doi: 10.1016/s0004-9514(09)70088-1. [DOI] [PubMed] [Google Scholar]
- 15.Marx RG, Stump TJ, Jones EC, Wickiewicz TL, Warren RF. Development and evaluation of an activity rating scale for disorders of the knee. Am J Sports Med. 2001;29:213–218. doi: 10.1177/03635465010290021601. [DOI] [PubMed] [Google Scholar]
- 16.Kellgren JH, Lawrence JS. Radiological assessment of osteo-arthrosis. Ann Rheum Dis. 1957;16:494–502. doi: 10.1136/ard.16.4.494. [DOI] [PMC free article] [PubMed] [Google Scholar]
- 17.Emrani PS, Katz JN, Kessler CL, et al. Joint space narrowing and Kellgren-Lawrence progression in knee osteoarthritis: an analytic literature synthesis. Osteoarthritis Cartilage. 2008;16:873–882. doi: 10.1016/j.joca.2007.12.004. [DOI] [PMC free article] [PubMed] [Google Scholar]
- 18.Bergink AP, Uitterlinden AG, Van Leeuwen JP, et al. Bone mineral density and vertebral fracture history are associated with incident and progressive radiographic knee osteoarthritis in elderly men and women: the Rotterdam Study. Bone. 2005;37:446–456. doi: 10.1016/j.bone.2005.05.001. [DOI] [PubMed] [Google Scholar]
- 19.Harris PA, Taylor R, Thielke R, Payne J, Gonzalez N, Conde JG. Research electronic data capture (REDCap)—a metadata-driven methodology and workflow process for providing translational research informatics support. J Biomed Inform. 2009;42:377–381. doi: 10.1016/j.jbi.2008.08.010. [DOI] [PMC free article] [PubMed] [Google Scholar]
- 20.Bucknor MD, Nardo L, Joseph GB, et al. Association of cartilage degeneration with four year weight gain—3T MRI data from the Osteoarthritis Initiative. Osteoarthritis Cartilage. 2015;23:525–531. doi: 10.1016/j.joca.2014.10.013. [DOI] [PMC free article] [PubMed] [Google Scholar]
- 21.Li X, Wyatt C, Rivoire J, et al. Simultaneous acquisition of T1rho and T2 quantification in knee cartilage: repeatability and diurnal variation. J Magn Reson Imaging. 2014;39:1287–1293. doi: 10.1002/jmri.24253. [DOI] [PMC free article] [PubMed] [Google Scholar]
- 22.Carballido-Gamio J, Bauer J, Lee KY, Krause S, Majumdar S. Combined image processing techniques for characterization of MRI cartilage of the knee. Conf Proc IEEE Eng Med Biol Soc. 2005;3:3043–3046. doi: 10.1109/IEMBS.2005.1617116. [DOI] [PubMed] [Google Scholar]
- 23.Carballido-Gamio J, Bauer JS, Stahl R, et al. Inter-subject comparison of MRI knee cartilage thickness. Med Image Anal. 2008;12:120–135. doi: 10.1016/j.media.2007.08.002. [DOI] [PMC free article] [PubMed] [Google Scholar]
- 24.Li X, Pedoia V, Kumar D, et al. Cartilage T1rho and T2 relaxation times: longitudinal reproducibility and variations using different coils, MR systems and sites. Osteoarthritis Cartilage. 2015;23:2214–2223. doi: 10.1016/j.joca.2015.07.006. [DOI] [PMC free article] [PubMed] [Google Scholar]
- 25.Souza RB, Kumar D, Calixto N, et al. Response of knee cartilage T1rho and T2 relaxation times to in vivo mechanical loading in individuals with and without knee osteoarthritis. Osteoarthritis Cartilage. 2014;22:1367–1376. doi: 10.1016/j.joca.2014.04.017. [DOI] [PMC free article] [PubMed] [Google Scholar]
- 26.Pedoia V, Li X, Su F, Calixto N, Majumdar S. Fully automatic analysis of the knee articular cartilage T1rho relaxation time using voxel-based relaxometry. J Magn Reson Imaging. 2016;43:970–980. doi: 10.1002/jmri.25065. [DOI] [PMC free article] [PubMed] [Google Scholar]
- 27.Nielson JL, Paquette J, Liu AW, et al. Topological data analysis for discovery in preclinical spinal cord injury and traumatic brain injury. Nat Commun. 2015;6:8581. doi: 10.1038/ncomms9581. [DOI] [PMC free article] [PubMed] [Google Scholar]
- 28.Lum PY, Singh G, Lehman A, et al. Extracting insights from the shape of complex data using topology. Sci Rep. 2013;3:1236. doi: 10.1038/srep01236. [DOI] [PMC free article] [PubMed] [Google Scholar]
- 29.Veillette C, Jurisica I. Springer, editor. Osteoarthritis. New York: Springer; 2015. Precision medicine for osteoarthritis; pp. 257–270. [Google Scholar]
- 30.Ren GM, Krawetz R. Applying computation biology and “big data” to develop multiplex diagnostics for complex chronic diseases such as osteoarthritis. Biomarkers. 2015;20:533–539. doi: 10.3109/1354750X.2015.1105499. [DOI] [PMC free article] [PubMed] [Google Scholar]
- 31.Yao Y, Sun J, Huang X, et al. Topological methods for exploring low-density states in biomolecular folding pathways. J Chem Phys. 2009;130:144115. doi: 10.1063/1.3103496. [DOI] [PMC free article] [PubMed] [Google Scholar]
- 32.Romano D, Nicolau M, Quintin EM, et al. Topological methods reveal high and low functioning neuro-phenotypes within fragile X syndrome. Hum Brain Mapp. 2014;35:4904–4915. doi: 10.1002/hbm.22521. [DOI] [PMC free article] [PubMed] [Google Scholar]
- 33.Liebl H, Joseph G, Nevitt MC, et al. Early T2 changes predict onset of radiographic knee osteoarthritis: data from the osteoarthritis initiative. Ann Rheum Dis. 2015;74:1353–1359. doi: 10.1136/annrheumdis-2013-204157. [DOI] [PMC free article] [PubMed] [Google Scholar]
- 34.Wang PBJ, Gore JC. Chemical exchange in knee cartilage assessed by R1rho (1/T1rho) dispersion at 3 T. J Magn Reson Imaging. 2015;33:38–42. doi: 10.1016/j.mri.2014.07.008. [DOI] [PMC free article] [PubMed] [Google Scholar]
- 35.Li XHE, Ma CB, Link TM, Newitt DC, Majumdar S. In vivo 3T spiral imaging based multi-slice t1rho mapping of knee cartilage in osteoarthritis. Magn Reson Med. 2005;54:929–936. doi: 10.1002/mrm.20609. [DOI] [PubMed] [Google Scholar]
- 36.Cobb JGXJ, Gore JC. Contributions of chemical and diffusive exchange to T1rho dispersion. Magn Reson Med. 2013;69:1357–1366. doi: 10.1002/mrm.24379. [DOI] [PMC free article] [PubMed] [Google Scholar]
- 37.Cobb JGXJ, Gore JC. Contributions of chemical exchange to T1rho dispersion in a tissue model. Magn Reson Med. 2011;66:1563–1571. doi: 10.1002/mrm.22947. [DOI] [PMC free article] [PubMed] [Google Scholar]
- 38.Borthakur AME, Niyogi S, Witschey W, Kneeland JB, Reddy R. Sodium and T1rho MRI for molecular and diagnostic imaging of articular cartilage. NMR Biomed. 2006;19:781–821. doi: 10.1002/nbm.1102. [DOI] [PMC free article] [PubMed] [Google Scholar]
- 39.Spear JTGJ. New insights into rotating frame relaxation at high field. NMR Biomed. 2016 doi: 10.1002/nbm.3490. Epub ahead of print. [DOI] [PMC free article] [PubMed] [Google Scholar]
Associated Data
This section collects any data citations, data availability statements, or supplementary materials included in this article.


