Abstract
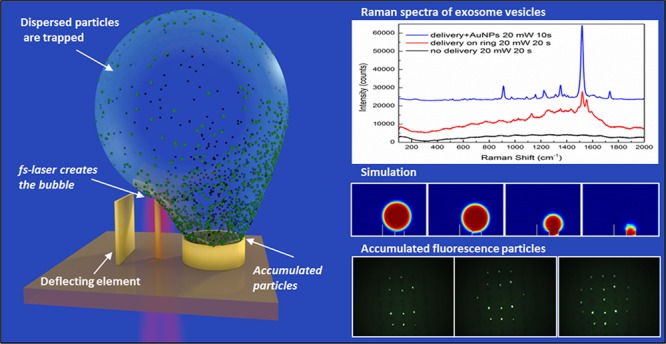
The possibility of investigating small amounts of molecules, moieties, or nano-objects dispersed in solution constitutes a central step for various application areas in which high sensitivity is necessary. Here, we show that the rapid expansion of a water bubble can act as a fast-moving net for molecules or nano-objects, collecting the floating objects in the surrounding medium in a range up to 100 μm. Thanks to an engineered 3D patterning of the substrate, the collapse of the bubble could be guided toward a designed area of the surface with micrometric precision. Thus, a locally confined high density of particles is obtained, ready for evaluation by most optical/spectroscopic detection schemes. One of the main relevant strengths of the long-range capture and delivery method is the ability to increase, by a few orders of magnitude, the local density of particles with no changes in their physiological environment. The bubble is generated by an ultrafast IR laser pulse train focused on a resonant plasmonic antenna; due to the excitation process, the technique is trustworthy and applicable to biological samples. We have tested the reliabilities of the process by concentrating highly dispersed fluorescence molecules and fluorescent beads. Lastly, as an ultimate test, we have applied the bubble clustering method on nanosized exosome vesicles dispersed in water; due to the clustering effect, we were able to effectively perform Raman spectroscopy on specimens that were otherwise extremely difficult to measure.
Keywords: microbubbles, plasmonic, diffusion limit, nanostructures, membrane vesicles, drug delivery
The possibility of investigating small amounts of molecules, moieties, or nano-objects dispersed in solution constitutes a key point for several fields in which high sensitivity is necessary, such as biodynamics, environmental and pollution control, and early diagnostics in medicine. One of the most common difficulties is related to the diffusion limit that affects nanostructured sensors working in solution. Namely, when dealing with nanostructured devices with small areas, the average time necessary to detect an event increases exponentially as the solute concentration decreases. In this regard, several techniques aiming at processing highly diluted samples down to the single-molecule limit were developed. Despite the wide range of available approaches,1−4 the investigation of biomolecules5 or nanosized objects in their physiological conditions is still an open issue.
A clear example of the current limitations is given by the difficulties in managing and analyzing extracellular membrane vesicles (EVs).6 EVs captured the attention of biologists during recent decades as key components of intercellular communication. Almost all types of cells release a variety of vesicles in the extracellular milieu or in the culture medium, characterized by different compositions, sizes, and intracellular origins. Exosomes, a subset of EVs derived from blood or other biological fluids, have been proposed as diagnostic and/or prognostic tools for specific pathological conditions.6−11 The difficulties in processing these kinds of biological materials are related to their very small size, which is below the current detection limit of flow cytometry. Furthermore, they show rapid degradation when physiological conditions are not maintained. Microfluidic systems and lab-on-chip devices may provide significant advances in this direction, and recently, different methods based on optofluidics and bubble generations12 were proposed to improve the detection of analyte in solution. Additionally, a pioneering method for the long-range and rapid transport of individual nano-objects based on electrothermoplasmonic nanotweezers2 was recently described.
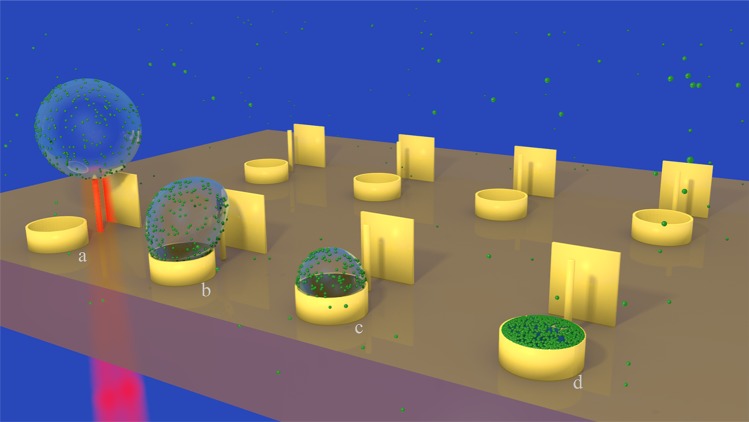
In this work, we show that bubbles generated in water by laser excitation of three-dimensional plasmonic nanoantennas enable the long-range capture of molecules dispersed in solution and their delivery toward a predefined area of micrometric size. Therefore, it is possible to overcome the diffusion limit without compromising the physiological environment; the concept is sketched in Figure 1. A vertical plasmonic nanoantenna in a liquid environment is illuminated with a short laser pulse to generate gas bubbles, whose fast expansion promotes the capture of surrounding molecules. Being detached from the sample surface, the generated bubble is almost free to move. The presence of a vertical panel in proximity to the antenna prevents the bubble from following random kinetic pathways, thus pushing it into the basket on the other side with a success rate very close to 100%. In the final step, the bubble collapses and deposits the molecules into the target (Supporting Information Video SI). In the first part of the work, we investigate the proposed method by using small fluorescent molecules and nanobeads. In the second part, we show that EVs can be accumulated in micrometric areas and then investigated without compromising the physiological analysis environment (i.e., salt concentration, pH, temperature). We used fluorescence microscopy and Raman scattering as investigation methods; however, we note that the delivery and clustering protocol can be easily integrated with most optical/spectroscopic detection schemes.
Figure 1.
Sketch shows the 3D nanostructured sample with the antennas, deflecting panels (boards) and target sites (baskets). The main steps of the collapsing bubble dynamics are also schematically shown, from left to right, by the first line of structures: (a) bubble generation by the laser pulses, (b) asymmetry in the collapsing process, (c) final collapse of the bubble, and (d) target site filled by nanoparticles and analytes ready for the tests.
Results and Discussion
The generation of bubbles in liquid is a complex topic that has been widely investigated in the literature.13−15 Bubbles could be generated by a large variety of methods, spanning from laser irradiation16−18 with pulsed sources19−21 to syringe inflation22 and others. Among them, laser irradiation of plasmonic structures is a topic of great interest because it allows one to localize cavitation phenomena on nanosized areas, thus not affecting the overall temperature of the studied system.23−25 Usually, cavitation can be induced by local heating following the resonant absorption of excitation wavelength by nanoparticles,26−29 but this approach often leads to melting and damage of the structures.30,31 Literature also reports examples of localized plasma generation by the scattered near-field in off-resonance nanoparticles, which was exploited to create vapor bubbles around particles.23−25,32 In this method, laser pulses in the near-infrared region are focused, from the back side, on a vertical plasmonic antenna (Figure 1) (gold, 4 μm high, 200 nm diameter), thus producing a tightly confined and enhanced electromagnetic field at the antenna’s tip. For fabrication details of the structures used in the experiments, see our previous works.33,34 If the electromagnetic field exceeds a given threshold, electrons are ejected from the antenna to the surrounding medium, where they are accelerated by the plasmonic field through a process called pondermotive acceleration.23 Electrons can gain further kinetic energy through inverse bremsstrahlung and are involved in elastic and inelastic collisions with water molecules, leading to energy transfer and ionization phenomena. If the electron density overcomes the optical breakdown threshold, this process results in plasma formation. Then, a strong energy transfer from the plasma to the water occurs, resulting in the generation of a pressure wave and eventually of a cavitation bubble. This process does not affect the local temperature of the surrounding water as the plasma is strongly confined on the tip of the antenna but also does not impact the temperature of the gold lattice because the gold substrate provides an efficient relaxation pathway even in resonant absorption conditions.24 The control of the parameters, such as laser power, pulse train duration, and size of the irradiation spot, allowed us fine control of the bubble generation. By using this approach, we were able to create bubbles that expanded up to 100 μm in less than 100 ms. In the following experiments, we excited the antennas at λ = 850 nm, with rather long pulse trains (from 15 to 100 ms) made of 200 fs pulses, with a 78 MHz repetition rate and an average power from 30 to 150 mW (pulse energy equal to 0.4–2 nJ). The laser was focused on the back side of the nanoantenna through a 60× objective (Olympus LUCPLAN FLN 60×, NA = 0.7), which produces a laser spot with a beam waist of approximately 700 nm hwhm, as estimated by a Gaussian fit of the intensity profile, while imaging was operated by means of a 60× water immersion objective (Olympus LMPLANFL, NA = 1.0). A sketch of the optical setup can be found in the Supporting Information.
We note that, under the conditions used in our experiments, the proprieties of biomolecules suspended in solution are not affected by the laser pulses or by the bubble generation. In fact, the irradiation of the laser from the back side of the membrane avoids any direct interaction with the solution. Moreover, the absorption of the NIR laser (λ = 850 nm) for biological species can be considered negligible. We would also emphasize that the mechanism exploited to generate bubbles is not a thermal process; therefore, no significant change in the temperature of the surrounding liquid is required.
Trapping of Objects during the Rapid Expansion of the Bubble
It is well-known that colloidal particles and bacterial strains are inclined to be trapped at the air–water interface,35,36 and this interfacial accumulation of colloidal particles is the result of surface tension effects. In fact, as long as two liquids or fluids are immiscible, it is thermodynamically favorable for a particle to adsorb to the interface, regardless whether the particle is hydrophobic or hydrophilic (although hydrophobic interactions promote the accumulation).35,36 Once a particle has been located at an infinitely large interface, the energy gain is
where rp is the radius of particle, γwa is the interfacial energy of the water–air interface, and θ is the wetting angle of the particle. Considering values rp ≈ 2 × 10⁻⁷ m, γwa = 73 × 10–3 N/m, and θ ≈ 85° (as for polystyrene beads), the equation results in ΔE ≈ 9 × 10–15 J, which is much larger than the room temperature energy.
The drag force, Fd = 6πηrpv (with η being dynamic viscosity and v being relative velocity between liquid and particle), cannot contribute to the detachment of the particles, and it actually contributes to the accumulation. In fact, in the case of a static interface, the accumulation of particles is mainly a diffusion-limited process, depending on the particle arrival rate at the interface. In the presence of a moving interface, as in the case of a rapidly expanding bubble investigated in this article, the particle arrival rate is strongly increased (for more details, see the Supporting Information).
The effectiveness in trapping particles increases with the bubble expansion velocity vf and particle radius rp. In fact, considering an expanding bubble with radius R(t) = vft and a particle (subject solely to the drag force) at position r with respect to the center of the bubble, the equation of motion for the particle can be written as
If r(0) is the particle position at t = 0, evaluation of the dynamics in the proximity of expanding
bubble
leads to the simple condition for particle trapping,  (see the Supporting Information for more details). Particles below rtrap are reached and trapped, whereas above rtrap, they are accelerated to vf.
Substrate Engineering
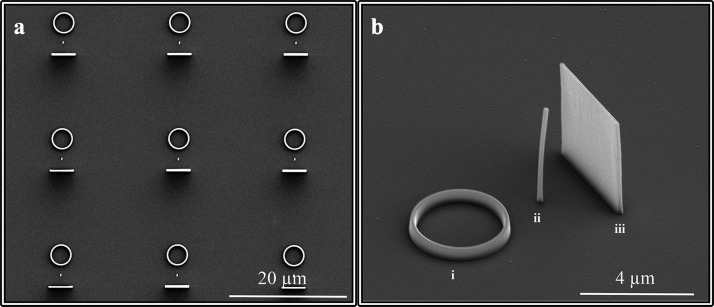
The design of the structure was obtained according to 2D analytical simulations (see Supporting Information for the details) that helped with the optimization of the mechanism of bubble formation and the control of its trajectory during the collapse. We found that a combination of three elements represents an optimal configuration for this purpose: (i) an out-of-plane plasmonic antenna, which is essential for generating a bubble detached from the sample surface and thus free to move, (ii) a docking/deflecting panel, and (iii) a circular area (resembling a basket) that creates a well-defined target zone where the analytes are delivered and detected and may represent the active area of a nanosensor. An SEM (scanning electron microscopy) image of the structure is shown in Figure 2.
Figure 2.
SEM images of the sample. (a) Overview of several units. (b) High-resolution image shows the basic nanostructure unit made up of three elements: (i) the circular target-testing zone (basket), (ii) plasmonic resonant antenna, and (iii) deflecting panel (board).
One of the innovative features of our configuration is represented by the presence of the vertical panel, which plays two important roles in two different temporal steps. In the first step, when the bubble is generated, the panel prevents the bubble from leaving the surface by creating a docking point as bubbles have the tendency to stick to the surfaces of solids due to the surface tension force, Fs. In the second step, when the bubble begins to collapse, the panel acts as an obstacle that cannot be overcome by the bubble. Therefore, it moves toward the basket where the available area is larger (the larger the contact area, the larger the force) and delivers the particles collected over the course of expansion.
Single- and Multishot Patterns
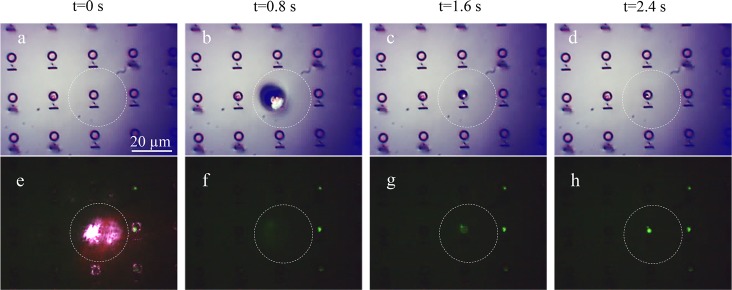
Extensive tests were carried out with both fluorescent beads (Fluoresbrite YG carboxylate microspheres, diameters = 500 and 200 nm) and molecules (green fluorescent protein, GFP) in order to determine the size range of the effect. In all cases, the dynamics of the bubbles clearly follows the behavior previously described. An example is reported in Figure 3, in which a time-lapse sequence of a period of 2 s is shown: the dynamic of the process (generation and collapse of the bubble) is clearly visible in the top panel, whereas in the bottom panel, the formation of the fluorescent spot is shown. The Supporting Information Video S2 shows the complete process.
Figure 3.
Time-lapse sequence of the generation and collapse of the bubble. The time-lapse sequence covers the period of 2.4 s. Images have been collected by a microscopy setup with a white light (a–d) and fluorescence illumination (e–h). Picture (e) shows the laser beam transmitted by the substrate during the laser shot. Imaging the bubble at the exact maximum expansion is not possible with our equipment. The dashed circle in the pictures shows the estimated maximum radius of the bubble, on the order of 30 μm. All images have the same scale.
The process can be tuned to obtain bubbles with diameters of up to 100 μm or more, thus introducing the possibility of collecting particles from a large volume. On the other hand, the overall time of the process depends on the bubble size because small bubbles (1–4 μm) collapse in a few seconds, whereas bubbles with diameters up to 100 μm need time periods on the order of 1–2 min to collapse.37
The technique is robust and reliable, and the laser pulses can be targeted on several structures with a high grade of reproducibility in order to compute a desired pattern, as shown in Figure 4. The video of the whole process (Video S3) is included in the Supporting Information.
Figure 4.
Localized fluorescence emission in the dye (GFP) spectral range has been collected by a fluorescence microscopy setup. (a–d) Efficiency of the method to perfectly address the final collapsing site and reconstruct a desired pattern point-by-point.
It should be highlighted that one of the main critical points of our tests was the alignment of the laser spot on the antenna because the overall process strongly depends on the energy transferred from the laser source to the bubble gases. In our tests, a manual micromanipulator was used to move the sample below the laser beam; therefore, we observed some variation in bubble size due to the nonperfect alignment of the laser with the antenna. To investigate this point, we checked the reproducibility of the collecting effect by iterated laser pulse trains without moving the sample. Remarkably, several consecutive pulse trains can be applied to the same area without noticing any difference in the effect (Supporting Information Video S2), confirming the solidity of the technique. We noticed that bubbles could also be generated by using electrical pulses. The latter method does not suffer the mentioned limitations and may be used as an alternative to the more expensive laser apparatus.
We tested the proposed approach on EV exosomes, which are specimens that are difficult to manage38 and whose study represents a hot topic in biology,39 as they are carriers of molecules from the parental cells and play an important role in cancer diagnostics and prognosis. Therefore, the development of methods for characterizing exosomes and exosome-based assays is critical. Detection and molecular profiling of exosomes are technically challenging and often require extensive sample purification and labeling. We have applied the bubble clustering as a way to concentrate samples in order to perform Raman spectroscopy on EVs. Raman spectroscopy is a label-free, powerful technique with high sensitivity to the molecular species. The main drawback of the Raman spectroscopy is the low cross section of molecular vibration, resulting in an extremely low signal from a diluted sample. The combination of the two techniques, bubble clustering and Raman spectroscopy, thus offers a very powerful method to overcome the drawbacks of the Raman spectroscopy technique.
EVs were collected from cell culture conditioned medium through standard procedure based on ultracentrifugation and were dispersed in phosphate-buffered saline. Raw 264.7 cells release an EV mean diameter of 62 ± 28 nm (standard deviation), as shown by dynamic light scattering (DLS) analysis (see Methods).
The substrate with plasmonic antennas was placed on a Petri dish with a bottom glass window, and 100 μL of vesicle/PBS solution was dropped over the substrate. Bubbles were generated by 150 ms long femtosecond laser pulse trains at an average power of 150 mW. After the delivery process, samples were investigated directly in liquid using a Raman microspectrometer (Renishaw InVia) equipped with a 60× Olympus WI objective (numerical aperture NA = 1.0) and a thermoelectrically cooled CCD as detector (working temperature −60 °C). Spectra were collected by exciting the system at λ = 632.8 nm with a He/Ne laser; the laser power was varied between 10 and 20 mW with integration times of 10 to 20 s.
Figure 5 compares the results of the Raman measurements performed on the sample before (black line in the figure) and after (red line in the figure) the collapse of the bubble. No feature can be recognized in the first case due to the low concentration of vesicles in solution, which is one of the reasons for the difficulties in their identification and detection in physiological media. We would like to note that it was not possible to detect any Raman signal from the solution in these conditions, even at increased laser power and integration time. On the other hand, after the collapse of the bubble, the spectra collected on the spot left from the aggregated vesicles clearly showed the presence of several vibrational modes of the EVs, resembling in shape and position the modes obtained from dried pellets of exosomes.25,40 The comparison with data from the literature has shown the presence of signals of lipids and proteins, which are mainly related to the external membrane of the vesicles. As no peaks attributed to the intravesicular environment have been found, it is possible to suggest that exosomes are still intact after the concentration treatment. For sake of clarity, a complete attribution of the peaks is reported with the table in Figure 5.
Figure 5.
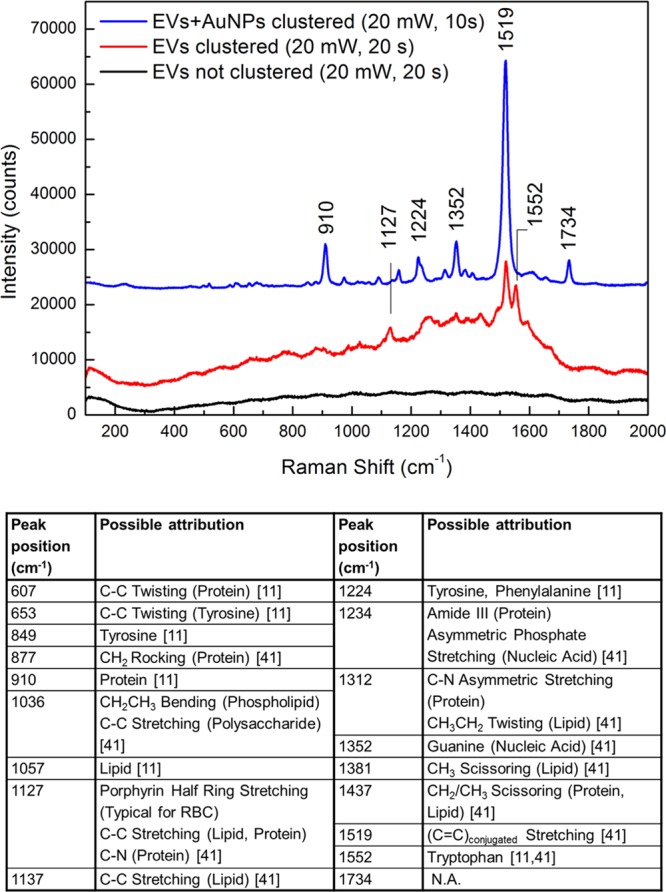
Raman spectra of exosome vesicles collected inside the basket before the bubble generation (black line), after bubble collapse (red line), and after bubble collapse with the addition of gold nanoparticles in solution (blue line). In the inset, the laser power and the integration time for each measure are reported. Below, the table reports the complete attribution of the peaks, from refs (11) and (41).
A simple but efficient and expedient method for further improving the Raman signal amplitude is the addition of gold nanoparticles to the solution. Indeed, single nanoparticles dispersed in solution do not offer consistent field amplification useful for surface-enhanced Raman scattering. However, when accumulated into the basket together with the vesicles, they provide a strong enhancement of the plasmonic field. With this aim, we added a small aliquot (20 μL) of a dispersion of gold nanoparticles to the vesicle solution, and we repeated the experiment. As shown in Figure 5 (blue line in the figure), the addition of nanoparticles leads to an increase in the intensity of Raman signals of 8–10 times with respect to the one obtained from vesicles alone.
Conclusions
In this work, we have demonstrated a method for the controlled capture and delivery of nanoscale objects by means of gas bubbles in a liquid environment. The approach exploits a three-dimensional nanostructured substrate with plasmonic and fluid-dynamic functionalities able to ensure the formation of a laser-induced cavitation bubble and its controlled collapse on a targeted site with a sub-10 μm spatial precision. The use of an NIR femtosecond pulsed source minimizes the presence of thermal effects, thus allowing the application of the technique with biological samples where the physiological conditions should be preserved during analysis. We successfully tested the method on EVs that are well-known to be hard to handle.
Methods
Isolation of Extracellular Vesicles from Raw 264.7 cells
Raw 264.7 cells were grown in a culture flask with a complete medium (DMEM + 10% fetal bovine serum + penicillin/streptomycin). At 70% confluence, cells were washed with phosphate-buffered saline (PBS) and then incubated with 5(6)-carboxyfluorescein diacetate N-succinimidyl ester (CFSE), 100 nM in PBS9 at 37 °C, 5% CO2. After a 30 min incubation, cells were washed three times with PBS and incubated with serum-free culture medium. After 24 h, the conditioned medium was collected and centrifuged at 4 °C at 300g for 3 min to remove dead cells and at 2000g for 20 min to remove cell debris and then ultracentrifuged at 100 000g for 70 min. The EV pellet was resuspended in 100 μL of PBS and stored at 4 °C until use.
Characterization of Raw 264.7 Derived EV
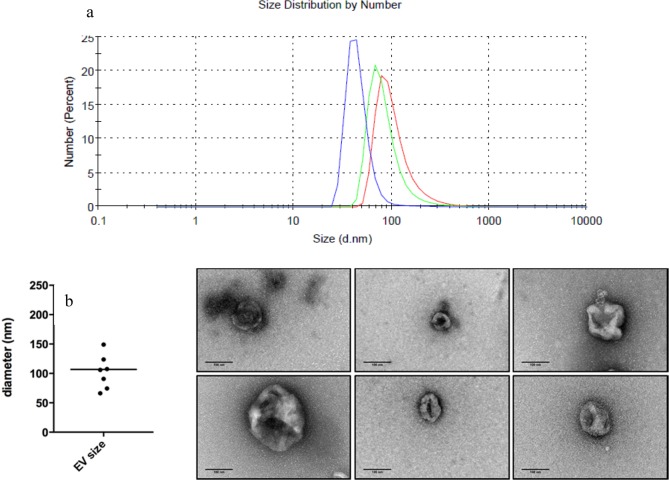
The size of the Raw 264.7 derived EV was estimated through DLS and confirmed by transmission electron microscopy (TEM). For the DLS, EV samples were resuspended in 300 μL of PBS and analyzed with the Zetasizer software (Malvern) in the DLS instrument (Malvern). For the TEM analysis, EVs in PBS were fixed with 2% paraformaldehyde and 1% glutaraldehyde final concentrations. Five microliter drops of fixed EV were adsorbed at activated carbon-coated copper grids (EMS) for 10 min, stained with 2% uranyl acetate, and dried by blotting the excess contrasting solution on filter paper (Whatman). After 3 min of air drying, the EVs were imaged using a JEOL JEM 1011 TEM equipped with CCD Gatan Orius camera, at 100 kV. Raw 264.7 cells release EVs of 61.68 ± 27.90 nm, labeled as the mean diameter ± standard deviation (SD), as shown by DLS analysis (Figure 6).
Figure 6.
(a) Size of the Raw 264.7 derived EV was estimated through DLS and (b) confirmed by TEM.
Acknowledgments
The research leading to these results has received funding from the European Research Council under the European Union’s Seventh Framework Program (FP/2007-2013) and ERC Grant Agreement No. 616213, CoG: Neuro-Plasmonics, and under the Horizon 2020 Program, FET-Open: PROSEQO, Grant Agreement No. 687089.
Supporting Information Available
The Supporting Information is available free of charge on the ACS Publications website at DOI: 10.1021/acsnano.7b07893.
Video S1 (AVI)
Video S2 (AVI)
Video S3 (AVI)
Video S4 (AVI)
Animation (AVI)
Sketches of the optical setups for the white light and fluorescence images; theoretical description of the trapping process during the rapid expansion of the bubble; analytical simulation of the bubble dynamics, results, and details (PDF)
Author Contributions
F.T. and G.C.M. should be considered as co-first authors. F.T. and G.C.M. conceived the work. F.T., G.C.M., and M.D. designed the optical–electrical setup and the optical measurements. F.T., G.C.M., and R.C. designed the devices. G.C.M. fabricated the devices and did the SEM imaging. L.L. optimized and cultured the exosomes vesicles. F.T., G.C.M., and M.D. performed experiments. R.C. performed the model and the analytical simulation. F.D.A. supervised the whole project. All authors contributed to the manuscript preparation.
The authors declare no competing financial interest.
After this paper was published April 3, 2018, an animation was added to the Supporting Information. The corrected version was reposted April 5, 2018.
Supplementary Material
References
- Sreekanth K. V.; Alapan Y.; Elkabbash M.; Ilker E.; Hinczewski M.; Gurkan U. A.; De Luca A.; Strangi G. Extreme Sensitivity Biosensing Platform Based on Hyperbolic Metamaterials. Nat. Mater. 2016, 15, 621–627. 10.1038/nmat4609. [DOI] [PMC free article] [PubMed] [Google Scholar]
- Ndukaife J. C.; Kildishev A. V.; Nnanna A. G. A.; Shalaev V. M.; Wereley S. T.; Boltasseva A. Long-range and Rapid Transport of Individual Nano-Objects by a Hybrid Electrothermoplasmonic Nanotweezer. Nat. Nanotechnol. 2015, 11, 53–59. 10.1038/nnano.2015.248. [DOI] [PubMed] [Google Scholar]
- De Angelis F.; Gentile F.; Mecarini F.; Das G.; Moretti M.; Candeloro P.; Coluccio M. L.; Cojoc G.; Accardo A.; Liberale C.; Zaccaria R. P.; Perozziello G.; Tirinato L.; Toma A.; Cuda G.; Cingolani R.; Di Fabrizio E. Breaking the Diffusion Limit with Super-Hydrophobic Delivery of Molecules to Plasmonic Nanofocusing SERS Structures. Nat. Nat. Photonics 2011, 5, 682–687. 10.1038/nphoton.2011.222. [DOI] [Google Scholar]
- Taylor A. B.; Zijlstra P. Single-Molecule Plasmon Sensing: Current Status and Future Prospects. ACS Sens. 2017, 2, 1103. 10.1021/acssensors.7b00382. [DOI] [PMC free article] [PubMed] [Google Scholar]
- Sheehan P. E.; Whitman L. J. Detection Limits for Nanoscale Biosensors. Nano Lett. 2005, 5, 803–807. 10.1021/nl050298x. [DOI] [PubMed] [Google Scholar]
- Im H.; Shao H.; Park Y. Il; Peterson V. M.; Castro C. M.; Weissleder R.; Lee H. Label-Free Detection and Molecular Profiling of Exosomes with a Nano-Plasmonic Sensor. Nat. Biotechnol. 2014, 32, 490–495. 10.1038/nbt.2886. [DOI] [PMC free article] [PubMed] [Google Scholar]
- Shao H.; Chung J.; Balaj L.; Charest A.; Bigner D. D.; Carter B. S.; Hochberg F. H.; Breakefield X. O.; Weissleder R.; Lee H. Protein Typing of Circulating Microvesicles Allows Real-Time Monitoring of Glioblastoma Therapy. Nat. Med. 2012, 18, 1835–1840. 10.1038/nm.2994. [DOI] [PMC free article] [PubMed] [Google Scholar]
- Shao H.; Chung J.; Lee K.; Balaj L.; Min C.; Carter B. S.; Hochberg F. H.; Breakefield X. O.; Lee H.; Weissleder R. Chip-Based Analysis of Exosomal mRNA Mediating Drug Resistance in Glioblastoma. Nat. Commun. 2015, 6 (May), 6999. 10.1038/ncomms7999. [DOI] [PMC free article] [PubMed] [Google Scholar]
- Pospichalova V.; Svoboda J.; Dave Z.; Kotrbova A.; Kaiser K.; Klemova D.; Ilkovics L.; Hampl A.; Crha I.; Jandakova E.; Minar L.; Weinberger W.; Bryja V. Simplified Protocol for Flow Cytometry Analysis of Fluorescently Labeled Exosomes and Microvesicles Using Dedicated Flow Cytometer. J. Extracell. Vesicles 2015, 4, 25530. 10.3402/jev.v4.25530. [DOI] [PMC free article] [PubMed] [Google Scholar]
- Di Noto G.; Bugatti A.; Zendrini A.; Mazzoldi E. L.; Montanelli A.; Caimi L.; Rusnati M.; Ricotta D.; Bergese P. Merging Colloidal Nanoplasmonics and Surface Plasmon Resonance Spectroscopy for Enhanced pro Fi Ling of Multiple Myeloma-Derived Exosomes. Biosens. Bioelectron. 2016, 77, 518–524. 10.1016/j.bios.2015.09.061. [DOI] [PubMed] [Google Scholar]
- Lee C.; Carney R. P.; Hazari S.; Smith Z. J.; Knudson A.; Robertson C. S.; Lam S.; Wachsmann-hogiu S. 3D Plasmonic Nanobowl Platform for the Study of Exosomes in Solution Changwon. Nanoscale 2015, 7, 9290–9297. 10.1039/C5NR01333J. [DOI] [PubMed] [Google Scholar]
- Wang M.; Zhao C.; Miao X.; Zhao Y.; Rufo J. Plasmofluidics: Merging Light and Fluids at the Micro-/Nanoscale. Small 2015, 11, 4423–4444. 10.1002/smll.201500970. [DOI] [PMC free article] [PubMed] [Google Scholar]
- Wang Y.; Zaytsev M. E.; Le The H.; Eijkel J. C. T.; Zandvliet H. J. W.; Zhang X.; Lohse D. Vapor and Gas-Bubble Growth Dynamics around Laser-Irradiated, Water-Immersed Plasmonic Nanoparticles. ACS Nano 2017, 11, 2045–2051. 10.1021/acsnano.6b08229. [DOI] [PubMed] [Google Scholar]
- Zhang X.; Chan D. Y. C.; Wang D.; Maeda N. Stability of Interfacial Nanobubbles. Langmuir 2013, 29, 1017–1023. 10.1021/la303837c. [DOI] [PubMed] [Google Scholar]
- Wang L.; Wang X.; Wang L.; Hu J.; Wang C. L.; Zhao B.; Zhang X.; Tai R.; He M.; Chen L.; Zhang L. Formation of Surface Nanobubbles on Nanostructured Substrates. Nanoscale 2017, 9, 1078–1086. 10.1039/C6NR06844H. [DOI] [PubMed] [Google Scholar]
- Lin L.; Peng X.; Mao Z.; Li W.; Yogeesh M. N.; Rajeeva B. B.; Perillo E. P.; Dunn A. K.; Akinwande D.; Zheng Y. Bubble-Pen Lithography. Nano Lett. 2016, 16, 701–708. 10.1021/acs.nanolett.5b04524. [DOI] [PMC free article] [PubMed] [Google Scholar]
- Zhao C.; Xie Y.; Mao Z.; Zhao Y.; Rufo J.; Yang S.; Guo F.; Mai J. D.; Huang T. J. Theory and Experiment on Particle Trapping and Manipulation via Optothermally Generated Bubbles. Lab Chip 2014, 14, 384–391. 10.1039/C3LC50748C. [DOI] [PMC free article] [PubMed] [Google Scholar]
- Baffou G.; Polleux J.; Rigneault H.; Monneret S. Super-Heating and Micro-Bubble Generation around Plasmonic Nanoparticles under Cw Illumination. J. Phys. Chem. C 2014, 118, 4890–4898. 10.1021/jp411519k. [DOI] [Google Scholar]
- Fang Z.; Zhen Y. R.; Neumann O.; Polman A.; García De Abajo F. J.; Nordlander P.; Halas N. J. Evolution of Light-Induced Vapor Generation at a Liquid-Immersed Metallic Nanoparticle. Nano Lett. 2013, 13, 1736. 10.1021/nl4003238. [DOI] [PMC free article] [PubMed] [Google Scholar]
- Schaffer C.; Nishimura N.; Glezer E.; Kim A.; Mazur E. Dynamics of Femtosecond Laser-Induced Breakdown in Water from Femtoseconds to Microseconds. Opt. Opt. Express 2002, 10, 196–203. 10.1364/OE.10.000196. [DOI] [PubMed] [Google Scholar]
- Lukianova-hleb E. Y.; Volkov A. N.; Lapotko D. O. Laser Pulse Duration Is Critical For the Generation of Plasmonic Nanobubbles. Langmuir 2014, 30, 7425–7434. 10.1021/la5015362. [DOI] [PMC free article] [PubMed] [Google Scholar]
- Vinay T. V.; Banuprasad T. N.; George S. D.; Varghese S.; Varanakkottu S. N. Additive-Free Tunable Transport and Assembly of Floating Objects at Water-Air Interface Using Bubble-Mediated Capillary Forces. Adv. Mater. Interfaces 2017, 4, 1601231. 10.1002/admi.201601231. [DOI] [Google Scholar]
- Zilio P.; Dipalo M.; Tantussi F.; Messina G. C.; De Angelis F. Hot Electrons in Water : Injection and Ponderomotive Acceleration by Means of Plasmonic Nanoelectrodes. Light: Sci. Appl. 2017, 6, e17002. 10.1038/lsa.2017.2. [DOI] [PMC free article] [PubMed] [Google Scholar]
- Messina G. C.; Dipalo M.; La Rocca R.; Zilio P.; Caprettini V.; Proietti Zaccaria R.; Toma A.; Tantussi F.; Berdondini L.; De Angelis F. Spatially, Temporally, and Quantitatively Controlled Delivery of Broad Range of Molecules into Selected Cells through Plasmonic Nanotubes. Adv. Mater. 2015, 27, 7145–7149. 10.1002/adma.201503252. [DOI] [PubMed] [Google Scholar]
- Dipalo M.; Amin H.; Lovato L.; Moia F.; Caprettini V.; Messina G. C.; Tantussi F.; Berdondini L.; De Angelis F. De. Intracellular and Extracellular Recording of Spontaneous Action Potentials in Mammalian Neurons and Cardiac Cells with 3D Plasmonic Nanoelectrodes. Nano Lett. 2017, 17, 3932. 10.1021/acs.nanolett.7b01523. [DOI] [PMC free article] [PubMed] [Google Scholar]
- Kotaidis V.; Dahmen C.; Von Plessen G.; Springer F.; Plech A. Excitation of Nanoscale Vapor Bubbles at the Surface of Gold Nanoparticles in Water. J. Chem. Phys. 2006, 124, 184702. 10.1063/1.2187476. [DOI] [PubMed] [Google Scholar]
- Siems A.; Weber S. A. L.; Boneberg J.; Plech A. Thermodynamics of Nanosecond Nanobubble Formation at Laser-Excited Metal Nanoparticles. New J. Phys. 2011, 13, 043018. 10.1088/1367-2630/13/4/043018. [DOI] [Google Scholar]
- Lombard J.; Biben T.; Merabia S. Nanobubbles around Plasmonic Nanoparticles: Thermodynamic Analysis. Phys. Rev. E - Stat. Nonlinear, Soft Matter Phys. 2015, 91, 043007. 10.1103/PhysRevE.91.043007. [DOI] [PubMed] [Google Scholar]
- Katayama T.; Setoura K.; Werner D.; Miyasaka H.; Hashimoto S. Picosecond-to-Nanosecond Dynamics of Plasmonic Nanobubbles from Pump–Probe Spectral Measurements of Aqueous Colloidal Gold Nanoparticles. Langmuir 2014, 30, 9504. 10.1021/la500663x. [DOI] [PubMed] [Google Scholar]
- De Giacomo A.; Dell’Aglio M.; Santagata A.; Gaudiuso R.; De Pascale O.; Wagener P.; Messina G. C.; Compagnini G.; Barcikowski S. Cavitation Dynamics of Laser Ablation of Bulk and Wire-Shaped Metals in Water during Nanoparticles Production. Phys. Chem. Chem. Phys. 2013, 15, 3083–3092. 10.1039/C2CP42649H. [DOI] [PubMed] [Google Scholar]
- Messina G. C.; Sinatra M. G.; Bonanni V.; Brescia R.; Alabastri A.; Pineider F.; Campo G.; Sangregorio C.; Li-Destri G.; Sfuncia G.; Marletta G.; Condorelli M.; Proietti Zaccaria R.; De Angelis F.; Compagnini G. Tuning the Composition of Alloy Nanoparticles Through Laser Mixing: The Role of Surface Plasmon Resonance. J. Phys. Chem. C 2016, 120, 12810–12818. 10.1021/acs.jpcc.6b01465. [DOI] [Google Scholar]
- Boulais É.; Lachaine R.; Meunier M. Plasma Mediated off-Resonance Plasmonic Enhanced Ultrafast Laser-Induced Nanocavitation. Nano Lett. 2012, 12, 4763–4769. 10.1021/nl302200w. [DOI] [PubMed] [Google Scholar]
- De Angelis F.; Malerba M.; Patrini M.; Miele E.; Das G.; Toma A.; Zaccaria R. P.; Di Fabrizio E. 3D Hollow Nanostructures as Building Blocks for Multifunctional Plasmonics. Nano Lett. 2013, 13, 3553–3558. 10.1021/nl401100x. [DOI] [PubMed] [Google Scholar]
- Malerba M.; Alabastri A.; Miele E.; Zilio P.; Patrini M.; Bajoni D.; Messina G. C.; Dipalo M.; Toma A.; Proietti Zaccaria R.; De Angelis F. 3D Vertical Nanostructures for Enhanced Infrared Plasmonics. Sci. Rep. 2015, 5, 1–8. 10.1038/srep16436. [DOI] [PMC free article] [PubMed] [Google Scholar]
- Schäfer A.; Harms H.; Zehnder A. J. B. Bacterial Accumulation at the Air - Water Interface. Environ. Sci. Technol. 1998, 32, 3704–3712. 10.1021/es980191u. [DOI] [Google Scholar]
- Hu J. W.; Han G.-B.; Ren B.; Sun S. G.; Tian Z. Q. Theoretical Consideration on Preparing Silver Particle Films by Adsorbing Nanoparticles from Bulk Colloids to an Air-Water Interface. Langmuir 2004, 20, 8831–8838. 10.1021/la049842s. [DOI] [PubMed] [Google Scholar]
- Baffou G.; Polleux J. Super-Heating and Micro-Bubble Generation around Plasmonic Nanoparticles under Cw Illumination. J. Phys. Chem. C 2014, 118, 4890–4898. 10.1021/jp411519k. [DOI] [Google Scholar]
- Prada I.; Amin L.; Furlan R.; Legname G.; Verderio C.; Cojoc D. A New Approach to Follow a Single Extracellular Vesicle-Cell Interaction Using Optical Tweezers. BioTechniques 2016, 60, 35–41. 10.2144/000114371. [DOI] [PubMed] [Google Scholar]
- EL Andaloussi S.; Mäger I.; Breakefield X. O.; Wood M. J. A. Extracellular Vesicles: Biology and Emerging Therapeutic Opportunities. Nat. Rev. Drug Discovery 2013, 12, 347–357. 10.1038/nrd3978. [DOI] [PubMed] [Google Scholar]
- Krafft C.; Wilhelm K.; Eremin A.; Nestel S.; von Bubnoff N.; Schultze-Seemann W.; Popp J.; Nazarenko I. A Specific Spectral Signature of Serum and Plasma-Derived Extracellular Vesicles for Cancer Screening. Nanomedicine 2017, 13, 835–841. 10.1016/j.nano.2016.11.016. [DOI] [PubMed] [Google Scholar]
- Stremersch S.; Marro M.; Pinchasik B.; Baatsen P.; Hendrix A.; De Smedt S. C.; Loza-alvarez P.; Skirtach A. G.; Raemdonck K.; Braeckmans K. Identification of Individual Exosome-Like Vesicles by Surface Enhanced Raman Spectroscopy. Small 2016, 12, 3292–3301. 10.1002/smll.201600393. [DOI] [PubMed] [Google Scholar]
Associated Data
This section collects any data citations, data availability statements, or supplementary materials included in this article.


