Abstract
[Co(dmgBF2)2(H2O)2] 1 (where dmgBF2 = difluoroboryldimethylglyoximato) was used to synthesize [Co(dmgBF2)2(H2O)(py)]·0.5(CH3)2CO 2 (where py = pyridine) in acetone. The formulation of complex 2 was confirmed by elemental analysis, high resolution MS, and various spectroscopic techniques. The complex [Co(dmgBF2)2(solv)(py)] (where solv = solvent) was readily formed in situ upon the addition of pyridine to complex 1. A spectrophotometric titration involving complex 1 and pyridine proved the formation of such a species, with formation constants, log K = 5.5, 5.1, 5.0, 4.4, and 3.1 in 2-butanone, dichloromethane, acetone, 1,2-difluorobenzene/acetone (4 : 1, v/v), and acetonitrile, respectively, at 20 °C. In strongly coordinating solvents, such as acetonitrile, the lower magnitude of K along with cyclic voltammetry, NMR, and UV-visible spectroscopic measurements indicated extensive dissociation of the axial pyridine. In strongly coordinating solvents, [Co(dmgBF2)2(solv)(py)] can only be distinguished from [Co(dmgBF2)2(solv)2] upon addition of an excess of pyridine, however, in weakly coordinating solvents the distinctions were apparent without the need for excess pyridine. The coordination of pyridine to the cobalt(II) centre diminished the peak current at the Epc value of the CoI/0 redox couple, which was indicative of the relative position of the reaction equilibrium. Herein we report the first experimental and theoretical 59Co NMR spectroscopic data for the formation of Co(I) species of reduced cobaloximes in the presence and absence of py (and its derivatives) in CD3CN. From spectroelectrochemical studies, it was found that pyridine coordination to a cobalt(I) metal centre is more favourable than coordination to a cobalt(II) metal centre as evident by the larger formation constant, log K = 4.6 versus 3.1, respectively, in acetonitrile at 20 °C. The electrosynthesis of hydrogen by complexes 1 and 2 in various solvents demonstrated the dramatic effects of the axial ligand and the solvent on the turnover number of the respective catalyst.
Introduction
The production and use of clean, renewable and high-energy-density sources are growing in demand to circumvent the use of fossil fuels, thus reducing the effects of carbon dioxide emissions and global warming. Hydrogen has been suggested as the leading candidate1–4 and its production through the reduction of water appears to be a convenient solution for long-term storage and accessibility. Traditionally, noble metals of the platinum group metal series have been employed as catalytic centres in hydrogen production;5–9 however, the high cost associated with these metals has led to searches for viable catalysts based on cheap and abundant first-row transition metals, such as nickel and cobalt.10–14 Cobaloximes essentially mimic the active centre of hydrogenases15,16 and are a promising class of compounds for the production of hydrogen in acidic media.17–19
In addition to cobaloximes,20–24 numerous cobalt-containing complexes exist for the catalytic reduction of protons to produce hydrogen. These include cobalt porphyrin derivatives,25 macrocyclic complexes of [14]diene-N426 and [14]tetraene-N427 (tetraazamacrocycles), imine/oximes,28 polypyridyl compounds,29–33 bis(iminopyridine),34 phosphine coordinated complexes,35 and dithiolene (dithiolate)-containing36 complexes (Fig. 1), however, cobaloximes still continue to generate a lot of interest due to their high activity towards electrocatalytic proton reduction.15,19,37–39
Fig. 1.
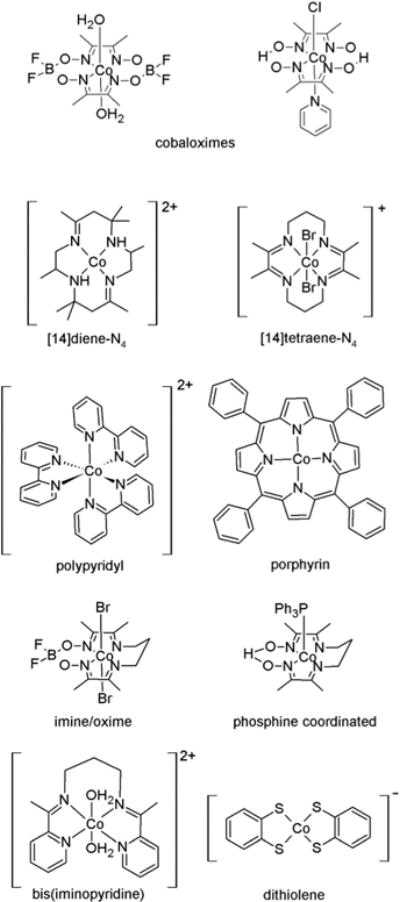
Examples of some cobalt-containing complexes employed in the electrocatalytic reduction of protons.
The most plausible route in the catalytic evolution of hydrogen involves the formation of a Co(I) species from either a Co(III) or Co(II) precursor.11,36 Recent studies have been geared towards studying the Co(I) intermediate through NMR spectroscopy,40 X-ray absorption spectroscopy (XAS),41 and high frequency electron paramagnetic resonance (HFEPR)42 techniques. Other studies19,36,37 have employed bridging binuclear systems to understand and enhance the catalyst performance for hydrogen production. For photocatalytic processes employing molecular systems with a pyridine-type linker from the photoactive centre to a cobaloxime catalytic centre,43–45 the effect of a bridging ligand in the axial position on the electron transfer relative to the cobaloxime alone in a particular solvent has not been studied for the BF2 capped cobaloxime species. In photocatalytic experiments, acid sources such as p-cyanoanilinium, anilinium, and triethylammonium cations were employed.28
Ligand dissociation is a common occurrence in catalytic processes. An understanding of the ligand dissociation and the electron transfer kinetics has been arrived at from radiolytic studies carried out on some cobalt(III) complexes, for example, [Co(dmgH)2(py)(Cl)] (where dmgH = dimethylglyoximato).29,46,47 Radiolytic and high-pressure kinetic studies of cobalt(III) compounds such as [Co(NH3)5(CH3)]2+ and [Co(phendione)2Cl2]Cl (where phendione = 1,10-phenanthroline-5,6-dione), directed towards the lability of the ligands on the resulting Co(II) species,48–50 and other studies involving Co(II)51 and Co(III)47,49 complexes bearing polypyridyl ligands such as [Co(pic)2(bpy)], [Co(bpy)3]3+, [Co(phen)3]3+, [Co(en)2(bpy)]3+, and [Co(en)2(phen)]3+, (where pic = 2-picolinato, bpy = 2,2′-bipyridine, phen = 1,10-phenanthroline, and en = ethylenediamine) show the formation of a ligand radical anion species, which decays by either protonation of the ligand,52,53 or by reduction of the metal centre via intramolecular electron transfer. Kumar and co-workers50 have attempted to distinguish between [CoI(dmgBF2)2(H2O)]− species and the pyridine coordinated species. In their work, radiolysis and chemical means of reduction in MeOH/H2O, were presented as evidence of the various oxidation states of cobalt. However, in their report, the effect of solvent on the coordination of pyridine to the Co(II) state was not investigated. In that study, they also showed that both the pyridine and chloride axial ligands dissociate from the Co(II) species of [Co(dmgH)2(py)(Cl)]. These studies are of interest, because the stability of the different oxidation states of the cobaloxime and its coordination sphere are believed to have a significant effect on its catalytic properties. In strongly coordinating solvents (as determined from solvent exchange rate constants54,55 for example), or in the presence of various nucleophiles, the axial ligands of the cobaloxime may be easily substituted,41,56 which is expected to influence the redox and substitution chemistries of the cobalt centre. Acetonitrile has proven to be a very convenient solvent for the electrocatalytic and photocatalytic studies of cobaloximes, however a study of the ability and influence of this solvent (and other coordinating solvents) to effectively compete with the complexation of the axial ligand has been neglected, and to the best of our knowledge, such a study has not been reported in the literature.
Various electrocatalytic studies on proton reduction using cobalt species11,15,27,34,37,40,57,58 have focused on the variation of the equatorial ligands. Substitution at the backbone of the equatorial glyoxime ligands significantly affects the electrochemical potentials of the CoII/I redox couple, and also affects the proton reduction electroactivity on the cyclic voltammetry time scale.59 Similar effects are observed when the hydrogen-bonding protons between the equatorial ligands are substituted with BF2.59,60 Cobaloximes of the type [Co(dmgH)2(L)Cl] (where L = a nitrogen-containing Lewis base such as pyridine and its derivatives) have been studied to explore the influence of the axial ligand on the electroactivity of the cobaloxime.39,59 However, in the case of the BF2 capped system [Co(dmgBF2) (solv)2] (where solv = a solvent molecule such as MeOH, H2O, etc.), the lability of the axial position of the Co(II) metal centre has resulted in an elusive species with pyridine in the axial position, and as such, this species has been primarily studied as a species generated in situ.22,61 Owing to this, there is a lack of data that correlates the electroactivity of the [Co(dmgBF2)2(solv)2] species to its [Co(dmgH)2(L)Cl] analogue with regards to an axial pyridine. These data are critical as one of the most practical approaches of transitioning cobaloximes to potentially useful applications involves coupling a cobalt(II) metal centre to a photosensitizer such a ruthenium(II) metal centre with the aid of a bridging ligand. In these systems, para-substituted pyridine linkers have been employed as important templates in the syntheses of photocatalytic systems reported for the reduction of protons to form hydrogen.44,62,63
For many years, we have been interested in the development of transition metal complexes that contain at least one cobalt metal centre,44,64–71 and also inorganic reaction mechanisms that involve electron transfer processes.64,65,72–74 Recently,44 we reported the synthesis, characterization, and photocatalytic studies of novel mixed-metal binuclear ruthenium(II)–cobalt(II) photocatalysts [Ru(pbt)2(L-pyr)Co(dmgBF2)2(H2O)](PF6)2 (where pbt = 2-(2′-pyridyl)benzothiazole, L-pyr = (4-pyridine) oxazolo[4,5-f ]phenanthroline), [Ru(Me2bpy)2(L-pyr)Co-(dmgBF2)2(OH2)](PF6)2 (where Me2bpy = 4,4′-dimethyl-2,2′-bipyridine), and [Ru(phen)2(L-pyr)Co(dmgBF2)2(OH2)](PF6)2 for hydrogen evolution in acidic acetonitrile. Photocatalytic studies carried out in acidified acetonitrile demonstrated constant hydrogen generation longer than a 42 hour period as detected by gas chromatography. Time resolved spectroscopic measurements on [Ru(pbt)2(L-pyr)Co(dmgBF2)2(H2O)](PF6)2, proved an intramolecular electron transfer from an excited Ru(II) metal centre to the Co(II) metal centre via the bridging L-pyr ligand. This resulted in the formation of a cobalt(I)-containing species that was essential for the production of H2 gas in the presence of H+ ions. Based on the fact that we are very interested in mechanistic studies on the role of the cobalt(I) metal centre during the course of the production of hydrogen in the solvent media, we have embarked upon a detailed study of the solution chemistry of Co(II) and Co(I) metal centres within cobaloximes to assist us in this effort. As such, this study reports the isolation and characterization of a new cobaloxime, complex 2 (Fig. 2) which contains the elusive pyridine in the axial position of the cobaloxime, together with electrochemical and spectroelectrochemical studies in both strongly and weakly coordinating solvents to assess the effect of solvent on the extent of coordination of the pyridine in the axial position to complex 1, and how this influences the cobaloxime’s reactivity in the production of hydrogen. We also wish to determine the extent and the effect of pyridine’s coordination on the Co(I) metal centre in the respective solution, with the aid of UV-visible, 11B, 19F, and 59Co NMR spectroscopies and density functional theory (DFT) calculations. Complex 2 serves a dual role in which it will allow for a(n) (indirect) comparison to the [Co(dmgH)2(L)Cl] species, and simultaneously act as a model for the para-substituted pyridine linkers employed in photocatalytic systems employing complex 1 as the catalytic site. This is a critical step to understand the electron transfer process and the stability of a pyridine–Co(I) species that is likely to be formed in reduced cobaloximes.
Fig. 2.
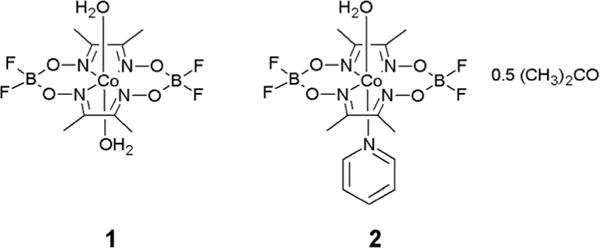
Structures of complexes [Co(dmgBF2)2(H2O)2] (complex 1) and [Co(dmgBF2)2(H2O)(py)]·0.5(CH3)2CO (complex 2).
Results and discussion
Characterizations and equilibrium studies
Complex 1 was reacted with 1.4 equivalents of pyridine in acetone to produce [Co(dmgBF2)2(H2O)(py)]·0.5(CH3)2CO 2 (see Scheme 1). The formulation of complex 2 is supported by the M+ parent ion observed in the High Resolution Mass Spectrum (HRMS), the elemental analysis, as well as the other spectroscopic characterizations (see ESI, Fig. S1–S4†). In the FTIR spectrum, there are distinct shifts (see ESI, Fig. S2†) in the CvN, N–O, and B–F stretching frequencies of complex 1 compared to complex 2, as well as two peaks at 690 and 758 cm−1 all consistent with the coordination of pyridine to the cobalt centre.75 Additionally, the magnetic moment μeff = 1.28 ± 0.02 B.M. for complex 2 (at ambient temperature) is consistent with low spin Co(II). Both complexes 1 and 2 are reasonably soluble in acetonitrile, acetone, butanone, but moderately soluble in water; while they are soluble at <0.1 mM in 1,2-difluorobenzene. [Co(dmgBF2)2(H2O)2] is known to have an enhanced solubility in acetone relative to alcohols.55 Acetone generally behaves as a polar weakly coordinating solvent, and this nature was evident from the synthetic protocol of complex 2, where the axial water molecule is retained in the solid as shown in the mass spectrum. The UV-visible spectra of both complexes in various solvents are given in the ESI (see Fig. S3 and S4†) and the molar extinction coefficients are shown in Table 1.
Scheme 1.
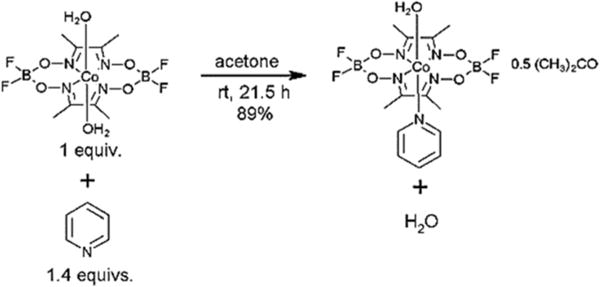
Synthesis of complex 2.
Table 1.
The absorption maxima (nm) and molar extinction coefficients (M−1 cm−1) of complexes 1 and 2
| Solvent | Complex | λ1 (10−3 ε) | λ2 (10−3 ε) | λ3 (10−2 ε) |
|---|---|---|---|---|
| Acetonitrile | 1 | 323 sh (2.5) | 425 (3.6) | 1162 (1.1) |
| Water | 1 | — | 455 (2.7) | — |
| Acetone | 1 | — | 446 (2.7) | 1294 (0.7) |
| 2-Butanone | 1 | — | 449 (2.9) | 1319 (0.6) |
| 1,2-Difluorobenzene : acetone (4 : 1, v/v) | 1 | — | 444 (2.7) | 1170 (1.3) |
| Acetonitrile | 2 | 323 sh (4.1) | 425 (4.8) | 1144 (1.5) |
| Water | 2 | — | 454 (3.2) | — |
| Acetone | 2 | — | 436 (2.8) | 1135 (2.7) |
| 2-Butanone | 2 | — | 431 (2.6) | 1131 (2.7) |
| 1,2-Difluorobenzene : acetone (4 : 1, v/v) | 2 | — | 420 (3.9) | 1138 (2.6) |
In the UV-visible portion of the spectrum, the band between 420 and 450 nm showed the most variation between the complexes. In weakly coordinating solvents (acetone, 2-butanone, etc.), this band is observed at ca. 450 nm for complex 1 and at ca. 430 nm for complex 2. For complex 2, the tail and the band which goes into the NIR region are also more pronounced. These changes can be interpreted as additional evidence for the coordination of pyridine to the Co(II) complex in the solution state. This band in the NIR region is characteristic of, and also confirmed, the low spin nature of the cobalt(II) metal centre in both species.44
The complex, [Co(dmgBF2)2(H2O)2] has a very rapid solvent exchange rate that is comparable to the hexasolvated high-spin Co(II) species.54,55 Thus, it is expected that the axial water ligand(s) are substituted with coordinating solvents. The pyridine coordinated species can also be generated in situ. In weakly coordinating solvents (see ESI, Fig. S5–S7†), the addition of pyridine to complex 1 caused a blue shift from 450 nm to 430 nm which coincides with the band observed in the ketone solutions of complex 2. In the NIR region, there was an increase in the intensity of the absorbance coupled with a blue shift in λmax in going from complex 1 to complex 2. In acetonitrile (see Fig. 3), this transformation is best observed in the NIR region as the changes in the UV region are masked by an excess of pyridine. In water (not shown), the changes in the UV-visible region of the spectrum of complex 1 upon the addition of pyridine are difficult to interpret. In an unbuffered environment, there is the possibility of deprotonating the axial water molecule at higher pH values (induced by the addition of pyridine). Additionally, it was observed that the complex interacts with all the buffer systems we have tried which limited our ability to interpret the changes at higher ratios of pyridine to complex. The poor solubility of the complexes in water prevents the acquisition of reasonable spectral data in the NIR region. The observations made in the non-aqueous solvents point to the formation of complex 2 from complex 1 in situ upon the addition of pyridine. Using these spectral transformations, the stoichiometry of the interaction between pyridine and complex 1 in acetonitrile (and other solvents) was determined from mole ratio plots (see ESI, Fig. S8–S17†) and was found to be 1 : 1 (eqn (1), where solv = solvent molecule) with up to five times excess pyridine.
| (1) |
Fig. 3.
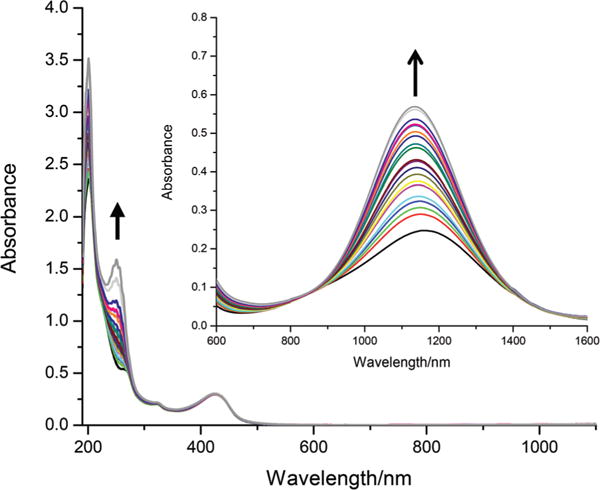
Spectrophotometric titration of complex 1 with pyridine in acetonitrile. [complex 1] = 0.1 mM, NIR region shown in inset ([complex 1] = 2 mM), path length = 1 cm. The arrow represents increasing [pyridine], see Table S1.†
From these data, the formation constant22,76 for the monopyridine species (complex 2) from complex 1 was determined (see Table 2 and the Experimental section for details on how these values were determined). In all the solvents explored, the mole ratio and log plots also indicate that the monopyridine species is the major species over the concentration range studied (see ESI Fig. S8–S17†). The stoichiometry and equilibrium constants are consistent with analogous systems reported by Nonaka and Hamada.22 In water, and other coordinating solvents, the equilibrium between [Co(dmgBF2)2(solv)2] or [Co(dmgH)2(solv)2] and pyridine (and analogous Lewis bases) has been found to be relatively small and the propensity to form a stoichiometry greater than 1 : 1 is even smaller.22,50,61 From the magnitude of the equilibrium constant in acetonitrile (1.3 × 10³ at 20 °C), it can be easily deduced that the dissociation of the pyridine from [Co(dmgBF2)2(CH3CN)(py)] is significant at 20 °C. This dissociation, which can occur with the pyridine linker systems employed in bridging binuclear systems, has been largely ignored in the interpretation of data presented in the literature. In the case of acetone and 2-butanone, there are much larger formation constants for the monopyridine complex (complex 2) compared to acetonitrile and represent suitable solvents for studying complex 2.
Table 2.
Formation constants for some pyridine coordinated Co(II) oxime complexes at 20 ± 1 °C
| Co(II) precursor | Solvent | log K1 | Ref. |
|---|---|---|---|
| [Co(dmgBF2)2(H2O)2] | 2-Butanone | 5.5 | This work |
| [Co(dmgBF2)2(H2O)2] | Acetone | 5.0 | This work |
| [Co(dmgBF2)2(H2O)2] | Dichloromethane | 5.1 | This work |
| [Co(dmgBF2)2(H2O)2] | 1,2-Difluorobenzene/acetone (4 : 1, v/v) | 4.4 | This work |
| [Co(dmgBF2)2(H2O)2] | Acetonitrile | 3.1 | This work |
| [Co(dmgBF2)2(H2O)2] | DMF | 2.3a | 22 |
| [Co(dmgH)2(H2O)2] | Methanol | 2.1 | 61 |
| [Co(dpgBF2)2(H2O)2] | DMF | 4.2a | 22 |
| [Co(dpgH)2(H2O)2] | DMF | 2.9a | 22 |
At 25 °C. dpgH = diphenylglyoximato. dpgBF2 = difluoroboryldimethylglyoximato.
Electrochemical and chemical reduction studies
In acetonitrile, on oxidatively or reductively initiated scans, the cyclic voltammograms of complexes 1 and 2 (Fig. 4) showed a quasi-reversible wave for the CoIII/II redox couple, reversible waves corresponding to the CoII/I redox couple,44 as well as quasi-reversible waves corresponding to the CoI/0 redox couple and the reduction of the ligand (most likely reduction of the CvN bonds). The behaviour (Scheme 2) of the cobalt(II) centre is comparable to what has been reported for complex 1 in the literature.27,77
Fig. 4.
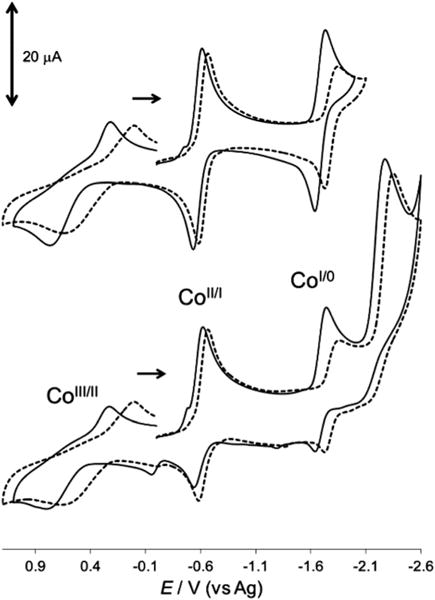
A comparison of the cyclic voltammograms of complexes 1 and 2 in acetonitrile on a glassy carbon working electrode versus Ag quasi-reference electrode. [complex 1] = 1.04 mM (solid lines) and [complex 2] = 1.02 mM (broken lines), supporting electrolyte = 0.10 M [nBu4N]ClO4, and scan rate = 100 mV s−1. The effect of the scan range on the shapes of cobalt peaks is shown above.
Scheme 2.
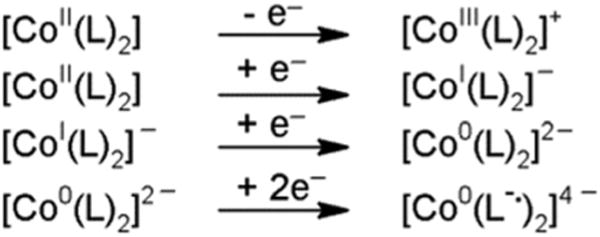
Summary of the redox behaviour in acetonitrile where L = dmgBF2. Solvent excluded for simplicity.
The equilibrium established in strongly coordinating solvents, as described above, between complex 1 and complex 2 results in the profile of the cyclic voltammograms of both species being very similar in acetonitrile as shown in Fig. 4. In acetone and 2-butanone where complex 2 has a much larger formation/stability constant, the cyclic voltammograms for complex 1 can be clearly distinguished from complex 2 via the absence of the cathodic peak in the region of the CoI/0 redox couple for complex 2 (as shown in Fig. 5a and S22†). The addition of five equivalences of pyridine to complex 1, in any of the solvents studied, as discussed above, shifts the equilibrium towards the monopyridine species (complex 2), and the CoI/0 redox couple is not observed. It is most likely that the suppression of this cathodic wave (see Fig. 5b) is related to the coordination of the pyridine to the Co(II), in which it affects the CoI/0 redox couple. The addition of sterically encumbering pyridines (2-methylpyridine and 2,6-dimethylpyridine) up to fifteen equivalences to an acetonitrile solution of complex 1 did not affect peak potentials in the cyclic voltammogram (see ESI, Fig. S26 and 27†). The inability of these sterically hindered substituted pyridines to coordinate was also observed for the [Co(dmgH)2(H2O)2] system,39 and indicated that the change(s) observed in the cyclic voltammogram of complex 1 in the presence of pyridine is not the result of Brønsted acid–base behaviour. On the other hand, the addition of 4-aminopyridine resulted in similar changes to what was observed with the addition of pyridine and further validates the use of cyclic voltammetry to assess the coordination of pyridine. Interestingly, in the weakly coordinating solvents, where the integrity of complex 2 is retained, the addition of an excess (five equivalences) of pyridine did not: (i) result in an enhancement of the peak currents, (ii) cause any shift in the peak potentials, or (iii) result in the appearance of any additional peaks in the cyclic or square wave voltammograms (not shown) of complex 2. This points to the dominance of the monopyridine species over these concentration ranges. The values of the reduction potentials are summarized in Table 3 for comparative purposes. To the best of our knowledge, this is the first time that a cobaloxime is being studied by cyclic voltammetry in either ketone solvents or 1,2-difluorobenzene. Similar to the UV-visible measurements, cyclic voltammetry is a valuable technique to illustrate the effect of the solvent coordinating ability on the extent of the pyridine substitution.
Fig. 5.
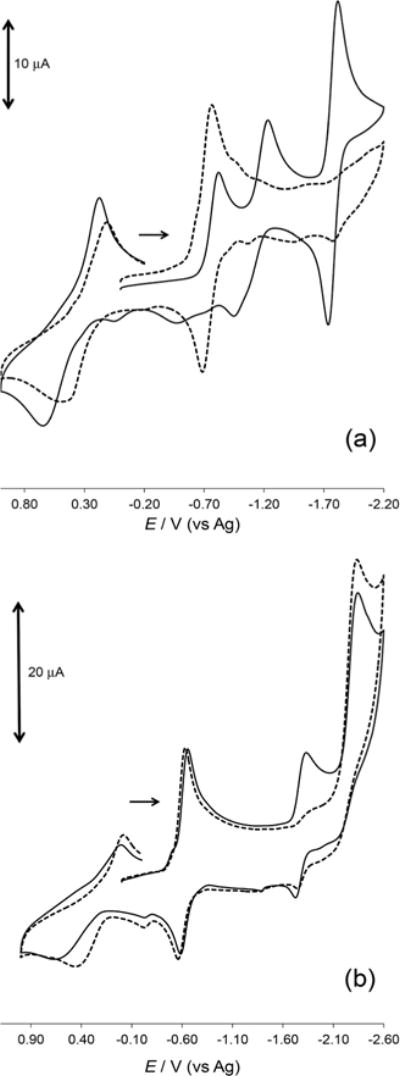
Cyclic voltammograms of complexes 1 and 2 on a glassy carbon working electrode versus Ag quasi-reference electrode, supporting electrolyte = 0.10 M [nBu4N]ClO4, and scan rate = 100 mV s−1. (a) In acetone, [complex 1] = 1.12 mM (solid lines) and [complex 2] = 1.04 mM (broken lines) and (b) in acetonitrile, [complex 2] = 1.02 mM (solid lines) and [complex 2] = 1.02 mM with 5.09 mM pyridine (broken lines).
Table 3.
The reduction potentials of complexes 1 and 2 at a glassy carbon working electrode versus Ag
| Entry | Species | Solvent | CoIII/II/V | CoII/I/V | CoI/0/V | dmgBF20/−/V |
|---|---|---|---|---|---|---|
| 1 | 1 | Acetonitrile | +0.70 | −0.58 | −1.69 | −2.21 |
| 2 | 2 | Acetonitrile | +0.60 | −0.63 | −1.77 | −2.30 |
| 3 | 2a | Acetonitrile | +0.46 | −0.60 | — | −2.30 |
| 4 | 1 | Acetone | +0.65 | −0.82 | −1.20 | −1.79 |
| 5 | 2 | Acetone | +0.50 | −0.73 | — | — |
| 6 | 1 | Waterb | +0.48 | −0.60 | −0.85 | — |
| 7 | 2 | Waterb | +0.31 | −0.50 | — | — |
| 8 | 1 | 2-Butanone | +0.88 | −0.58 | −0.99 | −1.58 |
| 9 | 2 | 2-Butanone | +0.64 | −0.66 | — | — |
| 10 | 1 | 1,2-Difluorobenzene/acetone (4 : 1, v/v) | +0.36 | −0.82 | −1.20 | −1.82 |
| 11 | 2 | 1,2-Difluorobenzene/acetone (4 : 1, v/v) | +0.38 | −0.80 | — | — |
In five times excess pyridine.
Values are versus AgCl/Ag. All the potentials quoted are determined from square wave voltammetry.
In acetonitrile where an excess of pyridine is added to force the formation of complex 2 (Table 3, entry 3), only the potentials for the cobalt couples are affected, but not the potential for the dmgBF2− ligand. Using the potential of the ligand as reference, it is fair to assume that the addition of the pyridine can affect the electrochemical properties of the cobalt(II) metal centre. In the other solvent systems, where complex 2 is stable without excess pyridine, similar conclusions can be deduced. Generally, the potential for the CoIII/II and CoII/I redox couples are shifted towards zero (versus Ag) in complex 2 compared to complex 1, and suggests that the addition of pyridine makes the complex more accessible to oxidation and reduction processes. From these findings, we have clearly shown that cyclic voltammetry can be used to qualitatively assess the coordination of pyridine to the Co(II) metal centre in the BF2 capped cobaloxime.
Pyridine is renowned for its electron donating ability and has been used to stabilize low oxidation states in pyridine-enhanced pre-catalyst preparation stabilization and initiation (PEPPSI) complexes.78–81 In water, the CoII/I redox couple illustrated a quasi-reversible behaviour for complex 1, but in the presence of excess pyridine the behaviour became reversible (ipa/ipc = 0.97, see ESI, Fig. S25 versus S21†). This behaviour in addition to the absence of the CoI/0 cathodic wave is quite intriguing, and is also observed in the ketone solvents. The transition of the cyclic voltammogram in going from complex 1 to complex 2 is consistent in all the solvents used here (in terms of the absence of CoI/0 redox couple in the cyclic voltammograms of complex 2). Repetitive cycling did not result in the appearance of any new peaks in the cyclic voltammograms of complex 2. It therefore appears that the coordination of the pyridine causes the reduction of CoI/0 couple to become more negative than the potential window of the solvent, and thus inaccessible. This we attribute to the electron donating ability of the pyridine. This nature allows for the use of cyclic voltammetry in qualitatively identifying the coordination of pyridine to complex 1.
It is unclear from the electrochemical studies if the pyridine has a dissociation/association equilibrium with the Co(I) metal centre as is established with the Co(II) state. Indeed, it has been suggested that the pyridine coordinates more strongly to the Co(I) metal centre than it does to the Co(II) metal centre in [Co(dmgH)2(H2O)2] and [Co(dmgBF)2(H2O)2].50 Both complexes 1 and 2 were chemically reduced in acetonitrile under an argon atmosphere using tetrabutylammonium borohydride ([nBu4N]BH4) (or powdered NaBH4) as a reductant, and their spectra are given in Fig. 6. The addition of [nBu4N]BH4 resulted in an increase in the absorbance between 500 and 800 nm, which corresponded to the formation of a Co(I) species.27,50,60,74,82
Fig. 6.
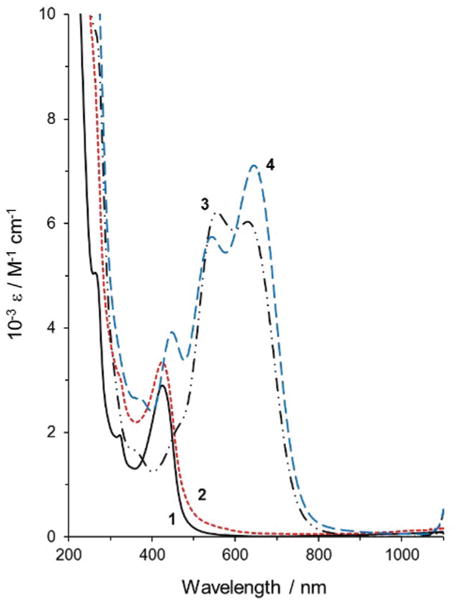
UV-visible spectra (acetonitrile solutions) of complex 1 (black, (solid, (1))), complex 2 (broken/red, (2)), complex 1 in excess [nBu4N]BH4 (black (– ··, (3))), complex 2 in excess [nBu4N]BH4 (blue, (– –, 4)).
Analogous Co(I) species of complex 1 such as [Co(dpgBF2)2(CH3CN)]− (where dpgBF2 = difluoroboryldiphenylglyoximato) as well as a cobaloxime containing a bis(imino) acenaphthene (BIAN) appended ligand and the pyridine coordinated anion of complex 2 have been isolated with a pentacoordinate geometry27,83,84 corresponding to a loss of solvent from the axial position of the octahedral Co(II) starting material. It is evident that the differences between the UV-visible spectra of the reduced forms of complexes 1 and 2 are due to the presence of the pyridine in the axial position, in place of the solvent molecule, in the square planar pyramidal complex. These Co(I) species are very sensitive to oxygen and are unstable at low to moderate pH values (pH < 10) due to their interaction with H+.50 In our experiments, we found that if the reduced cobalt species (a Co(I) species) is oxidized when exposed to air, the change is irreversible and the Co(I) species will not reform in an excess of the reducing agent under inert atmosphere. The exact nature of the species formed upon exposure to oxygen is unclear at this point.
The addition of pyridine to the Co(I) species in an acetonitrile solution of [Co(dmgBF2)2(CH3CN)]− (which is believed to be formed by reducing complex 1 with excess of the BH4− salt) caused spectral transformations that resemble those of a borohydride reduced solution of complex 2 (i.e., the proposed [Co(dmgBF2)2(py)]− species) as shown in Fig. 7. It is quite clear that the sequential addition (titration) of the pyridine results in distinct changes to the spectra of the solution and provides evidence for the formation of a CoI–pyridine coordination compound. The data also indicates that less than stoichiometric amounts of pyridine will cause significant transformation in the visible region of the spectrum (unlike the +2 oxidation state) in acetonitrile. The changes in the absorbance values upon the addition of pyridine are also suggestive of an equilibrium between the “pyridine-bound” and the “free” Co(I) species in acetonitrile. From the mole ratio plot, the stoichiometry was found to be 1 : 1 (pyridine : complex), indicating the formation of a monopyridine species. Using the method of Nonaka and Hamada,22 log K = 4.6 for the Co(I) species as compared to 3.1 for the Co(II) species. The change in geometry and electronic configuration may be the sources of this large difference, despite the small difference in the reduction potentials observed for the CoII/I redox couple in acetonitrile (Table 3). Indeed, the crystal structure of the anion of complex 283 reveals a shorter Co–N bond than for the corresponding Co(II) species20 (1.83 vs. 1.88 Å) and supports the larger formation constants obtained.
Fig. 7.
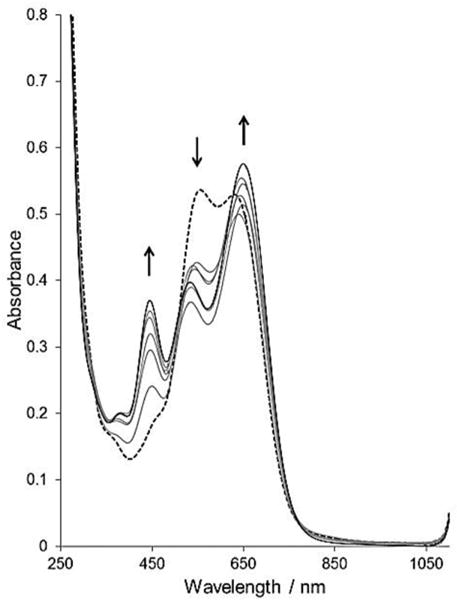
UV-visible spectra (acetonitrile solutions) of [nBu4N]BH4 reduced [complex 1] = 1.0 mM (broken line), and [nBu4N]BH4 reduced complex 1 with various equivalences (0.50, 1.0, 1.5, 2.0, 2.5 and 4.0) of pyridine, path length = 1 mm. Arrows indicate the absorbance change with increasing [pyridine].
Spectroelectrochemical studies
From cyclic voltammetric and chemical reduction studies, it is clear that the presence of pyridine within the coordination sphere influences the reduction of the cobalt(II) metal centre, as well as the spectrum of the Co(I) species. This difference is most pronounced in relatively weakly coordinating solvents. To provide further insight, and to justify our assignments for the CoII/I redox couple, as well as to verify that the spectra obtained in the presence of [nBu4N]BH4 is correctly assigned to a Co(I) species, studies of the spectral changes under cathodic potentials in the various solvents were performed. In acetonitrile (Fig. 8), UV-visible spectral changes of complex 1 at a constant potential of −1.0 V versus Ag, resulted in spectral characteristics similar to the Co(I) species generated above and to that reported by Pantani et al.,82 which was generated by electrochemical methods. Comparing the reduced spectra of complexes 1 and 2, there are subtle differences. For complex 1, the peak at ca. 430 nm decreases in absorbance upon reduction whereas in complex 2, this absorbance increases.
Fig. 8.
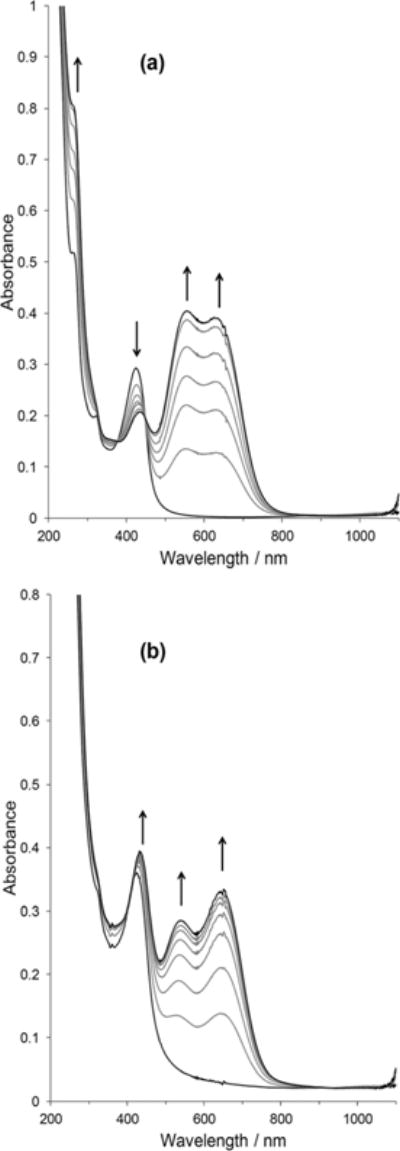
Absorbance changes in the UV-visible spectra of complexes 1 and 2 in acetonitrile at a constant potential of −1.0 V versus Ag, supporting electrolyte = 0.10 M [nBu4N]ClO4, path length = 1 mm. (a) [complex 1] = 1.05 mM and, (b) [complex 2] = 1.02 mM.
Additionally, the relative intensities of the peaks assigned to the formation of the Co(I) species at ca. 550 and 640 nm differ between complexes 1 and 2. The addition of excess pyridine to acetonitrile solutions of complexes 1 or 2 yields enhanced absorbance for the Co(I) state relative to a solution of only complex 2 (see Fig. 9 and ESI Fig. S31–S34† vs. Fig. 8b). This further confirms the speciation/dissociation in acetonitrile as given in eqn (1). In water, only one broad band with λmax at 640 nm develops when complex 1 is reduced (see ESI, Fig. S35†), which is consistent with the spectrum observed by Kumar et al.50 In the presence of excess pyridine, similar features to the acetonitrile solution (i.e., the dual band for the Co(I) species) are observed (see ESI, Fig. S36†), and here also our findings are consistent with the report of Kumar et al.50 in aqueous media. In the weakly coordinating solvents, acetone, 2-butanone, and 1,2-difluorobenzene/acetone, the reduction of complex 1 at the CoII/I redox couple develops a similar band to that of water, but red shifted by ~100 nm, whereas complex 2 gave the same spectral features that were observed in acetonitrile (and water) (see ESI, Fig. S37–S45†). Likewise with acetonitrile and water solutions, the reduction of complex 1 in the presence of excess pyridine resulted in the spectral characteristics of complex 2 under reduction. Interestingly, the addition of excess pyridine to the ketone solutions of complex 2 did not enhance the absorbance change upon reduction. This strongly supports the idea that the dissociation of complex 2 is insignificant in these solvents, and the monopyridine species is the predominant species. It is very important that the differences in the spectra of Co(I) species of complex 1 in these solvents are highlighted. In water and the ketone solvents, only a single band develops between 600 and 900 nm in the absence of pyridine, however, in acetonitrile, a dual band develops for Co(I) species of complex 1. We suspect that the coordination of the nitrogen from the acetonitrile solvent causes the splitting of a band at approximately 600 nm (due to a Co(I) metal centre) in a manner similar to pyridine. This splitting may be the result of back bonding from the electron rich Co(I) to the sp2 or sp hybridized nitrogen. This idea was also postulated by Espenson and co-workers on the basis of the short Co–N bond length.83
Fig. 9.
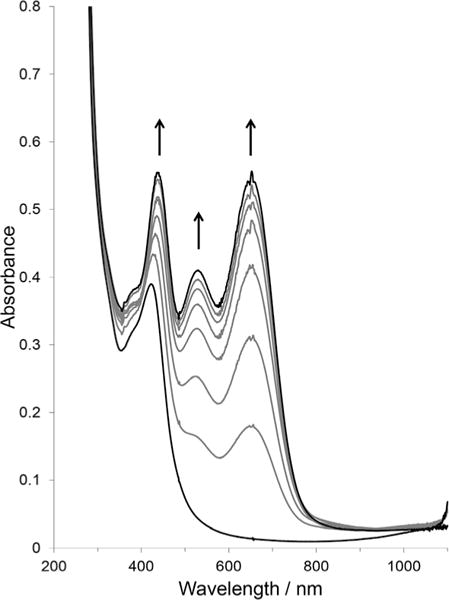
Absorbance changes in the UV-visible spectra of complex 2 with pyridine in acetonitrile at a constant potential of −1.0 V versus Ag, supporting electrolyte = 0.10 M [nBu4N]ClO4, path length = 1 mm. [complex 2] = 1.02 mM and [pyridine] = 5.09 mM.
11B, 19F, and 59Co NMR spectroscopic studies
Transition metal NMR chemical shifts are useful probes of the structure and reactivity of many coordination complexes, since those chemical shifts are sensitive to tiny variations at the coordination metal centre under investigation.85 We are interested in the coordination of pyridine, and its analogues, in the solution state as functional models for photocatalytic systems. Previously, we have used 11B, 19F, and 59Co NMR spectroscopic studies to verify coordination of a (4-pyridine)oxazolo[4,5-f] phenanthroline (L-pyr) bridging ligand to a Co(II) metal centre by the environmental effect on the BF2 capped dmgBF2 ligand.44 The acquisition of 59Co NMR spectra of paramagnetic species with oxidation states of +2, +1, and 0 is very challenging, however, we have successfully acquired 59Co NMR spectra of the chemically produced Co(I) species that resulted from the cobaloximes of complexes 1 and 2. The quadrupolar nature of the cobalt nuclei (nuclear spin = 7/2) results in very broad peaks (peak widths of several kHz) in the 59Co NMR spectrum of Co(I) complexes.86–89 When the complexes were reduced with 10 equivalents of [nBu4N]BH4 in CD3CN to give the Co(I) species, broad peaks with chemical shifts at 2996 ± 100 and 2443 ± 100 ppm were observed for complex 1 and complex 2, respectively (Fig. 10). When complex 1 was reduced with 10 equivalents of the reducing agent in the presence of five (5) equivalents of pyridine, a broad peak was observed at 2626 ± 100 ppm (Fig. 10 and Table 4). Also the reduction of complex 1 by 10 equivalents of the reducing agent in the presence of five (5) equivalents of 2,3,5,6-tetrafluoropyridine in CD3CN gave a broad peak resonating at 2499 ± 100 ppm (see ESI, Fig. S46†). To the best of our knowledge, this represents the first report of the 59Co NMR spectroscopy of the Co(I) species of the BF2 capped cobaloxime in solution. The reduced form of the dmgBF2 cobaloximes is reported in the literature as a pentacoordinate species with a square planar pyramidal geometry in the solid state.27,83 The presence of pyridine within the coordination sphere causes shielding in the 59Co NMR spectra (Table 4 entries 5 and 6). There is a subtle difference in the symmetry of the broad peaks and the chemical shifts for the [Co(dmgBF2)2(py)]− species generated from complex 2 and that of complex 1 in the presence of pyridine. This difference is most likely due to solvent effects (to which 59Co NMR spectroscopy is very sensitive), where the solvent mixture in the latter case is made up of 2 : 98% (v/v, py : CD3CN) compared to the neat CD3CN employed with complex 2. Nevertheless, the chemical shift values are approximately equal when the uncertainty is considered. To truly characterize the Co(I) species of complex 1 in the presence and absence of pyridine and to circumvent the solvent effects, the acquisition of the spectra in the solid state will also be needed.
Fig. 10.
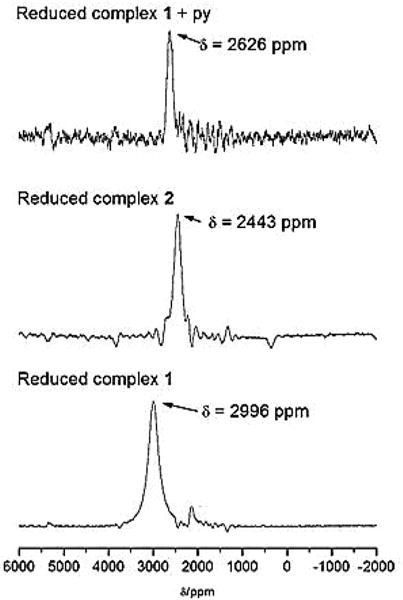
59Co NMR spectra of the Co(I) species produced from (i) 50 mM complex 1 and 500 mM [nBu4N]BH4 (bottom), (ii) 50 mM complex 2 and 500 mM [nBu4N]BH4 (middle), and (iii) 50 mM complex 1, 250 mM pyridine, and 500 mM [nBu4N]BH4 (top). Solvent = CD3CN.
Table 4.
A summary of the NMR chemical shifts for [Co(dmgBF2)2(H2O)2] 1, [Co(dmgBF2)2(H2O)(py)]·0.5(CH3)2CO 2, and the species formed upon reduction in CD3CN
| Entry | Species/mixture | δB/ppm | δF/ppm | δCoc/ppm |
|---|---|---|---|---|
| 1 | Complex 1 | 41.18, 20.05, 3.00, −1.14 | −142.4, −150.1, −151.9, −168.4, −189.2 | — |
| 2 | Complex 2 | 41.82, 19.68, 3.04–2.12 (m), 0.68 (t), −0.36 (d), −1.13 | −141.5, −142.4, −144.8, −147.7, −151.7, −154.9, −156.2, −188.9 | — |
| 3 | Complex 1 + py | 43.95, 2.99, 2.54(d), 2.14, −1.19 | −147.3, −151.8, −189.1 | — |
| 4 | Complex 1 + [nBu4N]BH4 | 19.48, 3.44, 3.35, 3.27, 0.76 (d) | −137.8, −138.3, −143.5, −150.8, −151.4, −152.7 | 2996 |
| 5 | Complex 2 + [nBu4N]BH4 | 19.44, 3.19, 0.71 (d) | −139.1, −150.7, −151.4, −152.8 | 2443 |
| 6 | Complex 1 + [nBu4N]BH4 + py | 19.47, 3.11, 0.68 | −139.4, −150.4, −151.5, −152.9 | 2626 |
| 7 | Complex 1 + pyF5 | 43.21, 2.93, −1.22 | −89.7, −134.9, −142.5, −150.3, −151.9, −162.7, −168.5, −189.1 | — |
| 8 | Complex 1 + pyF4 | 42.00, 20.02, 2.96, −1.18 | –78.3, −91.2, −93.9, −97.4, −138.4, −141.8, −144.0, −151.8, −165.8 | — |
| 9 | pyF5(lit.a)90,91 | — | −89.7 (−87.7), −134.8 (−134.3), −162.7 (−162.4) | — |
| 10 | pyF4(lit.a)90,91 | — | −92.6 (−92.6), −141.9 (−141.3) | — |
| 11 | Complex 1b,44 | 39.04, 3.55, 0.69 | −145.6, −146.6, −148.4 | — |
Tetrachloromethane.
DMSO-d6.
Uncertainty in the chemical shift, δ = ±100 ppm.
In our current study, 19F and 11B NMR spectra were also acquired in CD3CN at ambient temperature for complexes 1 and 2 in the absence and presence of pyridine, 2,3,5,6-tetra-fluoropyridine, and pentafluoropyridine, as well as solutions that were treated with excess [nBu4N]BH4 to generate the corresponding Co(I) species. Studies of the Co(II) and Co(I) species of complexes 1 and 2 (see Table 4) corroborated the equilibrium and electrochemical studies. It must be noted that the 19F NMR spectrum of complex 1 in acetonitrile-d3 showed chemical shifts at −142.4, −150.1, −151.9, −168.4, and −189.2 ppm whereas in the 11B NMR spectrum showed shifts at 41.18, 20.05, 3.00, and −1.14 (Table 4, entry 1). Like our electrochemical studies vide supra, the addition of five (5) equivalences of pyridine to complex 1 is expected to shift the equilibrium towards that of complex 2. The coordination of pyridine (and its derivatives) is expected to reduce the number of conformations accessible to the BF2 caps of the [dmgBF2]− ligands,44 and consequently a reduction in the number of resonances observed in the 19F and 11B NMR spectra of complex 2 (see Fig. S46†) compared to complex 1 in which the higher symmetry would allow for more conformers.
A mixture of complex 1 and five equivalences of pyridine gave three predominant peaks resonating at −147.3, −151.8, and −189.1 ppm in the 19F NMR spectrum (see ESI, Fig. S47†) and 43.95, 2.99, 2.54, 2.14, and −1.19 in the 11B NMR spectrum. Comparing the spectrum of complex 2 dissolved in CD3CN (Table 4, entry 2) with the mixture containing complex 1 and five equivalents of pyridine (Table 4, entry 3), it was evident that complex 2 dissociates to give complex 1 as shown in eqn (1) above, as the 11B and 19F NMR spectra of complex 2 were equivalent to the additive spectra of complex 1 alone and complex 1 with five (5) equivalences of pyridine.
The addition of 10 equivalences of the reducing [nBu4N]BH4 to the complexes to produce Co(I) species (Table 4, entries 4–6), resulted in the disappearance of the peak resonating at ~−189 ppm in the 19F NMR spectra and the peak at ~41 ppm in the 11B NMR spectra in both complexes 1 and 2. Also, in the 19F NMR spectra, the reduced form (a Co(I) species) of complex 1 had two additional peaks when compared to that of complex 2, and a similar feature was observed with the Co(II) species. The reduction in the observed number of resonances point to a reduction in the number of conformations of the BF2 capped dmgBF2 ligand upon the coordination of pyridine (see Fig. S46†).44 When complex 1 was reduced in the presence of five equivalences of pyridine (see ESI, Fig. S49c†), a very similar spectrum to that of the reduced complex 2 was obtained, which further confirms the similarity of the species formed.
Polyfluorinated pyridines such as pentafluoropyridine (pyF5) and 2,3,5,6-tetrafluoropyridine (pyF4) should be very useful spectroscopic probes for 19F NMR spectroscopic measurements on pyridine coordinated to the cobalt(I) and cobalt(II) metal centres. The coordination of pyF5 should result in changes in the chemical shifts of the ortho- and para-fluorine due to the inductive effect. The addition of five equivalences of pyF5 to complex 1 did not result in noticeable changes in the 19F NMR spectrum. However, a mixture of pyF4 and complex 1 showed new peaks in its 19F NMR spectrum which might be indicative of some coordination of the pyF4. In this mixture (Table 4, entry 8), there is a downfield shift of the ortho-fluorine consistent with the coordination of the pyF4 with a chemical shift at −97.4 ppm compared to the free pyF4 at ca. −93 ppm. There was no noticeable change in the 11B NMR spectrum of this mixture when compared to complex 1 only. These are consistent with our observations using UV-visible absorbance and cyclic voltammetry measurements (in acetonitrile or the ketone solvents (not shown)) in which no changes were observed with pyF5 and miniscule changes with pyF4. The pyF5 species is initially defluorinated at the para position (to give 2,3,5,6-tetrafluoropyridine, pyF4) in the presence of [Bu4N]BH4 (see ESI, Fig. S50†) and this type of reaction with a borohydride salt is well documented in the literature.90,91 A reaction between pyF4 and [nBu4N]BH4 was also observed. Consequently, addition of 10 equivalents of the reducing agent, [nBu4N]BH4, to complex 1 along with five (5) equivalents of the pyF5 or pyF4 resulted in a plethora of peaks in the 19F NMR spectra of these mixtures (see ESI for example, Fig. S51 and Table S7†), which could not be unambiguously assigned to any species in solution. In the 11B NMR spectrum, we also observed numerous chemical shifts related to the various H3−nBFn species formed subsequent to the defluorination reactions of the pyF5 and/or pyF4 species.92,93
Computational studies
The DFT-optimized geometries of complexes 1 and 2 in gas-phase and acetonitrile (using the IEF-PCM implicit solvation model) are in good agreement with the respective X-ray crystal structures20,83 (Fig. 11). Each of these structures prefer a chair conformation of the macrocyclic ligand with aqua ligands forming a short H⋯F interaction (1.8–2.0 Å) to the nearest fluorine. Co–O distances in complex 1 are slightly longer than those found in the structure of [Co(dmgBF2)2(MeOH)2]−. For the reduced Co(I) species, the metal centre prefers five-coordination with a boat conformation of the (dmgBF2)2 ligand. Aqua ligands are too weak to coordinate to the Co(I) metal centre and dissociate to form hydrogen bonding interactions if optimizations were started from the six-coordinate complex. In [Co(dmgBF2)2(OH2)]−, hydrogen bonding of water to the Co(I) metal centre of the four-coordinate [Co(dmgBF2)2]− is slightly more stable than to the fluorides of the BF2 bridging group. Similar square–planar complexes of Co(I) species with hydrogen bonding to the metal have been observed or proposed as intermediates in cobalamin or cobaloxime catalysis.94–96 The boat and chair conformations of the free [Co(dmgBF2)2]− complex are essentially degenerate and have Co–N(dmgBF2) bond distances similar to the five coordinate species. The optimized structure of [Co(dmgBF2)2(py)]− is in excellent agreement with the published structure83 and the formation of this complex by displacement of water from [Co(dmgBF2)2(H2O)]− is slightly favoured (ΔG = −1.3 kcal mol−1) in acetonitrile. Attempts to optimize similar complexes with pyF4 and pyF5 resulted in dissociation to the four-coordinate complex. Acetonitrile is also less strongly coordinated to Co(I) in [Co(dmgBF2)2(CH3CN)]− relative to the hydrogen-bonded four-coordinate complex (ΔG = +1.6 kcal mol−1).
Fig. 11.
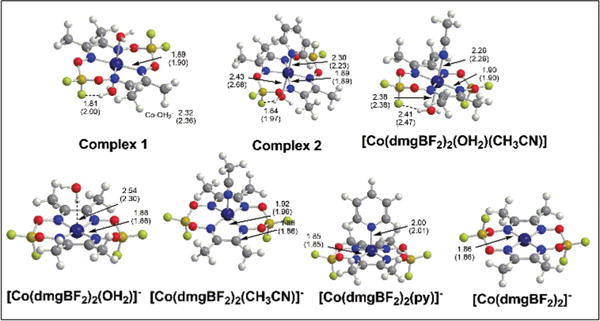
DFT-optimized geometries of complexes 1 and 2 in gas-phase and acetonitrile.
Comparison of the vertical TD-DFT excitation wavelengths and oscillator strengths (f) to the experimental spectra in Fig. 8 suggests that these spectra are most consistent with the five-coordinate Co(I) species. Both [Co(dmgBF2)2(py)]− and [Co(dmgBF2)2(CH3CN)]− have calculated transitions in the 530–620 nm region. The transitions for the CH3CN complex are similar in predicted intensity (λ = 574 nm (f = 0.03) and λ = 538 nm (f = 0.02)), but the longer wavelength excitation is more intense for the py complex (λ = 613 nm (f = 0.03) and λ = 559 nm (f = 0.02)). A third intense transition is found for each complex in the 400–500 range (CH3CN: λ = 420 nm and py: λ = 478 nm). The four-coordinate [Co(dmgBF2)2]− is predicted to have a single significant transition in the visible region (λ = 589 nm). These data appears to suggest five-coordination, but some contribution from four-coordinate Co(I) cannot be ruled out, especially in the case of water and the ketone solvents, where only one broad peak was observed for the Co(I) species formed from the reduction of complex 1.
59Co NMR chemical shifts were calculated using DFT (mPW1PW91)-GIAO from the gas- and IEF-PCM-optimized structures of the Co(I/II) species and referenced to K3[Co(CN)6] (Table 5). While the gas-phase shifts are within the range found experimentally, the IEF-PCM-derived values are found far outside of the range of the experimental NMR data, even when different implicit solvation methods are used. These results suggest that the implicit solvation method is not reliable for predicting 59Co NMR chemical shifts, possibly due to the large negative charge on the reference. The 59Co nucleus is known to be sensitive to the coordination geometry and molecular dynamics have been required to obtain accurate chemical shifts in many cases.97–99 For the Co(II) complexes, the gas-phase 59Co NMR chemical shifts are within 500–600 ppm of the experimental values, within the error commonly found for DFT-GIAO studies of this nucleus.100–103 The calculated 59Co NMR chemical shifts of the four-coordinate complexes, including that with water hydrogen bonded to the Co(I) metal centre of [Co(dmgBF2)2(H2O)]−, are similar to the values found in the reduction of the Co(II), but the large differences between the experimental results for complexes 1 (δ = 2996 ppm) and 2 (δ = 2443 ppm), suggest that different species are present in solution. The five coordinate py and CH3CN complexes have DFT-GIAO 59Co chemical shifts that are much larger than the observed values, which may be attributed to an effect of large variations in the weak Co–L bond that calculations on static molecules cannot recover.97–99 Taken together, the results of the TD-DFT calculations and DFT-GIAO chemical shifts cannot definitively assign the species observed experimentally, but suggest that the Co(I) complex is five-coordinate in the presence of py, but forms the [Co(dmgBF2)2]− ion when water and acetonitrile, are present as solvents.
Table 5.
DFT(mPW1PW91)-GIAO 59Co NMR chemical shiftsa (ppm) of selected cobaloxime derivatives
| Species | Conformation | (Gas phase) | (CH3CN) |
|---|---|---|---|
| 1 | Chair | 5775 | 8215 |
| 2 | Chair | 5851 | 6961 |
| [Co(dmgBF2)2(CH3CN)(OH2)] | Chair | 5694 | 6477 |
| [Co(dmgBF2)2py]− | Boat | 5430 | 6058 |
| [Co(dmgBF2)2(CH3CN)]− | Boat | 4186 | 5213 |
| [Co(dmgBF2)2(OH2)]− | Boat | 2343 | 2409 |
| [Co(dmgBF2)2]− | Boat | 2418 | 2508 |
| [Co(dmgBF2)2]− | Chair | 2212 | 2642 |
Calculated as .
Electrochemical behaviour of complexes 1 and 2 for the production of hydrogen in the presence of p-cyanoanilinium tetrafluoroborate in various solvents
Complex 1 has been used as a benchmark for the activity of cobaloxime and other cobalt complexes employed in the electrocatalytic reduction of protons to form hydrogen, with a well-accepted mechanism (see Scheme S1†).19,27 There is very little doubt that a Co(I) species is involved in the catalytic process. As such, a comparative study of complexes 1 and 2 under similar conditions was undertaken to determine if the pyridine influences the catalytic reduction of protons, and to simultaneously establish the effect of the relatively non-coordinating solvents on the apparent rate constant27 for the electro-catalytic transformation. The overall rate constant for H2 evolution was estimated from the height of the catalytic plateau current (eqn (2)).27,104
| (2) |
where the reaction rate constant, kapp (M−1 s−1), can be estimated, where n is the number of electrons, ic is the plateau current (mA), F is the Faraday’s constant (96 485 C mol−1), A is the area of the electrode surface (cm2), [cat] is the bulk concentration of the catalyst (M), D is the diffusion coefficient (cm2 s−1), and [H+] is the bulk concentration of acid (M). Controlled-potential electrolysis measurements for the production of hydrogen were conducted in a sealed two-chambered H-cell (see ESI, Fig. S58†). These results are summarized in Table 6. The electrochemical behaviour of complexes 1 and 2 in acetonitrile gave an exact feature similar to what has been observed for complex 1 in the literature (see ESI, Fig. S52–S54†).27 Based on the amount of hydrogen produced, complex 1 performed better than complex 2 in acetonitrile, whereas this order was reversed in acetone. In 2-butanone, both complexes performed the same, within the margin of error, and were significantly less than acetone. To the best of our knowledge, this represents the first such study in ketone solvents. The trend in the kapp and the turnover number (TON) for complex 1 versus complex 2, suggests that in acetonitrile, there is a slight disadvantage to having the pyridine in the axial position, while in acetone it is advantageous. These variations support the proposition of the retention of the pyridine within the coordination sphere. Specifically, at the higher ratios of the acid source, if the pyridine was protonated and excluded from the coordination sphere, it would not significantly change the concentration of the p-cyanoanilium species, or alter the peak current and as such the production of hydrogen by both species would have been almost identical.
Table 6.
Summary of data from electrocatalytic and controlled-potential electrolysis experiments
| Entry | Solvent | Complex | kapp/M−1 s−1 | Vol. H2/μL | TON (2 h) |
|---|---|---|---|---|---|
| 1 | Acetonitrile | 1 | 2068 ± 143 | 1140 ± 16 | 4.1 ± 0.2 |
| 2 | Acetonitrile | 2 | 1571 ± 25 | 975 ± 34 | 3.5 ± 0.1 |
| 3 | Acetone | 1 | 254 ± 21 | 299 ± 136 | 1.1 ± 0.5 |
| 4 | Acetone | 2 | 183 ± 23 | 670 ± 49 | 2.3 ± 0.1 |
| 5 | 2-Butanone | 1 | 177 ± 25 | 117 ± 29 | 0.4 ± 0.1 |
| 6 | 2-Butanone | 2 | 123 ± 9 | 140 ± 26 | 0.5 ± 0.1 |
The results of the electrocatalytic reduction of the protons in these solvent systems have provided some clear conclusions. Controlled potential experiments are performed at 20 °C for 2 h on unstirred mixtures at a constant potential of −0.75 V in acetonitrile, −1.0 V in acetone and 2-butanone versus Ag, ncatalyst = 12 mmol.
There is a linear correlation between the dielectric constant105 of the non-aqueous solvent and the apparent rate constant for the reduction of the proton (see ESI, Fig. S56 & S57†). This retardation points to the possible role of the solvent in stabilizing the transition states involved in the catalytic process, as the Co(I) species will be ionic, and ion-pairing is likely to retard the catalytic cycle. The presence of pyridine in the coordination sphere may enhance the performance of the catalyst based on the choice of the solvent. Owing to the fact that the presence of the pyridine in the coordination sphere generally shifts the CoII/I redox couple to a more positive value, from a thermodynamic point of view, it was expected to enhance the performance of the catalyst as the proposed mechanism in the electrocatalytic reduction of protons by these species involves the formation of the Co(I) species. The structural effects induced by the solvent, and the electronic contribution from the pyridine may be strongly influential on the intricate mechanism (and the rate determining step) for the electrocatalytic reduction of protons, in comparison to the heterogeneous electron transfer to the complex, that can be deduced from the reduction potentials.
Conclusions
This work has shown that the monopyridine species (complex 2) is readily formed in situ upon the addition of pyridine and we are the first to successfully isolate this species. This monopyridine species exists in equilibrium with free pyridine and complex 1 in strongly coordinating solvents (acetonitrile and water), and the equilibrium is shifted towards the pyridine coordinated species in weakly coordinating solvents. The relative position of the equilibrium can be quickly determined by cyclic voltammetry and the absorption spectra. We have also successfully studied the Co(I)–pyridine interaction using 11B, 19F, 59Co NMR and UV-visible spectroscopy and the formation constant showed that the Co(I) species of the complex has a higher affinity for pyridine than Co(II) species. The data indicate that the presence of the pyridine in the coordination sphere influences the addition of an electron to the cobalt(I) oxidation state, irrespective of the solvent and suppresses the CoI/0 reduction in the solvents explored. Importantly, the pyridine also slightly retards the rate constant for the reduction of protons supplied by p-cyanoanilinium tetrafluoroborate. These findings clearly indicate a solvent dependence and that the axial ligand influences the production of hydrogen, and may have implications in the design and performance of pyridine linked mixed-metal systems employing cobaloxime catalytic sites.
Experimental
Materials
Analytical or reagent grade chemicals obtained from commercial sources were used as received throughout this study. Microanalyses (C, H, B, Co, and N) were performed by the Microanalysis Laboratory at the University of Illinois Urbana/Champaign.
Physical measurements
Magnetic susceptibility measurements were acquired on a Johnson Matthey® magnetic susceptibility balance, Mark I, at ambient temperature. All FTIR spectra were acquired in the range 4000–400 cm−1 using the ATR accessory (with a diamond crystal) on a Nicolet 6700 FTIR spectrophotometer. 19F NMR spectra were acquired on a Bruker 400 MHz spectrometer with CD3CN as solvent, with 50% CF3CO2H (δ = −76.55 ppm‡) used as an external reference at room temperature. 59Co NMR spectra were acquired on a Bruker 400 MHz NMR using the Bruker “cpmg1d” pulse sequence for up to 120 000 transients, and referenced to K3[Co(CN)6]§ in acetonitrile-d3 (δ = 293 ppm).106 All NMR spectra were processed using Mestrec MNova software version 9.0. The first 20 to 40 data points of the time domain signal (FID) were corrected using backward linear prediction107 in order to minimize spectral distortions due to probe ringing, with the fitting process employing either 128 or 256 data points. The Toeplitz method as implemented in the MNova program was used. After linear prediction, the FIDs were zero-filled to 256 K points and subjected to a Lorentzian exponential filter of 100–500 Hz prior to Fourier transformation.
All electrochemical experiments were performed at room temperature (ca. 20 °C) on a BASi® Epsilon C3 under an argon atmosphere in the respective solvents, thoroughly purged with Ar for 15 minutes before any electrochemical studies were carried out, and are uncorrected for junction potentials. A standard three electrode configuration was employed consisting of a glassy carbon working electrode (diameter = 3 mm), Pt wire auxiliary electrode and a Ag wire¶ as reference electrode in non-aqueous solvents; against which the ferrocenium/ferrocene couple showed a reversible wave at +0.29 V in acetonitrile, +0.40 V in acetone, +0.55 V in 2-butanone, and +0.44 V in 1,2-difluorobenzene/acetone (4 : 1). In aqueous media, a AgCl/Ag reference electrode (BASi, 3.0 M NaCl) was employed, which was separated from the analytical solution by a Vicor® frit. The ionic strength was maintained at 0.10 M ([nBu4N]ClO4 in non-aqueous media and NaClO4 in aqueous media).
Spectroelectrochemical measurements were regulated at 20 °C with a thermostatic water bath/circulator (Thermo Scientific®). Absorbance measurements were performed on an Agilent® 8453A diode array spectrophotometer. A Pt gauze and Pt wire were employed as working and auxiliary electrodes, respectively, and Ag wire was used as a quasi-reference electrode. The ionic strength was maintained at 0.10 M as stated above. Each solution was purged with Ar for at least two minutes in the spectroelectrochemical cuvette (1 mm path length) prior to the measurement, and the spectra are acquired over 200–1000 s at a constant potential.
Electronic spectra were recorded on a Cary 5000 UV/Vis/NIR spectrophotometer, Spectramax M5 (Molecular Devices) or an Agilent 8453 diode array spectrophotometer in the respective solvent(s) using quartz cuvettes.
High-resolution ESI MS spectra were acquired via positive electrospray ionization on a Bruker 12 Tesla APEX-Qe FTICR-MS with an Apollo II ion source. Samples were dissolved in 1 : 1 dichloromethane/methanol, followed by direct injection using a syringe pump with a flow rate of 2 μL s−1. The data was processed using Bruker Daltonics Data Analysis Version 3.4.
Controlled-potential electrolysis measurements for the production of hydrogen were conducted on unstirred solutions for two hours in a sealed two-chambered H-cell separated by a fine frit, where one chamber held the working and reference electrodes in 10 mL of 1 mM of complex in 0.10 M [nBuN4] ClO4 (supporting electrolyte) with 0.4 M p-cyanoanilinium (proton source) and the second chamber held the auxiliary electrode in 5 mL of the solvent with the supporting electrolyte. A glassy carbon plate (contact area ~2 cm × 1 cm × 3 mm) and Pt wire were used as the working and auxiliary electrodes, respectively, with Ag wire as the reference electrode. The solution was purged with Ar for 20 minutes and then sealed under an Ar atmosphere before the start of each electrolysis experiment. The amount of H2 evolved was quantified from an analysis of the headspace of the chamber containing the working electrode with a Shimadzu Tracera gas chromatograph 2010 Plus (SH-Rt-Molsieve 30 m × 0.53 mm × 50 μm column; 40 °C isothermal; 1.0 mL min−1 flow rate; He carrier gas, 50 μL injection volume) using a barrier-discharge ionization detector (BID). A calibration of hydrogen was performed by injecting known amounts of hydrogen gas into an airtight vial of the same volume as the reaction vessel and filled with solvent (10 mL) to account for the fraction that dissolves in the solvent. The turn-over-number (TON) is calculated from nH2/ncat, where H2 is assumed to behave as an ideal gas at the low pressures of the experiment.
DFT calculations
Geometries were optimized in the gas- and solution-phase using Gaussian 09‖ with the DFT-mPW1PW91108 functional and the integral equation formalism variant of the polarisable continuum mode (IEF-PCM) implicit solvation method.109 Cobalt was represented by the Wachters–Hay all-electron basis set.110,111 The Dunning triple-ζ basis set augmented with diffuse and polarization functions was for all other atoms.112 Vertical transitions were calculated using time-dependent DFT (TD-DFT) from the optimized geometry. 59Co NMR chemical shifts were calculated relative to K3[Co(CN)6] at the gas- or IEF-PCM-optimized geometry. Optimized structures were confirmed as minima on the potential energy surface by vibrational analysis.
Synthesis of [Co(dmgBF2)2(H2O)2] 1
[Co(dmgBF2)2(H2O)2] 1 was synthesized using the methods of Bakac et al.20 The measured μeff = 1.84 B.M. compared favourably to the literature value of 1.92 B.M.20 The spectral characteristics of complex 1 in the UV-visible-NIR region with acetonitrile solvent have been thoroughly documented in the literature.44
Synthesis of [Co(dmgBF2)2(H2O)(py)]·0.5CH3COCH3 2
[Co(dmgBF2)2(H2O)2] (0.30 g, 0.71 mmol), along with pyridine (79 mg, 1.0 mmol) and acetone (400 mL) were mixed in a 500 mL RB flask; then the reaction mixture was stirred at room temperature for 21.5 hours. The reaction mixture was rotary evaporated to dryness; and more acetone was added to the mixture. The mixture was once more rotary evaporated, and the resulting solid was washed with diethyl ether and a dry solid was recovered. Yield = 0.33 g (89%). Anal. Calcd for C14.5H22B2CoF4N5O5.5: C, 34.09; H, 4.34; B, 4.23; Co, 11.53; N, 13.71. Found: C, 33.79; H, 3.71; B, 4.48; Co, 11.71; N, 13.79. High-resolution ESI MS (positive mode) m/z = of 482.083653 for the [Co(dmgBF2)2(H2O)(py)]+ species. μeff = 1.28 ± 0.02 B.M. Selected νmax/cm−1: 537.6 (s) (Co–N(O–B)), 689.8 (m) (py), 758.3 (m) (py), 822.8 (vs) (B–F), 1100.8 (s) (N–O), 1163.5 (s) (B–F), 1225.1 (m) (N–O), and 1622.0 (m) (CvN). UV-visible spectrum (CH3CN), λmax./nm (10−3 ε/M−1cm−1): 199 (47.6), 256 sh (15.0), 323 sh (4.1), 425 (4.8), and 1144 (0.15).
Mole ratio studies and calculation of equilibrium constants with complex 1
Spectrophotometric titrations were carried on solutions of complex 1 in various solvents, viz., acetonitrile, acetone, 2-butanone, dichloromethane, and 1,2-difluorobenzene/acetone (4 : 1, v/v) (0.10 mM for UV-visible spectroscopy and 2.0 mM for NIR spectroscopy), with the concentration of pyridine varying as 0.00 mM ≤ [pyridine] ≤ 10.00 mM. The solutions in 10 mL volumetric flasks were equilibrated at 20 °C; then their absorbances were acquired after 10 minutes and again after 24 hours. The stoichiometry and values of the equilibrium constant were determined from the absorbance data, the slope and intercept of an appropriate plot (eqn (1) and see ESI†), using an established equation as reported in the literature as shown in eqn (3).22,76
| (3) |
In eqn (3), Aeq = equilibrium absorbance at 1162 nm (λmax) for acetonitrile, 372 nm (λmin) for acetone, and 2-butanone, and 370 nm for dichloromethane; A0 = absorbance before the addition of pyridine and A∞ = theoretical absorbance for the infinite addition of pyridine. A∞ is estimated from the limiting value predicted from the mole ratio plot:
| (4) |
where [pyridine]T and [M] denote the total concentrations of pyridine and the metal complex, respectively.
Spectrophotometric titrations involving a Co(I) species (which was generated from the reaction between complex 1 (1.0 mM) and [nBuN4]BH4 (500 equivalents) and the required aliquots of pyridine (0 mM ≤ [pyridine] ≤ 4.0 mM)) were performed in acetonitrile under a blanket of argon in a cuvette (1 mm path length) until a limiting UV-visible spectrum was acquired; Aeq in eqn (3) and (4) at 447 nm.
Supplementary Material
Acknowledgments
AAH would like to thank the National Science Foundation (NSF) for a National Science Foundation CAREER Award as this material is based upon work supported by the National Science Foundation under CHE-1431172 (formerly CHE – 1151832). AAH would also like to thank Old Dominion University’s Faculty Proposal Preparation Program (FP3) and also for the Old Dominion University start-up package that allowed for the successful completion of this work. Also this research was supported partially by an appointment to the Student Research Participation Program at the U.S. Army Engineer Research and Development Center, Construction Engineering Research Laboratory, administered by the Oak Ridge Institute for Science and Education through an interagency agreement between the U.S. Department of Energy and ERDC-CERL. This work was also partially supported by the Center Directed Research Program at the U.S. Army Corps of Engineers. DLE would like to thank Johnson C. Smith University and the Louis Stokes Alliances for Minority Participation (LSAMP) program, also the U.S. Department of Education’s Title III Student Aid and Fiscal Responsibility Act (SAFRA), award number P031B100094; while LSJ would like to thank The University of the Virgin Islands Emerging Caribbean Scientists Program and the Minority Biomedical Research Support Research Initiative for Scientific Enhancement (MBRS-RISE), grant #5R25GM061325. The authors would like to thank Dr James Hall for his assistance with the 19F and 59Co NMR spectroscopic acquisitions. The authors are also very grateful for the helpful comments that were provided by the reviewers.
Footnotes
Electronic Supplementary Information (ESI) available: Figures featuring ESI MS (Fig. S1), FT IR spectra (Fig. S2), UV-visible data (Fig. S3–S4). Mole ratio plots and equilibria data (Fig. S5–S19), electrochemical data (Fig. S20–S30), spectroelectrochemical data (Fig. S31–S45), 11B, 19F, and 59Co NMR spectroscopic data (Fig. S46–S51), electrocatalytic data (Fig. S52–S58), tables (tables S1–S7), and schemes (Scheme S1) are collated here. See DOI: 10.1039/c6dt01583b
0.1 M K3[Co(CN)6] with 3.5 equivalents of 18-crown-6 ether to aid with dissolution.
Ag wire serves as a convenient reference across the multiple solvents and simultaneously eliminates the junction potential that will develop across the frit of the AgCl/Ag aqueous reference electrode. The performance of the Ag wire was compared to AgCl/Ag reference with the acetonitrile solutions where it was found to give equivalent cyclic voltammograms, and the behaviour of the Ag quasi-reference electrode was reproducible across several days of experiments.
Gaussian 09, Gaussian, Inc., Wallingford, CT, 2009.
Notes and references
- 1.Eisenberg R, Nocera DG. Inorg Chem. 2005;44:6799–6801. doi: 10.1021/ic058006i. [DOI] [PubMed] [Google Scholar]
- 2.Gray HB. Nat Chem. 2009;1:112. doi: 10.1038/nchem.141. [DOI] [PubMed] [Google Scholar]
- 3.Lubitz W, Tumas W. Chem Rev. 2007;107:3900–3903. doi: 10.1021/cr050200z. [DOI] [PubMed] [Google Scholar]
- 4.Service RF. Science. 2005;309:548–551. doi: 10.1126/science.309.5734.548. [DOI] [PubMed] [Google Scholar]
- 5.Lehn JM, Sauvage JP. Nouv J Chim. 1977;1:449–451. [Google Scholar]
- 6.Ashcroft AT, Cheetham AK, Foord JS, Green MLH, Grey CP, Murrell AJ, Vernon PDF. Nature. 1990;344:319–321. [Google Scholar]
- 7.Kobayashi M, Masaoka S, Sakai K. Angew Chem, Int Ed. 2012;51:7431–7434. doi: 10.1002/anie.201202720. [DOI] [PubMed] [Google Scholar]
- 8.Singh Bindra G, Schulz M, Paul A, Groarke R, Soman S, Inglis JL, Browne WR, Pfeffer MG, Rau S, MacLean BJ, Vos MT, Pryce JG. Dalton Trans. 2012;41:13050–13059. doi: 10.1039/c2dt30948c. [DOI] [PubMed] [Google Scholar]
- 9.Eckenhoff WT, Eisenberg R. Dalton Trans. 2012;41:13004–13021. doi: 10.1039/c2dt30823a. [DOI] [PubMed] [Google Scholar]
- 10.Gordon RB, Bertram M, Graedel TE. Proc Natl Acad Sci U S A. 2006;103:1209–1214. doi: 10.1073/pnas.0509498103. [DOI] [PMC free article] [PubMed] [Google Scholar]
- 11.Dempsey JL, Brunschwig BS, Winkler JR, Gray HB. Acc Chem Res. 2009;42:1995–2004. doi: 10.1021/ar900253e. [DOI] [PubMed] [Google Scholar]
- 12.Du P, Knowles K, Eisenberg R. J Am Chem Soc. 2008;130:12576–12577. doi: 10.1021/ja804650g. [DOI] [PubMed] [Google Scholar]
- 13.Du P, Schneider J, Luo G, Brennessel WW, Eisenberg R. Inorg Chem. 2009;48:4952–4962. doi: 10.1021/ic900389z. [DOI] [PubMed] [Google Scholar]
- 14.Fihri A, Artero V, Razavet M, Baffert C, Leibl W, Fontecave M. Angew Chem, Int Ed. 2008;47:564–567. doi: 10.1002/anie.200702953. [DOI] [PubMed] [Google Scholar]
- 15.Bacchi M, Berggren G, Niklas J, Veinberg E, Mara MW, Shelby ML, Poluektov OG, Chen LX, Tiede DM, Cavazza C, Field MJ, Fontecave M, Artero V. Inorg Chem. 2014;53:8071–8082. doi: 10.1021/ic501014c. [DOI] [PubMed] [Google Scholar]
- 16.Razavet M, Artero V, Fontecave M. Inorg Chem. 2005;44:4786–4795. doi: 10.1021/ic050167z. [DOI] [PubMed] [Google Scholar]
- 17.Dempsey JL, Winkler JR, Gray HB. J Am Chem Soc. 2010;132:1060–1065. doi: 10.1021/ja9080259. [DOI] [PubMed] [Google Scholar]
- 18.Han A, Wu H, Sun Z, Jia H, Yan Z, Ma H, Liu X, Du P. ACS Appl Mater Interfaces. 2014;6:10929–10934. doi: 10.1021/am500830z. [DOI] [PubMed] [Google Scholar]
- 19.Valdez CN, Dempsey JL, Brunschwig BS, Winkler JR, Gray HB. Proc Natl Acad Sci U S A. 2012;109:15589–15593. doi: 10.1073/pnas.1118329109. [DOI] [PMC free article] [PubMed] [Google Scholar]
- 20.Bakac A, Brynildson ME, Espenson JH. Inorg Chem. 1986;25:4108–4114. [Google Scholar]
- 21.Bakac A, Espenson JH. J Am Chem Soc. 1984;106:5197–5202. [Google Scholar]
- 22.Nonaka Y, Hamada K. Bull Chem Soc Jpn. 1981;54:3185–3190. [Google Scholar]
- 23.Schrauzer GN, Windgassen RJ. J Am Chem Soc. 1966;88:3738–3743. [Google Scholar]
- 24.Wang K, Jordan RB. Can J Chem. 1996;74:658–665. [Google Scholar]
- 25.Kellett RM, Spiro TG. Inorg Chem. 1985;24:2373–2377. [Google Scholar]
- 26.Fisher BJ, Eisenberg R. J Am Chem Soc. 1980;102:7361–7363. [Google Scholar]
- 27.Hu X, Brunschwig BS, Peters JC. J Am Chem Soc. 2007;129:8988–8998. doi: 10.1021/ja067876b. [DOI] [PubMed] [Google Scholar]
- 28.Jacques PA, Artero V, Pecaut J, Fontecave M. Proc Natl Acad Sci U S A. 2009;106:20627–20632. doi: 10.1073/pnas.0907775106. [DOI] [PMC free article] [PubMed] [Google Scholar]
- 29.Creutz C, Schwarz HA, Sutin N. J Am Chem Soc. 1984;106:3036–3037. [Google Scholar]
- 30.Schwarz H, Creutz C, Sutin N. Inorg Chem. 1985;24:433–439. [Google Scholar]
- 31.Singh WM, Baine T, Kudo S, Tian S, Ma XAN, Zhou H, DeYonker NJ, Pham TC, Bollinger JC, Baker DL, Yan B, Webster CE, Zhao X. Angew Chem, Int Ed. 2012;51:5941–5944. doi: 10.1002/anie.201200082. [DOI] [PubMed] [Google Scholar]
- 32.Sun Y, Bigi JP, Piro NA, Tang ML, Long JR, Chang CJ. J Am Chem Soc. 2011;133:9212–9215. doi: 10.1021/ja202743r. [DOI] [PubMed] [Google Scholar]
- 33.Vennampalli M, Liang G, Katta L, Webster CE, Zhao X. Inorg Chem. 2014;53:10094–10100. doi: 10.1021/ic500840e. [DOI] [PubMed] [Google Scholar]
- 34.Stubbert BD, Peters JC, Gray HB. J Am Chem Soc. 2011;133:18070–18073. doi: 10.1021/ja2078015. [DOI] [PubMed] [Google Scholar]
- 35.Zhang P, Jacques PA, Chavarot-Kerlidou M, Wang M, Sun L, Fontecave M, Artero V. Inorg Chem. 2012;51:2115–2120. doi: 10.1021/ic2019132. [DOI] [PubMed] [Google Scholar]
- 36.McNamara WR, Han Z, Yin CJ, Brennessel WW, Hollan PL, Eisenberg R. Proc Natl Acad Sci U S A. 2012;109:15594–15599. doi: 10.1073/pnas.1120757109. [DOI] [PMC free article] [PubMed] [Google Scholar]
- 37.Laga SM, Blakemore JD, Henling LM, Brunschwig BS, Gray HB. Inorg Chem. 2014;53:12668–12670. doi: 10.1021/ic501804h. [DOI] [PubMed] [Google Scholar]
- 38.Shamsipur M, Salimi A, Haddadzadeh H, Mousavi MF. J Electroanal Chem. 2001;517:37–44. [Google Scholar]
- 39.Wakerley DW, Reisner E. Phys Chem Chem Phys. 2014;16:5739–5746. doi: 10.1039/c4cp00453a. [DOI] [PubMed] [Google Scholar]
- 40.Marinescu SC, Winkler JR, Gray HB. Proc Natl Acad Sci U S A. 2012;109:15127–15131. doi: 10.1073/pnas.1213442109. [DOI] [PMC free article] [PubMed] [Google Scholar]
- 41.Smolentsev G, Guda AA, Janousch M, Frieh C, Jud G, Zamponi F, Chavarot-Kerlidou M, Artero V, van Bokhoven JA, Nachtegaal M. Faraday Discuss. 2014;171:259–273. doi: 10.1039/c4fd00035h. [DOI] [PMC free article] [PubMed] [Google Scholar]
- 42.Krzystek J, Ozarowski A, Zvyagin SA, Telser J. Inorg Chem. 2012;51:4954–4964. doi: 10.1021/ic202185x. [DOI] [PubMed] [Google Scholar]
- 43.Manton JC, Long C, Vos JG, Pryce MT. Dalton Trans. 2014;43:3576–3583. doi: 10.1039/c3dt53166j. [DOI] [PubMed] [Google Scholar]
- 44.Cropek DM, Metz A, Muller AM, Gray HB, Horne T, Horton DC, Poluektov O, Tiede DM, Weber RT, Jarrett WL, Phillips JD, Holder AA. Dalton Trans. 2012;41:13060–13073. doi: 10.1039/c2dt30309d. [DOI] [PMC free article] [PubMed] [Google Scholar]
- 45.Fihri A, Artero V, Pereira A, Fontecave M. Dalton Trans. 2008;5567–5569 doi: 10.1039/b812605b. [DOI] [PubMed] [Google Scholar]
- 46.Kahnt A, Peuntinger K, Dammann C, Drewello T, Hermann R, Naumov S, Abel B, Guldi DM. J Phys Chem A. 2014;118:4382–4391. doi: 10.1021/jp501947y. [DOI] [PubMed] [Google Scholar]
- 47.Kawade VA, Ghosh S, Sapre AV, Kumbhar AS. J Chem Sci. 2010;122:225–232. [Google Scholar]
- 48.Ducker-Benfer C, Hamza MSA, Eckhardt C, Van Eldik R. Eur J Inorg Chem. 2000;1563–1569 doi: 10.1021/ic000023e. [DOI] [PubMed] [Google Scholar]
- 49.Funston AM, McFadyen WD, Tregloan PA. J Chem Soc, Dalton Trans. 2002:2053–2060. [Google Scholar]
- 50.Kumar M, Natarajan E, Neta P. J Phys Chem. 1994;98:8024–8029. [Google Scholar]
- 51.Kawade VA, Kumbhar AS, Naik DB, Butcher RJ. Dalton Trans. 2010;39:5664–5675. doi: 10.1039/b925220g. [DOI] [PubMed] [Google Scholar]
- 52.Mulazzani QG, Emmi S, Fuochi PG, Venturi M, Hoffman MZ, Simic MG. J Phys Chem. 1979;83:1582–1590. [Google Scholar]
- 53.Simic M, Ebert M. Int J Radiat Phys Chem. 1971;3:259–272. [Google Scholar]
- 54.Helm L, Merbach AE. Chem Rev. 2005;105:1923–1960. doi: 10.1021/cr030726o. [DOI] [PubMed] [Google Scholar]
- 55.Wang K, Jordan RB. Inorg Chem. 1995;34:5672–5679. [Google Scholar]
- 56.Bakac A, Espenson JH. J Am Chem Soc. 1984;106:5197–5202. [Google Scholar]
- 57.McCrory CCL, Uyeda C, Peters JC. J Am Chem Soc. 2012;134:3164–3170. doi: 10.1021/ja210661k. [DOI] [PubMed] [Google Scholar]
- 58.Zhang P, Wang M, Dong J, Li X, Wang F, Wu L, Sun L. J Phys Chem C. 2010;114:15868–15874. [Google Scholar]
- 59.Razavet M, Artero V, Fontecave M. Inorg Chem. 2005;44:4786–4795. doi: 10.1021/ic050167z. [DOI] [PubMed] [Google Scholar]
- 60.Du P, Schneider J, Luo G, Brennessel WW, Eisenberg R. Inorg Chem. 2009;48:4952–4962. doi: 10.1021/ic900389z. [DOI] [PubMed] [Google Scholar]
- 61.Rockenbauer A, Budo-Zahonyi E, Simandi LI. J Chem Soc, Dalton Trans. 1975;1729–1737 [Google Scholar]
- 62.Artero V, Chavarot-Kerlidou M, Fontecave M. Angew Chem, Int Ed. 2011;50:7238–7266. doi: 10.1002/anie.201007987. [DOI] [PubMed] [Google Scholar]
- 63.Varma S, Castillo CE, Stoll T, Fortage J, Blackman AG, Molton F, Deronzier A, Collomb MN. Phys Chem Chem Phys. 2013;15:17544–17552. doi: 10.1039/c3cp52641k. [DOI] [PubMed] [Google Scholar]
- 64.Holder AA, Dasgupta TP. Inorg Chim Acta. 2002;331:279–289. [Google Scholar]
- 65.Holder AA, Dasgupta TP, Im SC. Transition Met Chem. 1997;22:135–140. [Google Scholar]
- 66.Holder AA, Dasgupta TP. J Chem Soc, Dalton Trans. 1996;2637–2643 [Google Scholar]
- 67.Holder AA, Dasgupta TP, McFarlane W, Rees NH, Enemark JH, Pacheco A, Christensen K. Inorg Chim Acta. 1997;260:225–228. [Google Scholar]
- 68.Moody LM, Balof S, Smith S, Rambaran VH, VanDerveer D, Holder AA. Acta Crystallogr, Sect E: Struct Rep Online. 2008;E64:m262–m263. doi: 10.1107/S1600536807067141. [DOI] [PMC free article] [PubMed] [Google Scholar]
- 69.Rambaran VH, Erves TR, Grover K, Balof S, Moody LV, Ramsdale SE, Seymour LA, VanDerveer D, Cropek DM, Weber RT, Holder AA. J Chem Crystallogr. 2013;43:509–516. [Google Scholar]
- 70.Yuan H, Newton DAL, Seymour LA, Metz A, Cropek D, Holder AA, Ofoli RY. Catal Commun. 2014;56:76–80. [Google Scholar]
- 71.Lawrence MAW, McMillen CD, Gurung RK, Celestine MJ, Arca JF, Holder AA. J Chem Crys-tallogr. 2015;45:427–433. [Google Scholar]
- 72.Varey JE, Lamprecht GJ, Fedin VP, Holder A, Clegg W, Elsegood MRJ, Sykes AG. Inorg Chem. 1996;35:5525–5530. doi: 10.1021/ic951659m. [DOI] [PubMed] [Google Scholar]
- 73.Holder AA, Brown RFG, Marshall SC, Payne VCR, Cozier MD, Alleyne WA, Bovell CO. Transition Met Chem. 2000;25:605–611. [Google Scholar]
- 74.Lawrence MAW, Holder AA. Inorg Chim Acta. 2016;441:157–168. [Google Scholar]
- 75.Yamazaki N, Hohokabe Y. Bull Chem Soc Jpn. 1971;44:63–69. [Google Scholar]
- 76.Vilakazi SL, Nyokong T. Polyhedron. 1998;17:4415–4423. [Google Scholar]
- 77.Baffert C, Artero V, Fontecave M. Inorg Chem. 2007;46:1817–1824. doi: 10.1021/ic061625m. [DOI] [PubMed] [Google Scholar]
- 78.Green KA, Maragh PT, Abdur-Rashid K, Lough AJ, Dasgupta TP. Eur J Inorg Chem. 2014;2014:3600–3607. [Google Scholar]
- 79.Larrosa I, Somoza C, Banquy A, Goldup SM. Org Lett. 2011;13:146–149. doi: 10.1021/ol1027283. [DOI] [PubMed] [Google Scholar]
- 80.Organ MG, Abdel-Hadi M, Avola S, Hadei N, Nasielski J, O’Brien CJ, Valente C. Chem - Eur J. 2007;13:150–157. doi: 10.1002/chem.200601360. [DOI] [PubMed] [Google Scholar]
- 81.Valente C, Belowich ME, Hadei N, Organ MG. Eur J Org Chem. 2010:4343–4354. [Google Scholar]
- 82.Pantani O, Anxolabéhère-Mallart E, Aukauloo A, Millet P. Electrochem Commun. 2007;9:54–58. [Google Scholar]
- 83.Shi S, Daniels LM, Espenson JH. Inorg Chem. 1991;30:3407–3410. [Google Scholar]
- 84.Williams OM, Cowley AH, Rose MJ. Dalton Trans. 2015;44:13017–13029. doi: 10.1039/c5dt00924c. [DOI] [PubMed] [Google Scholar]
- 85.von Philipsborn W. Chem Soc Rev. 1999;28:95–105. [Google Scholar]
- 86.Benn R, Cibura K, Hofmann P, Jonas K, Rufinska A. Organometallics. 1985;4:2214–2221. [Google Scholar]
- 87.Lucken EAC, Noack K, Williams DF. J Chem Soc A. 1967;148–154 [Google Scholar]
- 88.Medek A, Frydman V, Frydman L. Proc Natl Acad Sci U S A. 1997;94:14237–14242. doi: 10.1073/pnas.94.26.14237. [DOI] [PMC free article] [PubMed] [Google Scholar]
- 89.Sizun C, Kempgens P, Raya J, Elbayed K, Granger P, Rosé J. J Organomet Chem. 2000;604:27–33. [Google Scholar]
- 90.Bobbio C, Rausis T, Schlosser M. Chem - Eur J. 2005;11:1903–1910. doi: 10.1002/chem.200400837. [DOI] [PubMed] [Google Scholar]
- 91.Coe PL, Holton AG, Tatlow JC. J Fluorine Chem. 1982;21:171–189. [Google Scholar]
- 92.Farrar TC, Coyle TD. J Chem Phys. 1964;41:2612–2613. [Google Scholar]
- 93.Heitsch CW. Inorg Chem. 1965;4:1019–1024. [Google Scholar]
- 94.Moore TC, Newmister SA, Rayment I, Escalante-Semerena JC. Biochemistry. 2012;51:9647–9657. doi: 10.1021/bi301378d. [DOI] [PMC free article] [PubMed] [Google Scholar]
- 95.Kumar M, Kumar N, Hirao H, Kozlowski PM. Inorg Chem. 2012;51:5533–5538. doi: 10.1021/ic201970k. [DOI] [PubMed] [Google Scholar]
- 96.Solis BH, Hammes-Schiffer S. Inorg Chem. 2011;50:11252–11262. doi: 10.1021/ic201842v. [DOI] [PubMed] [Google Scholar]
- 97.Kritayakornupong C, Plankensteiner K, Rode BM. J Chem Phys. 2003;119:6068–6072. [Google Scholar]
- 98.Bühl M, Grigoleit S, Kabrede H, Mauschick FT. Chem –Eur J. 2006;12:477–488. doi: 10.1002/chem.200500285. [DOI] [PubMed] [Google Scholar]
- 99.Grigoleit S, Bühl M. J Chem Theory Comput. 2005;1:181–193. doi: 10.1021/ct049920o. [DOI] [PubMed] [Google Scholar]
- 100.Chan JCC, Au-Yeung SCF, Wilson PJ, Webb GA. J Mol Struct (THEOCHEM) 1996;365:125–130. [Google Scholar]
- 101.Chan JCC, Au-Yeung SCF. J Mol Struct (THEOCHEM) 1997;393:93–96. [Google Scholar]
- 102.Chan JCC, Au-Yeung SCF. J Phys Chem A. 1997;101:3637–3640. [Google Scholar]
- 103.Godbout N, Oldfield E. J Am Chem Soc. 1997;119:8065–8069. [Google Scholar]
- 104.Savéant JM. Chem Rev. 2008;108:2348–2378. doi: 10.1021/cr068079z. [DOI] [PubMed] [Google Scholar]
- 105.CRC Handbook of Chemistry and Physics. 82. CRC Press LLC; 2001. [Google Scholar]
- 106.Taura T. Bull Chem Soc Jpn. 1990;63:1105–1110. [Google Scholar]
- 107.Koehl P. Prog Nucl Magn Reson Spectrosc. 1999;34:257–299. [Google Scholar]
- 108.Adamo C, Barone V. J Chem Phys. 1998;108:664–675. [Google Scholar]
- 109.Tomasi J, Mennucci B, Cammi R. Chem Rev. 2005;105:2999–3094. doi: 10.1021/cr9904009. [DOI] [PubMed] [Google Scholar]
- 110.Hay PJ. J Chem Phys. 1977;66:4377–4384. [Google Scholar]
- 111.Wachters AJH. J Chem Phys. 1970;52:1033–1036. [Google Scholar]
- 112.Dunning TH. J Chem Phys. 1971;55:716–723. [Google Scholar]
Associated Data
This section collects any data citations, data availability statements, or supplementary materials included in this article.


