Abstract
This study aimed to explore the underlying mechanism of relapsed acute lymphoblastic leukemia (ALL).
Datasets of GSE28460 and GSE18497 were downloaded from Gene Expression Omnibus (GEO). Differentially expressed genes (DEGs) between diagnostic and relapsed ALL samples were identified using Limma package in R, and a Venn diagram was drawn. Next, functional enrichment analyses of co-regulated DEGs were performed. Based on the String database, protein–protein interaction network and module analyses were also conducted. Moreover, transcription factors and miRNAs targeting co-regulated DEGs were predicted using the WebGestalt online tool.
A total of 71 co-regulated DEGs were identified, including 56 co-upregulated genes and 15 co-downregulated genes. Functional enrichment analyses showed that upregulated DEGs were significantly enriched in the cell cycle, and DNA replication, and repair related pathways. POLD1, MCM2, and PLK4 were hub proteins in both protein–protein interaction network and module, and might be potential targets of E2F. Additionally, POLD1 and MCM2 were found to be regulated by miR-520H via E2F1.
High expression of POLD1, MCM2, and PLK4 might play positive roles in the recurrence of ALL, and could serve as potential therapeutic targets for the treatment of relapsed ALL.
Keywords: acute lymphoblastic leukemia, cell cycle, differentially expressed gene, relapse
1. Introduction
Acute lymphoblastic leukemia (ALL) is a heterogeneous group of disorders originating from B and T progenitor cells [1], and accounts for the most frequent blood malignancy of childhood.[2] Although the survival rate of childhood malignancy has increased to approximately 90% compared to 10% in the 1960s with the development of medical technology,[3,4] relapsed ALL remains the leading cause of cancer-related mortality during childhood.[5,6] It has been reported that the overall survival rate of relapsed B-ALL is only 35% to 40%, even treated with stem cell transplantation or intensified chemotherapy[7,8], and this condition shows a lower survival in adults than in children.[9] Therefore, it is important to reveal the molecular mechanisms of relapsed ALL to develop more effective therapeutic methods for improving the survival rate of patients suffering from relapsed ALL.
With the development of sequencing techniques, genome sequencing has been widely used to identify potential biomarkers and therapeutic targets based on variations in gene expression. Yang et al[10] have identified that children with ALL with the CC genotype at rs116855232 of NUDT15 have higher mercaptopurine resistance (83.5%) than those with the TT and TC genotypes. Perez-Andreu et al[11] have reported that the risk allele at rs3824662 GATA3 is one of the most frequent in Philadelphia chromosome (Ph)-like ALL, which also increases susceptibility to non-Ph-like ALL in adults and adolescents. Additionally, Paulsson et al[12] have documented that the RTK-RAS pathway and its modifiers perform critical roles in the hyperdiploid 51–67 chromosomes ALL, which is one of the most frequent types of ALL. Moreover, Fischer et al[13] have demonstrated that enriched stem cell and myeloid characteristics in TCF3-HLF signatures may result in strong drug resistance to traditional chemotherapeutics, but sensitivity to glucocorticoids in ALL. Besides, microRNAs (miRNAs) are also identified to be involved in the pathogenesis of ALL. Agirre et al[14] have demonstrated that miRNA-124a confers a poor prognosis in ALL, and Schotte et al[15] have documented that miR-196b and miR-708 are closely associated with the subtypes of ALL. However, few studies have examined relapsed ALL, and only a very small number of genes have been identified to be differentially expressed between diagnosis and relapse of ALL.[16]
To reveal the potential molecule mechanism of relapsed ALL, 2 datasets of GSE28460 and GSE18497 were deposited by Hogan et al[17] and Staal et al,[18] respectively. For GSE28460, Hogan et al[17] have revealed that diverse genetic changes from diagnosis to relapse, and methylation analysis showed that the Wnt and mitogen-activated protein kinase pathway may be involved in these variations. Additionally, for GSE18497, Staal et al[18] have not only found that differentially expressed genes (DEGs) between diagnosis and relapsed ALL are strongly associated with the changes in cell cycle, DNA replication and repair, and that upregulated genes in ALL are involved in colon cancer and ubiquitination. Other studies utilized these 2 datasets to identify DEGs,[16] potential markers,[19] and therapeutic methods for B-ALL.[20] However, how these changes occur remains unclear. In the present study, to further uncover the underlying mechanism of relapsed ALL, DEGs were screened between diagnosis and relapsed based on the GSE28460 and GSE18497 datasets; biofunctional enrichment and transcriptional factor prediction were performed to provide insight into the understanding and treatment of relapsed ALL.
2. Materials and methods
2.1. Data sourcing
The gene expression files for GSE28460[17] and GSE18497[18] were downloaded from the Gene Expression Omnibus (GEO, http://www.ncbi.nlm.nih.gov/geo/) database. Specifically, 98 ALL bone marrow samples were included in GSE28460, including 49 diagnosis cases and 49 relapse cases. Construction of this dataset was approved by the institutional review board of all participating institutions, and informed consent was obtained from all patients. There were 41 matched diagnosis and relapse pairs of ALL bone marrow samples included in GSE18497,[18] and microarrays performed according to consensus guide-lines described for leukemia analyses by 3 European networks. Both of these 2 datasets were sequenced on the platform of GPL570 [HG-U133_Plus_2] Affymetrix Human Genome U133 Plus 2.0 Array.
2.2. Identification of DEGs
Raw data in CEL format was downloaded from the GEO database, and Affy package in R (Version 1.54.0, http://www.bioconductor.org/packages/release/bioc/html/affy.html)[21] was used for data preprocessing, including background correction, normalization, and expression calculation. According to the annotation files, unmatched gene probes were removed, and expression of matched genes was calculated. For several probes matched to a specific gene, the mean value of different probes was computed, and used as the expression value of the gene. Next, the Bayes method provided by Limma package in R (version 3.10.3, http://www.bioconductor.org/packages/2.9/bioc/html/limma.html)[22] was used to compare gene expression between diagnosis and relapse samples, and DEG was considered when P < .05.
2.3. VENN diagram
Venn diagram is a R package that allows to visualize all aspects of the generated diagram.[23] In the present study, the online tool VENNY (Version2.1, http://bioinfogp.cnb.csic.es/tools/venny/index.html)[24] was used to Venn diagram analysis to identify co-regulated DEGs between the analyzed datasets.
2.4. Gene ontology (GO) and pathway enrichment analyses
DAVID is an online tool commonly used for bioinformatics analysis. In the present study, DAVID (version 6.8, https://david-d.ncifcrf.gov/)[25] was used to perform GO- biological process (BP) enrichment analysis of co-regulated DEGs. Significant GO enrichment was considered at a gene count ≥2 and P < .05. Additionally, based on the Reactome Pathway database (Reactome version 61, http://reactome.org/), [26] pathway enrichment analysis of co-regulated DEGs was conducted using DAVID.
2.5. Protein–protein interaction (PPI) network and module analyses
According to the PPI pairs provided by the STRING (version 10.0, http://www.string-db.org/) database,[27] PPIs among proteins encoded by co-regulated DEGs were predicted with PPI score ≥0.15 as a threshold to obtain the greatest number of PPI pairs. Followed by this, the PPI network was visualized using Cytoscape (version 3.2.0, http://www.cytoscape.org/). For the parameter without weight, the topological properties of nodes involved in this network were analyzed using plug-in CytoNCA (version 2.1.6, http://apps.cytoscape.org/apps/cytonca)[28] in Cytoscape. According to the final score, the hub nodes were screened in this network. Bio-functional modules in the PPI network were screened using a plug-in MCODE (version 1.4.2, http://apps.cytoscape.org/apps/MCODE) in Cytoscape with an enriched score >5 as the threshold.
2.6. Transcription factor (TF)-target regulatory network analysis
The WEB-based Gene SeT Analysis Toolkit (WebGestalt, http://www.webgestalt.org/option.php) is a functional enrichment analysis online tool used for bioinformatics analysis.[29] In the present study, WebGestalt was used to perform TF enrichment analysis of co-regulated DEGs, and P < .05 was considered significant. Based on the significant enriched regulatory pairs, the TF-target regulatory network was visualized using Cytoscape.
2.7. Construction of miRNA-TF-target regulatory network
Using WebGestalt, co-regulated DEG-related miRNAs were predicted using the threshold of P < .05. Additionally, regulatory relationships between miRNAs and TFs were predicted. Next, the miRNA-TF-target regulatory network was visualized using Cytoscape.
3. Results
3.1. Identification of DEGs and co-regulated DEGs
According to the selected criterion, DEGs of the 2 datasets were screened. Specifically, a total of 1674 DEGs were identified in GSE28460, including 1014 upregulated genes and 660 downregulated genes. Additionally, 508 DEGs were identified in the GSE18497 dataset, including 234 upregulated genes and 274 downregulated genes.
Subsequently, based on the identified DEGs, co-regulated DEGs were screened between these 2 datasets using the VENNY tool. A total of 71 co-regulated DEGs were identified, including 56 co-upregulated DEGs (Fig. 1A) and 15 co-downregulated DEGs (Fig. 1B).
Figure 1.
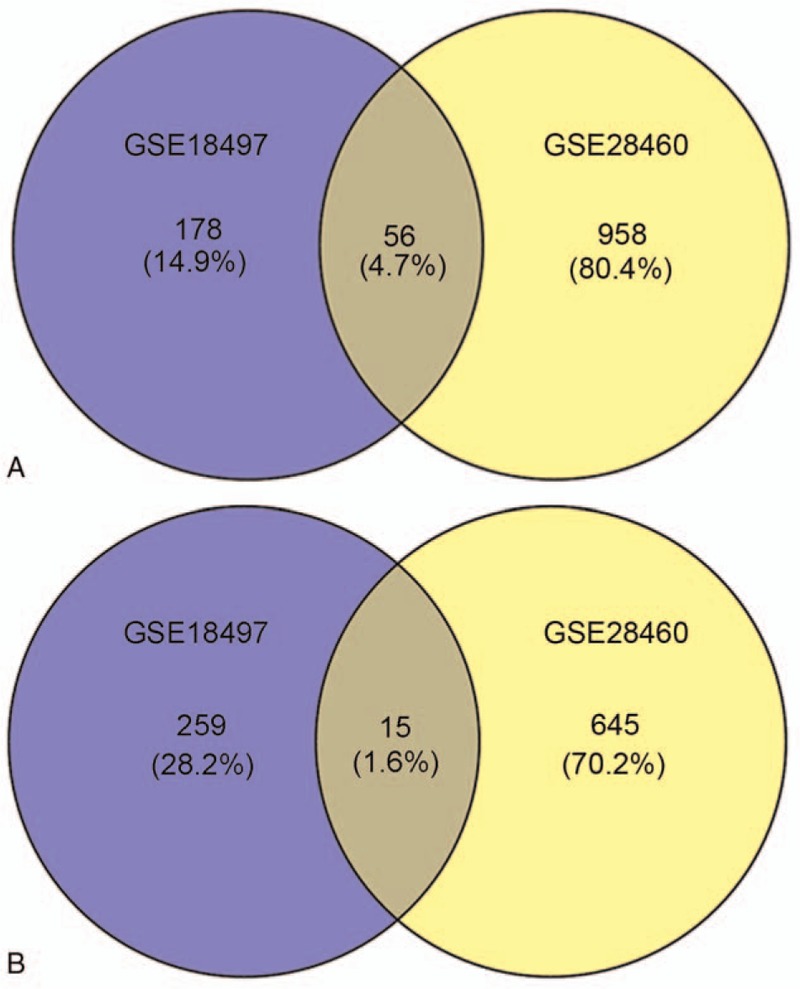
Venn diagram for co-regulated DEGs. (A) Co-upregulated DEGs and (B) co-downregulated DEGs. DEGs = differentially expressed genes.
3.2. GO and pathway enrichment analyses
For further analysis, functional enrichment analyses of co-regulated DEGs were conducted using the DAVID online tool. As a result, co-upregulated DEGs were significantly enriched in 15 GO-BP terms, and most were mitosis- and cell cycle-related biological processes, including the G1/S transition of mitotic cell cycle (P = 2.20 × 10⁻⁴), cell cycle (P = 4.13 × 10−04), DNA replication (P = .0011), and so on. The top 10 are tabulated in Table 1. However, only 1 GO-BP term was significantly enriched by the co-downregulated DEGs, namely protein glycosylation GO-BP term (P = .040) (Fig. 2A).
Table 1.
The top 10 GO-BP terms enriched by co-upregulated DEGs.

Figure 2.
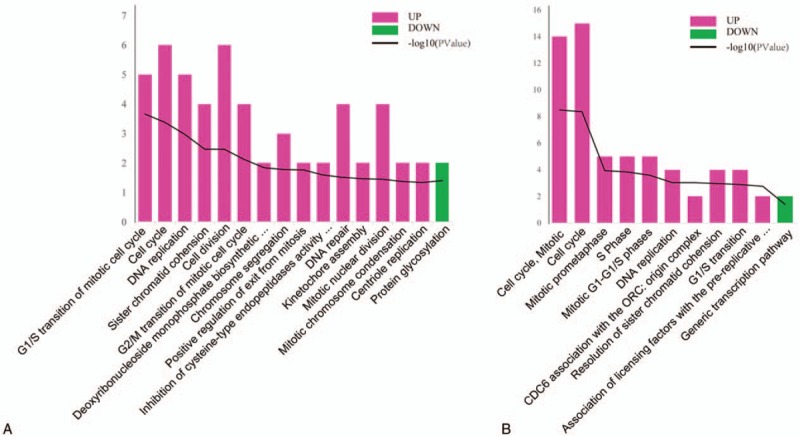
Functional enrichment for co-regulated DEGs. (A) The top 10 significantly enriched GO-BP terms for upregulated DEGs and 1 term for downregulated DEGs. (B) The top 10 significantly enriched pathways for upregulated DEGs and 1 pathway for downregulated DEGs. Red represents the upregulated terms, and green represents the downregulated terms. DEGs = differentially expressed genes, GO = gene ontology, and BP = biological process.
The co-upregulated DEGs were significantly enriched in 43 pathways, mostly mitosis- and cell cycle-related pathways, such as cell cycle, mitotic (P = 3.28 × 10−09), cell cycle (P = 4.25 × 10−09), and mitotic prometaphase (P = .00012). The top 10 are tabulated in Table 2. As in the GO-BP analytical results, only 1 pathway was significantly enriched by co-downregulated DEGs, the genetic transcription pathway (P = .041) (Fig. 2B).
Table 2.
The top 10 KEGG pathways enriched by co-upregulated DEGs.

3.3. PPI network and module analyses
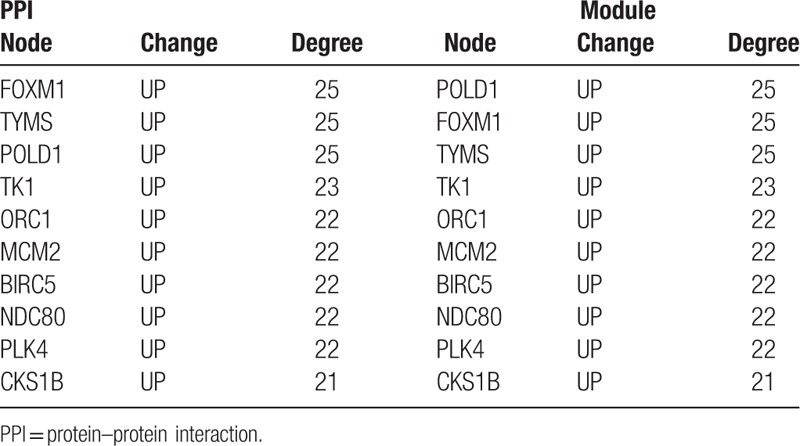
Based on the STRING database, the PPI network was constructed, including 50 nodes (co-regulated DEGs encoded proteins) and 253 regulatory relationship pairs (Fig. 3A). Additionally, a significant functional module was screened out from this PPI network with a module score = 18.423 (Fig. 3B). According to the node degrees, the top 10 nodes in PPI are tabulated in Table 3, including FOXM1 (degree = 25), TYMS (degree = 25), POLD1 (degree = 25), MCM2 (degree = 22), PLK4 (degree = 22), and so on. There were 20 nodes and 175 regulatory relationship pairs included in this module, and all proteins involved in this module were encoded by co-upregulated DEGs. According to the node degrees, the top 10 nodes in the module are tabulated in Table 3, including FOXM1 (degree = 25), TYMS (degree = 25), POLD1 (degree = 25), MCM2 (degree = 22), PLK4 (degree = 22), and so on.
Figure 3.
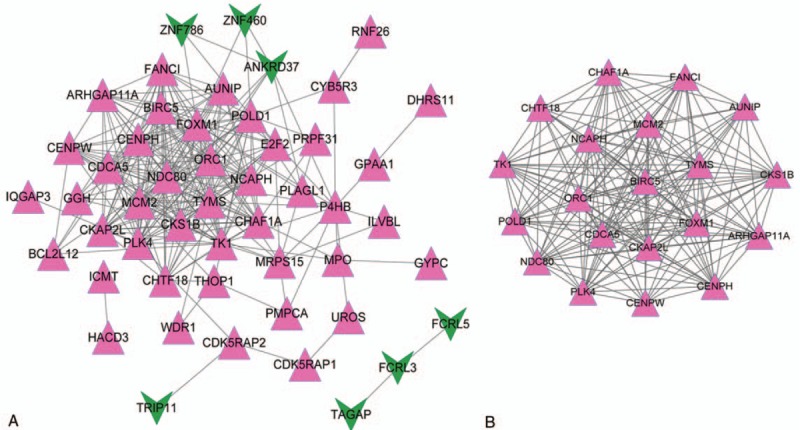
PPI and module analyses for co-regulated DEGs. (A) PPI network and (B) module. Red triangle represents the upregulated protein, and green arrow represents the downregulated protein. DEGs = differentially expressed genes, PPI = protein–protein interaction.
Table 3.
The top 10 nodes involved in PPI network and module.
3.4. Construction of TF-target regulatory network
Based on the relationship pairs predicted by WebGestalt, the TF-target regulatory network was constructed using Cytoscape (Fig. 4). There were 20 nodes and 35 regulatory relationships included in the TF-target regulatory network. Specifically, 8 of 20 were TFs, including NRF1 (degree = 7), E2F (degree = 6), E2F1 (degree = 4), E2F1DP1 (degree = 4), E2F1DP2 (degree = 4), E2F4DP2 (degree = 4), E2F4DP1 (degree = 3), and E2F1DP1RB (degree = 3).
Figure 4.
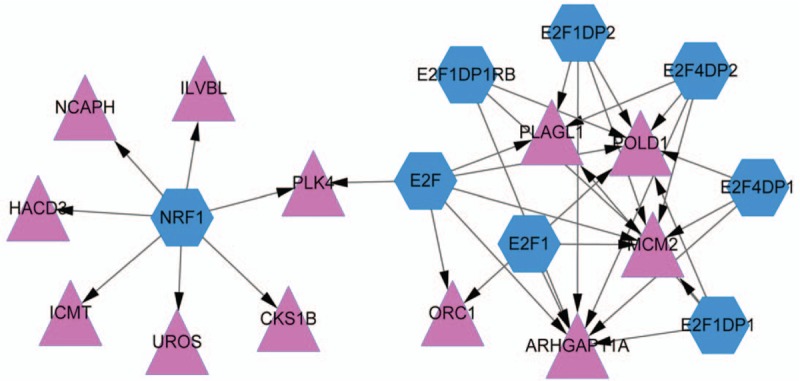
TF-target regulatory network. Red triangle represents the upregulated protein, and blue hexagon represents TF. TF = transcription factor.
3.5. MiRNA-TF-target regulatory network
According to the results predicted by WebGestalt, the miRNA-TF-target regulatory network was constructed using Cytoscape (Fig. 5). In this network, 2 significant miRNAs: miR-520G and miR-520H were significantly enriched, and both CKS1B and WDR1 could be targeted by these 2 miRNAs. Moreover, E2F1 was the common target TF of miR-520G and miR-520H.
Figure 5.
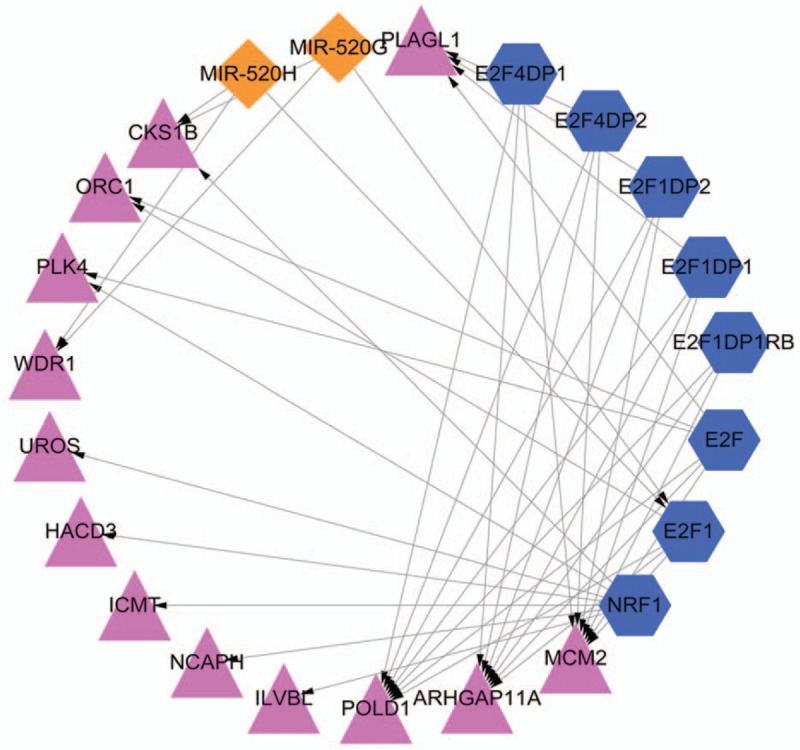
miRNA-TF-target regulatory network. Red triangle represents the upregulated protein, blue hexagon represents TF, and orange diamond represents miRNA. miRNA = microRNA, TF = transcription factor.
4. Discussion
In the present study, a total of 71 co-regulated DEGs were identified between GSE28460 and GSE18497, including 56 upregulated genes and 15 downregulated genes. Functional enrichment of these DEGs indicated that co-upregulated genes were significantly enriched cell cycle and DNA replication and repair related GO-BP terms, as well as cell cycle and mitosis related pathways. Additionally, downregulated DEGs were significantly enriched in the protein glycosylation GO-BP term and genetic transcription pathway. Further analyses showed that POLD1, MCM2, and PLK4 were hub nodes in the PPI network and module and could be upregulated by E2F.
POLD1, coding for DNA polymerase delta 1 (POLD1), is a catalytic subunit of the DNA polymerase δ, which is reported to be an important target of p53 tumor suppressor.[30] Functional enrichment analyses showed that POLD1 was significantly enriched in the cell cycle and DNA replication related pathway, which is consistent with the results described above. A previous study showed that a deficiency inDNA polymerase δ proofreading is strongly associated with a high incidence of epithelial cancers.[31] Germline mutations in POLD1 perform a critical role in family colorectal cancer.[32,33] Moreover, Staal et al[18] found that ALL and colon cancer share some upregulated genes, and the colon was identified as an important location for relapsed ALL.[34,35] Thus, POLD1 might play a crucial role in relapsed ALL, while few studies have examined the role of POLD1 in ALL. In the present study, POLD1 was identified to be significantly upregulated in relapsed ALL than diagnosis, and predicted to be a target of E2F, a transcription factor targets for the RB protein.[36,37] A previous study demonstrated that E2F participates the regulation of gene promoter methylation,[38] which may explain the upregulation of POLD1.
MCM2, which codes for minichromosome maintenance complex component 2 (MCM2), was also identified to be targeted by E2F and significantly upregulated in relapsed ALL in this study. Richet et al[39] identified that MCM2 acts as a chaperone for histone interactions with ASF1 at the replication fork. Moreover, several studies demonstrated that MCM2 performs a critical role in forming the prereplication complex and replication fork.[40–42] In the present study, functional enrichment analyses showed that MCM2 and POLD1 were significantly in the mitotic G1-G1/S phases and S phase related pathways. Liu et al[43] documented that the long noncoding RNA FTX inhibits the proliferation and metastasis of hepatocellular carcinoma by binding MCM2. Thus, MCM2 might also play an important role in the replication of tumor cells involved in relapsed ALL. Additionally, in the present study, MCM2 was found to interact with multiple proteins in the PPI network, such as FOXM1, POLD1, and PLK4, but whether these proteins could form a replication complex requires further analysis.
PLK4, which codes of polo like kinase 4 (PLK4), is another upregulated gene targeted by E2F. Dementyeva et al[44] found that expression of PLK4 is significantly elevated in multiple myeloma. Ward et al[45] showed that deregulated methylation of PLKs, including PLK4, is a potential biomarker in hematological malignancies. Therefore, high expression of PLK4 in ALL might contribute to the deregulation of methylation on its promoter by E2F, which was also suggested as an effect of upregulation of POLD1 in the current study. Kazazian et al[46] reported that PLK4 promotes cancer invasion and metastasis via Arp2/3 complex regulation of the actin cytoskeleton. Moreover, several studies revealed that PLK4 can interact with Cep192, Cep152,[47] STIL,[48,49] and CDK1,[50] or regulated by others, such as E3 ubiquitin ligase Mib1[51] and KAT2,[52] to affect centriole biogenesis resulting in abnormalities in cell proliferation. Further biofunctional enrichment analysis also showed that PLK4 was significantly enriched in mitotic related pathways. These findings indicated that high levels of PLK4 promote the relapse of ALL by facilitating the cell cycle. Thus, PLK4 might be considered as a potential diagnostic marker or therapeutic target for the treating relapsed ALL.
E2F1 is another E2F family TF found to target both POLD1 and MCM2 in the current study. Nagel et al[53] revealed that overexpression of miR-17-92 suppresses the apoptosis of ALL by decreasing the expression of E2F1. Additionally, Kojima et al[54] showed that E2F1 and P53 can be significantly induced by the tryptamine derivative JNJ-26854165 to increase the apoptosis of ALL. These findings indicated that E2F1 played a negative role in the development of ALL. In this study, E2F1 was identified to be regulated by miR-520H. Previous studies revealed that miR-520H plays an important role in the stem cell maintenance[55] and differentiation of HSC,[56] and with lower expressed in T lymphocytes and high expression in CD34+ cells.[57] Su et al[58] identified that high level of miR-520H is closely related to the poor prognosis of breast cancer. Moreover, downregulation of miR-520H via E1A has an anticancer effect.[59] Bioinformatics analysis showed that the expression of miR-520H is inversely correlated with the expression levels of its targets.[56] Hence, these findings suggested that miR-520H might downregulated the expression of E2F1 to increase the expression of POLD1 and MCM2, promoting ALL relapse.
There are some limitations that should be strengthened in the present study. First, the results were obtained using a bioinformatics analysis. Therefore, some potential important genes/proteins might have been ignored because the parameters were selected manually. Second, analysis of the event-free survival rate of relapsed ALL was limited because of deficiencies in the clinical data. Finally, because clinical samples were difficult to collect from relapsed ALL patients, the expression levels of important DEGs, such as PLK4, POLD1, and MCM2, were not validated in an experimental manner.
5. Conclusion
In conclusion, POLD1, MCM2, and PLK4 played important roles in regulating cell cycle- and DNA replication-related pathways. E2F could upregulate the expression levels of POLD1, MCM2, and PLK2 by deregulating the methylations of their promoters to promote the relapse of ALL. Additionally, miR-520H could upregulate the expression levels of POLD1 and MCM2 via E2F1. Hence, POLD1, MCM2, and PLK4 might serve as potential diagnostic markers and therapeutic targets for treating relapsed ALL.
Author contributions
Conceptualization: Dah-Ching Ding.
Data curation: Dah-Ching Ding.
Formal analysis: Dah-Ching Ding.
Funding acquisition: Dah-Ching Ding.
Investigation: Dah-Ching Ding.
Methodology: Chengzhong Wang, Weidong Liu.
Resources: Sheng Li.
Software: Weikai Wang.
Supervision: Guiqin Zhang.
Writing – original draft: I-Ching Huang, Pei-Chen Li.
Writing – review & editing: Dah-Ching Ding.
Footnotes
Abbreviations: ALL = acute lymphoblastic leukaemia, BP = biological process, DEGs = differentially expressed genes, GEO = Gene Expression Omnibus, GO = gene ontology, miRNA = microRNA, PPI = protein–protein interaction.
The authors declare that they have no competing interests.
References
- [1].Ribera J-M. Hentrich M, Barta SK. Acute lymphoblastic leukemia. HIV-associated Hematological Malignancies. Cham: Springer International Publishing; 2016. 145–51. [Google Scholar]
- [2].Diaz-Flores E, Comeaux EQ, Kim K, et al. BCL-2, a therapeutic target for high risk hypodiploid B-cell acute lymphoblastic leukemia. Blood 2016;128:280–1280. [Google Scholar]
- [3].Allen B, Migliorati C, Rowland C, et al. Comparison of mandibular cortical thickness and QCT-derived bone mineral density (BMD) in survivors of childhood acute lymphoblastic leukemia: a retrospective study. Int J Paediatr Dent 2016;26:330. [DOI] [PMC free article] [PubMed] [Google Scholar]
- [4].Tomizawa D, Kiyokawa N. Ishii E. Acute lymphoblastic leukemia. Hematological Disorders in Children: Pathogenesis and Treatment. Singapore: Springer Singapore; 2017. 33–60. [Google Scholar]
- [5].Ma X, Edmonson M, Yergeau D, et al. Rise and fall of subclones from diagnosis to relapse in pediatric B-acute lymphoblastic leukaemia. Nat Commun 2015;6:6604. [DOI] [PMC free article] [PubMed] [Google Scholar]
- [6].Ding L, Sun QY, Tan KT, et al. Mutational landscape of pediatric acute lymphoblastic leukemia. Cancer Res 2017;77:390. [DOI] [PMC free article] [PubMed] [Google Scholar]
- [7].Parker C, Waters AR, Leighton CC, et al. Effect of mitoxantrone on outcome of children with first relapse of acute lymphoblastic leukaemia (ALL R3): an open-label randomised trial. Lancet 2010;376:2009–17. [DOI] [PMC free article] [PubMed] [Google Scholar]
- [8].Tallen G, Ratei R, Mann G, et al. Long-term outcome in children with relapsed acute lymphoblastic leukemia after time-point and site-of-relapse stratification and intensified short-course multidrug chemotherapy: results of trial ALL-REZ BFM 90. J Clin Oncol 2010;28:2339–47. [DOI] [PubMed] [Google Scholar]
- [9].John Wiley & Sons, Ltd, Zakout G, Fielding AK. Acute lymphoblastic leukemia. Clinical Manual of Blood and Bone Marrow Transplantation 2017;80–88. [Google Scholar]
- [10].Yang JJ, Landier W, Yang W, et al. Inherited NUDT15 variant is a genetic determinant of mercaptopurine intolerance in children with acute lymphoblastic leukemia. J Clin Oncol 2015;33:1235. [DOI] [PMC free article] [PubMed] [Google Scholar]
- [11].Perez-Andreu V, Roberts KG, Xu H, et al. A genome-wide association study of susceptibility to acute lymphoblastic leukemia in adolescents and young adults. Blood 2014;125:680. [DOI] [PMC free article] [PubMed] [Google Scholar]
- [12].Paulsson K, Lilljebjorn H, Biloglav A, et al. The genomic landscape of high hyperdiploid childhood acute lymphoblastic leukemia. Nat Genet 2015;47:672–6. [DOI] [PubMed] [Google Scholar]
- [13].Fischer U, Forster M, Rinaldi A, et al. Genomics and drug profiling of fatal TCF3-HLF-positive acute lymphoblastic leukemia identifies recurrent mutation patterns and therapeutic options. Nat Genet 2015;47:1020–9. [DOI] [PMC free article] [PubMed] [Google Scholar]
- [14].Agirre X, Vilas-Zornoza A, Jiménez-Velasco A, et al. Epigenetic silencing of the tumor suppressor microRNA Hsa-miR-124a regulates CDK6 expression and confers a poor prognosis in acute lymphoblastic leukemia. Cancer Res 2009;69:4443–53. [DOI] [PubMed] [Google Scholar]
- [15].Schotte D, Chau JC, Sylvester G, et al. Identification of new microRNA genes and aberrant microRNA profiles in childhood acute lymphoblastic leukemia. Leukemia 2009;23:313–22. [DOI] [PubMed] [Google Scholar]
- [16].Chow YP, Alias H, Jamal R. Meta-analysis of gene expression in relapsed childhood B-acute lymphoblastic leukemia. BMC Cancer 2017;17:120. [DOI] [PMC free article] [PubMed] [Google Scholar]
- [17].Hogan LE, Meyer JA, Yang J, et al. Integrated genomic analysis of relapsed childhood acute lymphoblastic leukemia reveals therapeutic strategies. Blood 2011;118:5218–26. [DOI] [PMC free article] [PubMed] [Google Scholar]
- [18].Staal FJ, De RD, Szczepanski T, et al. Genome-wide expression analysis of paired diagnosis-relapse samples in ALL indicates involvement of pathways related to DNA replication, cell cycle and DNA repair, independent of immune phenotype. Leukemia 2010;24:491–9. [DOI] [PubMed] [Google Scholar]
- [19].Ardjmand A, Bock CED, Shahrokhi S, et al. Fat1 cadherin provides a novel minimal residual disease marker in acute lymphoblastic leukemia. Hematology 2013;18:315. [DOI] [PubMed] [Google Scholar]
- [20].Uckun FM, Sanjive Q, Ma H, et al. A rationally designed nanoparticle for RNA interference therapy in B-lineage lymphoid malignancies. EBioMedicine 2014;1:141. [DOI] [PMC free article] [PubMed] [Google Scholar]
- [21].Gautier L, Cope L, Bolstad BM, et al. affy—analysis of Affymetrix GeneChip data at the probe level. Bioinformatics 2004;20:307–15. [DOI] [PubMed] [Google Scholar]
- [22].Smyth GK, Ritchie M, Thorne N. Gentleman Hentrich R, Carey V, Huber W, et al. LIMMA: linear models for microarray data. Bioinformatics and Computational Biology Solutions Using R and Bioconductor. New York: Springer Verlag; 2005;Statistics for Biology and Health. [Google Scholar]
- [23].Chen H, Boutros PC. VennDiagram: a package for the generation of highly-customizable Venn and Euler diagrams in R. BMC Bioinformatics 2011;12:35. [DOI] [PMC free article] [PubMed] [Google Scholar]
- [24].VENNY Oliveros J. An interactive tool for comparing lists with Venn Diagrams (2007–2015). http://bioinfogp.cnb.csic.es/tools/venny/index.html. [Google Scholar]
- [25].Huang DW, Sherman BT, Lempicki RA. Systematic and integrative analysis of large gene lists using DAVID bioinformatics resources. Nat Protoc 2009;4:44. [DOI] [PubMed] [Google Scholar]
- [26].Joshi-Tope G, Gillespie M, Vastrik I, et al. Reactome: a knowledgebase of biological pathways. Nucleic Acids Res 2005;33suppl 1:D428–32. [DOI] [PMC free article] [PubMed] [Google Scholar]
- [27].Szklarczyk D, Franceschini A, Wyder S, et al. STRING v10: protein–protein interaction networks, integrated over the tree of life. Nucleic Acids Res 2014;43:D447–52. [DOI] [PMC free article] [PubMed] [Google Scholar]
- [28].Tang Y, Li M, Wang J, et al. CytoNCA: a cytoscape plugin for centrality analysis and evaluation of protein interaction networks. Biosystems 2015;127:67–72. [DOI] [PubMed] [Google Scholar]
- [29].Zhang B, Kirov S, Snoddy J. WebGestalt: an integrated system for exploring gene sets in various biological contexts. Nucleic Acids Res 2005;33:W741. [DOI] [PMC free article] [PubMed] [Google Scholar]
- [30].Li B, Lee MY. Transcriptional regulation of the human DNA polymerase delta catalytic subunit gene POLD1 by p53 tumor suppressor and Sp1. J Biol Chem 2001;276:29729. [DOI] [PubMed] [Google Scholar]
- [31].Goldsby RE, Hays LE, Chen X, et al. High incidence of epithelial cancers in mice deficient for DNA polymerase δ proofreading. Proc Natl Acad Sci U S A 2002;99:15560–5. [DOI] [PMC free article] [PubMed] [Google Scholar]
- [32].Valle L, Hernández-Illán E, Bellido F, et al. New insights into POLE and POLD1 germline mutations in familial colorectal cancer and polyposis. Hum Mol Genet 2014;23:3506. [DOI] [PubMed] [Google Scholar]
- [33].Fernando B, Marta P, Gemma A, et al. POLEandPOLD1mutations in 529 kindred with familial colorectal cancer and/or polyposis: review of reported cases and recommendations for genetic testing and surveillance. Genet Med 2016;18:325–32. [DOI] [PMC free article] [PubMed] [Google Scholar]
- [34].Oshima K, Khiabanian H, da Silva-Almeida AC, et al. Mutational landscape, clonal evolution patterns, and role of RAS mutations in relapsed acute lymphoblastic leukemia. Proc Natl Acad Sci U S A 2016;113:11306–11. [DOI] [PMC free article] [PubMed] [Google Scholar]
- [35].Ding L, Ley TJ, Larson DE, et al. Clonal evolution in relapsed acute myeloid leukemia revealed by whole genome sequencing. Nature 2012;481:506. [DOI] [PMC free article] [PubMed] [Google Scholar]
- [36].Chellappan SP, Hiebert S, Mudryj M, et al. The E2F transcription factor is a cellular target of the RB protein. Cell 1991;65:1053–61. [DOI] [PubMed] [Google Scholar]
- [37].Carr SM, Munro S, Zalmas L-P, et al. Lysine methylation-dependent binding of 53BP1 to the pRb tumor suppressor. Proc Natl Acad Sci U S A 2014;111:11341–6. [DOI] [PMC free article] [PubMed] [Google Scholar]
- [38].Robertson KD, Ait-Si-Ali S, Yokochi T, et al. DNMT1 forms a complex with Rb, E2F1 and HDAC1 and represses transcription from E2F-responsive promoters. Nat Genet 2000;25:338–42. [DOI] [PubMed] [Google Scholar]
- [39].Richet N, Liu D, Legrand P, et al. Structural insight into how the human helicase subunit MCM2 may act as a histone chaperone together with ASF1 at the replication fork. Nucleic Acids Res 2015;43:1905–17. [DOI] [PMC free article] [PubMed] [Google Scholar]
- [40].Tüfekçi Ö, Yandim MK, Ören H, et al. Targeting FoxM1 transcription factor in T-cell acute lymphoblastic leukemia cell line. Leukemia Res 2015;39:342–7. [DOI] [PubMed] [Google Scholar]
- [41].Wang Z, Xu F, Yuan N, et al. Rapamycin inhibits pre-B acute lymphoblastic leukemia cells by downregulating DNA and RNA polymerases. Leuk Res 2014;38:940–7. [DOI] [PubMed] [Google Scholar]
- [42].Sincennes M-C, Humbert M, Grondin B, et al. The LMO2 oncogene regulates DNA replication in hematopoietic cells. Proc Natl Acad Sci U S A 2016;113:1393–8. [DOI] [PMC free article] [PubMed] [Google Scholar]
- [43].Liu F, Yuan J, Huang J, et al. Long noncoding RNA FTX inhibits hepatocellular carcinoma proliferation and metastasis by binding MCM2 and miR-374a. Oncogene 2016;35:5422–34. [DOI] [PubMed] [Google Scholar]
- [44].Dementyeva E, Kryukov F, Kubiczkova L, et al. Clinical implication of centrosome amplification and expression of centrosomal functional genes in multiple myeloma. J Transl Med 2013;11:77. [DOI] [PMC free article] [PubMed] [Google Scholar]
- [45].Ward A, Sivakumar G, Kanjeekal S, et al. The deregulated promoter methylation of the Polo-like kinases as a potential biomarker in hematological malignancies. Leuk Lymphoma 2015;56:2123. [DOI] [PubMed] [Google Scholar]
- [46].Kazazian K, Go CD, Wu H, et al. Plk4 promotes cancer invasion and metastasis through Arp2/3 complex regulation of the actin cytoskeleton. Cancer Res 2017;77:434. [DOI] [PubMed] [Google Scholar]
- [47].Sonnen KF, Gabryjonczyk AM, Anselm E, et al. Human Cep192 and Cep152 cooperate in Plk4 recruitment and centriole duplication. J Cell Sci 2013;126(pt 14):3223. [DOI] [PubMed] [Google Scholar]
- [48].Arquint C, Gabryjonczyk AM, Imseng S, et al. STIL binding to Polo-box 3 of PLK4 regulates centriole duplication. Elife 2015;4: doi: 10.7554/eLife.07888. [DOI] [PMC free article] [PubMed] [Google Scholar]
- [49].Ohta M, Ashikawa T, Nozaki Y, et al. Direct interaction of Plk4 with STIL ensures formation of a single procentriole per parental centriole. Nat Commun 2014;5:5267. [DOI] [PMC free article] [PubMed] [Google Scholar]
- [50].Zitouni S, Francia ME, Leal F, et al. CDK1 prevents unscheduled PLK4-STIL complex assembly in centriole biogenesis. Curr Biol 2016;26:1127. [DOI] [PMC free article] [PubMed] [Google Scholar]
- [51].Glatter LČ, Nigg T, Nigg EA. The E3 ubiquitin ligase Mib1 regulates Plk4 and centriole biogenesis. J Cell Sci 2015;128:1674. [DOI] [PubMed] [Google Scholar]
- [52].Fournier M, Tora L. KAT2-mediated PLK4 acetylation contributes to genomic stability by preserving centrosome number. Mol Cell Oncol 2017;4:e1270391. [DOI] [PMC free article] [PubMed] [Google Scholar]
- [53].Nagel S, Venturini L, Przybylski GK, et al. Activation of miR-17-92 by NK-like homeodomain proteins suppresses apoptosis via reduction of E2F1 in T-cell acute lymphoblastic leukemia. Leuk Lymphoma 2009;50:101. [DOI] [PubMed] [Google Scholar]
- [54].Kojima K, Burks JK, Arts J, et al. The novel tryptamine derivative JNJ-26854165 induces wild-type p53- and E2F1-mediated apoptosis in acute myeloid and lymphoid leukemias. Mol Cancer Ther 2010;9:2545. [DOI] [PMC free article] [PubMed] [Google Scholar]
- [55].Liao R, Sun J, Zhang L, et al. MicroRNAs play a role in the development of human hematopoietic stem cells †. J Cell Biochem 2008;104:805–17. [DOI] [PubMed] [Google Scholar]
- [56].Merkerova M, Vasikova A, Belickova M, et al. expression profiles in umbilical cord blood cell lineages. Stem Cells Dev 2010;19:17–26. [DOI] [PubMed] [Google Scholar]
- [57].Havelange V, Garzon R. MicroRNAs: emerging key regulators of hematopoiesis. Am J Hematol 2010;85:935–42. [DOI] [PubMed] [Google Scholar]
- [58].Su CM, Wang MY, Hong CC, et al. miR-520h is crucial for DAPK2 regulation and breast cancer progression. Oncogene 2016;35:1134. [DOI] [PubMed] [Google Scholar]
- [59].Su JL, Chen PB, Chen YH, et al. Downregulation of microRNA miR-520h by E1A contributes to anticancer activity. Cancer Res 2010;70:5096. [DOI] [PMC free article] [PubMed] [Google Scholar]


