Abstract
It has been recently reported that insulin recruits a novel signaling machinery to lipid rafts required for insulin-stimulated GLUT4 translocation [Baumann, A., Ribon, V., Kanzaki, M., Thurmond, D. C., Mora, S., Shigematsu, S., Bickel, P. E., Pessin, J. E. & Saltiel, A. R. (2001) Nature 407, 202–207, 2000; Chiang, S. H., Baumann, C. A., Kanzaki, M., Thurmond, D. C., Watson, R. T., Neudauer, C. L., Macara, I. G., Pessin, J. E. & Saltiel, A. R. (2001) Nature 410, 944–948]. We have assessed the role of lipid rafts on GLUT4 traffic in adipose cells. High GLUT4 levels were detected in caveolae from adipocytes by two approaches, the mechanical isolation of purified caveolae from plasma membrane lawns and the immunogold analysis of plasma membrane lawns followed by freeze-drying. The role of lipid rafts in GLUT4 trafficking was studied by adding nystatin or filipin at concentrations that specifically disrupt caveolae morphology and inhibit caveolae function without altering clathrin-mediated endocytosis. These caveolae inhibitors did not affect the insulin-stimulated glucose transport. However, they blocked both the GLUT4 internalization and the down-regulation of glucose transport triggered by insulin removal in 3T3-L1 adipocytes. Our data indicate that lipid rafts are crucial for GLUT4 internalization after insulin removal. Given that high levels of GLUT4 were detected in caveolae from insulin-treated adipose cells, this transporter may be internalized from caveolae or caveolae may operate as an obligatory transition station before internalization.
Keywords: caveolae, nystatin, filipin
Lipid rafts are lateral assemblies of sphingolipids and cholesterol that form a separate liquid-ordered phase in the liquid-disordered matrix of the lipid bilayer (1). Rafts function as platforms to which distinct classes of proteins are associated, such as glycosylphosphatidylinositol-anchored proteins, transmembrane proteins, and diacylated proteins. Caveolae are a specialized type of raft arranged in the form of flask-shaped invaginations. They are abundant in adipose cells, where they account for 20% of the plasma membrane surface area (2). Caveolae participate in receptor-mediated potocytosis, signal transduction, transcytosis, endocytosis independent of clathrin, and bacterial entry (3, 4). They are dynamic structures (5, 6), they can bud from the plasma membrane (PM) and their internalization is regulated by the general molecular transport machinery of vesicle budding, fission, docking, and fusion. Purified endothelial caveolae hold the elements needed for intracellular vesicular transport including members of the VAMP, GTPase, and annexin families, along with SNAPs and NSF (7). Moreover, they can undergo fission in vitro, which is mediated by dynamin (8).
Insulin stimulates glucose uptake by recruiting GLUT4 to the surface. After insulin removal, GLUT4 is rapidly internalized from the plasma membrane and is effectively sequestered within the cell. It has been suggested that GLUT4 is internalized through a clathrin-mediated pathway and disruption of clathrin-coated vesicles results in the accumulation of GLUT4 at the cell surface in adipocytes (9, 10). Morphological analyses in 3T3-L1 adipocytes have revealed the association between GLUT4 and clathrin-coated pits (11) and partial overlap between the itinerary of GLUT4 and that of the transferrin receptor (12). However, in isolated rat adipocytes GLUT4 is associated with smooth, non-clathrin-coated plasma membrane invaginations reminiscent of caveolae (13) and it is hardly colocalized with clathrin (14). A possible participation of caveolae in GLUT4 trafficking was initially proposed (15, 16) based on the observations that caveolin-rich fractions contained GLUT4 (15, 16) and that intracellular GLUT4 vesicles also contained caveolin in adipocytes (15). The latter observation was controversial and, in fact, no colocalization between intracellular GLUT4 vesicles and caveolin-1 was detected in preparations obtained from isolated rat adipocytes (17). A very recent observation links insulin signaling and lipid rafts; thus, insulin receptor phosphorylates Cbl and recruits the CAP-Cbl complex and the CrkII-C3G complex to caveolin-enriched fractions in adipose cells and this recruitment is required for TC10 activation in lipid rafts and for insulin-stimulated glucose transport (18, 19). We aimed to reevaluate the role of lipid rafts on GLUT4 trafficking in adipose cells. To this end, we examined whether GLUT4 is present in caveolae, and whether lipid rafts are required for GLUT4 endocytosis after insulin removal.
Materials and Methods
Antibodies.
The following antibodies were used: anti-GLUT4 (OSCRX; ref. 20); 1F8 directed against GLUT4 and anti-insulin-regulated aminopeptidase (IRAP) supplied by P. F. Pilch (Boston University); anti-human transferrin receptor from Zymed; anti-caveolin-1, anti-caveolin-2, and β-adaptin from Transduction Laboratories (Lexington, KY); polyclonal against caveolin-1 from Santa Cruz Biotechnology; anti-β-subunit of the rat insulin receptor provided by W. Stalmans (Katholieke Universiteit Leuven, Belgium); antiphosphotyrosine (4G10), anti-p85 subunit of phosphatidylinositol-3- kinase, and anti-rat insulin receptor substrate 1 (IRS-1) from Upstate Biotechnology (Lake Placid, NY).
3T3-L1 Cell Culture and Glucose Transport Measurements.
3T3-L1 fibroblasts were from the American Type Culture Collection. They were cultured and differentiated to adipocytes following Frost and Lane (21). 2-D-deoxyglucose uptake measurements were performed as described (22).
PM Lawns Techniques.
PM lawns were prepared as described by Heuser and Anderson (23) and adapted for 3T3-L1 adipocytes as described by Robinson et al. (11). Immunofluorescence and immunogold techniques were adapted from Robinson et al. (11), using an anti-GLUT4 polyclonal antibody (OSCRX) and different anti-caveolin-1 antibodies. In some experiments, OSCRX antibody was labeled with Alexa Fluor 488 (Molecular Probes).
Preparation of Carbon-Platinum Replicas of the Inner Cell Surface.
Replicas were obtained as described by Heuser and Anderson (23). For immunogold assays, replicas were not digested with household bleach; instead, they were washed in distilled water for 4 days to preserve the colloidal gold attached to the replicas.
Isolation of Caveolae by a Mechanical Procedure.
PM lawns from 3T3-L1 adipocytes grown on 100-mm plates were washed three times in PBS. Caveolae were then shaved from PM fragments by squirting 1 ml of [2-(N-morpholino)ethanesulfonic acid] (Mes)-NaCl buffer [25 mM Mes (pH 6)/150 mM NaCl/1 mM PMSF/2 μM pepstatin A/2 μM leupeptin/1 trypsin inhibitor units (TIU)/ml aprotinin] at a low angle with a syringe. We thus obtained a crude caveolae-enriched fraction and a plasma membrane fraction that was harvested by scraping the content of the plates in 1 ml of Mes-NaCl buffer and homogenized by passing the lysates ten times through a 25-G needle. The crude fractions were mixed with sucrose 80% in 25 mM Mes (pH 6)/150 mM NaCl and a discontinuous gradient was formed by overlaying the fractions with 35%, 25%, 15%, and 5% sucrose in 25 mM Mes (pH 6.0)/150 mM NaCl. The gradient was centrifuged for 20 h at 39,000 rpm and nine fractions were harvested along with the pelletted material. The resulting caveolin-enriched fractions were adsorbed to formvar-coated copper grids. Immunogold staining was performed by using the methods of Martin et al. (12).
Transferrin or Insulin Internalization.
Human holotransferrin (Tf; Sigma) or porcine insulin (Eli Lilly) were labeled with 125I as described (24) at a specific activity of 1–5 × 10⁶ counts per minute (cpm)/μg Tf and 1 × 10⁸ cpm/μg insulin, respectively, using IODO-GEN precoated iodination tubes (Pierce) and 125Iodine IMS 30 (Amersham Pharmacia). Internalization of iodinated Tf was measured by using the methods of McGraw and Maxfield (25). Insulin binding and internalization were performed as described (26).
Results
A Large Proportion of the Cell Surface GLUT4 Is Found in Caveolae from 3T3-L1 Adipocytes or Isolated Rat Adipocytes.
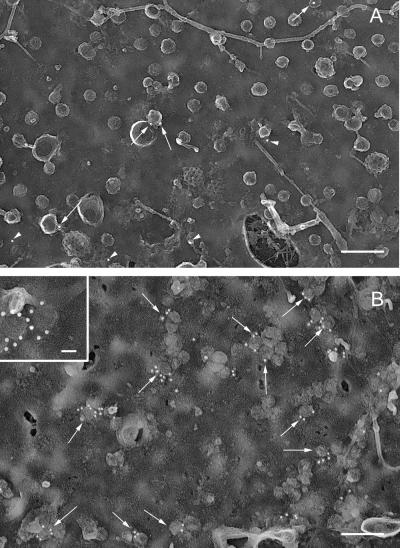
Rotatory replicas of plasma membrane lawns from 3T3-L1 adipocytes contained cytoskeletal elements, clathrin lattices, pits, and caveolae, sometimes organized in bunches (Fig. 1). Unstimulated adipocytes showed only 2.9 gold particles of labeled GLUT4 per μm2 in plasma membrane, 55% of which was associated with caveolae (Fig. 1A). After insulin treatment, the labeling in PM lawns increased by 8-fold (Fig. 1B; 22.8 gold particles per μm2 versus 2.9/μm2). This increase in GLUT4 labeling in PM accounted for the insulin-stimulated glucose transport obtained in 3T3-L1 adipocytes, which ranged between 7- and 15-fold stimulation, as measured by using 2-deoxyglucose (data not shown). In insulin-treated 3T3-L1 adipocytes, 34% of the labeling was associated with caveolae; this represents a marked increase in the abundance of GLUT4 in caveolae after insulin treatment (8 gold particles associated with caveolae/μm2 in insulin stimulated state versus 1.4 in basal cells). Similar data were obtained in PM lawns from isolated rat adipocytes (see Fig. 6, which is published as supporting information on the PNAS web site, www.pnas.org). We failed to detect labeling associated with clathrin-coated pits or lattices. Labeling was highly specific and no gold particles were found on the extracellular matrix or in 3T3-L1 fibroblasts. Similar values of GLUT4 abundance in caveolae from adipose cells were obtained when other polyclonal antibodies directed against the C terminus of GLUT4 (data not shown) or Protein A gold instead of a secondary antibody (data not shown) were used. Transferrin receptors were localized in clathrin-coated pits and lattices as well as in groups of nonclathrin membrane domains, but not in caveolae (data not shown). Caveolin-1 was mainly found in caveolae (see Fig. 7, which is published as supporting information on the PNAS web site). Colocalization of caveolin-1 and GLUT4 in identical caveolae was also substantiated in rotatory replicas of PM lawns from 3T3-L1 adipocytes (Fig. 7C Inset). In some assays, rotatory replicas were processed without digestion (normal protocol) or they were digested with bleach as reported in one study in which no GLUT4 was found in caveolae (11); our data revealed the presence of GLUT4 in caveolar structures when replicas were undigested but not after bleach digestion, although GLUT4 labeling was detected in planar regions of the membrane (Fig. 7 C and D). Similarly, bleach treatment made very difficult the detection of caveolin-1 in caveolae (Fig. 7 A and B).
Figure 1.
Labeling of GLUT4 on plasma membrane lawns from 3T3-L1 adipocytes in basal state or after insulin treatment. PM lawns were obtained from 3T3-L1 adipocytes in the basal state (A) or after 30 min of 100 nM insulin treatment (B). GLUT4 was immunolocalized with anti-GLUT4 polyclonal antibody (OSCRX) and a 15-nm colloidal gold goat anti-rabbit secondary antibody. Arrows point to gold particles associated with caveolae; arrowheads point to gold particles not associated with caveolae. Note that gold particles appear white because the negatives were not reversed. (Scale bars, A and B = 200 nm and Inset = 100 nm.)
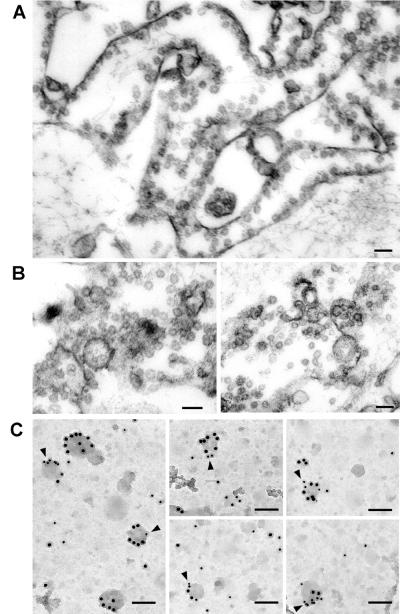
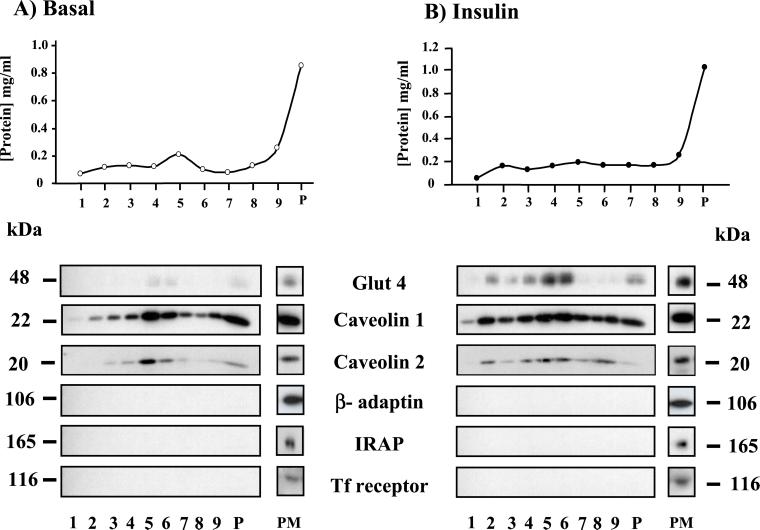
To rule out the presence of an artifact due to a secondary antibody crosslinking effect (27), we verified the presence of GLUT4 by direct fluorochrome labeling of polyclonal anti-GLUT4 antibody and by using a biochemical method. Confocal microscopy analysis indicated the codistribution of GLUT4 (examined by Alexa Fluor 488 labeling of OSCRX GLUT4 antibody) and caveolin 1 in PM lawns from 3T3-L1 adipocytes (see Fig. 8, which is published as supporting information on the PNAS web site). We also developed a mechanical procedure to isolate caveolae devoid of contiguous plasma membrane domains from 3T3-L1 adipocytes, following Schnitzer et al. (28), with modifications. Unstimulated or insulin-stimulated 3T3-L1 adipocytes provided PM lawns, and caveolae were pulled up by flushing the buffer with a syringe. We thus obtained a caveolae-enriched fraction and a plasma membrane fraction that was harvested by scraping the plasma membrane lawns after “shaving” the caveolae. Both were examined under the electron microscope (Fig. 2 A and B). The plasma membrane-enriched fraction still contained many attached caveolae (Fig. 2A). The caveolae-enriched fraction comprised many vesicles of homogenous size isolated or in clusters that correspond to caveolae. The caveolae-rich fractions from 3T3-L1 were centrifuged in a discontinuous sucrose gradient, which resulted in nine fractions and the pellet. In unstimulated cells, GLUT4 was hardly detected in the caveolin-1- or caveolin-2-enriched fractions (Fig. 3). In contrast, in insulin-stimulated cells, GLUT4 was mainly recovered in the low-density caveolin-1- and caveolin-2-containing fractions. Fractions did not contain other plasma membrane markers such as transferrin receptors, insulin-regulated aminopeptidase (IRAP) or β-adaptin (Fig. 3). To determine whether GLUT4 and caveolin-1 were present in the same membranous structure, we performed immunogold assays on the caveolin-enriched fraction from the gradient obtained from insulin-stimulated cells adsorbed to grids, and we identified vesicles of similar size to caveolae labeled with both anti-caveolin-1 and anti-GLUT4 antibodies (Fig. 2C, arrowheads).
Figure 2.
Electron microscopy of plasma membrane- and caveolae-enriched fractions obtained after caveolae purification from plasma membrane lawns of 3T3-L1 adipocytes. (A) Section of the plasma membrane-enriched fraction harvested from the plates after pulling up caveolae, which shows many caveolae still attached to PM. (Scale bar = 100 nm.) (B) Section of the caveolae-enriched fraction showing many vesicles of homogenous sizes isolated or in grapes. (Scale bar = 100 nm.) (C) Replicas of light caveolin-enriched fractions obtained after centrifugation of the caveolae-enriched fraction overlaid with a sucrose gradient. Membrane fractions were immunolabeled for GLUT4 (monoclonal antibody 1F8 and secondary 10-nm gold-labeled antibody) and caveolin-1 (polyclonal antibody and 15-nm gold-labeled secondary antibody). Arrowheads point to vesicles positive for GLUT4 and caveolin-1. (Scale bar = 85 nm.)
Figure 3.
Codistribution of GLUT4, caveolin-1, and caveolin-2 in caveolae-enriched fractions from 3T3-L1 adipocytes. Caveolae-enriched fractions were obtained as described in Materials and Methods from PM lawns from unstimulated (Basal) or insulin-treated (Insulin) 3T3-L1 adipocytes. Crude fractions were subjected to a discontinuous sucrose gradient and nine fractions were harvested along with the pelletted material (P). (Upper) Protein concentration of the different fractions of the gradients. Thirty microliters of each fraction was analyzed by SDS/PAGE and Western blotting for the distribution of different proteins. Thirty microliters of PM fractions were also loaded onto gels (PM).
Nystatin and Filipin Blocks GLUT4 Internalization in Adipocytes.
Various cholesterol-chelating drugs, like nystatin and filipin, which disrupt the lipid raft structure and function (5), were used to study the role of GLUT4 in caveolae. Nystatin clearly flattened the caveolae, as revealed by freeze-drying (see Fig. 9, which is published as supporting information on the PNAS web site). Filipin treatment caused the caveolae to acquire a torus shape but did not modify the number of invaginated caveolae (Fig. 9).
The cholera toxin, after binding to GM1 gangliosides, is internalized through caveolae (29). We thus used cholera toxin B chain conjugated to FITC (CTB-FITC) to characterize the caveolae-mediated internalization after drug treatments. CTB-FITC was bound at 4°C to the surface of 3T3-L1 control or nystatin-treated (or filipin-treated) adipocytes and then internalized by incubation at 37°C in the absence or in the presence of the drug. Control cells showed a diffuse, perinuclear fluorescence pattern after 1 h of internalization, whereas in nystatin- or filipin-treated cells, FITC-CTB remained at the cell surface (see Fig. 10, which is published as supporting information on the PNAS web site).
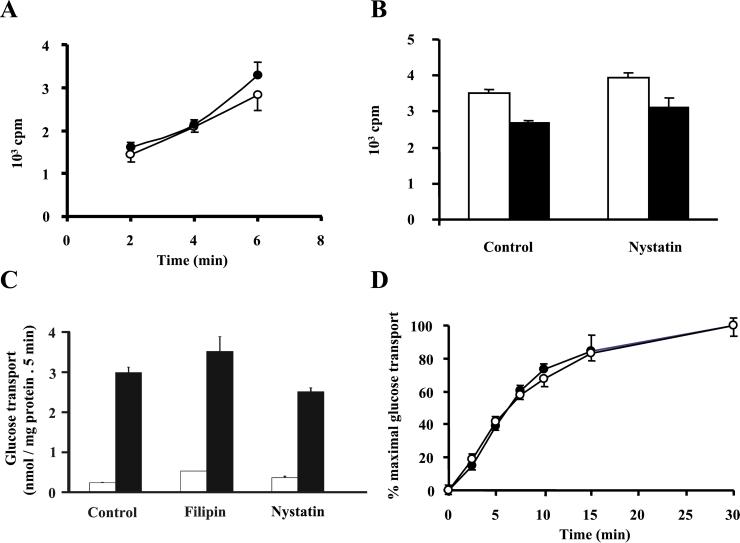
We also aimed to determine whether cholesterol-binding drugs altered clathrin-dependent endocytosis. To this end, we measured the internalization of 125I-transferrin in nontreated (Fig. 4, filled symbols) and in nystatin-treated adipocytes (open symbols). Neither nystatin (Fig. 4A) nor filipin (data not shown) affected transferrin internalization. Nor did nystatin have any effect on insulin binding or internalization (Fig. 4B).
Figure 4.
Effect of cholesterol-binding drugs on clathrin-coated pit mediated endocytosis and insulin-stimulated glucose transport. (A) Tf internalization was measured in 3T3-L1 adipocytes grown on 6-well plates. Tf internalization in control cells (dark symbols) and cells treated with 50 μg/ml nystatin (open symbols) was measured by incubating the 3T3-L1 adipocytes at 37°C for different times with iodinated Tf. Tf internalization values are means ± SEM of counts per minute (cpm) (n = 4) corrected for the nonspecific values (obtained for each time point by including a 200-fold excess of unlabeled Tf) from a representative experiment. (B) Insulin binding (open bars) and internalization (dark bars) was measured in 3T3-L1 adipocytes grown on 6-well plates. Cells were pretreated for 15 min in the absence or in the presence of 50 μg/ml nystatin, and insulin binding was determined by incubating the cells with iodinated insulin [1 nM, 0.5 μCi per well (1 Ci = 37 GBq)] for 4 h at 4°C. Insulin internalization was measured by incubating adipocytes with iodinated insulin (1 nM, 0.5 μCi per well) at 37°C for 30 min and by washing at low pH at 4°C. Data are means ± SEM (n = 4) of cpm corrected for the nonspecific values (obtained by including 1000-fold excess of unlabeled insulin) from a representative experiment. (C) Adipocytes were incubated in the absence or the presence of 5 μg/ml filipin or 50 μg/ml nystatin for 15 min. Thereafter, cells were incubated for 30 min in the absence (open bars) or presence of 100 nM insulin (filled bars) and 2-deoxyglucose uptake was measured for 5 min. Results are means ± SEM from a representative experiment run in triplicate. (D) Adipocytes were incubated for 15 min with (open symbols) or without (dark symbols) 50 μg/ml nystatin. Subsequently, 100 nM insulin was added for various times and 2-deoxyglucose uptake was measured for 1 min. Data are means ± SEM from a representative experiment run in triplicate.
We then analyzed whether lipid raft disruption affected the insulin-stimulated glucose transport in 3T3-L1 adipocytes. To this end, cells were treated with nystatin or filipin and then with insulin, after which 2-deoxyglucose uptake was measured; in other studies, the time course of insulin stimulation was characterized. No modification was detected in either study (Figs. 4C for uptake and D for time course: t1/2 = 7.4 min in control cells versus t1/2 = 7.5 min in nystatin-treated cells, and t1/2 = 8.5 min in control cells versus t1/2 = 9.6 min in filipin-treated cells).
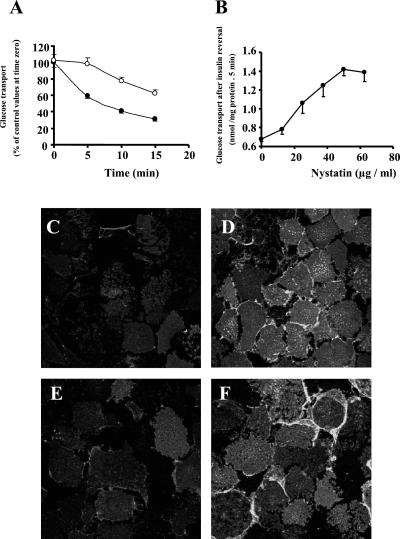
To determine whether GLUT4 endocytosis after insulin withdrawal requires intact lipid rafts, we assayed the down-regulation of 2-deoxyglucose uptake after insulin removal. To this end, 3T3-L1 adipocytes were initially stimulated with insulin for 30 min, washed at pH 6.0 to remove insulin, and incubated at 37°C. This procedure has been used to shut off insulin action (22). 2-D-deoxyglucose uptake decreased to ≈30% of the maximal insulin-stimulated levels 15 min after insulin removal (Fig. 5A, filled symbols). Both nystatin (Fig. 5A, open symbols) and filipin (data not shown) slowed this decrease in a concentration-dependent manner (Fig. 5B).
Figure 5.
Effect of nystatin on the reversal of insulin-stimulated glucose transport (A and B) and GLUT4 internalization (C–F) on insulin removal in 3T3-L1 adipocytes. (A and B) Cells were incubated for 30 min with 100 nM insulin and then incubated in the absence (A, filled symbols) or presence of 50 μg/ml of nystatin (A, open symbols) or different nystatin concentrations (B). Nystatin was left for 15 min. Thereafter, insulin was removed by washing in Krebs–Ringer [2-(N-morpholino)ethanesulfonic acid] (Mes) buffer (pH 6.0) maintaining nystatin and adipocytes were incubated in Krebs–Ringer Mes buffer containing 0.2% BSA and 2 mM sodium pyruvate and nystatin. At the times indicated, cells were washed in Krebs–Ringer Hepes buffer (KRHB) and 2-deoxyglucose uptake was measured for 5 min. Results are means ± SEM from a representative experiment, run in triplicate. (C–F) GLUT4 was immunolocalized in PM lawns from basal adipocytes (C), adipocytes treated with 100 nM insulin for 30 min (D), and adipocytes after 15 min of insulin removal in the absence (E) or presence (F) of 50 μg/ml of nystatin. (Scale bar = 25 μm.)
Caveolae disruption interferes with signaling events involving membrane receptors (30). To assess whether it also compromises the insulin-signaling pathway and to rule out that the insulin pathway remained activated when insulin was removed in the presence of nystatin, we analyzed the phosphorylation state of insulin receptors and IRS-1, as well as the IRS-1/p85 association in 3T3-L1 adipocytes. Insulin stimulated all these processes and insulin removal both in the absence and in the presence of nystatin reduced these effects (see Fig. 11, which is published as supporting information on the PNAS web site).
We also assessed the effect of cholesterol-binding drugs on the internalization of GLUT4, induced by insulin removal. The GLUT4 content of PM was higher in insulin-treated cells (Fig. 5D) than in control (Fig. 5C). PM lawns from cells incubated with insulin and nystatin showed similar GLUT4 levels to the insulin-treated group (data not shown). Insulin removal reduced GLUT4 abundance at the cell surface (Fig. 5E). The presence of nystatin or filipin following insulin removal blocked the internalization of GLUT4 (Fig. 5F and data not shown). Nystatin also blocked the internalization of GLUT4 from the cell surface in isolated rat adipocytes (see Fig. 12, which is published as supporting information on the PNAS web site).
Discussion
Recent studies have shown that lipid rafts play a crucial role in signaling insulin-stimulated glucose transport in adipose cells (18, 19). However, whether caveolae or lipid rafts are involved in GLUT4 traffic remains controversial. Thus, several authors suggested a role of caveolae in GLUT4 trafficking on the basis that caveolin-rich fractions, isolated as resistant to detergent, contained GLUT4, and that intracellular GLUT4 vesicles from adipocytes also contained caveolin (15, 16). However, colocalization between intracellular GLUT4 vesicles and caveolin was not detected in preparations from isolated rat adipocytes (18) or from 3T3-L1 adipocytes (data not shown). In an attempt to clarify this issue, we examined the presence of GLUT4 in PM caveolae from adipose cells by morphological and biochemical methods. Immunolocalization of GLUT4 on PM fragments from 3T3-L1 adipocytes or from rat adipocytes followed by rapid freezing and freeze-drying to generate replicas revealed the presence of GLUT4 in caveolae in basal state (50%) and after insulin stimulation (35%). Furthermore, we have isolated caveolae from plasma membrane lawns of 3T3-L1 adipocytes following a novel approach based on mechanical disruption; purification of caveolae by such a method has permitted the demonstration of colocalization of GLUT4 and caveolin-1 and caveolin-2 by sucrose gradient cofractionation and immunogold labeling.
Our results obtained by using the freeze-etching assay and the biochemical data are strong evidences for the presence of GLUT4 in plasma membrane caveolae because we either used highly purified caveolae preparations or direct visualization of caveolae at the electron microscope either in situ or after caveolae purification. The caveolae-enriched fractions obtained by insolubility in Triton-X-100 (15, 16), where they initially showed cofractionation of caveolin-1 and GLUT4, might also have contained other membrane domains, such as contiguous plasma membrane regions and GPI-enriched domains (1, 28) and so their results do not demonstrate the presence of GLUT4 in caveolae.
Our data contrast with the those of Robinson et al. (11), who failed to detect labeling of GLUT4 in caveolae on PM lawns from 3T3-L1 adipocytes. In our study, the replicas were not bleached and so colloidal gold particles were directly visualized, thus revealing GLUT4 in caveolae. In contrast, Robinson et al. (11) visualized bleached replicas of colloidal gold, which may not be distinguished from the platinum shadowing observed around all caveolae in the rotatory replicas (11). Indeed, we have used both methods in parallel, and whereas GLUT4 and caveolin-1 were detected in caveolae from unbleached samples, they were hardly detectable from bleached replicas. This may account for the disagreement between the results of the two studies.
To study the implications of the caveolar localization of GLUT4, cells were treated with nystatin or filipin, which bind cholesterol, disrupt lipid rafts and caveolae structure, and block caveolae function. Here, neither nystatin nor filipin affected clathrin-mediated endocytosis, as shown by transferrin and insulin internalization. Neither basal nor insulin-stimulated glucose transport was modified by disruption of lipid rafts. Moreover, the time course of insulin-stimulated glucose transport remained unaltered after nystatin or filipin treatment. These data are in contrast to observations performed by using β-cyclodextrin and showing inhibition of insulin-stimulated glucose transport in 3T3-L1 adipocytes (31). However, cyclodextrin is known to inhibit other processes such as clathrin-dependent endocytosis (32). Lipid raft disruption slowed the decay of glucose transport, due to a reduction in GLUT4 internalization after insulin removal. Moreover, the effect of caveolae disruption on GLUT4 internalization was not due to persistent insulin signaling through IRS-1 and phosphatidylinositol 3-kinase after insulin removal. Caveolae have also been implicated in the internalization of specific ligands, including cholera toxin, GPI-anchored proteins, albumin, small proteins, HLA antigens, and SV40 virus (3). B2-type bradykinin receptors also undergo internalization after redistribution into caveolae (33).
On the basis of morphological data, biochemical data obtained by using caveolae-rich fractions and intracellular GLUT4 vesicles and the functional impact of nystatin and filipin, we propose a model for adipose cells that involves the participation of lipid rafts in GLUT4 internalization during insulin shut-off. Whether GLUT4 is directly internalized from caveolae or whether caveolae operate as an obligatory transition station before internalization remains undetermined. In addition, whether caveolae-mediated endocytosis is the only gate for internalization of GLUT4 or clathrin-mediated endocytosis is also involved remains unclear. In all, lipid rafts have a dual role in glucose transport. They contribute to the insulin signaling that translocates GLUT4 to the surface, and they are required for GLUT4 internalization when insulin is removed.
Supplementary Material
Acknowledgments
We thank Marisol Cuñarro from Serveis Científico Tècnics from the Universitat de Barcelona for their help in image treatment and gold particles quantification. This study was supported by research grants from the Direccion General de Enseñanza Superior (PM 98/0197), Fondo de Investigaciones Sanitarias (Spain) (00/2101), Fundació Marató de TV3 (300720), Generalitat de Catalunya (1999SGR 00039) Spain, and the European Commission (Quality of Life, QLG-CT-1999-00295). A.R.-B. is recipient of a predoctoral fellowship from the Generalitat de Catalunya.
Abbreviations
- IRS-1
insulin receptor substrate-1
- PM
plasma membrane
- Tf
transferrin
Footnotes
This paper was submitted directly (Track II) to the PNAS office.
References
- 1.Simons K, Ikonen E. Nature (London) 1997;387:569–572. doi: 10.1038/42408. [DOI] [PubMed] [Google Scholar]
- 2.Fan J Y, Carpentier J-L, Van Obberghen E, Grunfeld C, Gorden P, Orci L. J Cell Sci. 1983;61:219–230. doi: 10.1242/jcs.61.1.219. [DOI] [PubMed] [Google Scholar]
- 3.Anderson R G. Annu Rev Biochem. 1998;67:199–225. doi: 10.1146/annurev.biochem.67.1.199. [DOI] [PubMed] [Google Scholar]
- 4.Shin J S, Gao Z, Abraham S N. Science. 2000;289:785–788. doi: 10.1126/science.289.5480.785. [DOI] [PubMed] [Google Scholar]
- 5.Schnitzer J E, Oh P, Pinney E, Allard J. J Cell Biol. 1994;127:1217–1232. doi: 10.1083/jcb.127.5.1217. [DOI] [PMC free article] [PubMed] [Google Scholar]
- 6.Gilbert A, Paccaud J-P, Foti M, Porcheron G, Balz J, Carpentier J-L. J Cell Sci. 1999;112:1101–1110. doi: 10.1242/jcs.112.7.1101. [DOI] [PubMed] [Google Scholar]
- 7.Schnitzer J E, Liu J, Oh P. J Biol Chem. 1995;270:14399–14404. doi: 10.1074/jbc.270.24.14399. [DOI] [PubMed] [Google Scholar]
- 8.Oh P, McIntosh D P, Schnitzer J E. J Cell Biol. 1998;141:101–114. doi: 10.1083/jcb.141.1.101. [DOI] [PMC free article] [PubMed] [Google Scholar]
- 9.Nishimura H, Zarnowski M J, Simpson I A. J Biol Chem. 1993;268:19246–19253. [PubMed] [Google Scholar]
- 10.Stagsted J, Olsson L, Holman G D, Cushman S W, Satoh S. J Biol Chem. 1993;268:22809–22813. [PubMed] [Google Scholar]
- 11.Robinson L J, Pang S, Harris D S, Heuser J, James D E. J Cell Biol. 1992;117:1181–1196. doi: 10.1083/jcb.117.6.1181. [DOI] [PMC free article] [PubMed] [Google Scholar]
- 12.Martin S, Tellam J, Livingstone C, Slot J W, Gould G W, James D E. J Cell Biol. 1996;134:625–635. doi: 10.1083/jcb.134.3.625. [DOI] [PMC free article] [PubMed] [Google Scholar]
- 13.Smith R M, Charron M J, Shah N, Lodish H F, Jarret L. Proc Natl Acad Sci USA. 1991;88:6893–6897. doi: 10.1073/pnas.88.15.6893. [DOI] [PMC free article] [PubMed] [Google Scholar]
- 14.Malide D, Dwyer N K, Blanchette-Mackie E J, Cushman S W. J Histochem Cytochem. 1997;45:1083–1096. doi: 10.1177/002215549704500806. [DOI] [PubMed] [Google Scholar]
- 15.Scherer P E, Lisanti M P, Baldini G, Sargiacomo M, Mastick C C, Lodish H F. J Cell Biol. 1994;127:1233–1243. doi: 10.1083/jcb.127.5.1233. [DOI] [PMC free article] [PubMed] [Google Scholar]
- 16.Gustavsson J, Parpal S, Stralfors P. Mol Med. 1996;2:367–372. [PMC free article] [PubMed] [Google Scholar]
- 17.Kandror K V, Stephens J M, Pilch P F. J Cell Biol. 1995;129:999–1006. doi: 10.1083/jcb.129.4.999. [DOI] [PMC free article] [PubMed] [Google Scholar]
- 18.Baumann A, Ribon V, Kanzaki M, Thurmond D C, Mora S, Shigematsu S, Bickel P E, Pessin J E, Saltiel A R. Nature (London) 2000;407:202–207. doi: 10.1038/35025089. [DOI] [PubMed] [Google Scholar]
- 19.Chiang S H, Baumann C A, Kanzaki M, Thurmond D C, Watson R T, Neudauer C L, Macara I G, Pessin J E, Saltiel A R. Nature (London) 2001;410:944–948. doi: 10.1038/35073608. [DOI] [PubMed] [Google Scholar]
- 20.Muñoz P, Mora S, Sevilla L, Kaliman P, Tomàs E, Gumà A, Testar X, Palacín M, Zorzano A. J Biol Chem. 1996;271:8133–8139. doi: 10.1074/jbc.271.14.8133. [DOI] [PubMed] [Google Scholar]
- 21.Frost S C, Lane M D. J Biol Chem. 1985;260:2646–2652. [PubMed] [Google Scholar]
- 22.Yang J, Clark A E, Harrison R, Kozka I J, Holman G D. Biochem J. 1992;281:809–817. doi: 10.1042/bj2810809. [DOI] [PMC free article] [PubMed] [Google Scholar]
- 23.Heuser J E, Anderson R G W. J Cell Biol. 1989;108:389–400. doi: 10.1083/jcb.108.2.389. [DOI] [PMC free article] [PubMed] [Google Scholar]
- 24.Woodman P G, Warren G. Methods Enzymol. 1992;219:251–260. doi: 10.1016/0076-6879(92)19026-3. [DOI] [PubMed] [Google Scholar]
- 25.McGraw T E, Maxfield F R. Cell Reg. 1990;1:369–377. doi: 10.1091/mbc.1.4.369. [DOI] [PMC free article] [PubMed] [Google Scholar]
- 26.Ceresa B P, Kao A W, Santeler S R, Pessin J E. Mol Cell Biol. 1998;18:3862–3870. doi: 10.1128/mcb.18.7.3862. [DOI] [PMC free article] [PubMed] [Google Scholar]
- 27.Mayor S, Rothberg K G, Maxfield F R. Science. 1994;264:1948–1951. doi: 10.1126/science.7516582. [DOI] [PubMed] [Google Scholar]
- 28.Schnitzer J E, McIntosh D P, Dvorak A M, Liu J, Oh P. Science. 1995;269:1435–1439. doi: 10.1126/science.7660128. [DOI] [PubMed] [Google Scholar]
- 29.Orlandi P A, Fishman P H. J Biol Chem. 1993;268:17038–17044. [PubMed] [Google Scholar]
- 30.Liu J, Oh P, Horner T, Rogers R A, Schnitzer J E. J Biol Chem. 1997;272:7211–7222. doi: 10.1074/jbc.272.11.7211. [DOI] [PubMed] [Google Scholar]
- 31.Parpal S, Karlsson M, Thorn H, Stralfors P. J Biol Chem. 2001;276:9670–9678. doi: 10.1074/jbc.M007454200. [DOI] [PubMed] [Google Scholar]
- 32.Subtil A, Gaidarov I, Kobylarz K, Lampson M A, Keen J H, McGraw T E. Proc Natl Acad Sci USA. 1999;96:6775–6780. doi: 10.1073/pnas.96.12.6775. [DOI] [PMC free article] [PubMed] [Google Scholar]
- 33.Haasemann M, Cartaud J, Muller-Esterl W, Dunia I. J Cell Sci. 1998;111:917–928. doi: 10.1242/jcs.111.7.917. [DOI] [PubMed] [Google Scholar]
Associated Data
This section collects any data citations, data availability statements, or supplementary materials included in this article.


