

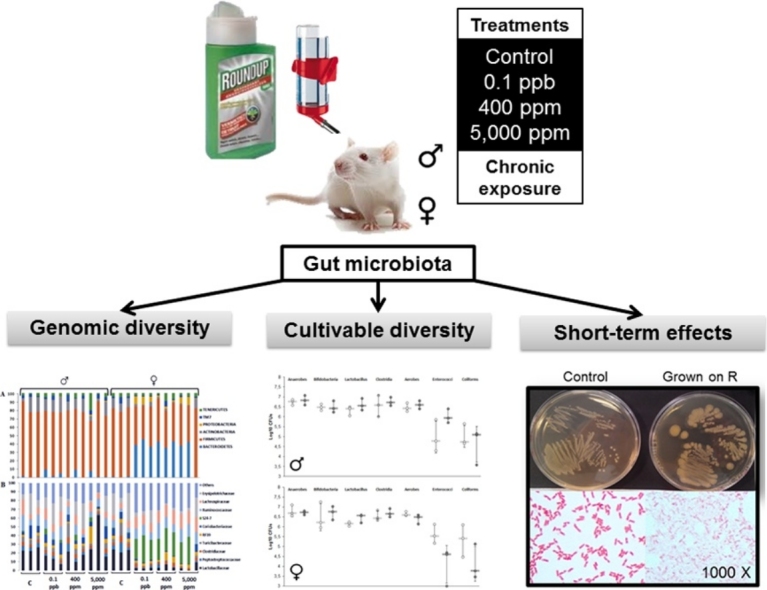
Graphical abstract
Keywords: Glyphosate, Roundup, Gut microbiome, Pesticides, Toxicity
Highlights
-
•
We have examined the long-term effects of Roundup on rat gut microbiota.
-
•
141 bacteria families were identified by a high-throughput sequencing approach.
-
•
Roundup caused an alteration of the Firmicutes to Bacteroidetes ratio.
-
•
An environmental concentration of Roundup has a sex-dependent impact on rat gut microbiome.
Abstract
A growing body of research suggests that dysbiosis of the gut microbiota induced by environmental pollutants, such as pesticides, could have a role in the development of metabolic disorders. We have examined the long-term effects of 3 doses of the Roundup(R) herbicide (made of glyphosate and formulants) on the gut microbiota in male and female Sprague-Dawley rats. A total of 141 bacteria families were identified by a 16S sequencing analysis approach. An OPLS-DA analysis revealed an increased Bacteroidetes family S24-7 and a decreased Lactobacillaceae in 8 out of the 9 females treated with 3 different doses of R (n = 3, for each dose). These effects were confirmed by repetitive sequence-based PCR fingerprinting showing a clustering of treated females. A culture-based method showed that R had a direct effect on rat gut microbiota. Cultivable species showed different sensitivities to R, including the presence of a high tolerant or resistant strain identified as Escherichia coli by 16S rRNA sequencing. The high tolerance of this E. Coli strain was explained by the absence of the EPSPS gene (coding glyphosate target enzyme) as shown by DNA amplification. Overall, these gut microbiome disturbances showed a substantial overlap with those associated with liver dysfunction in other studies. In conclusion, we revealed that an environmental concentration of R (0.1 ppb) and other two concentrations (400 ppm and 5,000 ppm) have a sex-dependent impact on rat gut microbiome composition and thus warrants further investigation.
1. Introduction
Human gut microbiome is inhabited by 1013 −1014 bacteria, more or less the same order as the number of human cells [1]. A growing body of research indicates that dysbiosis of the gut microbiota is implicated in a wide range of clinical conditions, some of which develop local in intestine as could be anticipated such as inflammatory bowel disease or colorectal cancer [2], with some others developing in distant organs being more surprising such as diabetes, obesity, asthma, liver and cardiovascular diseases, or even autism spectrum disorder [3]. A number of studies have indicated that changes in dietary patterns and lifestyle, as well as the presence of toxic food contaminants, can modulate the composition and the activity of the gut microbiome even if their role in the development of this disease is still poorly understood [4]. However, although human genetic variation in immune-related genes is correlated with gut microbiome composition [5], the recent rise of gut disease in Western industrialised countries cannot be fully explained by genetic drift in human populations and environmental factors plays a major role [6].
Human populations are exposed to an increasing number of different types of xenobiotics through their diets and lifestyles. Being directly in contact with the ingested food, the gut microbiome is sensitive to the nutritional quality of the diet [7] and its content in biologically active compounds acting as prebiotics to favour the development of beneficial intestinal microbes [8]. Some other studies have shown that the presence of food contaminants such as emulsifiers [9], heavy metals [10], mycotoxins [11,12], polysaccharides [13] or even pesticide residues [14] can alter the composition of the gut microbiome.
Glyphosate (G)-based herbicides (GBH) are the most used herbicides used worldwide [15]. G interacts reversibly with 5-enolpyruvylshikimate-3-phosphate synthase (EPSPS) inhibiting the production of 5-enolpyruvyl-shikimate-3-phosphate (EPSP), a precursor of aromatic amino acids synthesis (shikimate pathway) [16]. EPSPS is not specific to higher plants but is also found in many bacterial and fungal species [17]. This has been used to propose the use of glyphosate as an antibacterial or an anti-parasite agent for the prevention of infections provoked by Streptococcus pneumonia [18] and Toxoplasma gondii, Plasmodium falciparum (the parasite that causes malaria) and Cryptosporidium parvum [19]. However, G was poorly active alone and the addition of dicarboxylic acids was needed to achieve an antiparasitic activity. Similarly, G technical grade is not a potent herbicide and commercial formulations of GBH always include toxic formulants [20]. These formulants have been shown to be potent toxicants also in mammals [21].
A number of studies have suggested that G and its commercial formulations could act as antibiotics in the mammalian gut microbiome. G acted as a bactericide [22], a fungicide [23], and affected antibiotic susceptibility [24] in some in-vitro studies. Some farm animal studies have suggested that G is responsible for epidemics of C. botulinum-mediated diseases in poultry [25] and dairy cows [26]. There are at least three possible mechanisms by which G could alter the gut microbiome, (i) by a direct toxic effect: the differential toxicity of G and GBHs on chicken gut microbiota has been demonstrated in-vitro [25], (ii) by differential G metabolization capacity: bacterial metabolism of G in the gut leads to the production of toxic secondary metabolite AMPA which has been found in rat feces [27], (iii) by mucus barrier modification: the impact of dietary emulsifiers on gut microbiota showed that the mucus barrier could be sensitive to exogenous toxicants [9]. However, possible alterations of the mammalian gut microbiome by an exposure to environmental concentrations of a GBH have never been explored in a controlled laboratory animal study.
Historically, our knowledge about the microbiome in general and in the gut in particular was limited to cultivatable flora representing less than 1% of the total bacterial population. Meta-omics studies have a wide range of applications ranging from phylogeny to metabolomic studies [28]. Recent advances in sequencing technologies have allowed new and complete information on microbiome diversity. In this work we studied for the first time the long-term impact of Roundup (R) on the mammalian gut microbiome using two complementary approaches: (i) a new high-throughput 16S sequencing (IonTorrent®) phylogenic analysis of the microbiome from rats having received ad libitum water supplemented with different doses of R throughout 2-years (ii) traditional culture methods in order to study in-vitro short-term impacts of R on isolated gut bacterial strains.
2. Material and methods
2.1. Ethics
The experimental protocol was conducted in accordance with the regulations of ethics in an animal care unit authorized by the French Ministries of Agriculture and Research (Agreement Number A35-288-1). Animal experiments were performed according to ethical guidelines of animal experimentations (CEE 86/609 regulation).
2.2. Animals and samples
Feces samples were collected from rats which were part of a long-term study in which 3 doses of R (0.1 ppb, 400 ppm and 5000 ppm) had been administrated in tap water ad libitum [29]. The commercial GBH formulation used was R Grand Travaux Plus® (450 g/L glyphosate, approval 2020448; Monsanto, Belgium). The glyphosate concentration in drinking water, as well as the glyphosate stability during the 7 day period between two preparations of the test was confirmed by HPLC–MS/MS (corresponding to 50 ng/L, 0.1 g/L and 2.25 g/L of G respectively). The samples (n = 24) were collected after 673 days of R administration. They were kept at −80 °C. Samples were selected from independent cages as recommended [9] to avoid pre-clustering microbiota, and correspond to 3 females and 3 males per group, at the exception of two males treated with R 0.1 ppb which were housed together.
2.3. 16S sequencing analysis
The 24 fecal samples were analyzed by high-throughput sequencing IonTorrent® in AdGène laboratory (Thury-Harcout, France) according to the manufactureŕs instructions. Samples were homogenized and 200 mg were treated with Nucleospin Tissue (Macherey Nagel, Hoerdt, France) for DNA extraction. DNA quantity was measured by spectrophotometer (Biophotometer, Eppendorf, Montesson, France). A total of 7 hyper variable zones (V2, V4, V8, V3, V6, V7 and V9) of 16S rRNA gene were amplified with the Ion 16™ Metagenomics Kit (Life Technologies, Saint-Aubin, France). The amplification was made with two sets of primers (V2-4-8 and V3-6,7-9). The results were controlled by capillary electrophoresis analyses using QIAxcel Advanced System (Qiagen, Courtaboeuf, France). Amplified DNAs were purified with the MinElute Purification Kit (Qiagen). Preparation of libraries was performed with the Ion Plus Fragment Library Kit (Life Technologies) and 4 samples were treated in each sequencing run using Ion Xpress Barcodes Adapters 1-16 and Ion Xpress Barcode Adapters 17-32 (Life Technologies). All libraries correspond to DNA fragments from 200 bp to 400 bp. Emulsion PCR was made with the Ion PGM™ Template OT2 400 Kit in OneTouch2, the enrichment of balls was realized in OneTouchES. Quality control was carried out with the Ion Sphere™ Quality Control Kit in Qubit 2.0 fluorometer. Sequencing was undertaken in the 316v2 microchip with Ion PGM Hi-Q Sequencing Kit on the ION PGM sequencer. All the corresponding raw data has been posted on the ENA database with the accession number ERP104935 (PRJEB23198).
2.4. Repetitive sequence-based PCR (rep-PCR)
A total of 72 fecal samples (coming from 24 rats, 3 samples each) were analyzed by (GTG)5-PCR. DNA was extracted as described above. DNA samples were further diluted 10 times to prevent any risk of saturation of the polymerase. The reaction mixes (25 μL) were prepared using 5 μL of template DNA, 0.4 μM concentration of primers (5′-GTG GTG GTG GTG GTG-3′) and 12.5 μL of DreamTaq PCR Master Mix (Thermo Scientific). PCR amplifications were performed with an initial denaturation step (95 °C, 3 min) followed by 40 cycles of denaturation (95 °C, 30 s), annealing (51 °C, 30 s) and extension (72 °C, 1.5 min), and a final extension step (72 °C, 10 min). Capillary electrophoresis analysis was performed on the QIAxcel Advanced System (Qiagen, Courtaboeuf, France) according to manufacturer’s recommendations. For each electrophoresis process, a QIAxcel DNA High Resolution Cartridge, an Alignment Marker 50 bp/5000 bp, a size marker 250 bp-4000 bp, and the OM 500 method were used. The electrophoresis analyses were performed using the QIAxcel Screengel Software v1.2.0 (Qiagen), and the DNA fingerprint gel images were analyzed with the GelJ v1_3 software, according to Heras et al. [30]. Dendrograms were generated using the following parameters: similarity method (Pearson’s correlation), linkage (UPGMA) and tolerance of 2%.
2.5. Bioinformatic analysis
The analysis of 16S sequencing data was performed with the Torrent Suite Software (v4.4) and ION Reporter (v4.4). The bioinformatics workflow corresponded to Metagenomics 16S beta. The following parameters were used: Curated MicroSEQ® 16S Reference Library V2013.1 (Data Bank), size minimum of reads 150 bp, percentage of alignments for identification 90%, minimal read abundance for validation 10, cut-off Gender 97% minimal alignment, cut-off species 99% minimal alignment, slash-call was defined as 0.8%. The data was expressed as percentages of phylum and families from taxonomical consensus between the 7 hypervariable regions.
16S sequencing data were then analyzed by multivariate analysis with the SIMCA-P (V13) software (Sartorius Stedim Data Analytics AB Malmö, Sweden). Variables (phylum and families) were mean-centered but not scaled (all the variables are expressed in the same unit) prior to analysis. A first analysis was carried out by Principal Component Analysis (PCA). A second analysis was carried out by using an Orthogonal Partial Least Squares Discriminant Analysis (OPLS-DA) [31]. The objective of a discriminant analysis is to find a model that separates classes of observations on the basis of their X variables. The X matrix consists of the 16S sequencing data. The Y matrix contains dummy variables which describes the class of each observation. Binary variables are used in order to encode a class identity. Discriminant analysis finds a discriminant plan in which the projected observations are well separated according to class. Orthogonal PLS is a recent modification of the PLS method [32]. The objective of OPLS is to divide the systematic variation in the X-block into two model parts, one that is linearly related to Y (in the case of a discriminant analysis, the class membership), and one unrelated (orthogonal) to Y. Components that are related to Y are called predictive, and those that are unrelated to y are called orthogonal. This partitioning of the X data results in improved model transparency and performance.
The SIMCA software has a dedicated plot, called S-plot. The S-plot is a useful and reliable tool to identify important discriminating variables. This plot combines in a scatter plot the modelled covariance [Cov (t1,X) = p1] and modelled correlation [Corr (t1,X) = p(corr)1] of each X-variable with the predictive component from the OPLS-DA model. The p1-axis will describe the magnitude of each variable, the p(corr)1- axis will represent the reliability of each variable. X-variables which combine high magnitude and high reliability are of relevance in the search for discriminating variables. The extraction of the discriminating variables from the S-plot could be combined with the jack-knifed confidence intervals seen in the loading plot [33,34].
2.6. Microbial strains and culture conditions
Traditional culture-methods were applied to study gastrointestinal microbiota of rats exposed to R. First, we performed a selection protocol on fecal samples from control (n = 6) and R 5000 ppm (n = 6) treated rats using media prepared as previously described [35,36]. It allowed us to compare the results of traditional culture-methods to those of our 16S sequencing analysis. Briefly, dilutions of fecal samples (aiming to obtain 30–300 CFU per Petri dish) were incubated in selective agar medium (Table 1) in triplicate and counted (252 cultures). Then, with the objective of reproducing bacterial community and its interactions, we studied the effects of R on bacterial strains isolated from rat feces of the control group in order to see if a short-term R exposure can reproduce the effects observed after a chronic exposure in vivo. Control bacterial strains were incubated in liquid media (RCM broth) with different concentrations of R (0.1 ppb, 400 ppm and 5000 ppm) in triplicate. After 24 h of treatment, samples were diluted to appropriate factor to allow counting, cultured (24 h) in selective agar media and afterward all colonies were counted. Ultimately, we studied the dose-response relationship of R toxic effects by exposing the different strains isolated from rat feces (control group) to R for 24 h. R and Glyphosate have been adjusted with NaOH to pH = 7 to avoid acidity impacts and filtered (0.22 μm) to eliminate possible contamination. After 24 h of exposure, the absorbance (600 nm) was measured and the 50% of growth inhibition (MIC50) intervals were estimated. Inhibition rate was confirmed on agar plates with the same concentration of R. Statistical differences were determined by a non-parametric Kruskal-Wallis test, using InfoStat® version 2012 software (InfoStat Group, Cordoba, Argentina).
Table 1.
Media and conditions for strains isolation and culture (based on Poulsen et al., 2007 and Muñoa and Pares, 1988).
| Selection | Media | Conditions |
|---|---|---|
| Agar Plates | ||
| Total Aerobes | Clostridia Reinforced Agar (Biokar) | 72 h Aerobically, 37 °C |
| Total Anaerobes | Clostridia Reinforced Agar (Biokar) | 72 h Anaerobically (AnaeroGen 2,5 L, Sigma-Aldrich), 37 °C |
| Bifidobacteria (Muñoa and Pares, 1988) | 51 g Clostridia Reinforced Agar (Biokar), 0,02 g nalidixic acid (Sigma-Aldrich), 0,0085 g polymyxin B sulfate (Biokar), 0,05 g kanamycin sulfate (Sigma), 0,025 iodoacetic acid (Sigma), 2,3,5-triphenyltetrazolium chloride (TTC, Biokar) | 72 h Anaerobically (AnaeroGen 2,5 L, Sigma-Aldrich), 37 °C |
| Lactobacillus | ROGOSA (Biokar), Acetic Acid (Sigma-Aldrich) | 72 h Anaerobically (AnaeroGen 2,5 L, Sigma-Aldrich), 37 °C |
| Enterococci | Slanetz et Bartley (Biokar), 2,3,5-triphenyltetrazolium chloride (TTC, Biokar) | 48 h Aerobically, 37 °C |
| Coliforms | MacConkey Agar 3, (Oxoid) | 24 h Aerobically, 37 °C |
| Clostridia | Clostridia Reinforced Agar (Biokar), 20 mg/L polymyxin B sulfate (Biokar) | 72 h Anaerobically (AnaeroGen 2,5 L, Sigma-Aldrich), 37 °C |
| Broth (liquid media) | ||
| General | Reinforced Clostridial Medium (Biokar) | 24 h Aerobically, 37 °C |
| Lactobacillus | MRS Broth (Biokar) | 24 h Aerobically, 37 °C |
2.7. Characterization of a Roundup-tolerant or resistant bacterial strain
One strain isolated on RCM agar plate (Biokar Diagnostics, France) had a particular phenotype when cultivated with 5000 ppm of R. A colony was pelleted and seeded with and without 5000 ppm of R in 10 mL of liquid RCM. After 72 h at 37 °C, cells were centrifuged, washed in physiological water, and concentrated to be analyzed by Fourier Transform Infrared spectroscopy (FT-IR). IR spectroscopy is a simple and cheap tool able to give rapid global information about the physiological status of microorganisms, as IR spectra reflect the global chemical composition of the sample [37]. It can provide information on existing taxonomic differences, or on chemical changes owing to stressful environments [38]. Registered spectra were analyzed with OPUS 6.5 (Bruker) software, on spectral windows 3100–2800 + 1500–1350 cm−1, 1800–1500 cm−1 and 1200–900 cm−1 for studying fatty acids, proteins and polysaccharides, respectively [37]. Spectra comparisons were performed by hierarchical cluster analysis (HCA) using vector normalization of first derivative and Ward́s algorithm. Taxonomical determination was performed by the API® 20E™ phenotypic assay (bioMérieux SA, France) and Sanger sequencing of 16S RNA gene as follows.
DNA was extracted with the Kit EZ1 DNA Tissue (Qiagen). A total of 200 μL of bacterial strain was centrifugated for 5 min at 8000 rpm. The supernatant was removed and 200 μL of G2 buffer was added. The suspension was vortexed and placed into an EZ1 2 mL microtube before extraction was done with the automatic extractor EZ1 Advanced system (Qiagen). A total of 200 μL of DNA was obtained. Amplification was made with primers 16S-Bact-8F (5′-AGAGTTTGATCCTGGCTCAG-3′) and 16S-Bact-1510R (5′-GGTTACCTTGTTACGACTT-3′) for 16S DNA and with primers EPSPS-P1-F (5′-CGGGATCCATGGAATCCCTGACGTTACAA-3′) and EPSPS-P2-R (5′-GCGGATCCTCAGGCTGCCTGGCTAATC-3′) for EPSPS gene [39]. The cycling conditions were as follows. A first denaturation was performed for 5 min at 95 °C, followed by 30 cycles made of a denaturation step of 30 s at 95 °C, an annealing step of 30 s at 60 °C and an elongation step of 90 s at 72 °C. Amplification results were controlled by capillary electrophoresis analyses performed on the QIAxcel Advanced System (Qiagen, Courtaboeuf, France). Amplified DNAs were purified with MinElute Purification Kit (Qiagen) following manufacturer protocol. Purified amplicons were sent to Eurofins Genomics (Ebersberg, Germany) for Sanger sequencing.
3. Results
3.1. Roundup chronic effects: microbiome genomic diversity
Total DNA extracted from feces (4,033,668,501 bases) were sequenced passing 93,2% the Q20, a quality score representing the probability of incorrect base call (1 error for every 100 bases). A total of 2,305,131 reads (sequences) were obtained and 776,220 were mapped to known reference sequences. Details are showed in Table 2.
Table 2.
High-throughput sequencing IonTorrent® quality control data (C: Control, M: Male, F: Female).
| Sample | Bases | Bases ≥ Q20 | Reads | Mapped Reads | Ignored Reads | Unmapped Reads |
|---|---|---|---|---|---|---|
| C-M 1 | 105,113,826 | 94,407,521 | 389,647 | 214,579 | 164,312 | 10,756 |
| C-M 2 | 218,494,044 | 206,094,072 | 826,189 | 534,484 | 245,553 | 46,152 |
| C-M 3 | 287,978,710 | 265,834,853 | 1,047,587 | 665,109 | 341,063 | 41,415 |
| 0,1 ppb-M 1 a | 255,388,041 | 241,932,858 | 965,176 | 582,012 | 321,962 | 61,202 |
| 0,1 ppb-M 1 b | 240,203,515 | 227,556,577 | 8,933,705 | 550,717 | 296,436 | 46,552 |
| 0,1 ppb-M 2 | 284,816,185 | 269,390,587 | 1,060,464 | 645,135 | 358,355 | 56,974 |
| 400 ppm-M 1 | 170,881,138 | 160,203,838 | 631,826 | 358,417 | 226,232 | 47,177 |
| 400 ppm-M 2 | 224,791,804 | 211,533,348 | 846,604 | 493,822 | 302,548 | 50,234 |
| 400 ppm-M 3 | 110,916,293 | 100,656,523 | 385,098 | 228,604 | 144,047 | 12,447 |
| 5000 ppm-M 1 | 125,184,451 | 114,866,601 | 458,511 | 218,410 | 203,007 | 37,094 |
| 5000 ppm-M 2 | 149,793,745 | 139,947,612 | 556,470 | 333,907 | 184,866 | 37,697 |
| 5000 ppm-M 3 | 265,769,509 | 250,828,996 | 1,001,957 | 632,526 | 334,262 | 35,169 |
| C-F 1 | 84,479,784 | 75,934,450 | 300,906 | 165,567 | 132,051 | 3288 |
| C-F 2 | 229,033,838 | 209,984,416 | 833,362 | 468,850 | 311,477 | 53,035 |
| C-F 3 | 211,425,026 | 194,255,468 | 765,499 | 472,787 | 262,430 | 30,282 |
| 0,1 ppb-F 1 | 72,574,699 | 68,695,920 | 274,075 | 143,215 | 117,249 | 13,611 |
| 0,1 ppb-F 2 | 101,002,295 | 95,498,049 | 381,388 | 198,447 | 158,963 | 23,978 |
| 0,1 ppb-F 3 | 186,935,849 | 174,457,237 | 689,367 | 372,572 | 280,625 | 36,170 |
| 400 ppm-F 1 | 103,994,305 | 98,038,159 | 396,297 | 202,250 | 166,889 | 27,158 |
| 400 ppm- F 2 | 60,509,255 | 55,151,502 | 221,736 | 98,287 | 114,500 | 8949 |
| 400 ppm- F 3 | 146,524,095 | 138,033,892 | 575,311 | 305,960 | 223,133 | 46,218 |
| 5000 ppm-F 1 | 89,250,348 | 82,457,086 | 332,665 | 162,792 | 162,921 | 6,952 |
| 5000 ppm-F 2 | 166,676,630 | 156,827,273 | 653,649 | 379,238 | 238,867 | 35,544 |
| 5000 ppm-F 3 | 141,931,116 | 127,063,886 | 507,642 | 273,622 | 225,854 | 8166 |
We started by an examination of the variance-covariance structure at the phylum level. A principal component analysis (PCA) of the 6 phyla identified accounted for 96.1% of the variation (R2X) with two components. The score plot (Fig. 1A) revealed a separation in two groups on the first component, one group with both sex controls and all treated males and the other, with treated females except for 5000 ppm-F3 observation which is in the treated males and control group. R treatment clearly separate phyla by sex, not controls. No dose effect was observed at this step. The loading plot of variables (Fig. 1B) revealed that Bacteroidetes variable had a high positive loading on the first component characterizing the treated females while the Firmicutes variable had a high negative loading on the first component characterizing the controls (males and females) and treated males.
Fig. 1.

Phylum-level gut microbiome profile of Roundup-treated rats. Feces from males and females rats chronically administered with R at three different concentrations (0.1 ppb R, 50 ng/L G; 400 ppm R, 0.1 g/L G; 5000 ppm R, 2.25 g/L G) were studied by high-throughput IonTorrent 16S sequencing analysis. (A) PCA score plot of Phyla from 24 fecal rat samples treated life-time with R. (B) Loading plot of the phylum PCA model.
The same analysis was repeated at the family level. A total of 58 variables were excluded, out of 141 detected, because they contained only zero, one or two different values from the median. First, a score plot of the two first principal components in a PCA analysis and a score contribution plot (Supplementary Material 1) revealed a strong outlier observation (5000 ppm-M2). This observation had an abnormally high value for the Lactobacillaceae variable in comparison with the average (greater than 3 SD). As a result this observation was excluded and the model refitted. The new PCA model is very similar to the previous and explains 82% of the X-variation with two components (Fig. 2A). The loading plot (Fig. 2B) revealed that the S24-7 variable, which belongs to the Bacteroidetes phylum, has a high positive loading on the first component, characterizing the treated females. Contrastingly, Lactobacillaceae and Erysipelotrichaceae variables, belonging to Firmicutes phylum, have negative loadings on the first component and characterize the group of controls (males and females) and treated males.
Fig. 2.

Family-level gut microbiome profile of Roundup-treated rats. Feces from males and females rats chronically administered with R at three different concentrations (0.1 ppb R, 50 ng/L G; 400 ppm R, 0.1 g/L G; 5000 ppm R, 2.25 g/L G) were studied by high-throughput IonTorrent 16S sequencing analysis. (A) PCA score plot of the refitted model of families. (B) Loading plot of the refitted PCA model of families.
Second, on the basis of PCA results, an OPLS-DA model on the 16S sequencing dataset of families was built with two classes of observations: treated males and controls (n = 14) and treated females (3 groups of n = 3). The computed model is very significant (CV-ANOVA test with p-value = 5 10−7). A permutation test (n = 200) was also performed. The permutation plot displays the values of R2 and Q2 for each model in function of the correlation coefficient between the original response vector and the permuted response vector. The y values at the intersection with the regression lines indicate that R2 and Q2 values were 0.00504 and −0.187, respectively, which confirmed the validity of the model (Supplementary Material 2).
The model has one predictive component which explains 65.9% of the variation in X (R2X) correlated to class separation. The model explains 79.4% of the variation of Y (R2Y) suggesting a good class separation visible on the score plot (Supplementary Material 3) and a cross-valided predictive ability Q2Y of 76.5%. In order to identify which variables are the best discriminators between the two classes a S-plot was produced (Supplementary Material 4). The S24-7 variable has both high magnitude (p1 = 0.69) and high reliability (p(corr)1 = 0.98). In the same way the Lactobacillaceae variable has a strong model contribution (p1 = −0.46) and high reliability (p(corr)1 = −0.89). The extraction of discriminating variables from the S-plot has been combined with the loading plot of the variables with jack-knifed confidence intervals (Supplementary Material 5). It confirms that S24-7 and Lactobacillaceae variables have significant loadings (95% confidence level) and are reliable to characterize the treated females from the treated males and controls. This is confirmed by the analysis of individual phyla (Fig. 3A) and family (Fig. 3B) composition. One female (5000 ppm-F3) treated with 5000 ppm of R presents a profile typical of males and controls, which explains its position on PCA and OPLS-DA analysis (Fig. 1, Fig. 2 and Supplementary Material 3). Comparable results were found by applying a different transformation data method suggested by a new compositional approach [40] (Supplementary Material 6).
Fig. 3.

Individual gut microbiome profile of Roundup-treated rats. Proportion of 6 phyla (A) and 10 main families (B) of 2-year R-treated rats gut microbiota variability analyzed by high-throughput IonTorrent 16S sequencing analysis. Males (n = 12) and Females (n = 12) were administered with R in water at three different concentrations (0.1 ppb R, 50 ng/L G; 400 ppm R, 0.1 g/L G; 5000 ppm R, 2.25 g/L G).
At this stage, our results highlight significant differences between treated females and all others groups of rats (control males, control females and treated males). These differences mostly consisted of an increased in the Bacteroidetes family S24-7 and a decrease Lactobacillaceae in 8 out of the 9 females treated with different doses of R. In order to control possible distortion of DNA extraction and/or amplification repetitive sequence-based PCR (rep-PCR) profiles were realized, using the same batch of extraction (Fig. 4A) and 2 additional extractions (Fig. 4B and C). The three profiles are slightly discordant but they all confirm the 16S sequencing results in 8 of the 9 treated females, which clearly separate from controls (males and females) and treated males.
Fig. 4.

REP-PCR result classification. Amplifications obtained from 3 different extractions (A: batch used in 16S sequencing analyses; B, C: additional extraction batches). REP-PCR was performed to verify the pattern that was obtained in the high-throughput 16S sequencing.
3.2. Roundup chronic effects in vivo: microbiome cultivable biodiversity
High-throughput sequencing of bacterial 16S rRNA has progressively replaced traditional culture methods in the last decade even if the latter are still interesting. In order to compare the results of both methods, we have measured total anaerobes, total aerobes, Clostridia, Bifidobacteria, Lactobacilli, Enterococci and Coliforms in feces of 3 males and 3 females treated with 5000 ppm of R and their relative control (Fig. 5). The results did not reflect the trends observed in the 16S sequencing analysis. We observed very strong method deviation, especially in Enterococci and Coliform populations making it very difficult to observe possible treatment related effects. It is thus not clear whether our protocol based on Poulsen et al., 2007 was reliable to test for alterations in microbiome composition.
Fig. 5.

Determination of microbiome composition by traditional culture-method. Results of colony-forming units numerations of controls (white) and R 5000 ppm treatment (grey) samples of rat feces (males n = 3, females n = 3), the protocol was based on Poulsen and colleagues [35] to compare traditional culture methods and 16S high-throughput sequencing.
3.3. Roundup short-term effects in vitro
Parallel investigations on other organs from the same animals have shown that the exposure to R has provoked liver and kidney damage [29,41]. It is difficult to definitively attribute the gut microbiome alterations seen in our study to a direct effect of R because other studies have shown that gut microbiome alterations can be secondary to liver damage [42]. We have thus exposed isolated gastrointestinal strains from feces of a control male rat to different concentrations of R over 24 h in order to ascertain if R can have a direct effect on bacterial growth (Fig. 6A). We observed a significant growth inhibition at the two highest concentrations (400 and 5000 ppm) of total anaerobes population, Bifidobacteria, Clostridia, and Enterococci. Lactobacilli were less sensitive; their growth was not altered at 400 ppm Coliforms were not sensitive to any of the R concentrations tested. This is confirmed by the study of the effects of increasing concentrations on isolated gastrointestinal strains (Fig. 6B). The estimated MIC50 were (in ppm) 100–500 for Enterococci, Clostridia and Bifidobacteria; 1000–5000 for Lactobacilli, and up to 10,000 for Coliforms. These results demonstrated a differential sensitivity of the main cultivable families of the rat gut microbiota including a global higher sensitivity of the anaerobe community. It suggests that gut microbiome disturbances provoked by R exposure can be due to a direct selective bactericidal action, although the MIC50 were very high in comparison to the R concentration administered in vivo.
Fig. 6.

Differential impact of R on bacteria inhabiting the gastrointestinal tract of rat. A. Impacts on community after 24 h of treatment by R. The median (n = 3) and SD are shown. *p < .05, **p < .01 B. Dose response of R inhibitory effects on growth of isolated gastrointestinal strains from rat feces.
We observed an unusual colony morphotype (Fig. 7A) on agar RCM with 5000 ppm of R after growth under aerobic conditions (72 h). Colonies were bigger than those observed under lower R concentrations or controls. This strain reversed to a normal morphotype when it was reseeded into another plate without R. This probably resulted from a metabolic adaptation rather than to a random mutation because a new seeding with R 5000 ppm led again to this unusual morphotype. We observed a high tolerance or resistance to R and even G (results not shown) after 24 and 72 h of liquid culture. An infrared spectral analysis was undertaken in order to understand these physiological adaptations. FT-IR spectra of the two morphotypes showed differences in lipids (3100–2800 cm−1 + 1500-1300 cm−1), proteins (1800–1500 cm−1) and carbohydrates (1200–900 cm−1) windows, the last being the most important (Fig. 7B). A microscopic observation after Gram coloration (Fig. 7A) showed altered bacterial cells suggesting cell wall modifications as confirmed by IR carbohydrate band modifications. Identification was performed first by testing different culture media. The strain grew on MacConkey Agar but did not grow on Slanetz and Bartley medium or in the presence of polymyxine B (inhibition of Gram −). These results suggest a coliform colony type. We then also undertook an API 20E detection system combined with 16S RNA gene sequencing analysis of these bacteria. This confirmed that the selected strain belongs to the Escherichia coli family (Supplementary Material 7). A DNA amplification of the EPSPS gene (G target) was undertaken in order to explain the particular morphotype of the E. coli selective strain. It was unsuccessful showing a possible absence of this gene and the shikimate pathway.
Fig. 7.

Phenotype of a Roundup-resistant or tolerant bacteria. Phenotypic modification observed when it was grown on R (A) and Fourier Transform Infrared spectroscopy analysis of this extremely tolerant or resistant isolated strain (B).
4. Discussion
We present the first investigation on the long-term effects of an exposure to R on the gut microbiome composition of a laboratory rodent. The microbiome of Sprague-Dawley rats exposed to different concentrations of R for 673 days was compared to control rats of the same age raised in similar conditions. The high-throughput 16S sequencing analysis revealed that R exposure via drinking water caused sex-specific alterations of the rat gut microbiome (discussed below), reflected by an increase in the Bacteroidetes family S24-7 and a decrease in Lactobacillaceae in females. R had a direct selective bactericidal action on isolated gastrointestinal strains which could explain the effects observed in vivo.
The material analyzed formed part of a chronic (2 year) study looking at potential toxic effects arising from the consumption of R. Animals exposed to R from an environmental level presented signs of liver and kidney damage at an anatomorphological and blood/urine biochemical level [29]. An integrated analysis of liver molecular profiles (transcriptome, proteome, metabolome) revealed non-alcoholic fatty liver disease and its progression to non-alcoholic steatohepatosis [41,43]. It is remarkable to see that gut microbiome alterations presented by mice developing fatty liver disease after an alcohol exposure was also characterized by reduced Firmicutes spp., including Lactobacillus spp., and increased Bacteroidetes spp., and thus considerably overlap our results [44]. An increase of Bacteroidetes spp. and more specifically, the S24-7 Gram negative family, is also observed in cases of dysbiosis associated with obesity and inflammatory events in a mice model [45]. In another study in rats exposed to the insecticide chlorpyrifos also presented a gut dysbiosis characterized by a proliferation of Bacteroides spp. and decreased levels of Lactobacillus spp. in a simulation of the human intestinal microbial ecosystem [46].
The alteration of the Firmicutes to Bacteroidetes ratio by the exposure to environmental pollutants, including by R as shown in this study, has a profound effect on human gut function because Firmicutes and Bacteroidetes are the two dominant phyla in human gut microbiota [47]. Families such as Lactobacilli, Bifidobacteria, are considered as “positive” commensal bacteria as well as probiotics used as therapeutic agents (immune system and gut transit strengthening, protection against diarrhea). Clostridia and Enterococci also include commensal gut species, even if some species can be pathogenic (i.e. Clostridium difficile and Enterococcus faecalis). Although the clinical relevance of our observations remains to be ascertained, particularly as there is limited data available, our data suggests that the exposure to an environmental concentration of R residues could have a role in the current epidemic of gut dysbiosis.
The gut microbiome disturbances evidenced in this report presented a sex-specific pattern. Sex-dependent microbiome gut response has been already reported in some animals including mammals [48]. The sex-dependent response could show an endocrine-gut microbiome relationship which is now well documented [49]. For example, Fuhrman and colleagues [50] have found a relationship between estrogen metabolism in post-menopausal women and fecal microbiota diversity. Additionally, R has been suggested to have endocrine disrupting effects in mammals although the existence of these effects at typical world levels of exposure remains debated [21]. It could thus be possible that the increase of tumor incidence observed in treated females from this study could have a relationship with the sex-dependence response of gut microbiota because some studies suggest a possible link between breast cancer and gut microbiota function [51,52]. This result can also originate from more complex mechanisms involving multiple interactions with distant organs because bacterial community effects or other types of systemic mechanisms are not yet completely known.
Our results do not show a dose response relationship as expected by most toxicological studies. This could have been expected at the highest dose since the other components present in the formulation are very disruptive. However, the gut microbiome has been shown to be resilient [53]. In another study, the gut microbiome of mice exposed to cadmium in early life later recovered [54]. In opposite sense, another possibility could be that the liver pathology causes the gut dysbiosis, being the first toxicological target the liver and not gut microbiome. This could also explain the non-observed linear dose-response effect, as the liver-damage has low-threshold toxicity as was previously observed [43]. Although we observed that gut bacteria growth inhibition was present at much higher concentrations, the cultivatable strains represent less than 1% of total diversity and so we cannot discard the hypothesis that non-cultivatable bacterial communities of the microbiome are sensible to environmental concentrations of the R herbicide.
We demonstrate in this report G selectivity on isolated gastrointestinal strains, providing an explanation for gut microbiome alterations induced by R. The possible selectivity of G bactericide function had already been suggested in previous in-vitro studies [22,24]. Antibiotic efficacy of R reported in this study is in the range of those measured with other common antibiotics. The MIC50 of R on Bifidobacteria was around 100–500 ppm in our study. By comparison, MIC50 for 13 antibiotics on Bifidobacterium longum varied from 0.12 ppm (clindamycin) to 512 ppm (kanamycin) [55]. Lactobacillus were globally less sensitive and MIC50 ranged from 120 ppm (clindamycin) to 3000 ppm (ciprofloxacin) [52], and were 1000–5000 ppm in our study. Several mechanisms of adaptation to metabolic inhibitors could explain the different effect of R on different bacteria. For instance, Aerobacter aerogenes is able to adapt to G exposure by increasing EPSPS activity [56]. In Escherichia coli, the overexpression of a membrane transporter encoded by the yhhS gene seems to be also implicated in a differential toxicity to G [57]. Insensitivity to G can also result from single site mutations (T97I/P101S double mutations) in E. coli [58]. Klebsiella sp. strain PS19 shows a high resistance to many herbicides (including GBHs) which could be due to resistance to common toxic formulants [59]. Several species of Azobacter are able to grow in the presence of G without affecting their metabolic activities [60]. The oxidative stress induced by pesticides could result in selective pressure on bacteria leading to an increase of pesticides tolerance and/or resistance.
We also studied short terms effects of R in vitro on microbiota by cultivation of fecal bacteria. We did not find any global community impact of R in vitro on the cultivatable microbiota isolated from feces of rats exposed in vivo. One should notice that cultivatable strains represent a minor part of total gut microbiota diversity, as we mentioned above, and as a consequence the probability of finding treatment related effects is low. It is also important to emphasize that the microbiota has a spatial pattern in the gastrointestinal system [61]. Different populations are found along the digestive system and the community isolated in vitro, as well as by the 16S sequencing analysis, could thus not be representative of the actual communities inhabiting the upper digestive system.
Concerning the coliform isolated strain with a particular unusual morphotype, API 20E determination and 16S sequencing were concordant and confirmed its identity as E. coli. DNA amplification of the EPSPS gene which is the target of glyphosate was undertaken in order to explain its particular morphotype, but it was unsuccessful showing a possible absence of this gene. However, the strain was still cultivatable, which suggest a bypass of the shikimate pathway. It could show the natural tolerance of some gut microbiota to glyphosate due to the absence of this pathway. In fact, the shikimate pathway can be incomplete in host-associated bacteria [62]. Furthermore, the existence of other non-specific mechanisms of G tolerance, such as drug efflux transporters [57] could help the selection of multi-tolerant bacteria in gut microbiome [24]. In recent years, the increase in genetically modified crops with tolerance to R and other herbicides is associated to an increase in the risk of gene transfer to natural species and to a positive selection of herbicide resistant weeds [58]. Environmental impacts of herbicide resistance are still being studied. Soil and animal microbiomes should be considered as important targets. Ecological approaches are needed to study the complexity of environmental impacts [59].
The number of animals per group (n = 3) remains a limitation of this work, although similar results were observed on 3 treated groups. Samples were taken towards the end of a chronic study [29] when some animals had already died. Our findings are coherent with another recently published study showing that a GBH (but not G alone) caused an alteration in the microbiome of male Sprague-Dawley rats after a 2-week exposure below the regulatory no-observed-adverse-effect level [58] and other related pathologies are evidenced to be due to the treatment, their specificity being now demonstrated [43]. Considering the low statistical power provided by the sample size in this study, this work should be considered as a pilot study. Sex-dependence and long-term impact on gut microbiome of environmental relevant GBH residues should be investigated with larger numbers of animals.
An important consideration is that R is a mixture of G with various formulants and ingredients. These compounds can be sometimes up to 10,000 times more toxic than G in human cells in vitro [61] and have endocrine disrupting effects [62]. The toxicity of pesticides detected after some epidemiological studies has been attributed to an exposure to formulants. For instance, populations of farmers exposed to solvents or petroleum distillates have a higher risk of their children developing hypospadias [63] and more allergic and non-allergic wheeze conditions [64]. A recent study has shown that dietary emulsifiers, which are chemically similar to pesticide formulants, promoted colon cancer in a mouse model through gut microbiome alterations [65]. The toxicity of R could be either due to G or its formulants, or to a synergistic effect of all components. As mixtures are held confidential, it is difficult to attribute the toxicity to a given component, and several could be involved. Future studies involving a parallel administration of either G or R would shed light on this issue. This is in line with new methodological approaches aiming to identify the potential hazards arising from cumulative exposures to mixtures of chemicals [66,67]. Additionally, longitudinal studies will be needed to provide insight into the temporal dynamics of R toxic effects.
5. Conclusions
We have shown for the first time in vivo the long-term toxicity of R on a mammalian gut microbiome. This toxicity appears to be sex dependent since only treated females showed a dysbiosis. Microbiome disturbances substantially overlapped with those associated with liver dysfunction [43]. Molecular mechanisms of R tolerance or resistance observed in the coliform isolated strain would need to be investigated in further studies. Overall, the alteration of the Firmicutes to Bacteroidetes ratio by the exposure to environmental pollutants, including by R as shown here, can have a role in the epidemic of intestinal disorders. The traditional vision implying that only compounds that are systemically absorbed have a toxicological relevance is outdated in regard of the latest discoveries attributing major physiological roles of the gut microbiome. The study of gut microbiome composition in long-term toxicity studies performed prior to chemical market authorization would be an important step to protect human populations from the toxicity of gut microbiome disruptors.
Conflict of interest
The authors declare that there have no conflicts of interest.
Acknowledgements
The Regional Council of Ile de France is acknowledged together with CRIIGEN structural support. We also thank Lea Nature and Biocoop Foundations.
Footnotes
Supplementary data associated with this article can be found, in the online version, at https://doi.org/10.1016/j.toxrep.2017.12.005.
Appendix A. Supplementary data
The following are Supplementary data to this article:


References
- 1.Sender R., Fuchs S., Milo R. Revised estimates for the number of human and bacteria cells in the body. PLoS Biol. 2016;14:e1002533. doi: 10.1371/journal.pbio.1002533. [DOI] [PMC free article] [PubMed] [Google Scholar]
- 2.Cho I., Blaser M.J. The human microbiome: at the interface of health and disease. Nat. Rev. Genet. 2012;13:260–270. doi: 10.1038/nrg3182. [DOI] [PMC free article] [PubMed] [Google Scholar]
- 3.Sun J., Chang E.B. Exploring gut microbes in human health and disease: pushing the envelope. Genes & Diseases. 2014;1:132–139. doi: 10.1016/j.gendis.2014.08.001. [DOI] [PMC free article] [PubMed] [Google Scholar]
- 4.Conlon M.A., Bird A.R. The impact of diet and lifestyle on gut microbiota and human health. Nutrients. 2015;7:17–44. doi: 10.3390/nu7010017. [DOI] [PMC free article] [PubMed] [Google Scholar]
- 5.Blekhman R., Goodrich J.K., Huang K., Sun Q., Bukowski R., Bell J.T., Spector T.D., Keinan A., Ley R.E., Gevers D., Clark A.G. Host genetic variation impacts microbiome composition across human body sites. Genome Biol. 2015;16:191. doi: 10.1186/s13059-015-0759-1. [DOI] [PMC free article] [PubMed] [Google Scholar]
- 6.Konkel L. Inflammatory bowel disease in asia: a second chance at uncovering environmental factors. Environ. Health Perspect. 2016;124:A49–54. doi: 10.1289/ehp.124-A49. [DOI] [PMC free article] [PubMed] [Google Scholar]
- 7.Lopez-Legarrea P., Fuller N.R., Zulet M.A., Martinez J.A., Caterson I.D. The influence of Mediterranean, carbohydrate and high protein diets on gut microbiota composition in the treatment of obesity and associated inflammatory state. Asia Pac. J. Clin. Nutr. 2014;23:360–368. doi: 10.6133/apjcn.2014.23.3.16. [DOI] [PubMed] [Google Scholar]
- 8.Van den Abbeele P., Gerard P., Rabot S., Bruneau A., El Aidy S., Derrien M., Kleerebezem M., Zoetendal E.G., Smidt H., Verstraete W., Van de Wiele T., Possemiers S. Arabinoxylans and inulin differentially modulate the mucosal and luminal gut microbiota and mucin-degradation in humanized rats. Environ. Microbiol. 2011;13:2667–2680. doi: 10.1111/j.1462-2920.2011.02533.x. [DOI] [PubMed] [Google Scholar]
- 9.Chassaing B., Koren O., Goodrich J., Poole A., Srinivasan S., Ley R.E., Gewirtz A.T. Dietary emulsifiers impact the mouse gut microbiota promoting colitis and metabolic syndrome. Nature. 2015;519:92–96. doi: 10.1038/nature14232. [DOI] [PMC free article] [PubMed] [Google Scholar]
- 10.Breton J., Massart S., Vandamme P., De Brandt E., Pot B., Foligné B. Ecotoxicology inside the gut: impact of heavy metals on the mouse microbiome. BMC Pharmacol. Toxicol. 2013;14:62. doi: 10.1186/2050-6511-14-62. [DOI] [PMC free article] [PubMed] [Google Scholar]
- 11.Guo M., Huang K., Chen S., Qi X., He X., Cheng W., Luo Y., Xia K., Xu W. Combination of metagenomics and culture-based methods to study the interaction between ochratoxin a and gut microbiota. Toxicol. Sci. 2014;141:314–323. doi: 10.1093/toxsci/kfu128. [DOI] [PMC free article] [PubMed] [Google Scholar]
- 12.Saint-Cyr M.J., Perrin-Guyomard A., Houee P., Rolland J.G., Laurentie M. Evaluation of an oral subchronic exposure of deoxynivalenol on the composition of human gut microbiota in a model of human microbiota-associated rats. PLoS One. 2013;8:e80578. doi: 10.1371/journal.pone.0080578. [DOI] [PMC free article] [PubMed] [Google Scholar]
- 13.Koppová I., Bureš M., Šimůnek J. Intestinal bacterial population of healthy rats during the administration of chitosan and chitooligosaccharides. Folia Microbiol. (Praha) 2012;57:295–299. doi: 10.1007/s12223-012-0129-2. [DOI] [PubMed] [Google Scholar]
- 14.Joly Condette C., Bach V., Mayeur C., Gay-Queheillard J., Khorsi-Cauet H. Chlorpyrifos exposure during perinatal period affects intestinal microbiota associated with delay of maturation of digestive tract in rats. J. Pediatr. Gastroenterol. Nutr. 2015;61:30–40. doi: 10.1097/MPG.0000000000000734. [DOI] [PubMed] [Google Scholar]
- 15.Benbrook C.M. Trends in glyphosate herbicide use in the United States and globally. Environ. Sci. Eur. 2016;28:3. doi: 10.1186/s12302-016-0070-0. [DOI] [PMC free article] [PubMed] [Google Scholar]
- 16.Boocock M.R., Coggins J.R. Kinetics of 5-enolpyruvylshikimate-3-phosphate synthase inhibition by glyphosate. FEBS Lett. 1983;154:127–133. doi: 10.1016/0014-5793(83)80888-6. [DOI] [PubMed] [Google Scholar]
- 17.Zhi X.Y., Yao J.C., Li H.W., Huang Y., Li W.J. Genome-wide identification, domain architectures and phylogenetic analysis provide new insights into the early evolution of shikimate pathway in prokaryotes. Mol. Phylogenet. Evol. 2014;75:154–164. doi: 10.1016/j.ympev.2014.02.015. [DOI] [PubMed] [Google Scholar]
- 18.Du W., Wallis N.G., Mazzulla M.J., Chalker A.F., Zhang L., Liu W., Kallender H., Payne D.J. Characterization of Streptococcus pneumoniae 5-enolpyruvylshikimate 3-phosphate synthase and its activation by univalent cations. Eur. J. Biochem. 2000;267:222–227. doi: 10.1046/j.1432-1327.2000.00994.x. [DOI] [PubMed] [Google Scholar]
- 19.W. Abraham, Glyphosate formulations and their use for the inhibition of 5-enolpyruvylshikimate-3-phosphate synthase. Google Patents (2010).
- 20.Katagi T. Surfactant effects on environmental behavior of pesticides. Rev. Environ. Contam. Toxicol. 2008;194:71–177. doi: 10.1007/978-0-387-74816-0_4. [DOI] [PubMed] [Google Scholar]
- 21.Mesnage R., Defarge N., Spiroux de Vendomois J., Seralini G.E. Potential toxic effects of glyphosate and its commercial formulations below regulatory limits. Food Chem. Toxicol. 2015;84:133–153. doi: 10.1016/j.fct.2015.08.012. [DOI] [PubMed] [Google Scholar]
- 22.Clair E., Linn L., Travert C., Amiel C., Seralini G.E., Panoff J.M. Effects of Roundup(R) and glyphosate on three food microorganisms: geotrichum candidum, Lactococcus lactis subsp. cremoris and Lactobacillus delbrueckii subsp. Bulgaricus. Curr. Microbiol. 2012;64:486–491. doi: 10.1007/s00284-012-0098-3. [DOI] [PubMed] [Google Scholar]
- 23.Nicolas V., Oestreicher N., Velot C. Multiple effects of a commercial Roundup(R) formulation on the soil filamentous fungus Aspergillus nidulans at low doses: evidence of an unexpected impact on energetic metabolism. Environ. Sci. Pollut. Res. Int. 2016;23:14393–14404. doi: 10.1007/s11356-016-6596-2. [DOI] [PubMed] [Google Scholar]
- 24.Kurenbach B., Marjoshi D., Amabile-Cuevas C.F., Ferguson G.C., Godsoe W., Gibson P., Heinemann J.A. Sublethal exposure to commercial formulations of the herbicides dicamba, 2,4-dichlorophenoxyacetic acid, and glyphosate cause changes in antibiotic susceptibility in Escherichia coli and Salmonella enterica serovar Typhimurium. MBio. 2015;6:e00009–15. doi: 10.1128/mBio.00009-15. [DOI] [PMC free article] [PubMed] [Google Scholar]
- 25.Shehata A.A., Schrodl W., Aldin A.A., Hafez H.F., Kruger M. The effect of glyphosate on potential pathogens and beneficial members of poultry microbiota in vitro. Curr. Microbiol. 2013;66:350–358. doi: 10.1007/s00284-012-0277-2. [DOI] [PubMed] [Google Scholar]
- 26.Ackermann W., Coenen M., Schrodl W., Shehata A.A., Kruger M. The influence of glyphosate on the microbiota and production of botulinum neurotoxin during ruminal fermentation. Curr. Microbiol. 2015;70:374–382. doi: 10.1007/s00284-014-0732-3. [DOI] [PubMed] [Google Scholar]
- 27.Williams G., Kroes R., Munro I. Safety evaluation and risk assessment of the herbicide Roundup and its active ingredient glyphosate, for humans. Regul. Toxicol. Pharmacol. 2000;31:117–165. doi: 10.1006/rtph.1999.1371. [DOI] [PubMed] [Google Scholar]
- 28.Lepage P., Leclerc M.C., Joossens M., Mondot S., Blottiere H.M., Jeroen R., Erlich D., Doré J. A metagenomic insight into our gut's microbiome. Gut. 2013;62:146–158. doi: 10.1136/gutjnl-2011-301805. [DOI] [PubMed] [Google Scholar]
- 29.Séralini G.E., Clair E., Mesnage R., Gress S., Defarge N., Malatesta M., Hennequin D., Spiroux de Vendomois J. Republished study: long-term toxicity of a Roundup herbicide and a Roundup-tolerantgenetically modified maize. Environ. Sci. Eur. 2014;26:14. doi: 10.1186/s12302-014-0014-5. [DOI] [PMC free article] [PubMed] [Google Scholar]
- 30.Heras J., Domínguez C., Mata E., Pascual V., Lozano C., Torres C., Zarazaga M. GelJ −a tool for analyzing DNA fingerprint gel images. BMC Bioinf. 2015;16:270. doi: 10.1186/s12859-015-0703-0. [DOI] [PMC free article] [PubMed] [Google Scholar]
- 31.Wiklund S., Johansson E., Sjöström L., Mellerowicz E.J., Edlund U., Shockcor J.P., Gottdries J., Moritz T., Trygg J. Visualization of GC/TOF-MS-based metabolomics data for identification of biochemically interesting compounds using OPLS class models. Anal. Chem. 2008;80:115–122. doi: 10.1021/ac0713510. [DOI] [PubMed] [Google Scholar]
- 32.Eriksson L., Byrne T., Johansson E., Trygg J., Vikström C. third revised edition. MKS Umetrics AB; Malmö Sweden: 2013. Multi- and Megavariate Data Analysis Basic Principles and Applications. [Google Scholar]
- 33.Morgavi D.P., Rathahao-Paris E., Popova M., Boccard J., Nielsen K.F., Boudra H. Rumen microbial communities influence metabolic phenotypes in lambs. Front. Microbiol. 2015;6(2015):1060. doi: 10.3389/fmicb.2015.01060. [DOI] [PMC free article] [PubMed] [Google Scholar]
- 34.Tonoli D., Furstenberger C., Boccard J., Hochstrasser D., Jeanneret F., Oddermatt A., Rudaz S. Steroidomic footprinting based on ultra-high performance liquid chromatography coupled with qualitative and quantitative high-resolution mass spectrometry for the evaluation of endocrine disrupting chemicals in H295R cells. Chem. Res. Toxicol. 2015;28:955–966. doi: 10.1021/tx5005369. [DOI] [PubMed] [Google Scholar]
- 35.Poulsen M., Schroder M., Wilcks A., Kroghsbo S., Lindecrona R.H., Miller A., Frenzel T., Danier J., Rychlik M., Shu Q., Emami K., Taylor M., Gatehouse A., Engel K.H., Knudsen I. Safety testing of GM-rice expressing PHA-E lectin using a new animal test design. Food Chem. Toxicol. 2007;45:364–377. doi: 10.1016/j.fct.2006.09.003. [DOI] [PubMed] [Google Scholar]
- 36.Muñoa F.J., Pares R. Selective medium for isolation and enumeration of Bifidobacterium spp. Appl. Environ. Microbiol. 1988;54:1715–1718. doi: 10.1128/aem.54.7.1715-1718.1988. [DOI] [PMC free article] [PubMed] [Google Scholar]
- 37.Helm D., Labischinski H., Schallehn G., Naumann D. Classification and identification of bacteria by Fourier-transform infrared spectroscopy. J. Gen. Microbiol. 1991;137:69–79. doi: 10.1099/00221287-137-1-69. [DOI] [PubMed] [Google Scholar]
- 38.Alvarez-Ordonez A., Mouwen D.J., Lopez M., Prieto M. Fourier transform infrared spectroscopy as a tool to characterize molecular composition and stress response in foodborne pathogenic bacteria. J. Microbiol. Methods. 2011;84:369–378. doi: 10.1016/j.mimet.2011.01.009. [DOI] [PubMed] [Google Scholar]
- 39.Alexander T.W., Sharma R., Deng M.Y., Whetsell A.J., Jennings J.C., Wang Y., Okine E., Damgaard D., McAllister T.A. Use of quantitative real-time and conventional PCR to assess the stability of the cp4 epsps transgene from Roundup Ready canola in the intestinal, ruminal, and fecal contents of sheep. J. Biotechnol. 2004;112:255–266. doi: 10.1016/j.jbiotec.2004.04.026. [DOI] [PubMed] [Google Scholar]
- 40.Gloor G.B., Wu J.R., Pawlowsky-Glahn V., Egozcue J.J. It's all relative: analyzing microbiome data as compositions. Ann. Epidemiol. 2016;26:322–329. doi: 10.1016/j.annepidem.2016.03.003. [DOI] [PubMed] [Google Scholar]
- 41.Mesnage R., Arno M., Costanzo M., Malatesta M., Séralini G.E., Antoniou M.N. Transcriptome profile analysis reflects rat liver and kidney damage following chronic ultra-low dose Roundup exposure. Environ. Health. 2015;14:70. doi: 10.1186/s12940-015-0056-1. [DOI] [PMC free article] [PubMed] [Google Scholar]
- 42.Qin N., Yang F., Li A., Prifti E., Chen Y. Alterations of the human gut microbiome in liver cirrhosis. Nature. 2014;513:59–64. doi: 10.1038/nature13568. [DOI] [PubMed] [Google Scholar]
- 43.Mesnage R., Renney G., Séralini G.E., Ward M., Antoniou M. Multiomics reveal non-alcoholic fatty liver disease in rats following chronic exposure to an ultra-low dose of Roundup herbicide. Sci. Rep. 2016;6:39328. doi: 10.1038/srep39328. [DOI] [PMC free article] [PubMed] [Google Scholar]
- 44.Yan A.W., Fouts D.E., Brandl J., Starkel P., Torralba M., Schott E., Tsukamoto H., Nelson K.E., Brenner D.A., Schnabl B. Enteric dysbiosis associated with a mouse model of alcoholic liver disease. Hepatology. 2010;53:96–105. doi: 10.1002/hep.24018. [DOI] [PMC free article] [PubMed] [Google Scholar]
- 45.Serino M., Luche E., Gres S., Baylac A., Bergé M. et al., Metabolic adaptation to a high-fat diet is associated with a change in the gut microbiota. Gut. 2012;61:543–553. doi: 10.1136/gutjnl-2011-301012. [DOI] [PMC free article] [PubMed] [Google Scholar]
- 46.Joly C., Gay-Queheillard J., Leke A., Chardon K., Delanaud S., Bach V., Khorsi-Cauet H. Impact of chronic exposure to low doses of chlorpyrifos on the intestinal microbiota in the Simulator of the Human Intestinal Microbial Ecosystem (SHIME) and in the rat. Environ. Sci. Pollut. Res. Int. 2013;20:2726–2734. doi: 10.1007/s11356-012-1283-4. [DOI] [PubMed] [Google Scholar]
- 47.Qin J., Li R., Raes J., Arumugam M., Burgdorf K.S. A human gut microbial gene catalogue established by metagenomic sequencing. Nature. 2010;464:59–65. doi: 10.1038/nature08821. [DOI] [PMC free article] [PubMed] [Google Scholar]
- 48.Bolnick D.I., Snowberg L.K., Hirsch P.E., Lauber C.L., Org E., Parks B., Lusis A.J., Knight R., Caporaso J.G., Svanback R. Individual diet has sex-dependent effects on vertebrate gut microbiota. Nat. Commun. 2014;5:4500. doi: 10.1038/ncomms5500. [DOI] [PMC free article] [PubMed] [Google Scholar]
- 49.Neuman H., Debelius J.W., Knight R., Koren O. Microbial endocrinology: the interplay between the microbiota and the endocrine system. FEMS Microbiol. Rev. 2015;39:509–521. doi: 10.1093/femsre/fuu010. [DOI] [PubMed] [Google Scholar]
- 50.Fuhrman B.J., Feigelson H.S., Flores R., Gail M.H., Xu X., Ravel J., Goedert J.J. Associations of the fecal microbiome with urinary estrogens and estrogen metabolites in postmenopausal women. J. Clin. Endocrinol. Metab. 2014;99:4632–4640. doi: 10.1210/jc.2014-2222. [DOI] [PMC free article] [PubMed] [Google Scholar]
- 51.Lakritz J.R., Poutahidis T., Mirabal S., Varian B.J., Levkovich T. Gut bacteria require neutrophils to promote mammary tumorigenesis. Oncotarget. 2015;6:9387–9396. doi: 10.18632/oncotarget.3328. [DOI] [PMC free article] [PubMed] [Google Scholar]
- 52.Erdman S.E., Poutahidis T. Gut bacteria and cancer. Biochim. Biophys. Acta. 2015;1856:86–90. doi: 10.1016/j.bbcan.2015.05.007. [DOI] [PMC free article] [PubMed] [Google Scholar]
- 53.Lozupone C.A., Stombaugh J.I., Gordon J.I., Jansson J.K., Knight R. Diversity, stability and resilience of the human gut microbiota. Nature. 2012;489:220–230. doi: 10.1038/nature11550. [DOI] [PMC free article] [PubMed] [Google Scholar]
- 54.Ba Q., Li M., Chen P., Huang C., Duan X., Lu L. Sex-dependent effects of cadmium exposure in early life on gut microbiota and fat accumulation in mice. Environ. Health Perspect. 2017;125:437. doi: 10.1289/EHP360. [DOI] [PMC free article] [PubMed] [Google Scholar]
- 55.Kushiro A., Chervaux C., Cools-Portier S., Perony A., Legrain-Raspaud S. Antimicrobial susceptibility testing of lactic acid bacteria and bifidobacteria by broth microdilution method and Etest. Int. J. Food Microbiol. 2009;132:54–58. doi: 10.1016/j.ijfoodmicro.2009.03.012. [DOI] [PubMed] [Google Scholar]
- 56.Amrhein N., Johänning D., Schab J., Schulz A. Biochemical basis for glyphosate-tolerance in a bacterium and a plant tissue culture. FEBS Lett. 1983;157:191–196. [Google Scholar]
- 57.Staub J.M., Brand L., Tran M., Kong Y., Rogers S.G. Bacterial glyphosate resistance conferred by overexpression of an E. coli membrane efflux transporter. J. Ind. Microbiol. Biotechnol. 2012;39:641–647. doi: 10.1007/s10295-011-1057-x. [DOI] [PubMed] [Google Scholar]
- 58.Tsatsakis A.M., Nawaz M.A., Tutelyan V.A., Golokhvast K.S., Kalantzi O.I., Chung D.H., Chung G. Impact on environment, ecosystem, diversity and health from culturing and using GMOs as feed and food. Food Chem. Toxicol. 2017;107:108–121. doi: 10.1016/j.fct.2017.06.033. [DOI] [PubMed] [Google Scholar]
- 59.Tsatsakis A.M., Nawaz M.A., Kouretas D., Balias G., Savolainen K., Tutelyan V.A., Chung G. Environmental impacts of genetically modified plants: a review. Environ. Res. 2017;156:818–833. doi: 10.1016/j.envres.2017.03.011. [DOI] [PubMed] [Google Scholar]
- 60.Nielsen L.N., Roager H.M., Casas M.E., Frandsen H.L., Gosewinkel U., Bester K., Licht T.R., Hendriksen N.B., Bahl M.I. Glyphosate has limited short-term effects on commensal bacterial community composition in the gut environment due to sufficient aromatic amino acid levels. Environ. Pollut. 2017;233:364. doi: 10.1016/j.envpol.2017.10.016. [DOI] [PubMed] [Google Scholar]
- 61.Mesnage R., Bernay B., Seralini G.E. Ethoxylated adjuvants of glyphosate-based herbicides are active principles of human cell toxicity. Toxicology. 2013;313 doi: 10.1016/j.tox.2012.09.006. [DOI] [PubMed] [Google Scholar]
- 62.Defarge N., Takács E., Lozano V., Mesnage R., Spiroux de Vendômois J., Seralini G.E., Székács A. Co-formulants in glyphosate-based herbicides disrupt aromatase activity in human cells below toxic levels. Int. J. Environ. Res. Public Health. 2016;13:264. doi: 10.3390/ijerph13030264. [DOI] [PMC free article] [PubMed] [Google Scholar]
- 63.Carmichael S.L., Yang W., Roberts E.M., Kegley S.E., Wolff C. Hypospadias and residential proximity to pesticide applications. Pediatrics. 2013;132(5):e1216–e1226. doi: 10.1542/peds.2013-1429. [DOI] [PMC free article] [PubMed] [Google Scholar]
- 64.Hoppin J.A., Umbach D.M., Long S., London S.J., Henneberger P.K. Pesticides are associated with allergic and non-allergic wheeze among male farmers. Environ. Health Perspect. 2016;125(4):535. doi: 10.1289/EHP315. [DOI] [PMC free article] [PubMed] [Google Scholar]
- 65.Viennois E., Merlin D., Gewirtz A.T., Chassaing B. Dietary emulsifier-induced low-grade inflammation promotes colon carcinogenesis. Cancer Res. 2016;77(1):27–40. doi: 10.1158/0008-5472.CAN-16-1359. [DOI] [PMC free article] [PubMed] [Google Scholar]
- 66.Tsatsakis A.M., Kouretas D., Tzatzarakis M.N., Stivaktakis P., Tsarouhas K., Golokhvast K.S., Rakitskii V.N., Tutelyan V.A., Hernandez A.F., Rezaee R., Chung G., Fenga C., Engin A.B., Neagu M., Arsene A.L., Docea A.O., Gofita E., Calina D., Taitzoglou I., Liesivuori J., Hayes A.W., Gutnikov S., Tsitsimpikou C. Simulating real-life exposures to uncover possible risks to human health: a proposed consensus for a novel methodological approach. Hum. Exp. Toxicol. 2017;36:554–564. doi: 10.1177/0960327116681652. [DOI] [PubMed] [Google Scholar]
- 67.Tsatsakis A.M., Docea A.O., Tsitsimpikou C. New challenges in risk assessment of chemicals when simulating real exposure scenarios; simultaneous multi-chemicals' low dose exposure. Food Chem. Toxicol. 2016;96:174–176. doi: 10.1016/j.fct.2016.08.011. [DOI] [PubMed] [Google Scholar]
Associated Data
This section collects any data citations, data availability statements, or supplementary materials included in this article.