

Abstract
The CRISPR‐associated protein Cas9 is widely used for genome editing because it cleaves target DNA through the assistance of a single‐guide RNA (sgRNA). Structural studies have revealed the multi‐domain architecture of Cas9 and suggested sequential domain movements of Cas9 upon binding to the sgRNA and the target DNA. These studies also hinted at the flexibility between domains; however, it remains unclear whether these flexible movements occur in solution. Here, we directly observed dynamic fluctuations of multiple Cas9 domains, using single‐molecule FRET. We found that the flexible domain movements allow Cas9 to adopt transient conformations beyond those captured in the crystal structures. Importantly, the HNH nuclease domain only accessed the DNA cleavage position during such flexible movements, suggesting the importance of this flexibility in the DNA cleavage process. Our FRET data also revealed the conformational flexibility of apo‐Cas9, which may play a role in the assembly with the sgRNA. Collectively, our results highlight the potential role of domain fluctuations in driving Cas9‐catalyzed DNA cleavage.
Keywords: conformational plasticity, gene editing, intramolecular FRET
Subject Categories: Methods & Resources, RNA Biology, Structural Biology
Introduction
Clustered regularly interspaced short palindromic repeats (CRISPR)–CRISPR‐associated (Cas) systems were originally found as adaptive immunity systems against viruses and plasmids in bacteria and archaea (Jansen et al, 2002; Bolotin et al, 2005; Pourcel et al, 2005; Soria et al, 2005; Barrangou et al, 2007). Unlike other CRISPR–Cas systems that employ ensembles of Cas proteins to cleave nucleic acids, the type II CRISPR–Cas system utilizes the single RNA‐guided endonuclease Cas9 for the destruction of foreign nucleic acids (Shmakov et al, 2017). Streptococcus pyogenes Cas9 (henceforth, Cas9) has been widely used as a powerful genome editing tool (Cong et al, 2013; Mali et al, 2013), especially since Cas9 can be programmed by a synthetic single‐guide RNA (sgRNA) to cleave any specific DNA sequence followed by a protospacer adjacent motif (PAM) (Jinek et al, 2012). In addition, Cas9 has been applied to visualize, modify, and express endogenous target genes (Hsu et al, 2014; Konermann et al, 2014; Terns & Terns, 2014; Sternberg & Doudna, 2015). The continuing application of Cas9 technologies to various studies has stimulated strong interest in the molecular basis by which Cas9 recognizes and cleaves its target DNA.
A series of crystal structures of Cas9 with and without the sgRNA and the target DNA have been solved (Anders et al, 2014; Jinek et al, 2014; Nishimasu et al, 2014; Jiang et al, 2015, 2016). These structural studies revealed the multi‐domain architecture of Cas9, which mainly consists of a recognition (REC) lobe and a nuclease (NUC) lobe. The NUC lobe can be further divided into the HNH, RuvC, and PAM‐interacting (PI) domains. The crystal structures also indicated the sequential rearrangements of the Cas9 domains upon binding to the sgRNA and the target DNA. The binding of the sgRNA induces a large rotation of the REC lobe to convert Cas9 into the active conformation to form a central channel, which can accommodate the sgRNA‐target DNA heteroduplex. Along with the DNA binding, the PI domain recognizes the PAM sequence in the target DNA, leading to the heteroduplex formation (Anders et al, 2014). This heteroduplex formation induces the translocation of the HNH domain and the activation of the RuvC domain, to cleave the target double‐stranded DNA. These domain rearrangements during the Cas9 catalytic processes have been further confirmed by bulk FRET measurements (Sternberg et al, 2015).
The crystal structures have also shown that some parts of Cas9 are disordered, suggesting that the domain configurations are flexible under specific conditions (Nishimasu et al, 2014; Jiang et al, 2016). In particular, the crystal structures and bulk FRET measurements indicated the conformational change of the HNH domain in the sgRNA/DNA‐Cas9 ternary complex (Anders et al, 2014; Nishimasu et al, 2014; Sternberg et al, 2015; Jiang et al, 2016). In all of the available crystal structures, the active site in the HNH domain is located away from the cleavage site of the target DNA (Anders et al, 2014; Nishimasu et al, 2014; Jiang et al, 2016). Thus, the transition of the HNH domain that leads Cas9 to adopt conformations beyond those solved by the crystal structures should be crucial for the DNA cleavage. In addition, a previous single‐molecule study implied the conformational flexibility during the DNA binding process (Singh et al, 2016), and molecular dynamics simulations have also shed light on the importance of the flexible movements of the Cas9 domains in the sgRNA/DNA binding (Palermo et al, 2016; Zuo & Liu, 2016; Zheng, 2017). Thus, the flexibility of the Cas9 domain configuration could be an important factor in the Cas9 catalytic processes. However, the functional dynamics of the Cas9 domains in solution was not fully understood.
To address this question, we directly observed the movement between the REC‐RuvC, REC‐HNH, and HNH‐RuvC domains, using single‐molecule FRET (smFRET). We found that a subset of Cas9 molecules show dynamic fluctuations in the FRET efficiency even in the steady state in the presence or absence of nucleic acids, indicating that the Cas9 domains move in a flexible and reversible manner. Further analysis suggested that the HNH domain accesses the DNA cleavage site only during the flexible domain movements, providing new insights into the molecular basis of the Cas9 catalytic process.
Results
Experimental setup for single‐molecule FRET measurements of Cas9
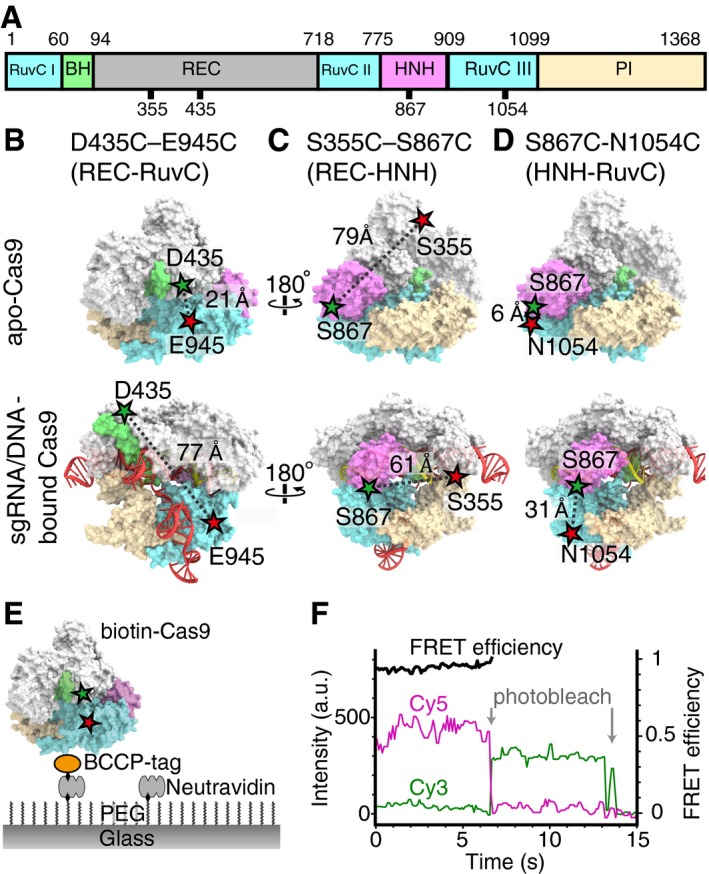
To directly observe the mobility of the Cas9 domains at the single‐molecule level, Cas9 was site‐specifically labeled with Cy3 and Cy5 fluorochromes. Using C80L/C574E cysteine‐free Cas9, which has activity comparable to wild‐type Cas9 (Nishimasu et al, 2014), as the starting construct, we introduced three pairs of cysteine residues at D435/E945, S355/S867, and S867/N1054 (Fig 1A), as in a previous bulk FRET study (Sternberg et al, 2015). These three FRET constructs were designed to monitor the movements between REC‐RuvC (D435C–E945C), REC‐HNH (S355C–S867C), and HNH‐RuvC (S867C‐N1054C), respectively (Fig 1B–D). The introduced cysteine residues were labeled with Cy3 (donor)‐ and Cy5 (acceptor)‐maleimide. Furthermore, the constructs were genetically fused with biotin carboxyl carrier protein (BCCP) at their N‐terminus, to anchor the Cas9 molecules on a glass surface via an avidin–biotin linkage (Fig 1E). We first examined whether the FRET constructs retain their catalytic activity. All three BCCP‐tagged fluorescent Cas9 constructs showed over 90% DNA cleavage activity as compared with wild‐type Cas9 (Fig EV1), confirming that the cleavage activity is not substantially affected by the fluorescent labeling and the fusion with the BCCP tag.
Figure 1. Experimental setup for smFRET measurement of Cas9 domain movements.
-
AThe domain diagram of Cas9. The numbers indicate the amino acids that were fluorescently labeled in this study.
-
B–DDesigns of the Cas9 constructs for smFRET measurements: D435C–E945C (B), S355C–S867C (C), and S867C‐N1054C (D). Crystal structures of apo‐Cas9 (PDB 4CMP) and the sgRNA/DNA‐Cas9 complex (PDB 4OO8). The REC lobe, the bridge helix, and the RuvC, HNH, and PI domains are colored gray, green, blue, pink, and light brown, respectively. The Cy3‐ and Cy5‐labeled amino acids are indicated by green and red stars.
-
ESchematic drawing of the smFRET measurement system. Cas9, biotinylated via biotin carboxyl carrier protein (BCCP), was immobilized on a PEG (polyethylene glycol)‐ and biotin‐PEG‐coated glass surface, using the avidin–biotin system.
-
FTime trajectories of smFRET efficiency of the D435C–E945C construct, labeled with Cy3 and Cy5. The green and magenta lines represent the fluorescence intensities of Cy3 and Cy5, respectively. The FRET efficiency (black lines) was calculated from the intensities of Cy3 and Cy5 before the photobleaching of either fluorochrome.
Figure EV1. DNA cleavage activity of fluorescently labeled biotin‐Cas9.
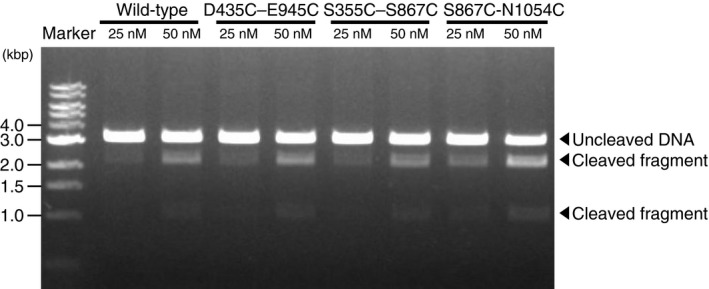
All three FRET constructs labeled with Cy3 and Cy5 were tested for nuclease activity. After an incubation of 25 or 50 nM Cas9‐sgRNA complex and 5 nM target DNA for 5 min at 37°C, a fraction of the DNA was cleaved into two fragments. Band intensity analysis suggests that the three FRET constructs retain nuclease activity comparable to that of non‐labeled wild‐type Cas9 (1.1 ± 0.1 for D435C–E945C, 0.9 ± 0.1 for S355C–S867C, and 1.5 ± 0.3 for S867C‐N1054C; mean relative activity ± SEM, n = 3).
We then performed smFRET measurements of the fluorescently labeled Cas9 molecules under nucleic‐acid free, sgRNA‐bound, and sgRNA/DNA‐bound conditions, using total internal reflection fluorescent microscopy (TIRFM). To ensure the binding states of the Cas9 molecules in each condition, we incubated 0.3 to 1 nM fluorescently labeled Cas9 and 200 nM sgRNA with or without 200 nM target DNA, to measure the sgRNA‐bound and sgRNA/DNA‐bound Cas9 molecules. Considering the saturation rate of sgRNA on Cas9 (Fig EV2) and the dissociation constant value (K d) of 0.8 nM for the target DNA loading onto sgRNA‐bound Cas9 (Sternberg et al, 2015), we assumed that almost all of the fluorescently labeled Cas9 molecules bind the nucleic acids under our assay conditions. The sgRNA/DNA‐bound molecules in our assay should maintain the ternary complex of the sgRNA and the cleaved target DNA, because previous studies demonstrated that Cas9 cleaves the target DNA at a rate higher than 10 min−1 and remains tightly bound to the cleaved DNA (Jinek et al, 2012; Sternberg et al, 2014, 2015). The Cas9 molecules were then anchored on the glass surface through BCCP and illuminated with a 532‐nm laser under TIRFM. The FRET efficiency of each Cas9 molecule was calculated from the recorded fluorescence intensities of Cy3 and Cy5 (Fig 1F). After the smFRET measurements, we confirmed that 68–95% of the observed Cas9 molecules labeled with Cy3 and Cy5 showed FRET under the tested conditions (Table EV1), using the acceptor bleaching method (see Materials and Methods). Thus, we further analyzed the FRET trajectories of Cas9 molecules that showed FRET.
Figure EV2. Stoichiometry of sgRNA binding to Cas9.
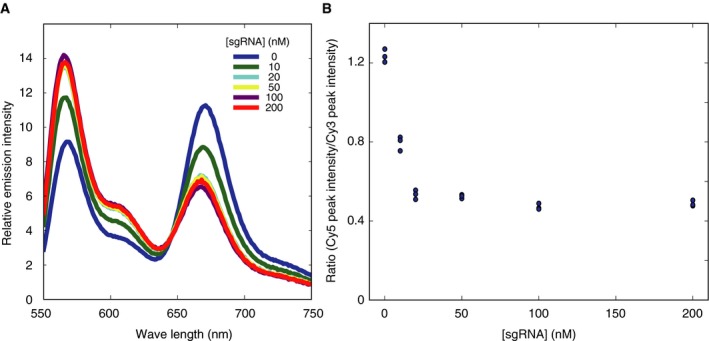
- Fluorescence emission spectra of 20 nM fluorescent Cas9 (D435C–E945C) excited at 532 nm. The Cy3 and Cy5 fluorescence intensity changes were coupled with the FRET efficiency change, according to the sgRNA concentration.
- Quantification of the ratio between Cy3 and Cy5 fluorescence intensities. The ratios of Cy5 fluorescence peak intensity over Cy3 fluorescence peak intensity were plotted against the sgRNA concentration (n = 3 for each sgRNA concentration). The FRET efficiency change coupled with the sgRNA binding was almost saturated at the Cas9 to sgRNA ratio of 1:1.
Dynamic rearrangements of the Cas9 domains upon nucleic acid binding
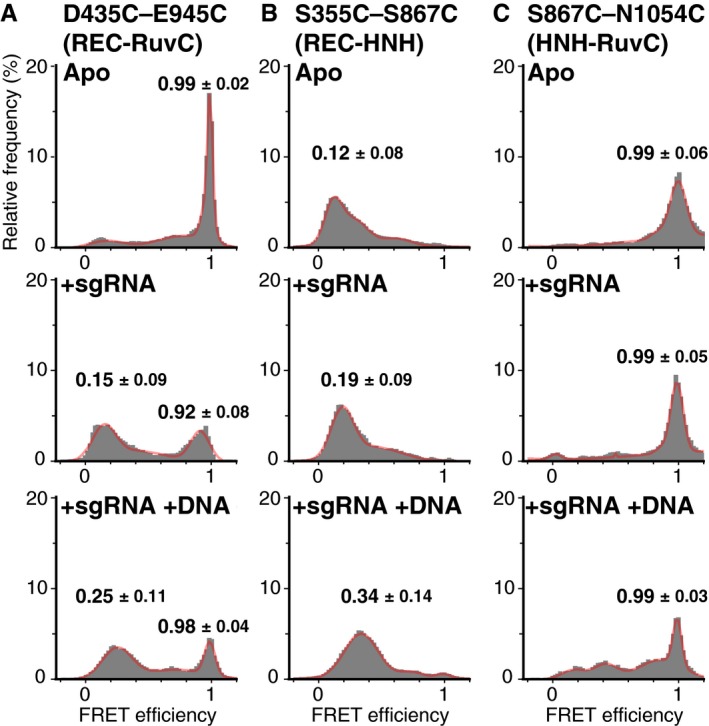
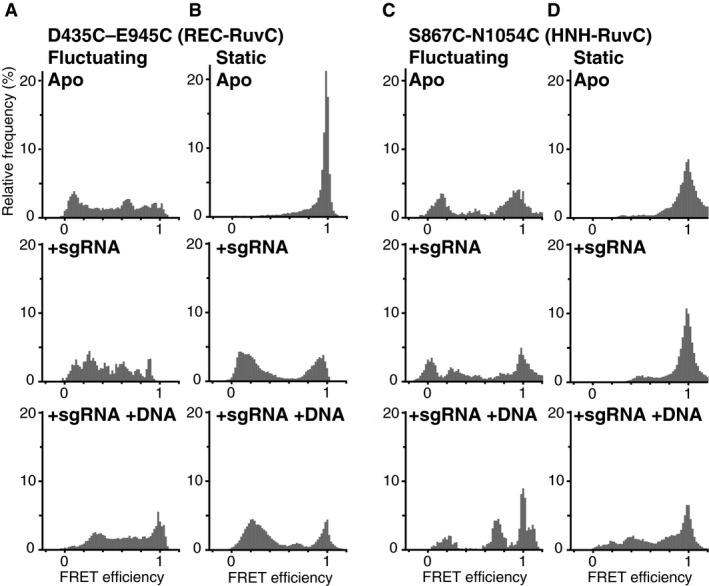
From the FRET efficiency of the Cas9 molecules (Fig 2), we validated the dynamic rearrangements of the Cas9 domains upon sgRNA and target DNA binding. In the apo state (Fig 2A), the FRET histograms of the fluorescently labeled D435C–E945C (left panel) and S867C‐N1054C (right panel) showed primary peaks at 0.99 ± 0.02 and 0.99 ± 0.06 (median ± HWHM) FRET efficiencies, respectively. Consistent with the crystal structures (Fig 1A, C and Table EV1), the high FRET efficiencies of the constructs indicated the close locations between the labeled amino acids. In contrast, the FRET histogram of the S355C–S867C construct in the apo state showed the primary peak at 0.12 ± 0.08 (Fig 2A, center panel), indicating the longer distance between the labeled amino acids. Upon sgRNA binding, the FRET efficiency of the D435C–E945C construct decreased (Fig 2B, left panel), suggesting that sgRNA binding induced drastic rotation of the REC lobe relative to the RuvC domain. In contrast, the changes in the FRET efficiencies of S355C‐S867C and S867C‐N1054C upon the sgRNA binding were only slight (Fig 2B), as estimated from the crystal structures (Table EV1). Subsequent DNA binding increased the FRET peak values of D435C‐E945C to 0.25 ± 0.11 and 0.98 ± 0.04 (Fig 2C, left panel). Similarly, the S355C–S867C construct exhibited an increase in the FRET efficiency upon the target DNA binding (Fig 2B, center panel), suggesting that the HNH domain approaches the cleavage site of the target DNA. This model of the HNH domain transition was further supported by the appearance of a low FRET distribution (0–0.5 FRET efficiency) in the histogram of the S867C‐N1054C construct with the sgRNA and the target DNA (Fig 2C, right panel). Note that the changes in both the distance and orientation between the domains would contribute to the FRET efficiency shifts, because the fluorochromes on the Cas9 molecules showed high anisotropy (0.34–0.41 for Cy3 and 0.27–0.32 for Cy5, Appendix Fig S1A–C). Although the high anisotropy values obtained here is most likely due to the short fluorescence lifetime of dyes on Cas9 molecules (0.71–0.78 ns, Appendix Fig S1D–G), we cannot exclude the possibility of low mobility of dyes. Thus, the orientation of dye molecules may affect the FRET efficiency. Still, the timing and direction of the FRET shifts were consistent with the previously proposed model of conformational changes in Cas9 (Jinek et al, 2014; Nishimasu et al, 2014; Jiang et al, 2015, 2016).
Figure 2. FRET efficiency histograms of all measured Cas9 molecules.
-
A–CFRET efficiency histograms of the D435C–E945C (left panels), S355C–S867C (center panels), and S867C‐N1054C (right panels) constructs. The histograms were generated from the time traces of the FRET efficiency in the absence of nucleic acids (A), in the presence of 200 nM sgRNA (B), and in the presence of 200 nM sgRNA and 200 nM target DNA (C). All of the experiments shown in this figure were performed in the presence of 2 mM MgCl2. The numbers of measured molecules are summarized in Table EV1. The histograms were fitted with multi‐peaks Gaussian curves (red). The peak values of the primary peaks of FRET efficiency are shown on the histograms (median ± HWHM).
Source data are available online for this figure.
The Cas9 domains showed highly flexible and reversible movements
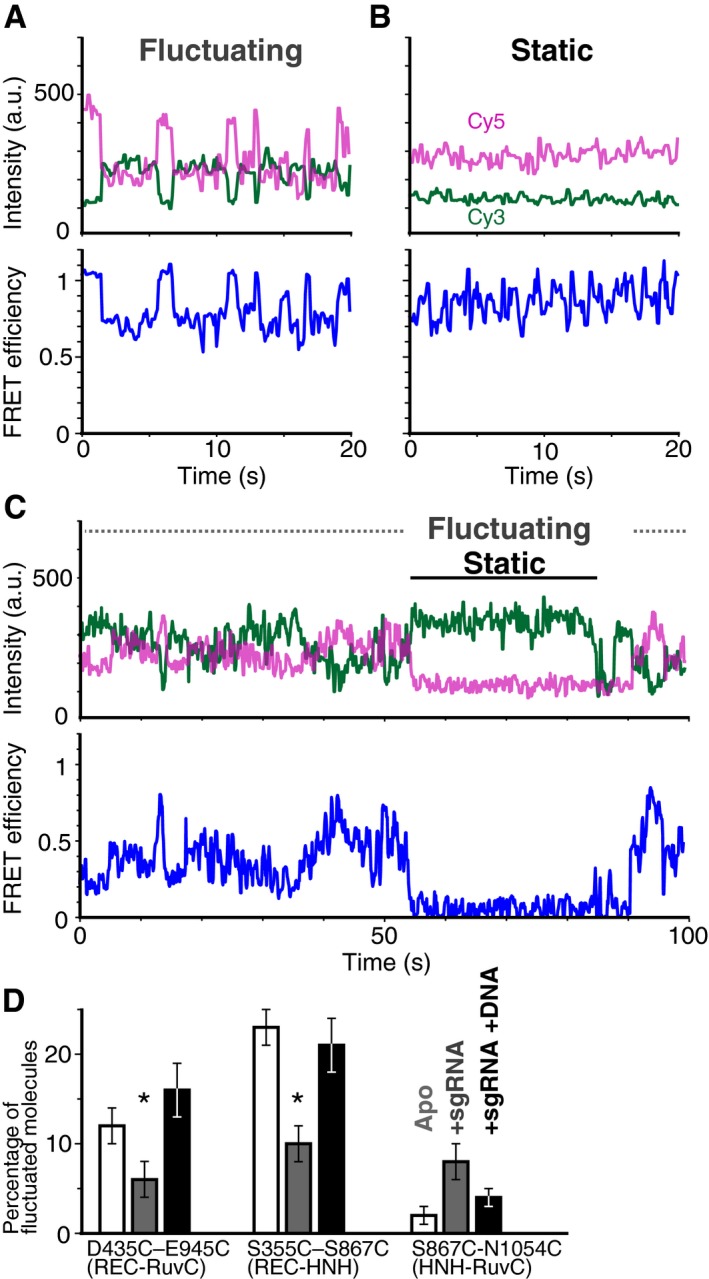
The histograms of the FRET efficiency under all of the tested conditions did not exhibit simple single‐peak distributions (Fig 2), suggesting that the distances and/or angles between the Cas9 domains are not fixed. Consistently, a fraction of Cas9 molecules showed frequent fluctuations in the FRET efficiency between multiple FRET states (Fig 3A–C). These fluctuations indicate the highly flexible and reversible movements of the Cas9 domains and represent the direct observation of the Cas9 domain fluctuations in solution.
Figure 3. The binding of sgRNA and target DNA changes the flexibility of the Cas9 domains.
-
A, BRepresentative time trajectories of fluctuating (A) and static (B) D435C‐E945C molecules in the sgRNA/DNA‐bound ternary complex labeled with Cy3 and Cy5. The green and magenta lines represent the fluorescence intensities of Cy3 and Cy5, respectively (top trace). The FRET efficiencies (black lines) were calculated from the intensities of Cy3 and Cy5 (bottom trace).
-
CSome of the time trajectories of the fluorescence intensities (top trace) and the smFRET efficiency (bottom trace) show both fluctuating of and static phases.
-
DThe percentage of Cas9 molecules that showed fluctuations in FRET efficiency. The numbers of measured molecules are summarized in Table EV1. The bars from left to right represent the percentages in the absence of nucleic acid (white), in the presence of 200 nM sgRNA (gray), and in the presence of 200 nM sgRNA and 200 nM target DNA (black). Error bars show SEM. Each data set was collected from three repetitive experiments. Asterisks indicate the statistical differences (P < 0.05, Steel–Dwass test).
Source data are available online for this figure.
During the 100‐s observations, some molecules exhibited transitions between the static and fluctuating states (Fig 3C), suggesting that the Cas9 domains are in equilibrium between these states. Since the flexibility of the Cas9 domains should affect this equilibrium, we considered the percentage of fluctuating molecules to be an indicator of the domain flexibility (Fig 3D). Here, we defined a fluctuating molecule as a fluorescently labeled Cas9 that showed more than two anti‐correlated shifts in the fluorescence intensities of Cy3 and Cy5 during our observation period (see Materials and Methods).
The percentage of fluctuating molecules depended on the binding state of Cas9 (Fig 3D). As a common property of the D435C–E945C and S355C–S867C constructs, sgRNA binding lowered the percentage, suggesting that the sgRNA binding decreases the flexibility between the REC and NUC lobes. In contrast, the target DNA binding increased the percentage of fluctuating molecules for both constructs (Fig 3D), suggesting the increased flexibility between the REC and NUC lobes in the Cas9‐sgRNA‐DNA ternary complex. Because the two opposite positions in the REC domain (S435 and S355) showed similar tendencies in their flexibility, it is most likely that the flexible movements occur between the two lobes, although the FRET fluctuations could be due to the increased dynamics within the REC lobe. We further analyzed the flexibility in the NUC lobe, using the S867C‐N1054C construct. Unlike the flexibility between the REC and NUC lobes, the flexibility between the HNH and RuvC domains apparently increased upon the sgRNA binding, but the differences were not statistically significant (P = 0.08, Steel–Dwass test). As compared with the D435C–E945C and S355C–S867C constructs, S867C‐N1054C showed a relatively low number of fluctuating molecules (Fig 3D); however, there is a possibility that we underestimated the number of fluctuating molecules because, due to the short distance between S867 and N1054, the construct requires a relatively larger domain displacement for the FRET efficiency shift. Thus, it is not appropriate to compare the flexibilities of these three domains observed in the three constructs. However, because the percentages of fluctuating molecules of the D435C–E945C and S355C–S867C constructs were highly dependent on the nucleic acid binding state, we conclude that the binding of the nucleic acids regulates the flexibility, at least between the REC and NUC lobes.
To elucidate the conformational differences between the fluctuating and static Cas9 molecules, we compared their FRET histograms (Figs 4 and EV3). We found that the FRET efficiency of fluctuating D435C–E945C molecules in the apo state was widely distributed from 0 to 1, in contrast to the very narrow FRET distribution (HWHM = 0.02) of static molecules in the apo state (Fig EV3). Considering the appearance of the low FRET peak in the FRET distribution of sgRNA‐bound D435C–E945C (Fig 2B), some of the fluctuating molecules in the apo state should adopt a conformation that resembles the sgRNA‐bound form of Cas9. A similar tendency was observed in the S355C–S867C and S867C‐N1054C constructs. The fluctuating S355C–S867C molecules in the apo state showed widely distributed FRET efficiencies without clear Gaussian peaks (Fig 4). In contrast, the static molecules showed a narrow peak at ~0.2 FRET efficiency (mean ± HWHM = 0.17 ± 0.07) in the apo state, and a gradual increase in the efficiency upon sgRNA binding. In the case of the S867C‐N1054C construct, the FRET distribution of the static molecules showed a narrow peak at a high FRET efficiency (mean ± HWHM = 0.99 ± 0.06) in the apo state, and the gradual appearance of a low FRET population upon sgRNA and target DNA binding (Fig EV3). In contrast, the fluctuating S867C‐N1054C molecules frequently showed low FRET efficiencies in the apo and sgRNA‐bound states. These results demonstrate that flexible domain movements allow Cas9 to adopt different conformations from the static ones observed in the crystal structures.
Figure 4. The HNH domain transiently exists at the cleavage‐competent D position during the flexible movement.
-
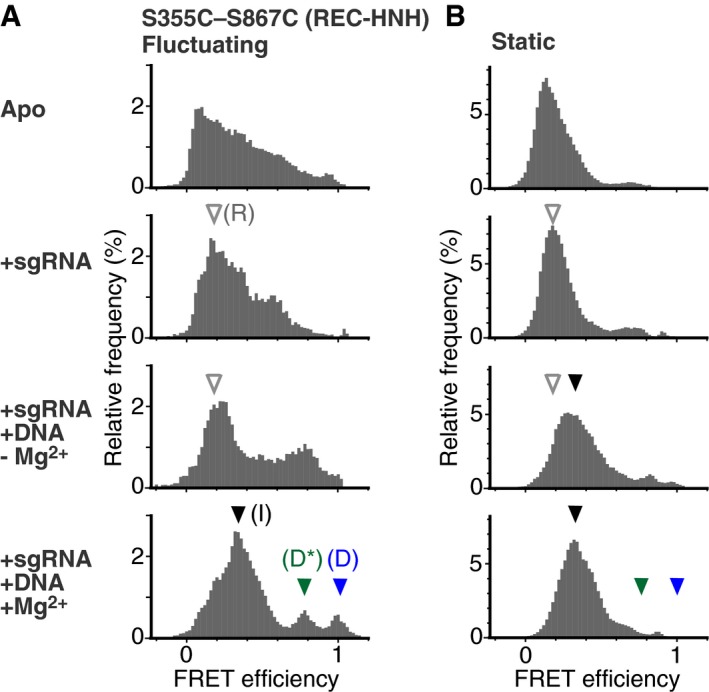
A, BFRET efficiency histograms of fluctuating (A) and static (B) S355C–S867C molecules. The histograms were generated from the time traces of the FRET efficiency. The numbers of measured molecules are summarized in Table EV1. The panels from top to bottom show data in the absence of nucleic acids, in the presence of 200 nM sgRNA, in the presence of 200 nM sgRNA and 200 nM target DNA without Mg2+, and in the presence of 200 nM sgRNA and 200 nM target DNA with Mg2+, respectively. In the presence of Mg2+, the fluctuating molecules exhibited three clear FRET efficiency peaks, corresponding to the three HNH positions relative to the REC lobe (A). According to the structural and functional data, we refer to the HNH positions corresponding to the ˜0.2 (white arrowhead), ˜0.4 (black arrowhead), ˜0.8 (green arrowhead), and ˜1.0 (blue arrowhead) FRET efficiencies as the R, I, D*, and D positions, respectively. The same FRET efficiencies are indicated by the arrowheads in the histograms of static molecules (B).
Source data are available online for this figure.
Figure EV3. FRET efficiency histograms of fluctuating and static Cas9 molecules.
-
A–DFRET efficiency histograms of fluctuating D435C–E945C (A), static D435C–E945C (B), fluctuating S867C‐N1054C (C), and static S867C‐N1054C (D). The numbers of measured molecules are summarized in Table EV1. The top, middle, and bottom panels show data acquired in the absence of the nucleic acids, in the presence of 200 nM sgRNA, and in the presence of 200 nM sgRNA and 200 nM target DNA, respectively. All of the data in this figure were obtained in assay buffer containing 2 mM MgCl2.
The HNH domain accessed the DNA cleavage‐competent position only during the flexible movement
To assess the effects of the flexible domain movements on the DNA cleavage process, we further analyzed the movements of the HNH domain in the Cas9‐sgRNA‐DNA ternary complex. The FRET efficiency distributions of the fluctuating S355C–S867C molecules in the ternary complex exhibited several clear peaks, in contrast to the widespread distributions of the apo‐Cas9 and sgRNA‐bound binary complex (Fig 4). These results suggest that the HNH domain in the ternary complex moves between distinct positions relative to the REC lobe. Consistently, previous studies have demonstrated that the ternary complex can adopt at least two conformations in which the HNH domain is close to or far from the cleavage site of the target strand (Anders et al, 2014; Nishimasu et al, 2014; Jiang et al, 2016).
Since Cas9 requires Mg2+ for DNA cleavage (Jinek et al, 2012), the Cas9‐sgRNA‐DNA complex can be trapped in the pre‐cleavage state in the absence of Mg2+. The peak values of the FRET efficiency were ~0.2 and ~0.8 in the absence of Mg2+ (Fig 4A). As the lower peak value (~0.2) was similar to that of the sgRNA‐bound S355C‐S867C binary complex (Fig 2B), we considered the molecules with lower FRET efficiency as representing the RNA‐bound (R) conformations, in which the HNH domain is located far from the target DNA (R position; distance between S355 and S867 ~8 nm, Table EV1), as observed in a recent smFRET study (Dagdas et al, 2017). The higher FRET efficiency (~0.8) indicates that the HNH domain exists very close to the cleavage site, although Cas9 does not cleave the target DNA in the absence of Mg2+. Therefore, we refer to the HNH position with the higher FRET efficiency as the DNA semi‐docked pre‐cleavage (D*) position. The time trajectories of the FRET efficiency suggested that the HNH domain in the ternary complex fluctuates between the R and D* positions in the absence of Mg2+.
The addition of Mg2+ to the ternary complex clearly changed the manner of the HNH fluctuations (Fig 4A). The addition of Mg2+ increased the percentage of fluctuating molecules more than twofold (7 ± 1% to 20 ± 2%, mean ± SEM) and had only a slight effect on the FRET histogram of the S355C–S867C molecules remaining in the static state (Fig 4B). In contrast, fluctuating sgRNA/DNA‐bound S355C–S867C molecules showed three major FRET efficiency peaks in the presence of Mg2+ (approximately 0.4, 0.8, and 1.0; Fig 4A). The addition of Mg2+ increased the primary peak value to ~0.4, consistent with the previous bulk FRET study (Sternberg et al, 2015). As the value of ~0.4 is in between those in the absence of Mg2+ (~0.2 and ~0.8), the HNH domain in the majority of the Cas9 molecules would be located at an intermediate (I) position between the R and D* positions. The probability of the HNH domain existing in the D* position decreased by the addition of Mg2+. Instead of the decrease of the ~0.8 FRET peak, the peak of the highest FRET efficiency (~1.0) appeared in the presence of Mg2+. The highest FRET efficiency was not observed in the absence of Mg2+, suggesting that the HNH domain can visit the third position only in the presence of Mg2+. Consistently, the probability of the HNH domain existing in the third position increased when the Mg2+ concentration was increased (Fig EV4). Increases in the Mg2+ concentrations also enhanced the DNA cleavage rate (Fig EV4A and B), yielding a strong correlation between the cleavage rate and the percentages of the Cas9 molecules showing the highest FRET efficiency (Fig EV4C and D). These results indicate that the third position represents the conformation in which the HNH domain cleaves the target DNA. Thus, we refer to this HNH position as the DNA‐docked cleavage‐competent (D) position. Importantly, very few Cas9 molecules in the static state showed the FRET efficiency corresponding to the D position (Fig 4B), suggesting that the flexible movement is critical for the HNH domain to be located at the cleavage‐competent D position. The time trajectories of the FRET efficiency demonstrated frequent and reversible transitions between these three FRET states (Fig 5A), suggesting that the HNH domain fluctuates between the I, D*, and D positions.
Figure EV4. Effects of Mg2+ concentration on the DNA cleavage activity and the HNH location in the sgRNA/DNA‐Cas9 ternary complex.
-
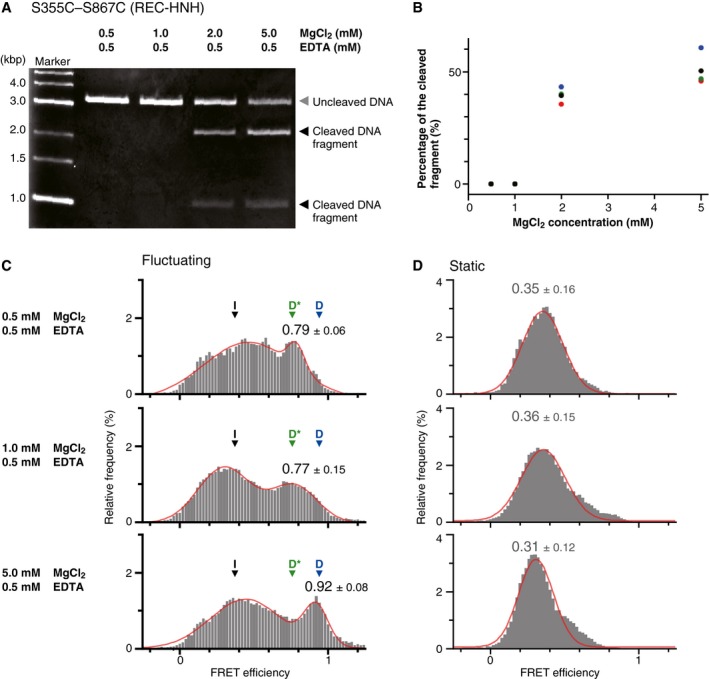
ARepresentative gel image of the DNA cleavage assay using the fluorescently labeled S355C–S867C construct. The sgRNA/DNA‐Cas9 ternary complex was incubated at room temperature (25°C) for 30 min. This condition is equivalent to that of the smFRET measurement, as we observed smFRET for approximately 30–40 min at room temperature.
-
BPercentages of cleaved DNA against MgCl2 concentration. The plot shows the results of four individual assays (black, blue, green, and red balls) for each MgCl2 concentration. While the ternary complex with 0.5 or 1.0 mM MgCl2 did not cleave the DNA, the complex with 2.0 and 5.0 mM MgCl2 cleaved 39 ± 3% and 51 ± 6% (mean ± SEM, n = 4) of the DNA, respectively.
-
C, DFRET efficiency histograms of fluctuating (C) and static (D) S355C–S867C molecules. The panels from top to bottom show data in the presence of 0.5, 1, and 5 mM MgCl2. All of the assays were performed in the presence of 0.5 mM EDTA. The low, middle, and high FRET efficiencies corresponding the I, D*, and D positions of the HNH domain are indicated by black, green, and blue arrowheads, respectively (C). The numbers of observed molecules were 57, 72, and 40 for 0.5, 1, and 5 mM MgCl2 conditions in (C), and 57, 55, and 70 for those in (D), respectively. The number of peaks in the histograms was estimated to be two for the histograms in (C) and one for the histograms in (D), using Silverman's test (threshold: P = 0.01). Thus, we fitted the histograms with two‐peak (C) or one‐peak (D) Gaussian distribution function (red curves). The peak values and widths of the higher FRET peaks were indicated on the histograms (median ± HWHM). The DNA cleavage activity (A, B) correlated well with the appearance of the highest FRET efficiency peak (C), indicating that the HNH domain in the D position adopts the cleavage‐competent state.
Figure 5. Reversible transitions of the HNH positioning in the ternary complex.
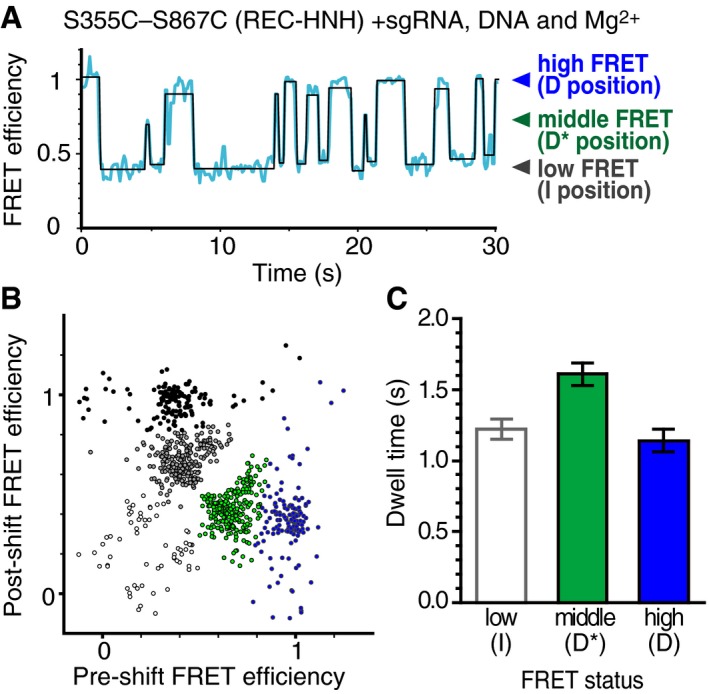
- Representative time trajectory of the FRET efficiency, showing the fluctuation of the HNH domain in the sgRNA/DNA‐bound S355C–S867C complex with Mg2+. The transition points of the FRET efficiency (blue line) were detected using the HMM algorithm (black line).
- The transition density plot of different FRET states of the sgRNA/DNA‐bound S355C–S867C complex with Mg2+. The density map was clustered into five groups (white, gray, black, green, and blue closed circles) based on the k‐means method with k = 5, suggesting that the HNH movement between the D* and D processes (middle and high FRET efficiencies) is rare.
- Bar plot of the dwell times for each transition. The mean dwell times were determined by fitting the dwell time distributions (n = 399, 223, and 136 for low, middle, and high FRET status, respectively) to a single exponential decay function (Appendix Fig S2). Error bars show SEM.
Source data are available online for this figure.
Finally, we investigated the movements of the HNH domain among the three positions. To analyze the relationship between the positions before and after the transitions of the HNH domain in the ternary complex, we measured the FRET time trajectories of sgRNA/DNA‐bound S355C–S867C, using a hidden Markov model‐based algorithm (Fig 5A) and plotted the FRET efficiencies of the pre‐ and post‐HNH transitions (Fig 5B). Together with the transition density plot and Silhouette analysis (Fig EV5), the transitions can be classified into five types: transitions from a low FRET state to another low FRET state (I‐R), between low and middle FRET states in both directions (I‐D*), and between low and high FRET states in both directions (I‐D). To our surprise, transitions between middle and high FRET states were rare (< 2% of all transitions), suggesting that the HNH domain rarely moves between the D* and D positions and therefore needs to adopt the undocked I position before relocating to the D* or D position.
Figure EV5. Silhouette analysis on k‐means clustering of the FRET efficiency shift to determine the number of clusters.
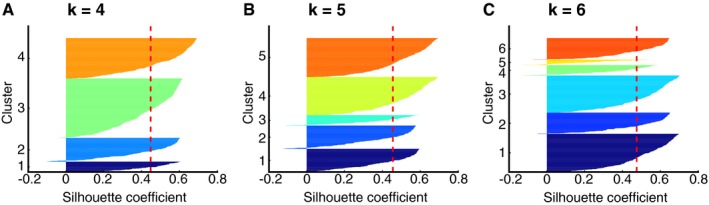
The Silhouette coefficients, which were calculated using the machine learning Python Package Scikit learn, were plotted for each cluster in the cases of k = 4, 5, and 6, respectively (A‐C). The vertical red dashed lines indicate the mean value of the Silhouette coefficients. In the cases of k = 4 (A) and 5 (B), all clusters showed higher Silhouette coefficients than the mean values. This was not true for k = 6, meaning that k = 5 is the most probable number of clusters for the transition density plot shown in Fig 5B.
Among the three positions, the HNH domain in the pre‐cleavage D* position showed the longest dwell time before the transition (Fig 5C and Appendix Fig S2), suggesting the high stability of the HNH domain in the D* position, as compared to those in the other positions. Consistently, the frequency of the I to D* transition (219 times/343 transitions = 64%) was approximately twice as high as that of the I to D transition (124 times/343 transitions = 36%). Thus, the HNH in the D* position should be a thermodynamically stable conformation. However, as mentioned above, the HNH domain in the D position rarely moves to the D* position (Fig 5B). The results suggest that a structural barrier for the HNH transition exists between the D* and D positions, which must be collapsed by the transition to the I position.
Discussion
The purpose of the present study is to investigate whether Cas9 has a flexible structure in solution, as predicted by previous studies (Anders et al, 2014; Jinek et al, 2014; Nishimasu et al, 2014; Jiang et al, 2015, 2016; Sternberg et al, 2015; Singh et al, 2016; Zheng, 2017). Here, using the smFRET technique, we directly observed the dynamic fluctuations of the Cas9 domain. These fluctuations allow Cas9 to adopt different conformations besides those previously reported by structural analyses (Anders et al, 2014; Jinek et al, 2014; Nishimasu et al, 2014; Jiang et al, 2015, 2016). Our detailed analysis highlights the potential roles of the transient conformations regulated by the flexibility in both the DNA cleavage and sgRNA/DNA binding processes.
Here, we summarize the flexibility of the Cas9 domain configuration observed in the present study (Fig 6). Judging from the percentages of the fluctuated molecules (Fig 3D), the REC lobe flexibly moved relative to the NUC lobe in the apo‐Cas9. The binding of the sgRNA stabilizes the fluctuations between the REC and NUC lobes, whereas the subsequent target DNA binding enhances the fluctuations (Fig 3D). Our smFRET data indicated that the HNH domain in the ternary complex fluctuated between the three distinct positions in the presence of Mg2+: the I, D*, and D positions (Fig 5).
Figure 6. Model of Cas9‐mediated DNA cleavage.
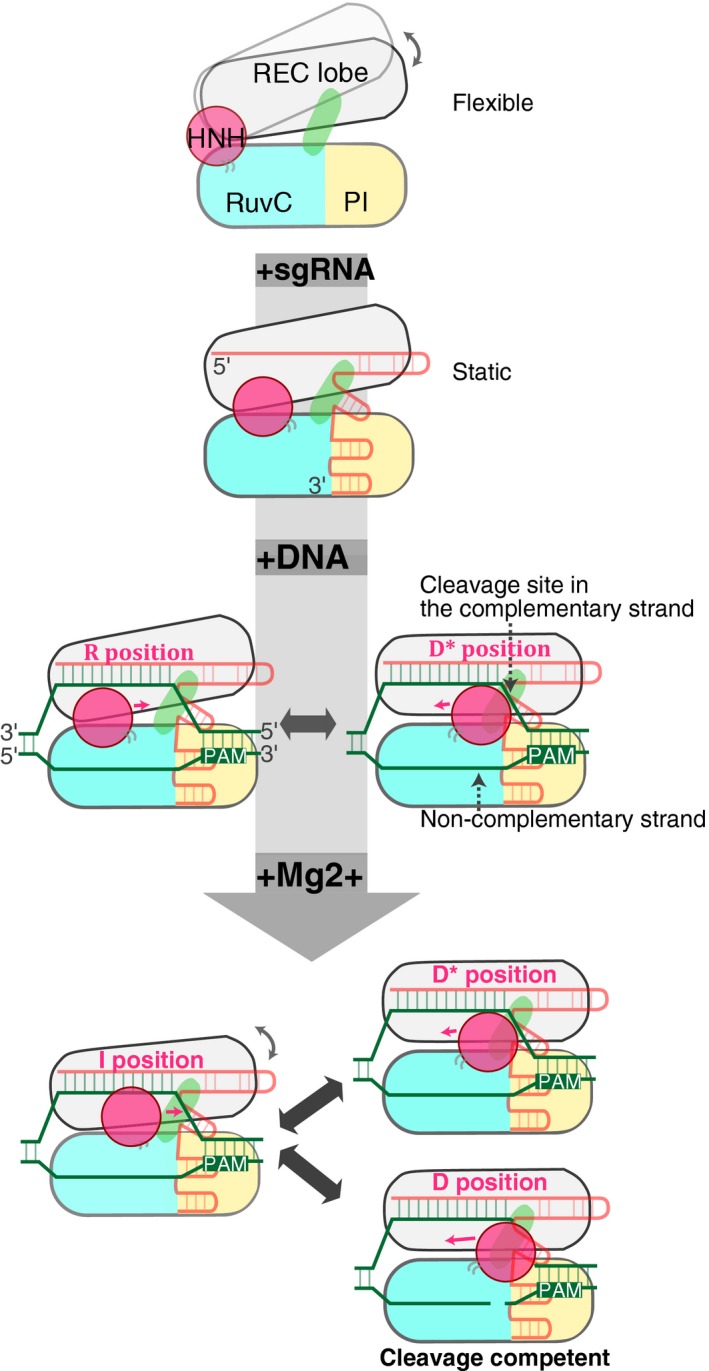
The relative flexible movements of the REC lobe (gray) against the HNH (magenta) and RuvC (blue) domains are represented by the gray arrows. The binding of the sgRNA (orange) stabilizes the Cas9 molecule, whereas the binding of the target DNA (green) and Mg2+ increases the flexibility between the REC and NUC lobes. The HNH positions in the ternary complex are indicated by magenta letters.
Even in the presence of Mg2+, the Cas9 molecules in the static phase did not show the high FRET efficiency corresponding to the HNH domain in the cleavage‐competent D position (Fig 4B). This result indicated that the HNH domain can only access the D position during the fluctuating phase, thus emphasizing the importance of the flexible movement of the HNH domain in the DNA cleavage process. The movement of the HNH domain has been reported to control the nuclease activity of the RuvC domain on the non‐complementary strand, through intramolecular communication between the two domains (Sternberg et al, 2015; Jiang et al, 2016). Thus, besides its direct participation in the cleavage of the complementary strand, the flexibility of the HNH domain may also affect the non‐complementary strand cleavage by the RuvC domain.
In the crystal structure, apo‐Cas9 adopts a closed conformation, in which the active sites in the HNH and RuvC domains are located away from the DNA binding cleft, and the interaction interfaces with the sgRNA are limited (Jinek et al, 2014). Our smFRET data revealed the fluctuations between the REC and NUC lobes in apo‐Cas9 (Fig 3), indicating that, in addition to the static closed conformation, apo‐Cas9 adopts transient conformations. Consistent with this, a single‐molecule study using high‐speed atomic force microscopy (HS‐AFM) visualized highly flexible conformations of apo‐Cas9 (Shibata et al, 2017). The movement of the REC lobe relative to the NUC lobe can provide interaction interfaces for the sgRNA; thus, the flexible movement in apo‐Cas9 may play an important role in the assembly with the sgRNA.
After the submission of our manuscript, three similar smFRET studies have been published (Chen et al, 2017; Dagdas et al, 2017; Yang et al, 2017). Consistent with our data, these studies demonstrated the dynamic translocations of the HNH domain among multiple (R, I, and D) positions, although the fluctuating and static molecules were not distinguished in these studies. Nonetheless, there are several discrepancies among the studies, such as the populations of S355C–S867C molecules showing the high FRET efficiency in the sgRNA/DNA‐bound state. In the studies by Dagdas et al and Chen et al, most of the S355C–S867C molecules exhibited ~1.0 FRET efficiency, suggesting that the HNH domain in almost all of the Cas9 molecules adopts the cleavage‐competent (D) position. In contrast, in the studies by us and Yang et al, the major peak value of the FRET efficiency was ~0.4, suggesting that the HNH domain is predominantly located in the intermediate (I) position, consistent with the recent HS‐AFM observation (Shibata et al, 2017). In addition, the studies by us and Yang et al demonstrated the existence of the pre‐cleavage (D*) HNH position. Yang et al proposed the possibility that heparin, which was included in the buffer used by Dagdas et al and Chen et al, produces these differences, although further analyses will be required to understand the underlying cause of the discrepancy.
Although functional verification of the flexible movements awaits further studies, our results open a new door toward modifying and expanding Cas9‐based tools by modulating the domain flexibility. Since the HNH domain in the D* position must return to the I position before it translocates to the cleavage‐competent D position, mutations that destabilize the HNH domain in the D* and I positions may facilitate the HNH translocation to the D position, enhancing Cas9‐mediated DNA cleavage. Together, the present study provides useful information for future improvements in Cas9‐based tools for genome editing, gene regulation and chromosome visualization.
Materials and Methods
Sample preparation
Since the C80L/C574E mutations in Cas9 do not affect the cleavage activity and improve the solution behavior (Nishimasu et al, 2014), we used the Cas9 C80L/C574E mutant as wild‐type Cas9 in this study. We introduced the mutations into the Cas9 C80L/C574E mutant, to prepare D435C–E945C, S355C–S867C and S867C‐N1054C. The Cas9 proteins were prepared as previously described (Nishimasu et al, 2014), with minor modifications. Briefly, the Cas9 variants were expressed as His6‐GST fusion proteins at 20°C in Escherichia coli Rosetta 2 (DE3) (Novagen) and purified by chromatography on Ni‐NTA Super flow resin (QIAGEN). The His6‐GST tag was removed by TEV protease digestion, and the proteins were further purified by chromatography on Ni‐NTA, HiTrap SP HP (GE Healthcare), and Superdex 200 Increase (GE Healthcare) columns. The purified Cas9 proteins were stored at −80°C until use.
In vitro cleavage assay
In vitro cleavage experiments were performed as previously described (Anders et al, 2014), with minor modifications. A EcoRI‐linearized pUC119 plasmid (100 ng, 5 nM), containing a 20‐nt target sequence followed by the NGG PAM (Appendix Fig S3), was incubated at 37°C for 5 min with the Cas9‐sgRNA complex (25 and 50 nM) in 10 μl of reaction buffer, containing 20 mM HEPES‐NaOH, pH 7.5, 100 mM KCl, 2 mM MgCl2, 1 mM DTT, and 5% glycerol. We confirmed that the plasmid DNA does not contain long off‐target sequences (Appendix Fig S3). The reaction was stopped by the addition of a solution containing EDTA (40 mM final concentration) and Proteinase K (1 mg/ml). Reaction products were resolved on an ethidium bromide‐stained 1% agarose gel and then visualized using an Amersham Imager 600 (GE Healthcare).
For the cleavage assays at various Mg2+ concentrations, an EcoRI‐linearized pUC119 plasmid (3.5 nM) was incubated at 25°C for 30 min with the fluorescent Cas9 (S355C–S867C)–sgRNA complex (50 nM), in 10 μl of reaction buffer containing 20 mM HEPES‐NaOH, pH 7.5, 100 mM KCl, 0.5 mM EDTA, 1 mM DTT, and 5% glycerol, with 0.5, 1, 2, and 5 mM MgCl2. Following electrophoresis on a 1.5% agarose gel, the reaction products were fluorescently stained using Midori Green Advance (Nippon Genetics Co., Ltd.) and then visualized using a Typhoon FLA 9500 imager (GE Healthcare) equipped with a 473‐nm excitation laser and an LPB filter (GE Healthcare).
Preparation of the sgRNA and the target plasmid DNA
The sgRNA was transcribed in vitro with T7 RNA polymerase, using a PCR‐amplified DNA template, and purified by 10% denaturing (7 M urea) PAGE. The target plasmid DNA (Appendix Fig S3) was amplified in the E. coli DH5α strain, grown in LB medium (Nacalai Tesque, Inc., Japan) at 37°C overnight. The plasmid DNA was purified using a Midiprep kit (NIPPON Genetics), according to the manufacturer's method. The concentration of purified plasmid DNA was determined based on the absorption at 260 nm, using a NanoDrop 2000c spectrophotometer (Thermo Fisher). The sgRNA and the plasmid DNA were stored at −80 and −30°C until use, respectively.
Fluorescent labeling of Cas9
Cas9 was fluorescently labeled using Cy3‐ and Cy5‐maleimide (GE Healthcare), according to the general method. Briefly, the buffer for Cas9 was exchanged into the labeling buffer (20 mM HEPES‐KOH, pH 7.0, 100 mM KCl, 2 mM MgCl2, 5% glycerol), using a Micro Bio‐Spin 30 spin gel filtration column (Bio‐Rad). Next, the Cas9 solution was incubated on ice for 30 min, after the addition of TCEP (the final concentration of 0.5 mM). Then, Cy3‐ and Cy5‐maleimide were mixed with the Cas9 solution at a 1:20 molar ratio between the protein and each dye. The maleimide labeling reaction was conducted on ice for 2 h. Excess fluorescent maleimide dye was removed twice, using assay buffer (AB: 20 mM HEPES‐KOH, pH 7.5, 100 mM KCl, 2 mM MgCl2, 5% glycerol, 0.5 mM EDTA, 1 mM DTT) and a Micro Bio‐Spin 30 columns. The fluorescently labeled Cas9 was snap‐frozen in liquid nitrogen and stored at −80°C until use.
FRET measurements for the stoichiometry of sgRNA binding to Cas9
All fluorescence measurements used a reaction mixture of 20 nM fluorescent Cas9 (D435C–E945C) with or without the sgRNA (10, 20, 50, 100, or 200 nM) in AB with 0.1 U/μl RNasin Plus (Promega), and a commercial oxygen scavenger system (Pacific Bioscience) containing 2.5 mM TSY (Pacific Bioscience), 2.5 mM protocatechuic acid (PCA), and 50‐fold diluted protocatechuic acid dehydrogenase (PCD) solution. Measurements were performed using a RE‐6000 fluorescence spectrometer (Shimadzu) and a T‐703M‐ES‐10.50B quartz cuvette with a 50 μl volume (TOSOH), with 532‐nm excitation and a scanning speed of 60 nm/min in the wavelength range of 550–750 nm in 1‐nm increments, at room temperature.
Perrin plot to determine the orientation factors
All fluorescence measurements using the reaction mixture of 100 nM fluorescent Cas9 (D435C–E945C, S355C–S867C, and S867C‐N1054C with no nucleic acid) in buffer (20 mM HEPES‐KOH, pH 7.5, 100 mM KCl, 2 mM MgCl2, 0.5 mM EDTA, 1 mM DTT, 2.5 mM TSY, 2.5 mM PCA, and 2% PCD) with or without methyl cellulose (0, 0.001, 0.01, or 0.1%) were performed at room temperature, using the same fluorescence spectrometer and cuvette described in the previous section. The orientation factor κ 2 was determined as described below, according to the previous method (Dale et al, 1979). Briefly, the fluorescence anisotropy measurement was performed by manually placing the polarization filters in front of the exciter and detector in the fluorescence spectrometer. For Cy3, the fluorescence intensity was measured at a wavelength of 566‐nm by 554‐nm excitation, while that of Cy5 was measured at a wavelength of 668‐nm by 650‐nm excitation. The slit width for emission and excitation was 5 nm, and the integration time was 1 s. Each measurement was repeated three times. Using these fluorescence intensities, the fluorescence anisotropy r was calculated as described below.
Ivh indicates the fluorescence intensity of the horizontal polarization excited by the vertical polarized light. Ivv, Ihv, and Ihh are defined similarly. Following the plotting of 1/r against T/η, the y‐intercept was calculated by fitting the plot to the linear function for each fluorescent Cas9, to estimate the γ values.
Fluorescence lifetime measurements
The fluorescence lifetime of Cy3 was measured using a TCSPC system (PicoQuant) with a TCS SP8 confocal laser‐scanning microscope (Leica Microsystems) at room temperature. The fluorescently labeled Cas9 constructs (1 μM) were loaded in a glass chamber prepared by the same procedure for smFRET measurements and absorbed onto the glass surface via Neutravidin. The buffer condition was same as that of smFRET measurement: 20 mM HEPES‐KOH, pH 7.5, 100 mM KCl, 2 mM MgCl2, 0.5 mM EGTA, 1 mM DTT, 2.5 mM TSY, 2.5 mM PCA, and 2% PCD. The Cas9 constructs on the glass surface were illuminated with a pulsed diode laser (PDL 800‐B, PicoQuant, 470 nm) through a confocal pinhole (hole size: 1 Airy unit = 0.896 μm) at a repetition rate of 20 MHz. The emission light in a range of 540–660 nm was collected through an HCX PL APO Ibd.BL 63× 1.4 NA oil objective (Leica Microsystems) in a 128 × 128 pixel format. The fluorescence lifetime data were collected on a time scale of 50 ns, resolved into 3,200 channels (i.e., 15.6 ps for each channel), and accumulated for 30 s. The data of each pixel were averaged within the whole image and then fitted with double exponential decay curves using the OriginPro 8.0J software (OriginLab). Mean lifetime (τ mean) was calculated as
where τ and A were lifetime and amplitude, respectively.
Single‐molecule FRET measurement of fluorescent Cas9
The cover slips (No. 1S, 22 × 22 mm, Matsunami) were cleaned for 15 min, using 1 N KOH and an ultrasonic washing machine (BRANSONIC). All subsequent preparation procedures were performed on a clean bench (Matsusada Precision). After 20 rinses using Milli‐Q water and drying in a dryer, the cover slips were cleaned using a plasma cleaner (YHS‐R, SAKIGAKE‐Semiconductor Co., Ltd. or PR300, Yamato Scientific Co., Ltd.). Next, the cover slips were completely dried in a dryer. Following the cleaning of cover slips as described above, one side of the cover slips was silanized by sandwiching 10 μl of N‐2 (aminoethyl)‐3‐aminopropyl‐triethoxysilane (KBE‐603, Sin‐Etsu Silicones). After an incubation at room temperature for 20 min, the cover slips were rinsed 20 times and dried. The silanized side of the cover slips was PEGylated by sandwiching 10 μl of 200 mg/ml NHS‐PEG and 1 mg/ml NHS‐PEG‐biotin (BI‐050TS, NOF) in 50 mM MOPS (pH 7.5) for the observed surface of a flow chamber, and 200 mg/ml NHS‐PEG (ME‐050‐TS, NOF) in 50 mM MOPS (pH 7.5) was used for the non‐observed surface (Yokota et al, 2009). Following an incubation at room temperature for 2 h under moist conditions, the cover slips were rinsed 20 times with Milli‐Q water and completely dried. A 0.5 μl volume micro‐chamber was made by placing a PEG‐coated small coverslip of 11 × 11 mm, which was cut from a commercial coverslip, over a PEG‐biotin‐coated 22 × 22 mm glass coverslip using double‐sided adhesive tape (30 μm thickness, Nitto Denko) in a clean hood (Matsusada Precision Inc.). First, 1 mg/ml neutralized avidin (Wako) in AB was adsorbed onto the glass surface. After a 2‐min incubation, the excess neutralized avidin was removed by three washes with 2 μl AB. Next, the glass surface in the micro‐chamber was illuminated by a 532‐nm laser for 40 s per one field using fluorescence microscopy, to photobleach any residual fluorescent particles on the glass surface. After three washes with 2 μl AB, 0.3–1 nM fluorescent Cas9 was adsorbed onto the glass surface, using the avidin–biotin interaction. Here, for the sgRNA‐bound fluorescent Cas9 imaging, fluorescent Cas9 was incubated with a final concentration of 200 nM sgRNA for 2 min at room temperature in a 0.6‐ml tube before the Cas9 absorption, while the fluorescent Cas9 was successively incubated with 200 nM sgRNA and 200 nM plasmid DNA for 2 min, for the sgRNA‐ and DNA‐bound fluorescent Cas9 imaging. After a 2‐min incubation and three washes with 2 μl AB, AB with a commercial oxygen scavenger system (Pacific Bioscience) containing 2.5 mM TSY, 2.5 mM PCA, and 50‐fold diluted PCD solution was placed in the micro‐chamber for all samples, and then, 200 nM sgRNA was added for the sgRNA‐bound fluorescent Cas9 imaging and 200 nM sgRNA and 200 nM plasmid DNA were added for the sgRNA‐ and DNA‐bound Cas9 imaging. Finally, the micro‐chamber was subjected to total internal reflection fluorescence microscopy for the smFRET measurements.
The smFRET measurements of fluorescent Cas9 were performed using a Nikon Ti‐E based TIRFM, equipped with a multi‐band filter set for fluorescence microscopy (LF405/488/532/635‐A, Semrock), a dual‐view apparatus (Optical Insights) containing dichroic (630, Optical Insights) and emission filters (FF01‐593/40‐25 for Cy3 imaging and FF01‐692/40‐25 for Cy5 imaging, Semrock), and a back‐illuminated EMCCD camera (Andor, iXon+). Illumination was provided by a 532‐nm laser (Coherent, Sapphire) and a 642‐nm laser (Coherent, Cube). Image acquisition for the smFRET measurements was performed with an acquisition rate of 10 frames per second, using 532‐nm illumination and open source microscopy software (Micro‐Manager, Open Imaging) (Edelstein et al, 2014). The FRET efficiency distributions were calculated over the duration of the photobleaching of the fluorescent dye (donor or acceptor) or the entire observation time (120 s for D435C–E945C and S355C–S867C; 40 s for S867C‐N1054C), in cases where no photobleaching was observed. Data were typically collected from 12 observation fields of at least three different chambers for each condition. Following the smFRET measurements, the same field was illuminated using a 642‐nm laser to directly excite the Cy5 fluorescence, for counting the Cy3 and Cy5 double‐labeled Cas9. This procedure allowed us to exclude the data from the molecules labeled with only the donor dye. From the Cy5 intensity before and after the photobleaching process, we judged whether the decreases in the Cy5 fluorescence intensity during the smFRET observation reflected the Cas9 conformational changes or were caused by fluorescence photobleaching. We confirmed that the levels of donor leakage in the acceptor detection channel and fluorescent photoblinking were negligible in our assay conditions.
For the smFRET analysis, the exported image data were imported into a home‐built program written in Python and converted into fluorescence intensity, based on the fluorescent spots of both Cy3‐ and Cy5‐labeled Cas9. The FRET efficiency of a single molecule was calculated as I A/(I A+γI D) (Roy et al, 2008). Here, I A and I D are the fluorescence intensities of the acceptor and donor, respectively. γ is equivalent to ∣ΔI A/ΔI D∣, where ΔI A and ΔI D are the fluorescence intensity changes of the acceptor and donor upon FRET efficiency fluctuation or photobleaching, respectively. The fluctuating molecules were initially sorted with standard deviation values of 0.4‐Hz low‐pass filtered time traces. After the initial sort, traces with multiple FRET transitions within 2.5 s were re‐categorized as the fluctuating state. The traces exhibiting both fluctuating and static states were categorized as the fluctuating molecule. The differences in the FRET histograms were statistically tested using the Mann–Whitney U‐test (threshold: P = 0.05). To evaluate biases in the samples used to make the histograms, we randomly resampled (n‐2) traces and compared 1,000 of the resampled data sets. The Kolmogorov–Smirnov test showed no significant difference in the data sets (threshold: P = 0.05), ensuring robustness of our data. The transition points in the fluctuating traces of the sgRNA/DNA‐bound fluorescently labeled Cas9 (S355C–S867C) were detected based on the hidden Markov Model (HMM) with the Baum–Welch forward–backward algorithm and the Viterbi algorithm (McKinney et al, 2006), using the hmmlearn library for Python (https://github.com/hmmlearn/hmmlearn). Here, we assumed that HMM has three states, according to the FRET efficiency distribution (the bottom histogram in Fig 4A). The transition density plot was visualized using a Python plotting library (Matplotlib; http://matplotlib.org), while the plotted density was clustered into five groups based on the k‐means method with k = 5, using the machine learning package for Python (Scikit‐learn; http://scikit-learn.org/).
Data availability
The smFRET data were uploaded with the manuscript.
Author contributions
TK, HN, TS, ON, and SU designed the study. SO and TK collected and analyzed smFRET data; TK and TS collected and analyzed bulk fluorescent data; KI and SK prepared the fluorescently labeled protein; SK and TK performed functional analyses; and SK, TK, HN, TS, ON, and SU wrote the paper. All authors discussed the results and commented on the manuscript.
Conflict of interest
The authors declare that they have no conflict of interest.
Supporting information
Appendix
Expanded View Figures PDF
Table EV1
Review Process File
Source Data for Figure 2
Source Data for Figure 3
Source Data for Figure 4
Source Data for Figure 5
Acknowledgements
This study is supported by JST, CREST (to S.U), and MEXT, Grants‐in‐Aid for Young Scientists (B), 15K18514 (to T.S.) and 17K15100 (to T.K.). We thank the members of the Uemura and Nureki laboratories for valuable discussions. We also thank K. Okabe and T. Funatsu (University of Tokyo) for their assistance for the fluorescent lifetime measurements, M. Sugawa (University of Tokyo) for technical assistance, and P. Karagiannis (Kyoto University) for helpful discussions and comments on the manuscript.
The EMBO Journal (2018) 37: e96941 29650679
Contributor Information
Tomohiro Shima, Email: tomohiro.shima@bs.s.u-tokyo.ac.jp.
Osamu Nureki, Email: nureki@bs.s.u-tokyo.ac.jp.
References
- Anders C, Niewoehner O, Duerst A, Jinek M (2014) Structural basis of PAM‐dependent target DNA recognition by the Cas9 endonuclease. Nature 513: 569–573 [DOI] [PMC free article] [PubMed] [Google Scholar]
- Barrangou R, Fremaux C, Deveau H, Richards M, Boyaval P, Moineau S, Romero DA, Horvath P (2007) CRISPR provides acquired resistance against viruses in prokaryotes. Science 315: 1709–1712 [DOI] [PubMed] [Google Scholar]
- Bolotin A, Quinquis B, Sorokin A, Ehrlich SD (2005) Clustered regularly interspaced short palindrome repeats (CRISPRs) have spacers of extrachromosomal origin. Microbiology 151: 2551–2561 [DOI] [PubMed] [Google Scholar]
- Chen JS, Dagdas YS, Kleinstiver BP, Welch MM, Sousa AA, Harrington LB, Sternberg SH, Joung K, Yildiz A, Doudna JA (2017) Enhanced proofreading governs CRISPR–Cas9 targeting accuracy. Nature 550: 407–410 [DOI] [PMC free article] [PubMed] [Google Scholar]
- Cong L, Ran FA, Cox D, Lin S, Barretto R, Habib N, Hsu PD, Wu X, Jiang W, Marraffini LA, Zhang F (2013) Multiplex genome engineering using CRISPR/Cas systems. Science 819: 819–823 [DOI] [PMC free article] [PubMed] [Google Scholar]
- Dagdas YS, Chen JS, Sternberg SH, Doudna JA, Yildiz A (2017) A conformational checkpoint between DNA binding and cleavage by CRISPR–Cas9. Sci Adv 3: eaao0027 [DOI] [PMC free article] [PubMed] [Google Scholar]
- Dale RE, Eisinger J, Blumberg WE (1979) The orientational freedom of molecular probes. The orientation factor in intramolecular energy transfer. Biophys J 26: 161–193 [DOI] [PMC free article] [PubMed] [Google Scholar]
- Edelstein AD, Tsuchida MA, Amodaj N, Pinkard H, Vale RD, Stuuman N (2014) Advanced methods of microscope control using μManager software. J Bio Methods 1: e11 [DOI] [PMC free article] [PubMed] [Google Scholar]
- Hsu PD, Lander ES, Zhang F (2014) Development and applications of CRISPR–Cas9 for genome engineering. Cell 157: 1262–1278 [DOI] [PMC free article] [PubMed] [Google Scholar]
- Jansen R, van Embden JDA, Gaastra W, Schouls LM (2002) Identification of genes that are associated with DNA repeats in prokaryotes. Mol Microbiol 43: 1565–1575 [DOI] [PubMed] [Google Scholar]
- Jiang F, Zhou K, Ma L, Gressel S, Doudna JA (2015) A Cas9‐guide RNA complex preorganized for target DNA recognition. Science 348: 1477–1481 [DOI] [PubMed] [Google Scholar]
- Jiang F, Taylor DW, Chen JS, Kornfeld JE, Zhou K, Thompson AJ, Nogales E, Doudna JA (2016) Structures of a CRISPR–Cas9 R‐loop complex primed for DNA cleavage. Science 351: 867–871 [DOI] [PMC free article] [PubMed] [Google Scholar]
- Jinek M, Chylinski K, Fonfara I, Hauer M, Doudna JA, Charpentier E (2012) A programmable dual‐RNA‐guided DNA endonuclease in adaptive bacterial immunity. Science 337: 816–821 [DOI] [PMC free article] [PubMed] [Google Scholar]
- Jinek M, Jiang F, Taylor DW, Sternberg SH, Kaya E, Ma E, Anders C, Hauer M, Zhou K, Lin S, Kaplan M, Iavarone AT, Charpentier E, Nogales E, Doudna JA (2014) Structures of Cas9 endonucleases reveal RNA‐mediated conformational activation. Science 343: 1247997 [DOI] [PMC free article] [PubMed] [Google Scholar]
- Konermann S, Brigham MD, Trevino AE, Joung J, Abudayyeh OO, Barcena C, Hsu PD, Habib N, Gootenberg JS, Nishimasu H, Nureki O, Zhang F (2014) Genome‐scale transcriptional activation by an engineered CRISPR–Cas9 complex. Nature 517: 583–588 [DOI] [PMC free article] [PubMed] [Google Scholar]
- Mali P, Yang L, Esvelt KM, Aach J, Guell M, DiCarlo JE, Norville JE, Church GM (2013) RNA‐guided human genome engineering via Cas9. Science 339: 823–826 [DOI] [PMC free article] [PubMed] [Google Scholar]
- McKinney SA, Joo C, Ha T (2006) Analysis of single‐molecule FRET trajectories using hidden Markov modeling. Biophys J 91: 1941–1951 [DOI] [PMC free article] [PubMed] [Google Scholar]
- Nishimasu H, Ran FA, Hsu PD, Konermann S, Shehata SI, Dohmae N, Ishitani R, Zhang F, Nureki O (2014) Crystal structure of Cas9 in complex with guide RNA and target DNA. Cell 156: 935–949 [DOI] [PMC free article] [PubMed] [Google Scholar]
- Palermo G, Miao Y, Walker RC, Jinek M, McCammon A (2016) Striking placticity of CRISPR–Cas9 and key role of non‐target DNA, as revealed by molecular simulations. ACS Cent Sci 2: 756–763 [DOI] [PMC free article] [PubMed] [Google Scholar]
- Pourcel C, Salvignol G, Vergnaud G (2005) CRISPR elements in Yersinia pestis acquire new repeats by preferential uptake of bacteriophage DNA, and provide additional tools for evolutionary studies. Microbiology 151: 653–663 [DOI] [PubMed] [Google Scholar]
- Roy R, Hohng S, Ha T (2008) A practical guide to single‐molecule FRET. Nat Methods 5: 507–516 [DOI] [PMC free article] [PubMed] [Google Scholar]
- Shibata M, Nishimasu H, Kodera N, Hirano S, Ando T, Uchihashi T, Nureki O (2017) Real‐space and real‐time dynamics of CRISPR–Cas9 visualized by high‐speed atomic force microscopy. Nat Commun 8: 1430 [DOI] [PMC free article] [PubMed] [Google Scholar]
- Shmakov S, Smargon A, Scott D, Cox D, Pyzocha N, Yan W, Abudayyeh OO, Gootenberg JS, Makarova KS, Wolf YI, Severinov K, Zhang F, Koonin EV (2017) Diversity and evolution of class 2 CRISPR–Cas systems. Nat Rev Microbiol 15: 169–182 [DOI] [PMC free article] [PubMed] [Google Scholar]
- Singh D, Sternberg SH, Fei J, Ha T, Doudna JA (2016) Real‐time observation of DNA recognition and rejection by the RNA‐guided endonuclease Cas9. Nat Commun 7: 12778: 1–8 [DOI] [PMC free article] [PubMed] [Google Scholar]
- Soria E, Mojica FJM, Díez‐Villaseñor C, García‐Martínez J, Soria E (2005) Intervening sequences of regularly spaced prokaryotic repeats derive from foreign genetic elements. J Mol Evol 60: 174–182 [DOI] [PubMed] [Google Scholar]
- Sternberg SH, Redding S, Jinek M, Greene EC, Doudna JA (2014) DNA interrogation by the CRISPR RNA‐guided endonuclease Cas9. Nature 507: 62–67 [DOI] [PMC free article] [PubMed] [Google Scholar]
- Sternberg SH, Doudna JA (2015) Expanding the biologist's toolkit with CRISPR–Cas9. Mol Cell 58: 568–574 [DOI] [PubMed] [Google Scholar]
- Sternberg SH, LaFrance B, Kaplan M, Doudna JA (2015) Conformational control of DNA target cleavage by CRISPR–Cas9. Nature 527: 1–14 [DOI] [PMC free article] [PubMed] [Google Scholar]
- Terns RM, Terns MP (2014) CRISPR‐based technologies: prokaryotic defense weapons repurposed. Trends Genet 30: 111–118 [DOI] [PMC free article] [PubMed] [Google Scholar]
- Yang M, Peng S, Sun R, Lin J, Wang N, Chen C (2017) Conformational dynamics of Cas9 governing DNA cleavage revealed by single molecule FRET. Cell Rep 22: 372–382 [DOI] [PubMed] [Google Scholar]
- Yokota H, Han Y‐W, Allemand JF, Xi XG, Bensimon D, Croquette V, Ito Y, Harada Y (2009) Single‐molecule visualization of binding modes of helicase to DNA on PEGylated surfaces. Chem Lett 38: 308–309 [Google Scholar]
- Zheng W (2017) Probing the structural dynamics of the CRISPR–Cas9 RNA‐guided DNA‐cleavage system by coarse‐grained modeling. Proteins 85: 342–353 [DOI] [PubMed] [Google Scholar]
- Zuo Z, Liu J (2016) Cas9‐catalyzed DNA cleavage generates staggered ends: evidence from molecular dynamics simulations. Sci Rep 6: 37584 [DOI] [PMC free article] [PubMed] [Google Scholar]
Associated Data
This section collects any data citations, data availability statements, or supplementary materials included in this article.
Supplementary Materials
Appendix
Expanded View Figures PDF
Table EV1
Review Process File
Source Data for Figure 2
Source Data for Figure 3
Source Data for Figure 4
Source Data for Figure 5
Data Availability Statement
The smFRET data were uploaded with the manuscript.