Abstract
Purpose
To determine if magnetic resonance (MR) imaging metrics can estimate primary motor cortex (PMC) motor neuron (MN) density in patients with amyotrophic lateral sclerosis (ALS).
Materials and Methods
Between 2012 and 2014, in situ brain MR imaging was performed in 11 patients with ALS (age range, 35–81 years; seven women and four men) soon after death (mean, 5.5 hours after death; range, 3.2–9.6 hours). The brain was removed, right PMC (RPMC) was excised, and MN density was quantified. RPMC metrics (thickness, volume, and magnetization transfer ratio) were calculated from MR images. Regression modeling was used to estimate MN density by using RPMC and global MR imaging metrics (brain and tissue volumes); clinical variables were subsequently evaluated as additional estimators. Models were tested at in vivo MR imaging by using the same imaging protocol (six patients with ALS; age range, 54–66 years; three women and three men).
Results
RPMC mean MN density varied over a greater than threefold range across patients and was estimated by a linear function of normalized gray matter volume (adjusted R2 = 0.51; P = .008; <10% error in most patients). When considering only sporadic ALS, a linear function of normalized RPMC and white matter volumes estimated MN density (adjusted R2 = 0.98; P = .01; <10% error in all patients). In vivo data analyses detected decreases in MN density over time.
Conclusion
PMC mean MN density varies widely in end-stage ALS possibly because of disease heterogeneity. MN density can potentially be estimated by MR imaging metrics.
© RSNA, 2018
Introduction
Amyotrophic lateral sclerosis (ALS) is a progressive motor neuron (MN) disease occurring mostly sporadically, with approximately 10% of cases classified as familial (1). Upper and lower MN loss are hallmarks of the pathologic structural changes in ALS. Whereas neurologic examination can reveal upper MN deficits, classic upper MN signs can be difficult to detect (2) and there is a recognized need for better methods to demonstrate upper MN degeneration (3). Current and recently developed upper MN assessment techniques have been reviewed by Huynh et al (3). Because upper MN loss can only be measured after death, the correlation between clinical upper MN assessment and upper MN loss, to our knowledge, is not known. Primary motor cortex (PMC) layer-5 pyramidal neuron density is reduced in patients with ALS compared with control participants (4). On the basis of the heterogeneous disease course, it is likely that MN loss varies significantly between patients.
Previous work demonstrated magnetic resonance (MR) imaging abnormalities in ALS patients (on T2-weighted, fluid attenuated inversion recovery, and T2*- and susceptibility-weighted MR images [5–8]), but the corresponding underlying pathologic structure is not well characterized. T1 rate ratios between gray matter and subcortical white matter were found to be lower in PMC compared with other cortical regions in brains with ALS (9). The corresponding pathologic findings featured relatively high astrocyte density in PMC with relatively low astrocyte density in the adjacent subcortical white matter compared with primary visual cortex (9). Regional PMC atrophy quantified on MR images is associated with symptom onset location (10,11) and is more widespread in patients with ALS who have cognitive impairment (12), including those with frontotemporal dementia (12,13). Atrophy is more pronounced in patients with faster disease progression (14) and becomes more widespread with time (15). Magnetization transfer ratio is decreased in the PMC of patients with ALS compared with control participants (16). Combined analysis of magnetization transfer ratio and voxel-based morphometry revealed clusters of combined atrophy and magnetization transfer ratio reduction in motor-related cortical areas (17). Despite the sparse knowledge of the ALS pathologic structure underlying these MR imaging abnormalities, the relationships between MR imaging metrics and disability support the use of MR imaging to help monitor disease progression.
Although MR imaging predictors of disease progression have been proposed (18,19), understanding how MR imaging changes reflect upper MN density would potentially allow for specific evaluation of this hallmark feature of ALS. We hypothesized that a linear function of MR imaging metrics (ie, cortical thickness, tissue volumes, and magnetization transfer ratio that may reflect microstructural abnormalities [16]) calculated from postmortem brains with ALS could estimate the MN density quantified from immunohistochemical staining for neurons in the PMC of the same brains. The purpose of this feasibility study is to determine if MR imaging metrics can estimate PMC MN density in patients with ALS.
Materials and Methods
Participants
This Health Insurance Portability and Accountability Act–compliant prospective study was approved by the institutional review board and written informed consent was obtained from all participants. Eligibility required a diagnosis of ALS according to the revised El Escorial criteria (20) by the neurologist (E.P.P., with 26 years of experience in clinical neurology). Between August 2012 and September 2014, in situ brain MR imaging and rapid autopsy of the brain and spinal cord were performed consecutively in 12 patients with ALS in the hospital setting of our institution. One patient was omitted from this study to spare the tissue for future analyses of their rare mutation. The 11 remaining patients (mean age, 60 years; age range, 35–81 years), with average death-to-MR imaging interval of 5.5 hours (range, 3.2–9.6 hours) and average MR imaging-to-tissue-fixation interval of 2.3 hours (range, 1.7–2.9 hours), were included in the study (Table 1). An in vivo cohort of six patients with ALS, all of whom were different patients from the postmortem cohort (mean age at baseline, 60 years; age range, 54–66 years; Table 2), who had undergone at least two MR examinations on the same MR system with the same acquisition as the postmortem MR examination was used to test the PMC MN density models.
Table 1.
Demographic and Clinical Features of Postmortem Patients with ALS
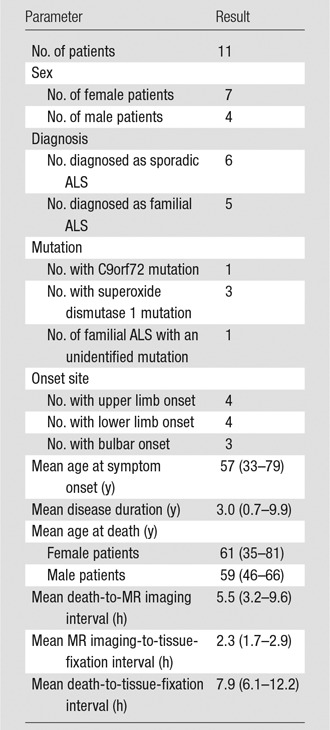
Note.—Data in parentheses are range.
Table 2.
Demographic and Clinical Features of In Vivo Patients with ALS
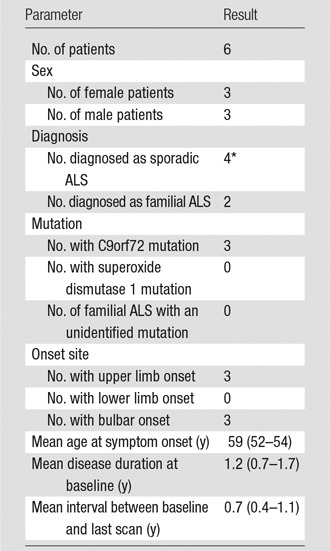
Note.—Data in parentheses are range.
*One case of sporadic ALS had the C9orf72 mutation.
MR Imaging and Analysis
MR images of the brain were acquired on a 3-T imager (Magnetom Trio; Siemens Healthineers, Erlangen, Germany). Table E1 (online) specifies sequence parameters. Automatic cortical reconstruction and volumetric segmentation were performed on T1-weighted magnetization-prepared rapid acquisition gradient-echo MR images with 0.94-mm isotropic voxel size by using software (Freesurfer; http://surfer.nmr.mgh.harvard.edu/) (21–27). All volumes were normalized to total intracranial volume. Right PMC (RPMC) was automatically segmented separately from the left by Freesurfer. Additionally, normalized brain and tissue volumes were automatically calculated by using SIENAX (part of FSL software; FMRIB Software Library, http://fsl.fmrib.ox.ac.uk/fsl/fslwiki/SIENA/) (28,29). RPMC average magnetization transfer ratio was calculated by using the MINC Tool Kit (https://www.mcgill.ca/bic/software/minc/minctoolkit [30]; Appendix E1 [online]).
Tissue Collection, Immunohistochemistry, and Analysis
Immediately after postmortem MR imaging, the brain was removed. RPMC was excised and cut into five or six (depending on PMC length) approximately 2-cm-thick slices, and the superior aspect was inked. Slices 1 (superior PMC subregion), 3 (middle PMC subregion), and 5 (inferior PMC subregion) were fixed in 4% paraformaldehyde for 2.5 days. Slices 2, 4, and 6 were snap-frozen and not analyzed in our study.
Histopathologic quantification was performed by using a stereologic-based approach. RPMC was sampled at approximately 4-cm intervals along the superior-inferior axis, slices were cut 30-μm thick and immunostained with HuR mouse monoclonal antibody (1:1000 ratio; Santa Cruz Biotechnology, Dallas, Tex) (31). Details are provided in Appendix E1 (online).
Immunostained slides were deidentified and digitized. Regions of interest within layer-5 RPMC were selected for neuron density quantification. An average of eight regions of interest were selected per each PMC subregion (ie, superior, middle, inferior) per patient. Layer-5 RPMC neuronal density was quantified for each region of interest with automated and validated in-house software (ImageJ version 1.47 from Java 1.6.0_24, 64-bit version; National Institutes of Health, Bethesda, Md) algorithm that uses the Particle Analysis tool in Fiji (32) and identifies neurons on the basis of size and shape criteria. Details are described in Appendix E1 (online). For each patient, mean MN density was calculated for each RPMC subregion by averaging the layer-5 neuronal density calculated for each relevant region of interest. Overall RPMC mean MN density was calculated by averaging over the subregions (ie, MNDRPMC = [MNDRPMCi + MNDRPMCm + MNDRPMCs MNDRPMCs]/3, where MNDRPMCi is MN density of the inferior RPMC, MNDRPMCm is MN density of the middle RPMC, and MNDRPMCs is MN density of the superior RPMC).
Analysis of the in Vivo Cohort
To demonstrate how MR imaging estimation of PMC MN density could monitor disease, we analyzed the in vivo cohort. In addition to quantifying change in PMC MN density, we also estimated neuronal loss, which can occur because of loss of MN density and/or atrophy. Percentage neuronal loss was estimated as 100 · ({[1 + (%∆MNdensity/100)] · [1 + (%∆PMCthickness/100)]} − 1), where %∆MNdensity is the percentage change in estimated PMC MN density and %∆PMCthickness is the percentage change in average PMC thickness. Change in PMC MN density and percentage neuronal loss were calculated and expressed relative to the time interval between MR imaging sessions. All patients underwent two MR examinations except for one patient who underwent three examinations. For this patient, we calculated over the first and last examinations. Tissue was available, 0.6 years after the last in vivo MR imaging, from one patient in the in vivo cohort, which was immunostained and quantified similarly to the postmortem cohort. For this patient, postmortem MR imaging was performed by using a different imaging system and was not included in this study.
Statistical Analysis
Statistical analyses were performed by using statistical software (R version 3.2.1, R Foundation for Statistical Computing, Vienna, Austria; and RStudio version 0.99.467, RStudio, Boston, Mass).
Initial analyses tested for significant differences (P < .05) between RPMC subregions in mean MN density, associations between RPMC mean MN density and clinical variables, and correlation between RPMC mean MN density and MR imaging metrics for familial and sporadic ALS (Appendix E1 [online]).
To determine whether RPMC MR imaging metrics could estimate RPMC mean MN density, an iterative unbiased procedure to find the best linear model considered the following three RPMC metrics, chosen because they were RPMC-specific MR imaging metrics that quantified aspects of tissue structure, which we hypothesized to be related to MN density: normalized volume of RPMC, average thickness of RPMC, and average magnetization transfer ratio (Appendix E1 [online]). A maximum of two RPMC MR imaging metrics were included in the model. An iterative procedure tested all possible linear models, and the best model featured the lowest error, quantified by the following: the mean absolute percentage error, in which percentage error was defined as the percentage difference between the MR imaging–based estimate of RPMC mean MN density and the measurement from quantification of immunostaining; and the percentage of patients with less than 10% absolute percentage error.
To determine if global MR imaging metrics or RPMC MR imaging metrics or including clinical variables improves estimation of MN density, we performed a similar iterative approach (Appendix E1 [online]). Models included a maximum of two estimators, each chosen from global MR imaging metrics (nine were considered because they quantified aspects of tissue structure of the entire brain, all gray matter, all white matter, all cerebral neocortex, or all PMC), RPMC MR imaging metrics, or clinical variables (nine were considered because they consisted of a small basis set of clinical information: sex, familial ALS or sporadic ALS, onset site, age at symptom onset, disease duration, and presence or absence of superoxide dismutase 1 mutation or C9orf72 mutation or either).
Results
PMC Mean MN Density Measured from Immunostaining
A repeated measures analysis of variance revealed that RPMC mean MN density did not significantly differ between the PMC subregions, and therefore all subsequent analyses were performed by using overall RPMC mean MN density. RPMC mean MN density varied across patients, spanning a more than threefold range (mean, 174 neurons per square millimeter ± 60 [standard deviation]; range, 66–255 neurons per square millimeter; Fig 1a). RPMC mean MN density was not found to be significantly different when comparing men versus women, familial ALS versus sporadic ALS, or bulbar versus limb onset (upper-limb onset was not significantly different from lower-limb onset). RPMC mean MN density was significantly higher (P = .003) in the patients with either C9orf72 or superoxide dismutase 1 mutation (mean, 226 neurons per square millimeter) compared with the group of patients with neither of these mutations (mean, 145 neurons per square millimeter) (Fig 1b). Age at onset, age at death, or disease duration did not show significant linear correlation with RPMC mean MN density. To confirm that postmortem delay did not affect our results, we calculated the linear correlation between the death-to-fixation interval and RPMC mean MN density and it was not significant.
Figure 1a:
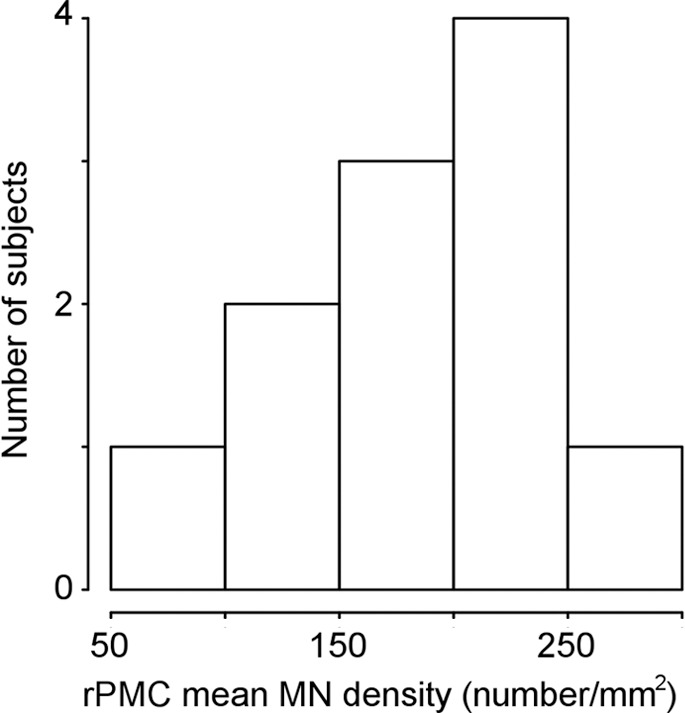
Primary motor cortex (PMC) mean motor neuron (MN ) density measured by using immunostaining. (a) Histogram of right PMC (RPMC) mean MN density in all postmortem patients with amyotrophic lateral sclerosis (ALS) quantified from immunostaining. (b) RPMC mean MN density is significantly lower in sporadic ALS compared with ALS with the superoxide dismutase 1 or C9orf72 mutations.
Figure 1b:
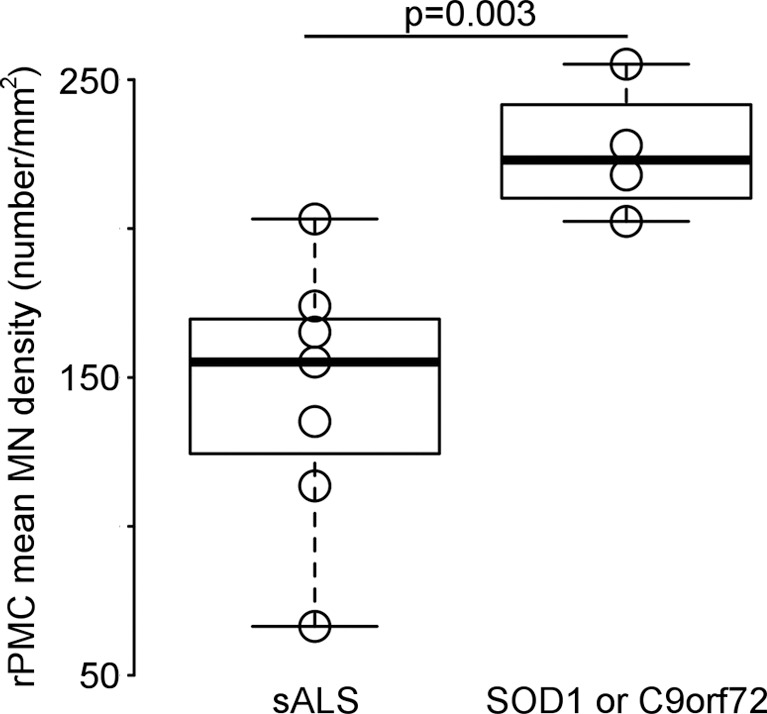
Primary motor cortex (PMC) mean motor neuron (MN ) density measured by using immunostaining. (a) Histogram of right PMC (RPMC) mean MN density in all postmortem patients with amyotrophic lateral sclerosis (ALS) quantified from immunostaining. (b) RPMC mean MN density is significantly lower in sporadic ALS compared with ALS with the superoxide dismutase 1 or C9orf72 mutations.
Estimating RPMC Mean MN Density in All Patients
Figure 2 shows examples of layer-5 RPMC regions of interest from immunostained tissues in the different PMC subregions of a patient with low RPMC mean MN density and one with high RPMC mean MN density (Fig 2a). RPMC MN density can be estimated by using a linear function of normalized volume of RPMC (adjusted R2 = 0.31; P = .04; mean absolute percentage error, 24%). The use of a global MR imaging metric improved estimation, and RPMC MN density was best estimated by MR imaging with a linear function of normalized gray matter volume (adjusted R2 = 0.51; P = .008; mean absolute percentage error, 19%; Fig 2b, 2c; Table 3). This equation estimated RPMC mean MN density with a less than 10% error in seven of the 11 patients with ALS (64%). Adding magnetization transfer ratio metrics did not significantly improve estimation of RPMC MN density.
Figure 2a:
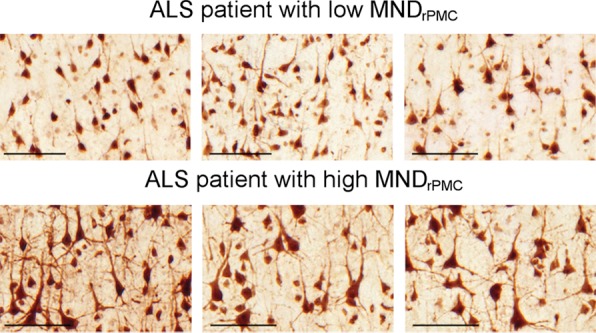
Estimating right primary motor cortex (PMC; RPMC ) motor neuron (MN ) density in all patients with amyotrophic lateral sclerosis (ALS) by using MR imaging. (a) Examples of layer-5 regions of interest from HuR immunostaining of RPMC, digitized at magnification 20×, from two different patients with ALS. Top: female patient with sporadic ALS with lower limb onset at 64 years old and a 9.9-year disease duration. RPMC mean MN density: 89 neurons per square millimeter in the superior RPMC (left), 86 neurons per square millimeter in the mid RPMC (center), 166 neurons per square millimeter in the inferior RPMC (right). Bottom: female patient with familial ALS (superoxide dismutase 1) with lower limb onset at 49 years old and 2.1-year disease duration. RPMC mean MN density: 269 neurons per square millimeter in the superior RPMC (left), 233 neurons per square millimeter in the mid RPMC (center), 182 neurons per square millimeter in the inferior PMC (right). Scale bars, 0.1 mm. (b) Automated normalized gray matter volume segmentation obtained from SIENAX (FMRIB Software Library) analysis of T1-weighted MR imaging from the same patients as in a. Normalized gray matter volume, 648 317 mm3 (top); normalized gray matter volume, 825 076 mm3 (bottom). (c) RPMC mean neuronal density in 11 patients with ALS estimated by y = (−238) + (5 · NGMV), where NGMV is normalized gray matter volume yielded by SIENAX divided by 10 000 for ease in visualizing the equation. The dotted line designates perfect prediction. F = patients with familial ALS; MND = MN density; MNDrPMC = MN density in the RPMC.
Figure 2b:
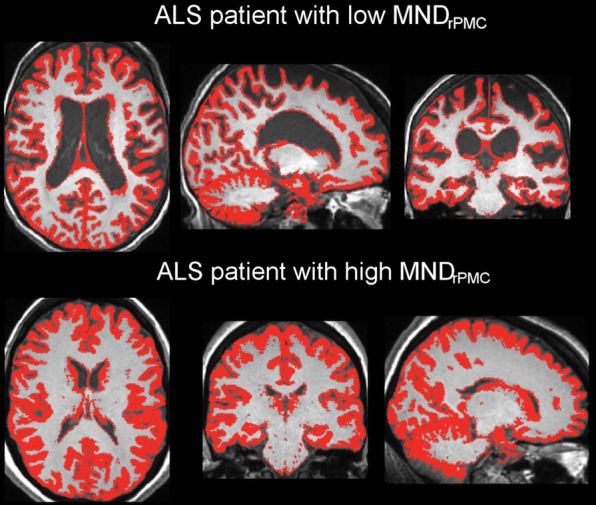
Estimating right primary motor cortex (PMC; RPMC ) motor neuron (MN ) density in all patients with amyotrophic lateral sclerosis (ALS) by using MR imaging. (a) Examples of layer-5 regions of interest from HuR immunostaining of RPMC, digitized at magnification 20×, from two different patients with ALS. Top: female patient with sporadic ALS with lower limb onset at 64 years old and a 9.9-year disease duration. RPMC mean MN density: 89 neurons per square millimeter in the superior RPMC (left), 86 neurons per square millimeter in the mid RPMC (center), 166 neurons per square millimeter in the inferior RPMC (right). Bottom: female patient with familial ALS (superoxide dismutase 1) with lower limb onset at 49 years old and 2.1-year disease duration. RPMC mean MN density: 269 neurons per square millimeter in the superior RPMC (left), 233 neurons per square millimeter in the mid RPMC (center), 182 neurons per square millimeter in the inferior PMC (right). Scale bars, 0.1 mm. (b) Automated normalized gray matter volume segmentation obtained from SIENAX (FMRIB Software Library) analysis of T1-weighted MR imaging from the same patients as in a. Normalized gray matter volume, 648 317 mm3 (top); normalized gray matter volume, 825 076 mm3 (bottom). (c) RPMC mean neuronal density in 11 patients with ALS estimated by y = (−238) + (5 · NGMV), where NGMV is normalized gray matter volume yielded by SIENAX divided by 10 000 for ease in visualizing the equation. The dotted line designates perfect prediction. F = patients with familial ALS; MND = MN density; MNDrPMC = MN density in the RPMC.
Figure 2c:
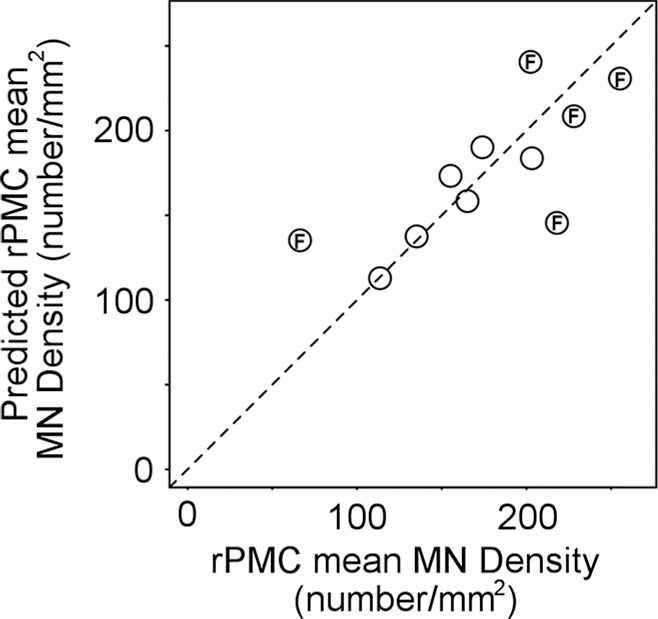
Estimating right primary motor cortex (PMC; RPMC ) motor neuron (MN ) density in all patients with amyotrophic lateral sclerosis (ALS) by using MR imaging. (a) Examples of layer-5 regions of interest from HuR immunostaining of RPMC, digitized at magnification 20×, from two different patients with ALS. Top: female patient with sporadic ALS with lower limb onset at 64 years old and a 9.9-year disease duration. RPMC mean MN density: 89 neurons per square millimeter in the superior RPMC (left), 86 neurons per square millimeter in the mid RPMC (center), 166 neurons per square millimeter in the inferior RPMC (right). Bottom: female patient with familial ALS (superoxide dismutase 1) with lower limb onset at 49 years old and 2.1-year disease duration. RPMC mean MN density: 269 neurons per square millimeter in the superior RPMC (left), 233 neurons per square millimeter in the mid RPMC (center), 182 neurons per square millimeter in the inferior PMC (right). Scale bars, 0.1 mm. (b) Automated normalized gray matter volume segmentation obtained from SIENAX (FMRIB Software Library) analysis of T1-weighted MR imaging from the same patients as in a. Normalized gray matter volume, 648 317 mm3 (top); normalized gray matter volume, 825 076 mm3 (bottom). (c) RPMC mean neuronal density in 11 patients with ALS estimated by y = (−238) + (5 · NGMV), where NGMV is normalized gray matter volume yielded by SIENAX divided by 10 000 for ease in visualizing the equation. The dotted line designates perfect prediction. F = patients with familial ALS; MND = MN density; MNDrPMC = MN density in the RPMC.
Table 3.
Statistical Model Parameters for Estimating PMC MN Density
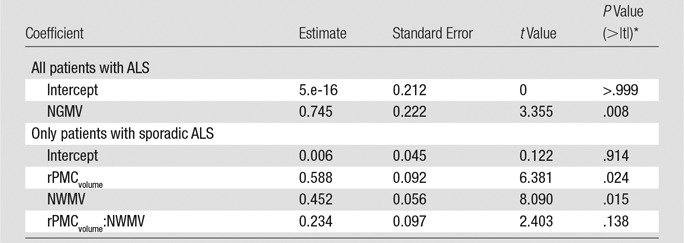
Note.—Normalized gray matter volume and normalized white matter volume are obtained from SIENAX (FMRIB Software Library). NGMV = normalized gray matter volume, NWMV = normalized white matter volume.
*> |t| is the probability of observing any value larger than t.
When clinical variables were tested to improve estimation of RPMC mean MN density, the best linear model was a function of normalized brain volume and mutation status (ie, whether the patient had either superoxide dismutase 1 or C9orf72 mutations; adjusted R2 = 0.77; P = .004; mean absolute percentage error, 14%), which was not statistically significantly better than with the MR imaging–only linear function of normalized gray matter volume. To confirm that postmortem time at imaging did not affect our results, we calculated the linear correlation between the death-to-MR imaging interval and MR imaging white matter signal-to-noise ratio, gray matter signal-to-noise ratio, and white matter and gray matter contrast-to-noise ratio, and none of them were significant.
Estimating RPMC Mean MN Density in Sporadic and Familial ALS
To better understand why estimation of RPMC MN density by MR imaging yields greater than 10% error in a minority of patients, we examined the linear correlation between RPMC MN density and MR imaging metrics in sporadic ALS and familial ALS separately. In sporadic ALS, RPMC MN density was significantly correlated with normalized brain volume, normalized gray matter volume, normalized white matter volume, and normalized volume of RPMC (r = 0.81–0.93; P = .007–.049). In familial ALS, RPMC MN density was not significantly correlated with any of the MR imaging metrics, only with disease duration (r = −0.90; P = .04).
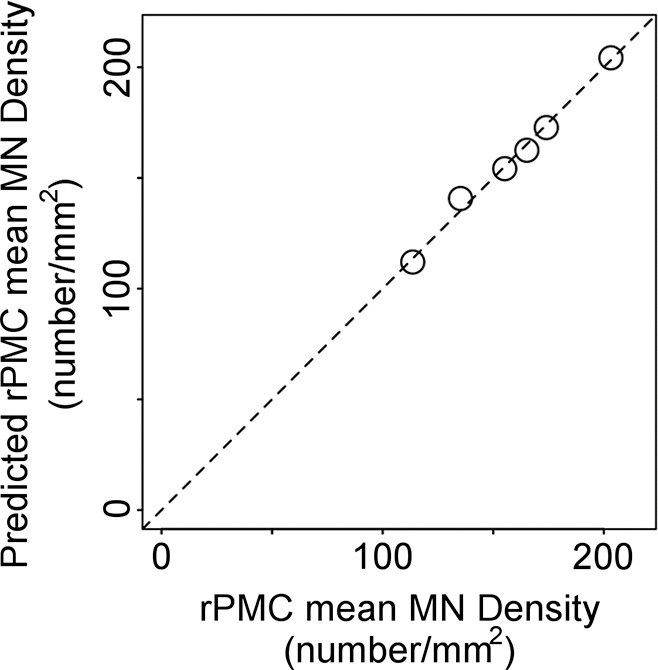
When the patients with sporadic ALS are considered separately from the patients with familial ALS, RPMC MN density can be estimated by using a linear function of normalized volume of RPMC (adjusted R2 = 0.58; P = .049; mean absolute percentage error, 8%). The inclusion of a global MR imaging metric improved estimation; RPMC MN density was best estimated by MR imaging with a linear function of normalized volume of RPMC and normalized white matter volume (adjusted R2 = 0.98; P = .01; mean absolute percentage error, 1.5%; Fig 3, Table 3). This equation estimated RPMC mean MN density with less than 10% error in all patients with sporadic ALS. When clinical variables were tested for improving estimation of RPMC mean MN density, the best linear model was a function of normalized brain volume and onset location (ie, limb or bulbar; adjusted R2 = 0.98; P = .009; mean absolute percentage error, 0.9%), which was not significantly better than with the MR imaging–only linear function.
Figure 3a:
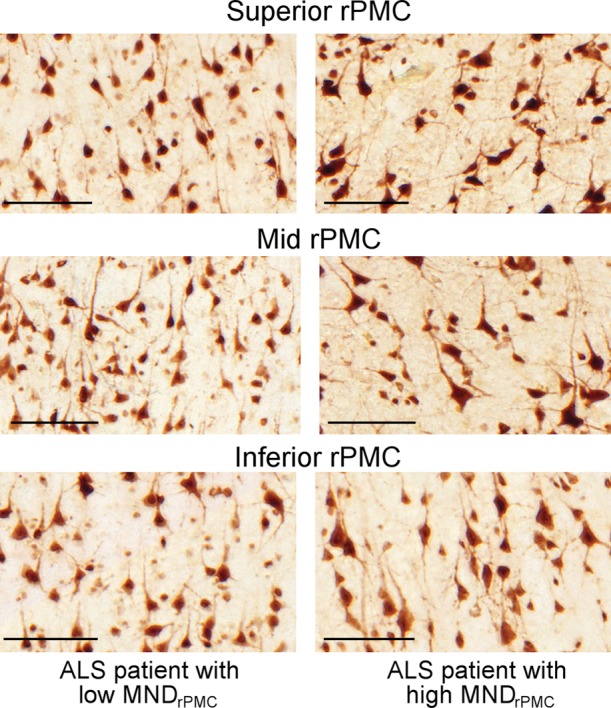
Estimating right primary motor cortex (PMC; RPMC) motor neuron (MN) density in patients with sporadic amyotrophic lateral sclerosis (ALS) by using MR imaging. (a) Examples of layer-5 regions of interest from HuR immunostaining of RPMC, digitized at magnification of 20×, from two different patients with ALS. Female patient with sporadic ALS with lower limb onset at 64 years old and 9.9-year disease duration; RPMC mean MN density: 89 neurons per square millimeter in the superior RPMC, 86 neurons per square millimeter in the mid RPMC, 166 neurons per square millimeter in the inferior RPMC (left). Male patient with sporadic ALS patient with lower limb onset at 61 years old and 4-year disease duration; RPMC mean MN density: 178 neurons per square millimeter in the superior RPMC, 174 neurons per square millimeter in the mid RPMC, 170 neurons per square millimeter in the inferior PMC (right). Scale bars, 0.1 mm. (b) Automated RPMC segmentation obtained from Freesurfer (http://surfer.nmr.mgh.harvard.edu/) and normalized white matter volume segmentation from SIENAX (FMRIB Software Library) analyses of T1-weighted MR imaging from the same patients as in a. Normalized volume of RPMC, 0.004; normalized white matter volume, 667 523 mm3 (left). Normalized volume of RPMC, 0.008; normalized white matter volume, 702 866 mm3 (right). (c) Graph shows RPMC mean neuronal density in six patients with sporadic ALS estimated by the following equation: y = (471) + (−10 · rPMCvolume) + (−6 · NWMV) + (0.2 · rPMCvolume · NWMV), where rPMCvolume is normalized volume of RPMC (yielded by Freesurfer) and is multiplied by 10 000 and NWMV is normalized white matter volume yielded by SIENAX divided by 10 000 for ease in visualizing the equation. The dotted line designates perfect prediction.
Figure 3b:

Estimating right primary motor cortex (PMC; RPMC) motor neuron (MN) density in patients with sporadic amyotrophic lateral sclerosis (ALS) by using MR imaging. (a) Examples of layer-5 regions of interest from HuR immunostaining of RPMC, digitized at magnification of 20×, from two different patients with ALS. Female patient with sporadic ALS with lower limb onset at 64 years old and 9.9-year disease duration; RPMC mean MN density: 89 neurons per square millimeter in the superior RPMC, 86 neurons per square millimeter in the mid RPMC, 166 neurons per square millimeter in the inferior RPMC (left). Male patient with sporadic ALS patient with lower limb onset at 61 years old and 4-year disease duration; RPMC mean MN density: 178 neurons per square millimeter in the superior RPMC, 174 neurons per square millimeter in the mid RPMC, 170 neurons per square millimeter in the inferior PMC (right). Scale bars, 0.1 mm. (b) Automated RPMC segmentation obtained from Freesurfer (http://surfer.nmr.mgh.harvard.edu/) and normalized white matter volume segmentation from SIENAX (FMRIB Software Library) analyses of T1-weighted MR imaging from the same patients as in a. Normalized volume of RPMC, 0.004; normalized white matter volume, 667 523 mm3 (left). Normalized volume of RPMC, 0.008; normalized white matter volume, 702 866 mm3 (right). (c) Graph shows RPMC mean neuronal density in six patients with sporadic ALS estimated by the following equation: y = (471) + (−10 · rPMCvolume) + (−6 · NWMV) + (0.2 · rPMCvolume · NWMV), where rPMCvolume is normalized volume of RPMC (yielded by Freesurfer) and is multiplied by 10 000 and NWMV is normalized white matter volume yielded by SIENAX divided by 10 000 for ease in visualizing the equation. The dotted line designates perfect prediction.
Figure 3c:
Estimating right primary motor cortex (PMC; RPMC) motor neuron (MN) density in patients with sporadic amyotrophic lateral sclerosis (ALS) by using MR imaging. (a) Examples of layer-5 regions of interest from HuR immunostaining of RPMC, digitized at magnification of 20×, from two different patients with ALS. Female patient with sporadic ALS with lower limb onset at 64 years old and 9.9-year disease duration; RPMC mean MN density: 89 neurons per square millimeter in the superior RPMC, 86 neurons per square millimeter in the mid RPMC, 166 neurons per square millimeter in the inferior RPMC (left). Male patient with sporadic ALS patient with lower limb onset at 61 years old and 4-year disease duration; RPMC mean MN density: 178 neurons per square millimeter in the superior RPMC, 174 neurons per square millimeter in the mid RPMC, 170 neurons per square millimeter in the inferior PMC (right). Scale bars, 0.1 mm. (b) Automated RPMC segmentation obtained from Freesurfer (http://surfer.nmr.mgh.harvard.edu/) and normalized white matter volume segmentation from SIENAX (FMRIB Software Library) analyses of T1-weighted MR imaging from the same patients as in a. Normalized volume of RPMC, 0.004; normalized white matter volume, 667 523 mm3 (left). Normalized volume of RPMC, 0.008; normalized white matter volume, 702 866 mm3 (right). (c) Graph shows RPMC mean neuronal density in six patients with sporadic ALS estimated by the following equation: y = (471) + (−10 · rPMCvolume) + (−6 · NWMV) + (0.2 · rPMCvolume · NWMV), where rPMCvolume is normalized volume of RPMC (yielded by Freesurfer) and is multiplied by 10 000 and NWMV is normalized white matter volume yielded by SIENAX divided by 10 000 for ease in visualizing the equation. The dotted line designates perfect prediction.
Because of the small size (n = 5) and large heterogeneity (three different mutations) of the familial ALS group, developing a separate equation for estimating RPMC MN density in familial ALS was not reasonable. Use of the linear function of normalized gray matter volume (developed for use in both sporadic ALS and familial ALS) to estimate RPMC density in familial ALS yielded mean absolute percentage error of 35% with less than 20% error in three of five patients with familial ALS.
Use of Biomarkers of PMC MN Density and MN Loss to Monitor ALS
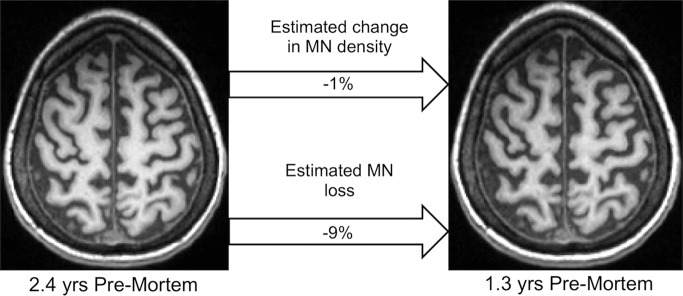
When estimating PMC MN density with a linear function of normalized gray matter volume (the best model when evaluating sporadic ALS and familial ALS together), loss of MN density over time was detected in two of the six patients (33%; one patient with sporadic ALS with the C9orf72 mutation; one patient with sporadic ALS with no known mutation) and MN loss over time was detected in four of six patients (66%; one patient with sporadic ALS with the C9orf72 mutation; two patients with sporadic ALS with no known mutations; and one patient with familial ALS with the C9orf72 mutation). When estimating PMC MN density in patients with sporadic ALS with a linear function of normalized volume of RPMC and normalized white matter volume (the best model when evaluating only sporadic ALS), loss of MN density and MN loss over time were detected in all patients with sporadic ALS (even sporadic ALS with the C9orf72 mutation) (Fig 4). Immunostained tissue was available for the patient with sporadic ALS and the C9orf72 mutation, revealing that the linear function of normalized gray matter volume (for estimating MN density in all patients with ALS) underestimated MN density at 7 months before death by more than 38% and that the linear function of normalized volume of RPMC and normalized white matter volume (for estimating MN density in sporadic ALS) underestimated by greater than 12%, which reinforced the difficulty of estimating MN density in patients with ALS with mutations.
Figure 4:
Monitoring change in MN density and MN loss in vivo. In vivo T1-weighted MR imaging from female patient with sporadic ALS with bulbar onset at 57 years old. The MR examinations were acquired at disease duration of 1.2 years and 2.3 years.
Discussion
Loss of upper MNs is a pathologic hallmark of ALS that is difficult to quantify during life. A validated imaging biomarker of upper MN density would improve monitoring of disease progression, screening for clinical trials, and assessment of therapeutic efficacy. Whereas studies of patients with ALS have shown decreased MN density and MR imaging abnormalities in PMC, MR imaging metrics have not been analyzed to estimate PMC MN density in ALS. In our study, we quantified RPMC layer-5 mean neuronal density on immunostained tissue and analyzed in situ brain MR imaging from the same patients with ALS. We found that RPMC MN density spanned a greater than threefold range across patients. A linear function of MR imaging–derived normalized gray matter volume estimated RPMC MN density with low error in most patients. A linear function of normalized volume of RPMC and normalized white matter volume estimated RPMC MN density with low error in all patients with sporadic ALS. To demonstrate how biomarkers of PMC MN density and MN loss could be used to monitor disease, we analyzed an in vivo cohort, detecting loss of MN density and MN loss over time.
Initial analyses to determine if any clinical variables explained the wide range of RPMC mean MN density measured by immunostaining revealed only a single significant finding: that patients with ALS with either C9orf72 or superoxide dismutase 1 mutation exhibited significantly higher MN density compared with patients with neither mutation. The group sizes are too small to allow speculation on the mechanism underlying this observation.
Linear modeling was performed by using an unbiased iterative method to determine if MR imaging metrics could estimate RPMC mean MN density. Initially, we tested if MR imaging metrics specific to RPMC could estimate RPMC MN density in all patients with ALS. Despite the small set of candidate parameters, the strength of this model is that it does not include information on mutation, which requires costly genetic testing, and patient recall of family history and details pertaining to the onset of symptoms. We found that a linear function of normalized volume of RPMC was able to estimate RPMC MN density, albeit with a relatively high average error. It was therefore assessed whether global MR imaging metrics or a limited set of clinical variables could improve estimation. Analyses yielded an improved model, estimating RPMC MN density with a linear function of normalized gray matter volume. Advantages of this model include low error in most patients, no clinical variables, and the calculation of normalized gray matter volume from analyzing only the T1-weighted MR images. This implies that upper MN density in a living patient with ALS could be estimated from a short MR imaging visit followed by automated analysis.
We observed relatively high error by using the linear function of normalized gray matter volume to model RPMC mean MN density in some patients with ALS, and testing in vivo data suggested that the model may lack sensitivity. Adding clinical variables did not significantly improve estimation. Statistical analyses revealed that brain MR imaging metrics correlated strongly with RPMC MN density in sporadic ALS but not in familial ALS, which led us to formulate a separate model for sporadic ALS. This approach allowed us to achieve better estimation of RPMC MN density by MR imaging in sporadic ALS. Because approximately 90% of all ALS is sporadic ALS and there is presently no means of quantifying upper MN density, we believe that having a validated imaging biomarker of upper MN density in sporadic ALS is helpful. Whereas the size and heterogeneity of the familial ALS group prohibited formulating a separate equation for estimating MN density in familial ALS, the linear equation of normalized gray matter volume formulated for all patients with ALS performed relatively well for most patients with familial ALS.
There are limitations to this study that need to be considered to interpret the data. The relatively small and heterogeneous patient group is a limitation; this study has to be considered to be an initial feasibility study. Having many candidate estimators (ie, RPMC MR imaging metrics, global MR imaging metrics, and clinical variables) to model a small group is a limitation. To avoid overfitting, we allowed only two estimators to be included in the model. Models on the basis of small heterogeneous populations would be expected to overestimate errors. When considering all postmortem patients with ALS, our estimation equation exhibited an average error of 19%, which suggested that average error may be lower when analyzing a larger group. Although analyzing the sporadic ALS subset exacerbated the group size problem, the heterogeneity was minimized, which allowed us to achieve 1.5% average error for MR imaging estimation of MN density in sporadic ALS. Another limitation is that the upper MN density estimation equations were derived from analyses of MR examinations and tissues obtained from end-stage patients and may not be generalizable to evaluating early-stage ALS. Even more generally, results obtained by analyzing an independent set of MR examinations are expected to be less accurate. To evaluate the challenge of estimating changes in upper MN density and loss of MNs in an independent set of patients with early stage ALS, we analyzed an in vivo cohort. In this cohort, MR imaging was performed approximately 14 months after disease onset with follow-up MR imaging approximately 8 months later. The linear models detected decreases in MN density and MN loss, which suggested that the models are sensitive to pathologic changes in living patients with ALS. We prospectively limited the equation estimating upper MN density to be linear and will explore to nonlinear equations with availability of larger datasets. To facilitate the translation of our results to clinical trials, we prospectively limited our postmortem MR image acquisition to include the identical sequences routinely used in living patients. The added value of more advanced quantitative imaging metrics or potential advantages of 7-T MR imaging will be assessed in the future.
In conclusion, MR imaging and immunostaining of brains from patients with ALS reveals that a linear function of MR imaging–derived measurements may estimate upper MN density. Immunostaining of the RPMC from patients with ALS demonstrates variability in MN density at end-stage disease, which suggests that monitoring PMC MN density throughout the disease course may reveal heterogeneity important to understanding disease progression. This feasibility study demonstrates that RPMC mean MN density can be estimated by using a linear function of MR imaging metrics calculated from the automated analysis of T1-weighted MR imaging, yielding estimates within 1.5% of standard results from quantification of immunostained tissues in sporadic ALS and less than 20% error in most patients with familial ALS. We also demonstrate how imaging biomarkers of PMC MN density and MN loss could potentially be used to monitor disease by detecting loss of MN density and MN loss over time in an in vivo cohort. Estimation of PMC MN density and MN loss by using MR imaging should be useful for monitoring disease progression, screening for clinical trial enrollment, and evaluating therapeutic efficacy.
Implication for Patient Care
■ Brain MR imaging measurements can potentially help to estimate upper motor neuron density and loss over the course of amyotrophic lateral sclerosis and may be useful to consider before initiation of therapy or enrollment of clinical trials and for monitoring disease progression.
APPENDIX
Acknowledgments
Acknowledgments
We thank the patients with ALS and their families for participating in our research, our institute’s MR imaging physicists and technologists for imaging expertise, our institute’s Anatomic Pathology assistants for rapid autopsy services, and Renovo Neural for neuronal density quantification.
Received December 28, 2016; revision requested February 28, 2017; revision received August 25; accepted September 15; final version accepted November 14.
J.C. supported by NIH/NCRR (CTSA KL2TR000440), National Institute of Neurologic Disorders and Stroke Clinical Research in ALS and Related Disorders for Therapeutic Development Clinical Research Scholarship U5NS092091, and Cleveland Clinic Education Department Body Donation Program. E.P.P. and J.C. supported by Brightside of the Road Foundation. B.D.T. supported by Cleveland Clinic, Radiology Department Pilot Funding); B.D.T., J.C., and E.P.P. supported by Amyotrophic Lateral Sclerosis Association (Investigator Initiated Starter Award/2152 and Investigator Initiated Multiyear/16-IIP-318). Study supported by National Institute of Neurologic Disorders and Stroke (Clinical Research in ALS and Related Disorders, R35NS09730).
The contents are solely the responsibility of the authors and do not necessarily represent the official views of the NIH.
Disclosures of Conflicts of Interest: J.C. disclosed no relevant relationships. V.K. disclosed no relevant relationships. E.P.P. Activities related to the present article: disclosed no relevant relationships. Activities not related to the present article: disclosed consultancy for Cytokinetics; payment for lectures from PlatformQ Health Education, PeerView Press, and NeuroCare Live; and stock or stock options for CytRx and Solgenix. Other relationships: disclosed no relevant relationships. B.D.T. Activities related to the present article: disclosed grant and personal fees from Genzyme; grant from Ohio Third Frontier; personal fees and nonfinancial support from Genentech; and personal fees and nonfinancial support from Novartis. Activities not related to the present article: disclosed no relevant relationships. Other relationships: disclosed no relevant relationships.
Abbreviations:
- ALS
- amyotrophic lateral sclerosis
- MN
- motor neuron
- PMC
- primary motor cortex
- RPMC
- right PMC
References
- 1.Renton AE, Chiò A, Traynor BJ. State of play in amyotrophic lateral sclerosis genetics. Nat Neurosci 2014;17(1):17–23. [DOI] [PMC free article] [PubMed] [Google Scholar]
- 2.Swash M. Why are upper motor neuron signs difficult to elicit in amyotrophic lateral sclerosis? J Neurol Neurosurg Psychiatry 2012;83(6):659–662. [DOI] [PubMed] [Google Scholar]
- 3.Huynh W, Simon NG, Grosskreutz J, Turner MR, Vucic S, Kiernan MC. Assessment of the upper motor neuron in amyotrophic lateral sclerosis. Clin Neurophysiol 2016;127(7):2643–2660. [DOI] [PubMed] [Google Scholar]
- 4.Kawamata T, Akiyama H, Yamada T, McGeer PL. Immunologic reactions in amyotrophic lateral sclerosis brain and spinal cord tissue. Am J Pathol 1992;140(3):691–707. [PMC free article] [PubMed] [Google Scholar]
- 5.Oba H, Araki T, Ohtomo K, et al. Amyotrophic lateral sclerosis: T2 shortening in motor cortex at MR imaging. Radiology 1993;189(3):843–846. [DOI] [PubMed] [Google Scholar]
- 6.Zhang L, Ulug AM, Zimmerman RD, Lin MT, Rubin M, Beal MF. The diagnostic utility of FLAIR imaging in clinically verified amyotrophic lateral sclerosis. J Magn Reson Imaging 2003;17(5):521–527. [DOI] [PubMed] [Google Scholar]
- 7.Kwan JY, Jeong SY, Van Gelderen P, et al. Iron accumulation in deep cortical layers accounts for MRI signal abnormalities in ALS: correlating 7 tesla MRI and pathology. PLoS One 2012;7(4):e35241. [DOI] [PMC free article] [PubMed] [Google Scholar]
- 8.Adachi Y, Sato N, Saito Y, et al. Usefulness of SWI for the Detection of Iron in the Motor Cortex in Amyotrophic Lateral Sclerosis. J Neuroimaging 2015;25(3):443–451. [DOI] [PubMed] [Google Scholar]
- 9.Meadowcroft MD, Mutic NJ, Bigler DC, et al. Histological-MRI correlation in the primary motor cortex of patients with amyotrophic lateral sclerosis. J Magn Reson Imaging 2015;41(3):665–675. [DOI] [PMC free article] [PubMed] [Google Scholar]
- 10.Bede P, Bokde A, Elamin M, et al. Grey matter correlates of clinical variables in amyotrophic lateral sclerosis (ALS): a neuroimaging study of ALS motor phenotype heterogeneity and cortical focality. J Neurol Neurosurg Psychiatry 2013;84(7):766–773. [DOI] [PubMed] [Google Scholar]
- 11.Schuster C, Kasper E, Machts J, et al. Focal thinning of the motor cortex mirrors clinical features of amyotrophic lateral sclerosis and their phenotypes: a neuroimaging study. J Neurol 2013;260(11):2856–2864. [DOI] [PubMed] [Google Scholar]
- 12.Schuster C, Kasper E, Dyrba M, et al. Cortical thinning and its relation to cognition in amyotrophic lateral sclerosis. Neurobiol Aging 2014;35(1):240–246. [DOI] [PubMed] [Google Scholar]
- 13.Rajagopalan V, Pioro EP. Distinct patterns of cortical atrophy in ALS patients with or without dementia: an MRI VBM study. Amyotroph Lateral Scler Frontotemporal Degener 2014;15(3-4):216–225. [DOI] [PubMed] [Google Scholar]
- 14.Zhang J, Yin X, Zhao L, et al. Regional alterations in cortical thickness and white matter integrity in amyotrophic lateral sclerosis. J Neurol 2014;261(2):412–421. [DOI] [PubMed] [Google Scholar]
- 15.Menke RA, Körner S, Filippini N, et al. Widespread grey matter pathology dominates the longitudinal cerebral MRI and clinical landscape of amyotrophic lateral sclerosis. Brain 2014;137(Pt 9):2546–2555. [DOI] [PMC free article] [PubMed] [Google Scholar]
- 16.Cosottini M, Pesaresi I, Piazza S, et al. Magnetization transfer imaging demonstrates a distributed pattern of microstructural changes of the cerebral cortex in amyotrophic lateral sclerosis. AJNR Am J Neuroradiol 2011;32(4):704–708. [DOI] [PMC free article] [PubMed] [Google Scholar]
- 17.Cosottini M, Cecchi P, Piazza S, et al. Mapping cortical degeneration in ALS with magnetization transfer ratio and voxel-based morphometry. PLoS One 2013;8(7):e68279. [DOI] [PMC free article] [PubMed] [Google Scholar]
- 18.Agosta F, Pagani E, Petrolini M, et al. MRI predictors of long-term evolution in amyotrophic lateral sclerosis. Eur J Neurosci 2010;32(9):1490–1496. [DOI] [PubMed] [Google Scholar]
- 19.Mezzapesa DM, D’Errico E, Tortelli R, et al. Cortical thinning and clinical heterogeneity in amyotrophic lateral sclerosis. PLoS One 2013;8(11):e80748. [DOI] [PMC free article] [PubMed] [Google Scholar]
- 20.Brooks BR, Miller RG, Swash M, Munsat TL; World Federation of Neurology Research Group on Motor Neuron Diseases. El Escorial revisited: revised criteria for the diagnosis of amyotrophic lateral sclerosis. Amyotroph Lateral Scler Other Motor Neuron Disord 2000;1(5):293–299. [DOI] [PubMed] [Google Scholar]
- 21.Dale AM, Fischl B, Sereno MI. Cortical surface-based analysis. I. Segmentation and surface reconstruction. Neuroimage 1999;9(2):179–194. [DOI] [PubMed] [Google Scholar]
- 22.Fischl B, Sereno MI, Dale AM. Cortical surface-based analysis. II: Inflation, flattening, and a surface-based coordinate system. Neuroimage 1999;9(2):195–207. [DOI] [PubMed] [Google Scholar]
- 23.Fischl B, Dale AM. Measuring the thickness of the human cerebral cortex from magnetic resonance images. Proc Natl Acad Sci U S A 2000;97(20):11050–11055. [DOI] [PMC free article] [PubMed] [Google Scholar]
- 24.Fischl B, Liu A, Dale AM. Automated manifold surgery: constructing geometrically accurate and topologically correct models of the human cerebral cortex. IEEE Trans Med Imaging 2001;20(1):70–80. [DOI] [PubMed] [Google Scholar]
- 25.Fischl B, Salat DH, Busa E, et al. Whole brain segmentation: automated labeling of neuroanatomical structures in the human brain. Neuron 2002;33(3):341–355. [DOI] [PubMed] [Google Scholar]
- 26.Fischl B, van der Kouwe A, Destrieux C, et al. Automatically parcellating the human cerebral cortex. Cereb Cortex 2004;14(1):11–22. [DOI] [PubMed] [Google Scholar]
- 27.Desikan RS, Ségonne F, Fischl B, et al. An automated labeling system for subdividing the human cerebral cortex on MRI scans into gyral based regions of interest. Neuroimage 2006;31(3):968–980. [DOI] [PubMed] [Google Scholar]
- 28.Smith SM, Zhang Y, Jenkinson M, et al. Accurate, robust, and automated longitudinal and cross-sectional brain change analysis. Neuroimage 2002;17(1):479–489. [DOI] [PubMed] [Google Scholar]
- 29.Smith SM, Jenkinson M, Woolrich MW, et al. Advances in functional and structural MR image analysis and implementation as FSL. Neuroimage 2004;23(Suppl 1):S208–S219. [DOI] [PubMed] [Google Scholar]
- 30.Chen JT, Easley K, Schneider C, et al. Clinically feasible MTR is sensitive to cortical demyelination in MS. Neurology 2013;80(3):246–252. [DOI] [PMC free article] [PubMed] [Google Scholar]
- 31.Trapp BD, Peterson J, Ransohoff RM, Rudick R, Mörk S, Bö L. Axonal transection in the lesions of multiple sclerosis. N Engl J Med 1998;338(5):278–285. [DOI] [PubMed] [Google Scholar]
- 32.Schindelin J, Arganda-Carreras I, Frise E, et al. Fiji: an open-source platform for biological-image analysis. Nat Methods 2012;9(7):676–682. [DOI] [PMC free article] [PubMed] [Google Scholar]
Associated Data
This section collects any data citations, data availability statements, or supplementary materials included in this article.


