Abstract
Previously no mouse gastric cancer cell lines have been available for transplantation into C57BL/6 mice. However, a gastric cancer model in immunocompetent mice would be useful for analyzing putative therapies. N‐Methyl‐N‐nitrosourea (MNU) was given in drinking water to C57BL/6 mice and p53 heterozygous knockout mice. Only 1 tumor from a p53 knockout mouse could be cultured and the cells s.c. transplanted into a C57BL/6 mouse. We cultured this s.c. tumor, and subcloned it. mRNA expression in the most aggressive YTN16 subline was compared to the less aggressive YTN2 subline by microarray analysis, and fibroblast growth factor receptor 4 ( FGFR4) in YTN16 cells was knocked out with a CRISPR/Cas9 system and inhibited by an FGFR4 selective inhibitor, BLU9931. These transplanted cell lines formed s.c. tumors in C57BL/6 mice. Four cell lines (YTN2, YTN3, YTN5, YTN16) were subcloned and established. Their in vitro growth rates were similar. However, s.c. tumor establishment rates, metastatic rates, and peritoneal dissemination rates of YTN2 and YTN3 were lower than for YTN5 and YTN16. YTN16 established 8/8 s.c. tumors, 7/8 with lung metastases, 3/8 with lymph node metastases and 5/5 with peritoneal dissemination. FGFR4 expression by YTN16 was 121‐fold higher than YTN2. FGFR4‐deleted YTN16 cells failed to form s.c. tumors and showed lower rates of peritoneal dissemination. BLU9931 significantly inhibited the growth of peritoneal dissemination of YTN16. These studies present the first transplantable mouse gastric cancer lines. Our results further indicate that FGFR4 is an important growth signal receptor in gastric cancer cells with high FGFR4 expression.
Keywords: animal model, C57BL/6 mouse, FGFR4, gastric cancer, immunocompetent
1. INTRODUCTION
Gastric cancer is the third most common cause of cancer‐related death worldwide.1 Although some targeted therapies are under development, more research is needed to identify new targeted therapies for gastric cancer heterogeneity and its induced resistance to the therapy. Many targeted therapy candidates have been deemed effective when tested against gastric cancer cell lines in culture, but the results of clinical trials were disappointing. Thus, better preclinical models are needed to confirm the utility of candidate therapies before starting clinical trials. In vivo gastric cancer transplant experiments are usually carried out using nude mice, as transplantable mouse gastric cancer cell lines in congenic mice have not been available. However, targeted therapies using immune system modification cannot be evaluated in immune‐deficient mice. If C57BL/6 mice, the background strain of many transgenic mice and knockout mice, can be used as recipients for gastric cancer transplant experiments, the potency of therapeutic target molecules for gastric cancer treatment can be evaluated more completely. We previously established stomach cancer cell lines from N‐methyl‐N‐nitrosourea (MNU) induced glandular stomach carcinoma in BALB/c and BDF1 mice, which were non‐tumorigenic upon transplantation.2 In the present study, we successfully established cell lines from MNU‐induced glandular stomach carcinoma in a p53 heterozygous knockout (KO) C57BL/6 background mouse. These lines harbor both tumorigenic and metastatic potential.
Fibroblast growth factor receptor 4 (FGFR4) is one of the receptor tyrosine kinases (RTK) of the FGF receptor family. FGFR comprise FGFR1, FGFR2, FGFR3, and FGFR4.3 Signaling through FGFR promotes mitogenesis, proliferation, differentiation, cellular migration, angiogenesis, and repair of tissue injury with differing efficiencies in different tumor types. Although all FGFR have common features in structure, physiological role, and downstream signaling, FGFR4 differs from the other FGFR. FGFR4 deletion does not lead to an embryonic lethal phenotype, and the kinase domain of FGFR4 is structurally different from the other FGFR. Because of its unique properties, FGFR4 could be a good target for therapy even though its analysis is far behind the other FGFR. We knocked out FGFR4 in an aggressive clone of the C57BL/6 transplantable gastric cancer cell line and analyzed its behavior in vivo, as well as the efficacy of FGFR4 inhibition therapy.
2. MATERIALS AND METHODS
2.1. Animals
Two C57BL/6 male mice, 3 C57BL/6 female mice, 2 p53 heterozygous knockout male mice and 2 p53 heterozygous knockout female mice (also on a C57BL/6 background) were housed in plastic cages with hardwood chips in an air‐conditioned room with a 12 hour light‐12 hour dark cycle and were given basal diet (Oriental NMF; Oriental Yeast Co., Tokyo, Japan) and water ad libitum. C57BL/6 mice were purchased from CLEA Japan (CLEA Co., Tokyo, Japan). p53 knockout mice were a kind gift from Donehower.4 For genotyping of each mouse, DNA samples were extracted from the tail using a QIAamp tissue kit (QIAGEN Japan, Tokyo, Japan). The 2‐μL PCR reaction mixture consisted of 1.25 units Taq DNA polymerase (Takara Shuzo Co., Ltd, Shiga, Japan), 1× buffer provided, 200 μmol/L dNTP, 200 nmol/L each of primers, 10681 (5′‐GTGTTTCATTAGTTCCCCACCTTGAC‐3′) and 10480 (5′‐ATGGGAGGCTGCCAGTCCTAACCC‐3′) for WT p53, and 10588 (5′‐GTGGGAGGGACAAAAGTTCGAGGCC‐3′) and 10930 (5′‐TTTACGGAGCCCTGGCGCTCGATGT‐3′) for mutant p53 and 2.5 μL genomic DNA.5 The animal use proposal and experimental protocols were reviewed and approved by The University of Tokyo Animal Care and Use Committee (ID:15‐P‐122 and 15‐P‐125) and Aichi Cancer Center Animal Care Committee, and all animal procedures were conducted in accordance with institutional guidelines.
2.2. Inducing gastric cancer
Adenocarcinomas of the mouse stomach were induced by a previously reported procedure. In brief, 5‐week old mice were given drinking water ad libitum containing 30 ppm MNU in light‐shielded bottles on alternate weeks for a total exposure of 5 weeks and were killed after 40 weeks. MNU (Sigma Chemical Co., St Louis, MO, USA) was dissolved in distilled water and freshly prepared 3 times per week. Half of each fresh tumor was fixed in 4% paraformaldehyde in PBS, and embedded in paraffin. The remaining tumor was cut into halves. One piece was used for preparation of primary culture and the other piece was frozen in a plastic tube and dipped in liquid nitrogen.
2.3. Establishment of cell lines
Fresh gastric tumor tissue was washed 3 times with DMEM (Nissui Pharmaceutical Co., Ltd, Tokyo, Japan) containing 10% FCS (GIBCO, Grand Island, NY, USA) and 100 U/mL penicillin, 100 μg/mL streptomycin and 100 U/mL amphotericin B, and cut into small pieces with sterile scissors, and incubated in 15 mL tubes with 5 mL DMEM containing 1% FCS and 50 U/mL Dispase (Godo Shusei, Tokyo, Japan) for 30 minutes, rocking every 5 minutes, at 37°C in a water bath. After vigorous pipetting, 5 mL DMEM with 10% FCS was added and centrifuged at 100 g for 5 minutes. The supernatant was discarded and the cell pellets were washed, resuspended in 2.5 mL DMEM with 10% FCS and incubated for 30 minutes in plastic dishes at 37°C to promote fibroblast adherence to the dishes. Media containing floating cell clusters were collected and serum extender (MITO+; Collaborative Biomedical Products, Bedford, MA, USA) was added and cells were cultured on plastic dishes coated with Type I collagen (IWAKI, Asahi Techno Glass Co., Funabashi, Japan) in a humidified 5% CO2 incubator at 37°C with changes of medium every other day. After 3 weeks of culture, the cells were digested with Trypsin‐EDTA and collected with 5 mL medium and centrifuged at 100 g for 5 minutes. Pellets were resuspended in 0.2 mL and injected into a C57BL/6 mouse s.c. for selecting transplantable cells. After 40 weeks, the s.c. tumor, accounting for up to 10% of the body weight of the mouse, was excised and cultured in collagen I‐coated dishes as for the former primary culture. From the 2 dishes, 2 single cell cloned cell lines each were established. The 2 cell lines from a dish were named YTN2 and YTN3. The other 2 cell lines from the other dish were named YTN5 and YTN16. The procedure is summarized in Figure 1.
Figure 1.
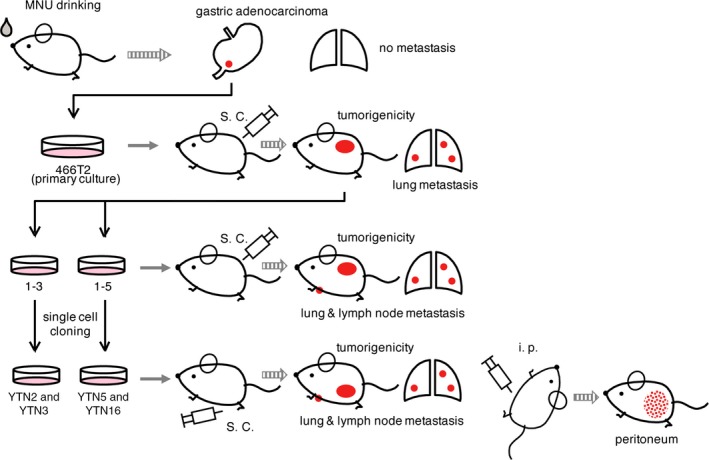
Establishment of mouse gastric cancer cell lines. Mice were given drinking water ad libitum containing 30 ppm N‐methyl‐N‐nitrosourea (MNU) on alternate weeks for a total exposure of 5 weeks and killed at 40 weeks. Fresh gastric tumor tissues were washed and primary cultured, removing fibroblasts. Cells were injected into C57BL/6 mouse s.c. The established tumor was excised and cultured. From the 2 dishes, 2 single cell cloned cell lines each were established. The 2 cell lines from 1 dish were named YTN2 and YTN3. The other 2 cell lines from the other dish were named YTN5 and YTN16
2.4. Characteristics of the original tumor and cell lines
For immunohistochemistry, the sections were treated with 3% H2O2, antigen retrieved (20 minutes of microwaving in 10 mmol/L citrate buffer, pH 6.0), and washed in PBS, followed by blocking with 1.5% normal goat serum for 30 minutes at room temperature. Then the sections were incubated with the primary antibody: anti‐pepsinogen I (1:100),6 anti‐pSTAT3 (1:50, XP Rabbit mAb; Cell Signaling Japan, Tokyo, Japan), anti‐pERK1/2 (1:400, XP Rabbit mAb; Cell Signaling Japan), or anti‐pAKT (1:100, XP Rabbit mAb; Cell Signaling Japan) overnight at 4°C. The sections were then washed in PBS and incubated with a biotinylated secondary antibody and peroxidase‐conjugated streptavidin (Vectastain ABC KIT; Vector Laboratories, Burlingame, CA, USA). Chromogen was developed with diaminobenzidine (Vector Laboratories). The sections were counterstained with Mayer's hematoxylin and mounted.
2.5. PCR analysis of the genotype of p53
The 25‐μL PCR reaction mixture consisted of 1.25 units of Taq DNA polymerase (Takara Shuzo Co., Ltd), 1× buffer provided, 200 μmol/L dNTP, 200 nmol/L each of 5′‐ and 3′‐primers (10681, 10480, 10588, and 10930), and 2.5 μL genomic DNA.
2.6. Cell growth rates
Cells (1 × 10⁴) were plated on 35‐mm plastic dishes, cultured, and cell numbers were counted with a hemocytometer after trypsinization at the indicated time points.
2.7. Evaluation of tumorigenicity and metastasis following s.c. or i.p. implantation
YTN2, YTN3, YTN5, and YTN16 were grown in collagen type I‐coated flasks, trypsin‐EDTA treated in their subconfluent states and dispersed in HBSS, and injected i.p. or s.c. into 8‐week‐old C57BL/6 male mice. Implantation and growth of cells injected i.p. (1 × 10⁷/0.5 mL) were analyzed after 5 weeks, and cells (5 × 10⁶/0.2 mL) implanted s.c. into the abdominal flanks of mice were analyzed twice per week for 12 weeks. For comparison of YTN16 tumorigenicity with FGFR4‐deleted F7 and F87 lines, 5 mice each were killed at 5 weeks after implantation. For the BLU9931 FGFR4 inhibitor experiments, 3 mice each were killed at 3 weeks after implantation.
2.8. Gene expression analysis
mRNA expression in YTN2, YTN3, YTN5, and YTN16 cell lines was evaluated by microarray. Total RNA was isolated using an AllPrep DNA/RNA Mini Kit (Qiagen, Hilden, Germany) according to the manufacturers’ protocols. Gene expression was evaluated using SurePrint G3 Mouse GE 8 × 60K Microarray Kit (Agilent Technologies, Santa Clara, CA, USA). Datasets were normalized using the Subio Platform (Subio Inc., Kagoshima, Japan) as follows: (i) signals were aligned at the 75th percentile; (ii) weak signals <4.0 were replaced with the value 4.0; (iii) fold changes to mean values were converted to log2. Probes were excluded if their values were 0 for all samples.
2.9. FGFR4 disruption by CRISPR‐Cas9 system in YTN16
These procedures were carried out by the Institute of Immunology Co. Ltd (Utsunomiya, Japan). The all‐in‐one vector, pX330 (Addgene, Cambridge, MA, USA) was used. Guide RNA (gRNA) was defined and designed targeting exon 3 of the Fgfr4 gene, using Optimized CRISPR Design (http://crispr.mit.edu/) and CRISPRdirect (http://crispr.dbcls.jp/). Sequence of the gRNA was GCAAGAGCAGGTGTTGACGG. To confirm that YTN16 incorporated the gRNA sequence in the targeting exon 3 of Fgfr4, we sequenced YTN16 DNA and confirmed the deletion. Oligo DNA, made by FASMAC Co. (Atsugi, Japan), was linearized by Bbs1 and inserted into pX330. The plasmid was heat shocked into DH5alpha competent cells and cells were selected with ampicillin. Plasmids in individual colonies were checked for insert by PCR and sequencing. Confirmed colonies were incubated, and the plasmid was purified by QIAGEN plasmid Midi Kit (QIAGEN Japan).
The plasmids were inserted into YTN16 using 4D‐Nucleofector (Lonza Japan, Tokyo, Japan) by the program EH‐156. Briefly, 2 × 10⁶ YTN16 cells and 20 μg pX330 plasmid and 1 μg puromycin resistance gene were inserted. Plasmids were mixed in 100 μg SE Nucleofection Buffer (Lonza), incubated for 24 hours, and cells were selected with 2.0 μg/mL puromycin for 48 hours. The cells were then incubated with medium and single cell cloning was carried out by the limiting dilution method. The cloned cells were sequenced for Fgfr4 exon 3 to confirm interruption of the Fgfr4 gene.
2.10. Blu9931
BLU9931 was purchased from Selleck Bioteck (Osaka, Japan). BLU9931 was dissolved to 30 mg/mL in 0.5% carboxymethylcellulose + 1% Tween 80 as a suspension, and given to mice at 30 mg/kg orally twice a day for 3 weeks beginning 1 day after transplantation of YTN16 s.c. into 3 mice or peritoneally into 3 mice. These mice were killed 1 day after the last dose of BLU9931.
3. RESULTS
Five gastric cancers were established in 5 C57BL/6 mice and 7 gastric cancers were established in 4 p53 heterozygous knockout mice. We prepared primary cultures from all 12 of the gastric cancers; however, only 1 gastric cancer from a male heterozygous p53 knockout mouse could be cultured long term. Histological analysis of the original tumor from which the cell lines were derived is shown in Figure 2. The primary tumor arose at the fundic‐antral border of the glandular stomach and was a well‐differentiated adenocarcinoma containing class III mucin, and immunohistochemically negative for pepsinogen 1. From these findings, the primary tumor was classified as an antral phenotype, which possibly arose from either TFF2 (spasmolytic polypeptide) expressing metaplasia (SPEM) or from pyloric glands, not from fundic glands without metaplastic change, and showing behavior more aggressive than fundic gland‐type gastric cancer.
Figure 2.
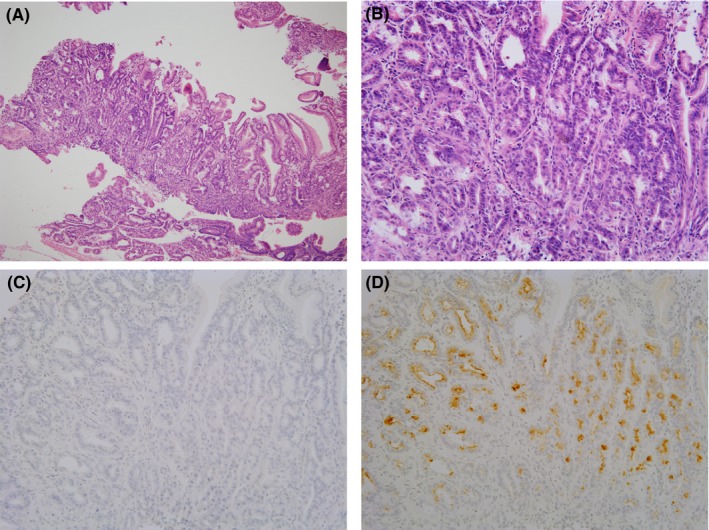
Primary tumor from which cell lines were established. (A) Hematoxylin and eosin staining (10×). (B) Higher magnification (40×). Tumor shows a well‐differentiated phenotype. (C) Pepsinogen 1 was negative in the tumor. (D) Class III mucin was positive in the tumor and thus the tumor was classified as a pyloric phenotype
Microscopic features of YTN2, YTN3, YTN5, and YTN16 are shown in Figure 3A‐D. YTN2 and YTN3 tended to have giant cells, but there were no remarkable differences among the cell lines. Growth curves of the cell lines are shown in Figure 3E. There were no differences in the growth rates among the cell lines.
Figure 3.
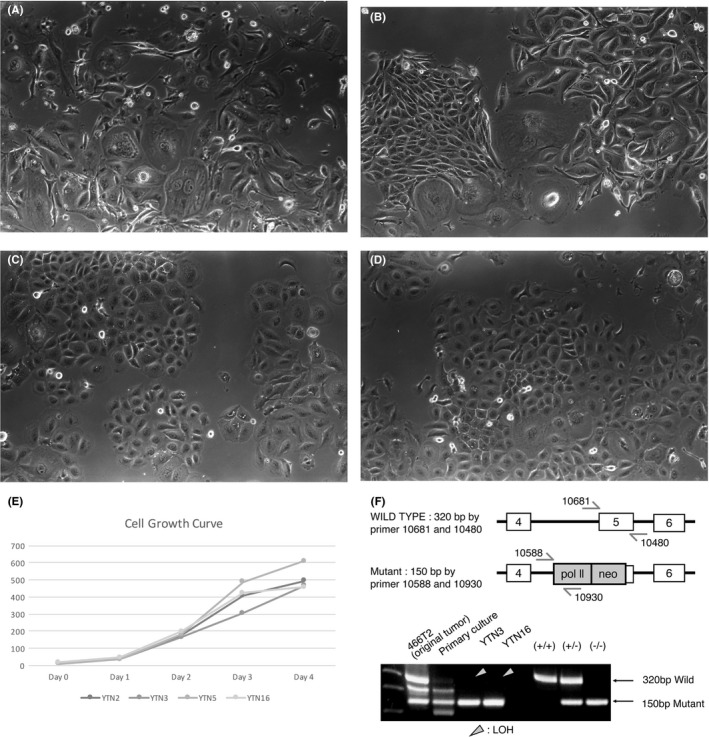
Microscopic features of growing cell lines in vitro. (A) YTN2, (B) YTN3, (C) YTN5, (D) YTN16. (E) Growth curves of the cell lines. Growth rates were not different among the cell lines. (F) PCR for WT p53 and mutant allele of p53. The subcloned cell lines were lacking in WT p53, suggesting LOH
Results of P53 PCR are shown in Figure 3F. The original tumor (466T2) arose in a p53 heterozygous knockout mouse and showed a WT p53 band and a knockout band, consistent with a WT p53 and a knockout allele of p53. However, DNA was extracted from the whole tissue of the cancer, not microdissected, and thus there was a possibility of contaminating interstitial tissue. The WT p53 band in the primary cultured cells was much weaker than in the original cancer, still suggesting a possibility of fibroblast contamination. The cloned cell lines, YTN2, YTN3, YTN5, and YTN16 had only a mutant p53 band, suggesting LOH.
We implanted 5 × 10⁶ cells of YTN2, YTN3, YTN5, and YTN16 lines s.c. into C57BL/6 mice. Tumorigenicity rates for YTN2, YTN5, and YTN16 were 100%, but were only 37.5% for YTN3. These tumorigenicity rates are described in Table 1, and the growth curves for s.c. tumor with representative macroscopic mouse s.c. tumors are shown in Figure 4. The growth rates of s.c. implanted YTN2 and YTN3, which formed tumors, were similar. YTN5 and YTN16 showed an accelerated growth rate. Metastatic rates of s.c. tumor, 12 weeks after implantation, are also shown in Table 1. The metastatic rates for lung and lymph nodes were the lowest for YTN3. Peritoneal dissemination rates of YTN2 (40%) and YTN3 (20%) were much lower than for YTN5 (100%) and YTN16 (100%) (Table 1).
Table 1.
Tumorigenicity and metastasis rates for cell lines in the present study
| Metastasisa | ||||
|---|---|---|---|---|
| Cell line | Tumorigenicity in mouse (%) | Lung | Lymph node | Peritoneum |
| YTN 2 | 7/7 (100) | 5/7 | 2/7 | 2/5 |
| YTN 3 | 3/8 (37.5) | 2/3 | 0/3 | 1/5 |
| YTN 5 | 11/11 (100) | 9/11 | 3/11 | 5/5 |
| YTN 16 | 8/8 (100) | 7/8 | 3/8 | 5/5 |
Tumorigenicity and spontaneous metastasis of the s.c. injection of 5 × 10⁶ cells.
Figure 4.
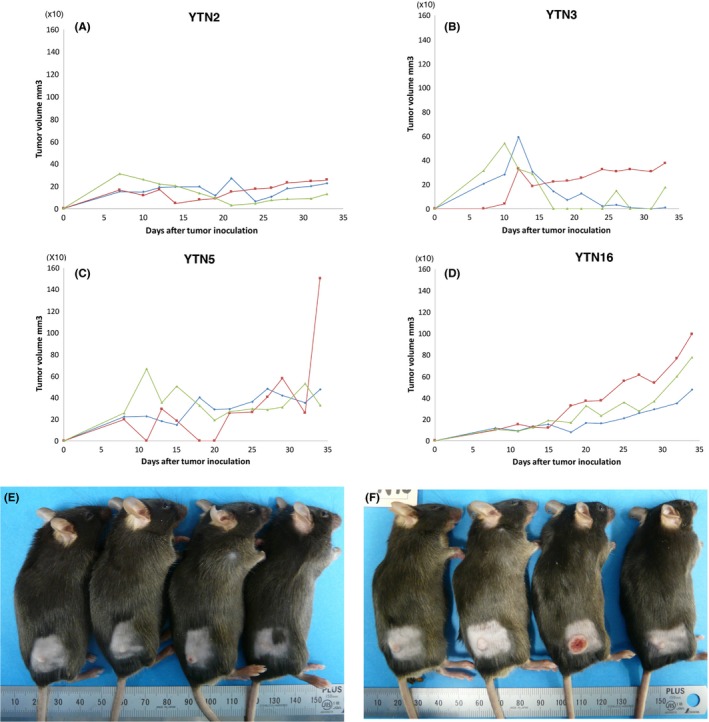
Growth curves of s.c. tumor with representative macroscopic mouse s.c. tumors. Growth curves of (A) YTN2, (B) YTN3, (C) YTN5, (D) YTN16. Macroscopic mouse cutaneous tumors of (E) YTN3, (F) YTN16
Microscopic appearance of s.c. tumor, lung metastasis, lymph node metastasis, and peritoneal dissemination is shown in Figure 5. The tumors were histologically similar among YTN, even with the size difference and different metastatic rates of the tumor. There was no lymph node metastasis for YTN3. Macroscopically, there was 1 peritoneal metastasis of YTN3; however, the nodule was so small that we could not find it microscopically after tissue processing.
Figure 5.
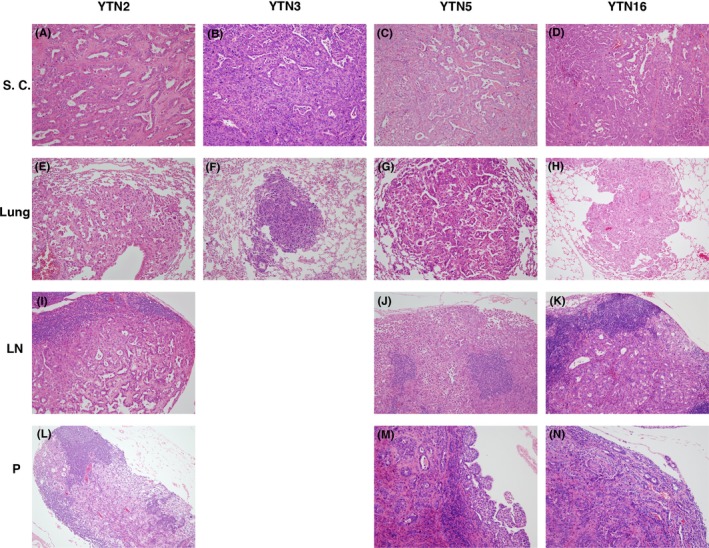
Microscopic appearance of s.c. tumor, lung metastasis, lymph node metastasis, and peritoneal dissemination of YTN2, YTN3, YTN5, and YTN16. (A‐D) S.c. tumor of YTN2‐16. (E‐H) Lung metastasis of YTN2‐16. (I‐K) Lymph node metastasis of YTN2, YTN5, YTN16. (L‐N) Peritoneal dissemination of YTN2, YTN5, YTN16. Lymph node metastasis was not detected in YTN3. Small peritoneal dissemination was macroscopically detected for YTN3, without confirmation microscopically. Microscopic morphology was not remarkably different among the cell lines
From the results of tumorigenicity rates, growth rates of the tumor, and metastatic rates in mice, YTN5 and YTN16 were more virulent than YTN2 and YTN3. We analyzed mRNA expression of these cell lines by microarray and compared gene expression among the cell lines (Table S1). The top 50 genes, for which expression in YTN5 and YTN16 are higher than in YTN2 and YTN3, are listed in Table 2 in the order of YTN16/YTN2 ratio value. From these genes, we chose Fgfr4, a receptor tyrosine kinase and one of the promoting factors for gastric cancer growth,7, 8, 9, 10 for focused analysis in YTN16, which shows 121‐fold greater expression over YTN5.
Table 2.
Top 50 genes expressed in YTN5 and YTN16 higher than in YTN2 and YTN3
| Gene symbol | N16/N2 | N5/N2 | N16/N3 | N5/N3 |
|---|---|---|---|---|
| Klhl13 | 3215.571429 | 2395.653061 | 10.10343059 | 7.527220263 |
| Clic6 | 2234.392857 | 495.7142857 | 186.1994048 | 41.30952381 |
| Gkn2 | 2116.5625 | 10197.22917 | 26.27230411 | 126.5753814 |
| Nt5e | 1496.218182 | 676.8545455 | 12.33763118 | 5.58125937 |
| Ccdc91 | 1191.62069 | 1359.931034 | 4.52553693 | 5.16474594 |
| Epb4.1l4b | 996.5533597 | 454.8221344 | 47.59826317 | 21.72361714 |
| Crisp3 | 989.3636364 | 266.4772727 | 109.9292929 | 29.60858586 |
| Rpp25 | 937.2 | 1021.866667 | 3.248902242 | 3.542408135 |
| Fkbp10 | 866.3780161 | 881.849866 | 6.898915503 | 7.022116904 |
| B3galnt1 | 776 | 78.4516129 | 22.99808795 | 2.325047801 |
| Cpm | 751.6585366 | 132.0609756 | 96.08106002 | 16.88074825 |
| Krt23 | 500.349345 | 1268.025109 | 27.3591213 | 69.33566141 |
| Bche | 421.2 | 107.4666667 | 17.12195122 | 4.368563686 |
| Rnf186 | 380.9642857 | 11.35714286 | 47.19911504 | 1.407079646 |
| Tmem246 | 363.7446809 | 191.0212766 | 21.80612245 | 11.45153061 |
| Ctse | 359.295082 | 175.5901639 | 18.3048441 | 8.945712695 |
| Bcl11b | 197.03125 | 71.84375 | 40.41666667 | 14.73717949 |
| Atp9a | 160.3814433 | 176.196449 | 9.792146029 | 10.75773683 |
| Vstm2 l | 157.7731092 | 237.8907563 | 6.194325305 | 9.339821841 |
| Sulf1 | 149.037037 | 361.5925926 | 55.12328767 | 133.739726 |
| Evx1 | 148.9 | 6.133333333 | 124.0833333 | 5.111111111 |
| Ppp2r2c | 143.7333333 | 34.93333333 | 7.825771325 | 1.90199637 |
| Sprr2a2 | 140.3106369 | 11.29787702 | 43.45008005 | 3.498620431 |
| Fgfr4 | 121.1125541 | 184.7388167 | 9.880047087 | 15.07051207 |
| Sprr2a2 | 117.1724138 | 12.27586207 | 60.67857143 | 6.357142857 |
| Wdr65 | 112.7394958 | 6.949579832 | 21.39712919 | 1.318979266 |
| Celf2 | 110.0519878 | 78.79663609 | 8.077890011 | 5.78372615 |
| Celf2 | 107.0855019 | 75.73605948 | 8.563020214 | 6.056183115 |
| Cttnbp2 | 105.9090909 | 38.72727273 | 6.386061081 | 2.335160532 |
| Lrrc26 | 101.8374384 | 60.80295567 | 1148.5 | 685.7222222 |
| Nrip3 | 101.6551724 | 7.689655172 | 16.1978022 | 1.225274725 |
| Igsf5 | 101.4725275 | 87.56043956 | 6.135548173 | 5.294352159 |
| Fabp1 | 97.64285714 | 1173.428571 | 91.13333333 | 1095.2 |
| Steap4 | 95.65714286 | 18.37142857 | 14.43103448 | 2.771551724 |
| Igsf5 | 92.6116208 | 86.74006116 | 5.302749081 | 4.96655577 |
| 2510049J12Rik | 92.52147239 | 26.44785276 | 4.161423841 | 1.189569536 |
| Gm5126 | 92.31034483 | 53.75862069 | 36.17567568 | 21.06756757 |
| Gcnt3 | 89.60273973 | 25.61643836 | 53.6147541 | 15.32786885 |
| Ucp2 | 86.985 | 104.265 | 10.2758417 | 12.31718842 |
| Enpp3 | 86.76417234 | 67.46938776 | 2.758091256 | 2.144741584 |
| Keg1 | 86.53333333 | 6.333333333 | 50.90196078 | 3.725490196 |
| Ly9 | 83.15625 | 238.84375 | 1.073849879 | 3.084342211 |
| Ucp3 | 80.76824034 | 101.0600858 | 9.06939759 | 11.34795181 |
| Plcl1 | 77.33333333 | 42.56862745 | 24.96202532 | 13.74050633 |
| Spats2 l | 75.12396694 | 73.90909091 | 6.080267559 | 5.981939799 |
| Otop3 | 73.73987207 | 24.53944563 | 62.42599278 | 20.77436823 |
| Ly6g6d | 73.28985507 | 64.02898551 | 8.484899329 | 7.412751678 |
| Pira7 | 70.34375 | 9.8125 | 57.71794872 | 8.051282051 |
| A630081J09Rik | 69.05909091 | 33.65 | 8.150751073 | 3.971566524 |
| Serpina3i | 68.88888889 | 1.185185185 | 60 | 1.032258065 |
We disrupted FGFR4 in YTN16 with CRISPR‐Cas9. Guide RNA was chosen for exon 3 of the FGFR4 gene after confirming the sequence of FGFR4. Two cell lines that knocked out FGFR4, F7 and F87, were obtained. F7 had an insertion of adenine and F87 had a deletion of adenine in exon 3 and both had frameshift terminations (Figure 6A,B). The growth rates of YTN16, F7, and F87 cells did not show any differences in vitro (Figure 6C) and their cell morphology was not altered (Figure 6D‐F). However, their growth in vivo was remarkably different. F7 and F87 did not form any tumors 5 weeks after transplantation s.c. (Figure 6G‐I). Only very small peritoneal dissemination tumor foci were macroscopically detected in 2 out of 5 mice both in F7 transplanted and in F87 transplanted into the mouse peritoneum, whereas YTN16‐transplanted mice showed many large nodules in the peritoneum (5 out of 5 mice, Figure 6J‐L). Microscopically, YTN16 showed large nodules of peritoneal dissemination and F7 and F87 showed only very small peritoneally disseminated tumors (2/5 mice; Figure 6M‐O).
Figure 6.
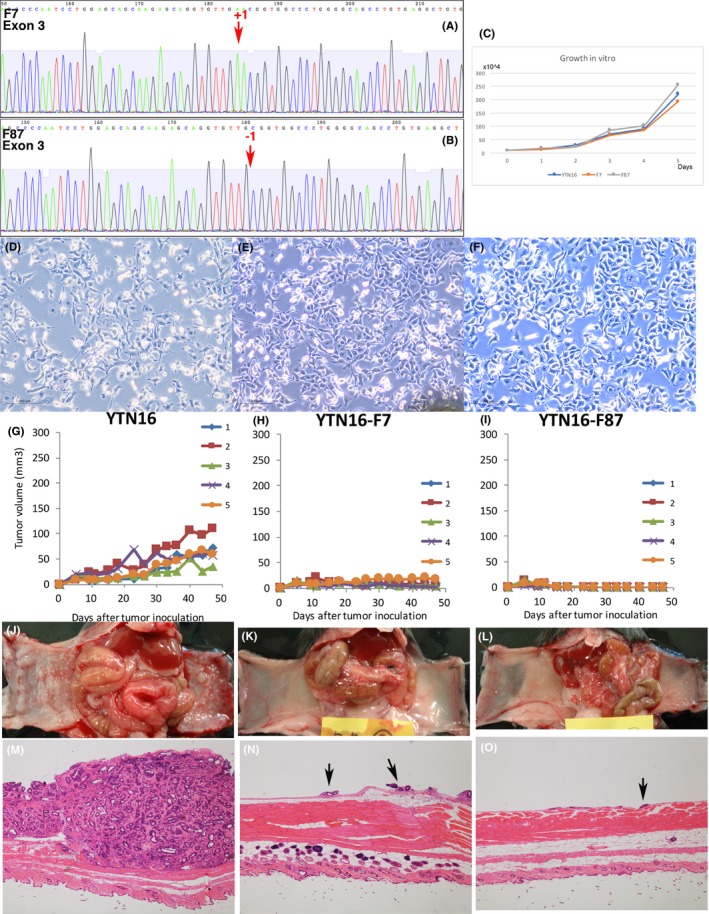
Fgfr4 disrupted YTN16. (A) F7 has an insertion of adenine in exon 3 of Fgfr4, and Fgfr4 is disrupted by a frameshift termination. (B) F87 has a deletion of adenine in exon 3 of Fgfr4, and Fgfr4 is disrupted by a frameshift termination. (C) Growth rates of YTN16, F7 and F87 were not different in vitro. (D‐F) Microscopic morphology of YTN16, F7, and F87 showed no difference in vitro. (G‐I) F7 and F87 do not form s.c. tumors. (J‐L) F7 and F87 formed very small foci of peritoneal dissemination in 2 out of 5 mice. YTN16 formed large nodules in 5 out of 5 mice in the same period. (M‐O) YTN16 formed large nodules of peritoneal dissemination. F7 and F87 formed only very small peritoneally disseminated tumors in macroscopically positive mice only. Arrows: small peritoneally disseminated tumor
Mice with YTN16 s.c. transplanted or peritoneally transplanted mice were treated for 3 weeks with BLU9931, a potent, selective, and irreversible FGFR4 inhibitor. Growth of s.c. tumor in BLU9931‐treated mice was slightly blunted compared to non‐treated mice (Figure 7A,B). However, the growth of peritoneal dissemination was remarkably different. Only very small spots of peritoneal dissemination were detected macroscopically and microscopically in BLU9931‐treated mice (Figure 7C,D,E,G). Surprisingly, the histology of s.c. tumor after BLU9931 treatment was remarkably different from that of the original tumor, even though the difference in growth rate was small (Figure 7F,H). YTN16 tumor formed glands, whereas BLU9931‐treated YTN16 tumor formed few glands in all 3 transplanted mice. After activation of FGFR, signaling of Stat3, Erk, and Akt is known to be activated downstream.3 We immunohistochemically stained BLU9931‐treated and non‐treated s.c. tumor for pStat3, pErk, and pAkt. Staining for all 3 markers was weaker in BLU9931‐treated tumor compared to the original YTN16 tumor. pErk in non‐treated YTN16 tumor was positive in glandular cells, especially at the invasion front. pAkt was also positive in glands in non‐treated YTN16 throughout, but staining was positive only in the few glands present in BLU9931‐treated tumor (Figure 7I‐N).
Figure 7.
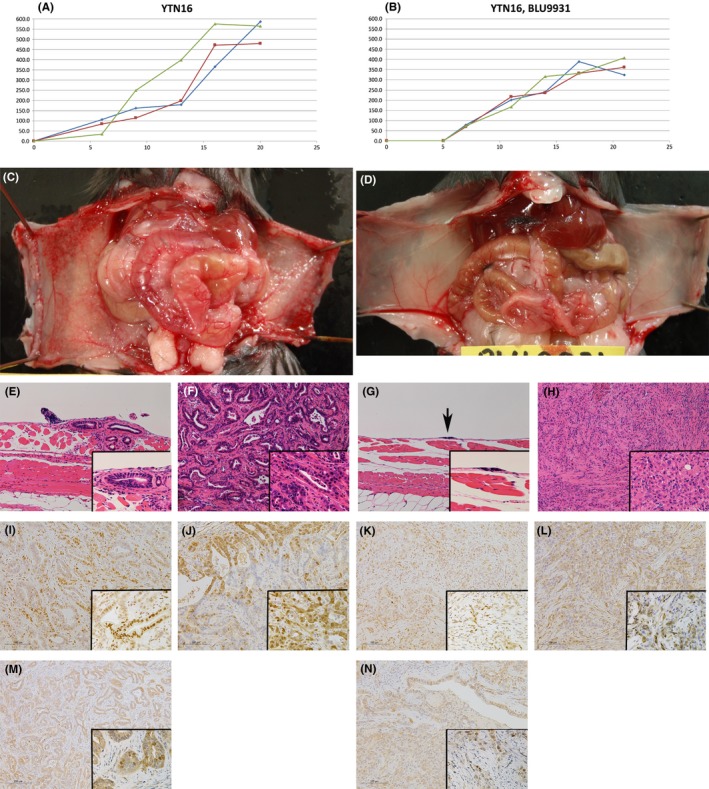
BLU9931 treated YTN16. (A,B) Growth of s.c. transplanted YTN16 was blunted with BLU9931 30 mg/kg b.i.d. treatment. (C,D) Growth of peritoneal dissemination of YTN16 is remarkably inhibited with BLU9931. (E,G) Microscopic appearance of peritoneal dissemination of YTN16 (E) without BLU9931 and (G) with BLU9931 treatment for 3 weeks. (F,H) Microscopic features of s.c. tumor of YTN16 (F) without BLU9931 and (H) with BLU9931 treatment for 3 weeks. YTN16 tumor under treatment with BLU9931 does not form glandular structures. (I,K) pSTAT3, (J,L) pERK, (M,N) pAKT expression in s.c. tumor of YTN16 treated (I,J,M) without or (K,L,N) with BLU9931 treatment. Expression of all 3 markers was weaker in BLU9931‐treated tumor compared to the original YTN16 tumor. (J) pErk was positive in glandular cells in the invasion front in non‐treated YTN16 tumor. (M) pAkt was positive in glands in non‐treated YTN16 throughout, and was (N) weakly positive in the few glands present in BLU9931‐treated tumor. (E‐N) Insets show high magnification
4. DISCUSSION
In the present study, we established C57BL/6 mouse transplantable gastric cancer cell lines, which could metastasize and establish peritoneal dissemination. There are several malignant cell lines that can be transplanted to immunocompetent mice, for example, B16 melanoma.11, 12 However, to our knowledge, these are the first mouse gastric cancer lines that can be transplanted and metastasize in C57BL/6 mice. Many transgenic or knockout mice are on the C57BL/6 background and we think these cell lines are useful for analyzing the function of many genes for cancer progression and inhibition. Importantly, as the development of immunotherapies is a major focus today, this immunocompetent mouse cancer model would be useful for analyzing candidate immunotherapies. Furthermore, immunocheckpoint blockade therapies, for example, anti‐PD‐1 antibody, is now under study for gastric cancer treatment.13 However, its efficacy is not sufficient on its own, and combination with chemotherapy or other molecular targeted therapy is under development. For preclinical evaluation of combination therapies, these cell lines will be important.
Previously, part of our research group developed mouse gastric cancer cell lines with MNU treatment of C57BL/6 mice.2 These cells can be cultured in vitro; however, they cannot make tumors with transplantation. In the present experiment, although we tried to establish 12 gastric cancers in mice, only 1 tumor from a p53 heterozygous knockout mouse could be cultured. The subcloned cells from the tumor after transplantation eventually lost p53, likely through LOH. This may be the key for successful establishment of these gastric cancer cell lines.
The 4 cell lines maintained similar overall gene expression, as they are derived from a common gastric cancer. However, they did show different gene expressions in multiple analyzed pathways including for apoptosis, cell cycle regulation, signal transduction, cytokine response, metabolism, and hypoxia response. The most altered transcript in YTN16 versus YTN2 was Klhl13, part of the E3 ubiquitin‐protein ligase complex, and the second largest difference was observed for Clic6, a member of the chloride intracellular channel family of proteins. We chose to study in greater detail FGFR4, a member of the FGFR family of receptor tyrosine kinases,3 as receptor tyrosine kinase activation is related to cancer growth stimulation, anti‐apoptosis, migration and invasion. We hypothesized that higher FGFR4 expression in YTN5 and YTN16, compared to YTN2 and YTN3, was related to YTN5 and YTN16 virulence. Disruption of FGFR4 could reduce YTN16 growth and peritoneal dissemination rates. This disruption by frame shift may have resulted in carboxyl‐terminal neoantigens with unnatural amino acid structures and, at the present time, we cannot rule out immuno‐reactions that may have caused growth retardation of the transplanted tumor. However, the stop codon was derived from frame shifts in exon 3 in both F7 and F87 cell lines, and the newly induced carboxyl‐terminal amino acid sequences were short (47 amino acids for F7, and 7 amino acids for F87). To confirm the effect of FGFR4 disruption, BLU9931 was used for FGFR4 inhibition. FGFR4‐specific inhibitor BLU9931 also could reduce peritoneal dissemination rates. These results suggest that FGFR4 in YTN16 is an important factor for tumor growth and peritoneal dissemination.
BLU9931 is a newly developed irreversible small‐molecule inhibitor of FGFR4.14 BLU9931 makes a covalent bond with Cys552 within the ATP‐binding pocket of FRFR4, which is not present in FGFR1‐3. The IC50 of BLU9931 for FGFR4 is 3 nmol/L, compared to 591 nmol/L for FGFR1, 493 nmol/L for FGFR2, and 150 nmol/L for FGFR3. Thus, BLU9931 is a highly selective inhibitor for FGFR4. In a previous report, BLU9931 was effective against LIXC012 cells, a hepatocellular carcinoma cell line, in xenografted nu/nu mice dose dependently from 10 mg/kg b.i.d. to 300 mg/kg b.i.d.14 In this experiment, 30 mg/kg b.i.d., a relatively low dosage, was given, with significant effects, especially for peritoneal dissemination. Higher dosage, for example 300 mg/kg b.i.d., has the possibility of promoting regression.
FGFR4 has been identified as mutated and constitutively active in 7% of embryonic rhabdomyosarcomas with correlation to tumor aggression.15, 16, 17 FGFR4 activation is also reported in subgroups of hepatocellular carcinoma (HCC),18 colon cancer,19, 20 pancreatic cancer,21 and breast cancer patients.22 The relationship between FGFR4 expression in human gastric cancer and worse prognosis for patients is shown in several reports.7, 8, 9, 10 In particular, negative expression of p21 in an FGFR4 high‐expression group of gastric cancer patients is associated with worse prognosis.7 In YTN cell lines, p53 was eventually lost and this may have caused augmented virulence with FGFR4 overexpression. FGFR4 is the only FGFR member among FGFR1‐4 for which knockout is not embryonic lethal.3 For this reason, FGFR4 inhibition for cancer therapy may be effective for the FGFR4 high‐expressing subset of cancer patients, without causing grave side‐effects.
Peritoneal dissemination is one of the virulent courses of gastric cancer progression and it significantly reduces patient quality of life. FGFR4 disruption or BLU9931 treatment did not affect the growth of YTN16 cells in vitro. However, BLU9931 reduced peritoneal dissemination establishment and growth of YTN16. In this experiment, the blockade of FGFR4 affected peritoneal dissemination most prominently, followed by submucosal tumor growth. These findings suggest that the same therapy may affect the sites of tumor dissemination differently. FGFR4 blocking therapy may be most effective against peritoneal dissemination.
Activation of downstream targets of FGFR4, STAT3, Erk, and Akt was analyzed for BLU9931‐treated s.c. YTN16 tumors. Sizes of the tumors with and without BLU9931treatment were not so remarkable but, surprisingly, their microscopic features were different. YTN16 tumor treated with BLU9931 did not form gland‐like structures. However, the Fgfr4 disrupted cell lines form tumor glands in peritoneal dissemination. It is possible that the phenotypes of BLU9931 treatments are not solely attributable to Fgfr4. Staining of pSTAT3, pErk, and pAkt all appeared weaker in BLU9931‐treated tumor, and all the activation was downregulated by FGFR4 blockade. Among them, pErk was positive in the glandular structures of the invasive front in the YTN16 tumor without treatment of BLU9931. pAkt was positive in all the cells of the glandular structure of the YTN16 tumor without treatment of BLU9931 and even in BLU9931‐treated tumor where glandular structures were present. These results suggest that pErk and pAkt activation is related to the formation of glandular structures, as well as tumor growth.
In conclusion, we have successfully developed transplantable C57BL/6 mouse gastric cancer cell lines. Identification of the efficacy of FGFR4 blockade is a pertinent example of how these mouse cancer lines can be used for analyzing the effectiveness of cancer therapy.
Limitations of the present study are that analyzed biological effects are for one cell line only. Human gastric cancer is different tumor to tumor, and heterogeneity often evolves within any given tumor.
CONFLICTS OF INTEREST
Authors declare no conflicts of interest for this article.
Supporting information
ACKNOWLEDGMENTS
We thank Ms Miki Furuya and Ms Harumi Yamamura for their technical assistance.
Yamamoto M, Nomura S, Hosoi A, et al. Established gastric cancer cell lines transplantable into C57BL/6 mice show fibroblast growth factor receptor 4 promotion of tumor growth. Cancer Sci. 2018;109:1480–1492. https://doi.org/10.1111/cas.13569
Masami Yamamoto and Sachiyo Nomura contributed equally to this work.
REFERENCES
- 1. Ferlay J, Soerjomataram I, Dikshit R, et al. Cancer incidence and mortality worldwide: sources, methods and major patterns in GLOBOCAN 2012. Int J Cancer. 2015;136:E359‐E386. [DOI] [PubMed] [Google Scholar]
- 2. Ichinose M, Nakanishi H, Fujino S, Tatematsu M. Establishment and characterization of two cell lines from N‐methyl‐N‐nitrosourea‐induced mouse glandular stomach carcinomas. Jpn J Cancer Res. 1998;89:516‐524. [DOI] [PMC free article] [PubMed] [Google Scholar]
- 3. Heinzle C, Erdem Z, Paur J, et al. Is fibroblast growth factor receptor 4 a suitable target of cancer therapy? Curr Pharm Des. 2014;20:2881‐2898. [DOI] [PMC free article] [PubMed] [Google Scholar]
- 4. Donehower LA. The p53‐deficient mouse: a model for basic and applied cancer studies. Semin Cancer Biol. 1996;7:269‐278. [DOI] [PubMed] [Google Scholar]
- 5. Yamamoto M, Tsukamoto T, Sakai H, et al. p53 knockout mice (‐/‐) are more susceptible than (+/‐) or (+/+) mice to N‐methyl‐N‐nitrosourea stomach carcinogenesis. Carcinogenesis. 2000;21:1891‐1897. [DOI] [PubMed] [Google Scholar]
- 6. Yamamoto M, Furihata C, Fujimitsu Y, et al. Dose‐dependent induction of both pepsinogen‐altered pyloric glands and adenocarcinomas in the glandular stomach of C3H mice treated with N‐methyl‐N‐nitrosourea. Jpn J Cancer Res. 1997;88:238‐244. [DOI] [PMC free article] [PubMed] [Google Scholar]
- 7. Ye YW, Zhang X, Zhou Y, et al. The correlations between the expression of FGFR4 protein and clinicopathological parameters as well as prognosis of gastric cancer patients. J Surg Oncol. 2012;106:872‐879. [DOI] [PubMed] [Google Scholar]
- 8. Murase H, Inokuchi M, Takagi Y, Kato K, Kojima K, Sugihara K. Prognostic significance of the co‐overexpression of fibroblast growth factor receptors 1, 2 and 4 in gastric cancer. Mol Clin Oncol. 2014;2:509‐517. [DOI] [PMC free article] [PubMed] [Google Scholar]
- 9. Chen H, Shen DP, Zhang ZZ, Liu JH, Shen YY, Ni XZ. Fibroblast growth factor receptor 4 protein expression and clinicopathological features in gastric cancer. World J Gastroenterol. 2015;21:1838‐1844. [DOI] [PMC free article] [PubMed] [Google Scholar]
- 10. Ye Y, Jiang D, Li J, et al. Silencing of FGFR4 could influence the biological features of gastric cancer cells and its therapeutic value in gastric cancer. Tumour Biol. 2016;37:3185‐3195. [DOI] [PubMed] [Google Scholar]
- 11. Bertalanffy FD, McAskill C. Rate of cell division of malignant mouse Melanoma B16. J Natl Cancer Inst. 1964;32:535‐544. [PubMed] [Google Scholar]
- 12. Joliat MJ, Umeda S, Lyons BL, Lynes MA, Shultz LD. Establishment and characterization of a new osteogenic cell line (MOS‐J) from a spontaneous C57BL/6J mouse osteosarcoma. In Vivo. 2002;16:223‐228. [PubMed] [Google Scholar]
- 13. Kang YK, Boku N, Satoh T, et al. Nivolumab in patients with advanced gastric or gastro‐oesophageal junction cancer refractory to, or intolerant of, at least two previous chemotherapy regimens (ONO‐4538‐12, ATTRACTION‐2): a randomised, double‐blind, placebo‐controlled, phase 3 trial. Lancet. 2017;390:2461‐2471. [DOI] [PubMed] [Google Scholar]
- 14. Hagel M, Miduturu C, Sheets M, et al. First selective small molecule inhibitor of FGFR4 for the treatment of hepatocellular carcinomas with an activated FGFR4 signaling pathway. Cancer Discov. 2015;5:424‐437. [DOI] [PubMed] [Google Scholar]
- 15. Taylor JG, Cheuk AT, Tsang PS, et al. Identification of FGFR4‐activating mutations in human rhabdomyosarcomas that promote metastasis in xenotransplanted models. J Clin Invest. 2009;119:3395‐3407. [DOI] [PMC free article] [PubMed] [Google Scholar]
- 16. Greenman C, Stephens P, Smith R, et al. Patterns of somatic mutation in human cancer genomes. Nature. 2007;446:153‐158. [DOI] [PMC free article] [PubMed] [Google Scholar]
- 17. Shukla N, Ameur N, Yilmaz I, et al. Oncogene mutation profiling of pediatric solid tumors reveals significant subsets of embryonal rhabdomyosarcoma and neuroblastoma with mutated genes in growth signaling pathways. Clin Cancer Res. 2012;18:748‐757. [DOI] [PMC free article] [PubMed] [Google Scholar]
- 18. Ho HK, Pok S, Streit S, et al. Fibroblast growth factor receptor 4 regulates proliferation, anti‐apoptosis and alpha‐fetoprotein secretion during hepatocellular carcinoma progression and represents a potential target for therapeutic intervention. J Hepatol. 2009;50:118‐127. [DOI] [PubMed] [Google Scholar]
- 19. Pai R, Dunlap D, Qing J, Mohtashemi I, Hotzel K, French DM. Inhibition of fibroblast growth factor 19 reduces tumor growth by modulating beta‐catenin signaling. Cancer Res. 2008;68:5086‐5095. [DOI] [PubMed] [Google Scholar]
- 20. Heinzle C, Gsur A, Hunjadi M, et al. Differential effects of polymorphic alleles of FGF receptor 4 on colon cancer growth and metastasis. Cancer Res. 2012;72:5767‐5777. [DOI] [PMC free article] [PubMed] [Google Scholar]
- 21. Motoda N, Matsuda Y, Onda M, Ishiwata T, Uchida E, Naito Z. Overexpression of fibroblast growth factor receptor 4 in high‐grade pancreatic intraepithelial neoplasia and pancreatic ductal adenocarcinoma. Int J Oncol. 2011;38:133‐143. [PubMed] [Google Scholar]
- 22. Jaakkola S, Salmikangas P, Nylund S, et al. Amplification of fgfr4 gene in human breast and gynecological cancers. Int J Cancer. 1993;54:378‐382. [DOI] [PubMed] [Google Scholar]
Associated Data
This section collects any data citations, data availability statements, or supplementary materials included in this article.
Supplementary Materials


