

Summary
The advent of mass cytometry increased the number of parameters measured at the single-cell level while decreasing the extent of crosstalk between channels relative to dye-based flow cytometry. Although reduced, spillover still exists in mass cytometry data, and minimizing its effect requires considerable expert knowledge and substantial experimental effort. Here, we describe a novel bead-based compensation workflow and R-based software that estimates and corrects for interference between channels. We performed an in-depth characterization of the spillover properties in mass cytometry, including limitations defined by the linear range of the mass cytometer and the reproducibility of the spillover over time and across machines. We demonstrated the utility of our method in suspension and imaging mass cytometry. To conclude, our approach greatly simplifies the development of new antibody panels, increases flexibility for antibody-metal pairing, opens the way to using less pure isotopes, and improves overall data quality, thereby reducing the risk of reporting cell phenotype artifacts.
Keywords: mass cytometry, spillover, compensation, imaging mass cytometry, channel interference, CyTOF, signal crosstalk
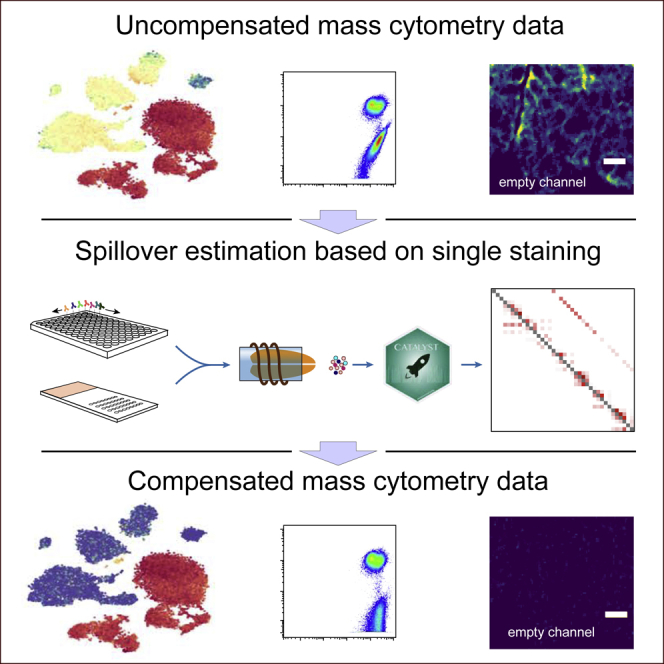
Graphical Abstract
Highlights
-
•
Signal spillover can impact quality of mass cytometry data
-
•
Spillover can be corrected by compensation throughout the linear range of the CyTOF
-
•
Compensation enables signal correction and data structure preservation
-
•
CATALYST is a new R package and a web tool to estimate and correct for spillover
Signal spillover exists in mass cytometry and complicates the development of antibody panels and the interpretation of the data. Here, we characterize this spillover and its effects on the data. Further, we present an approach to estimate and correct for it, which was implemented in a newly developed R package called CATALYST. We show how this method can be used to correct for channel crosstalk in suspension and imaging mass cytometry data throughout the linear range of the instrument.
Introduction
High-dimensional, single-cell flow cytometry has been broadly adopted by researchers and clinicians to analyze complex biological samples (Behbehani et al., 2012, Chevrier et al., 2017, Levine et al., 2015, Perfetto et al., 2004). Fluorescence-activated cell sorting (FACS) has dominated this field for decades, and, with the constant improvement of probes and laser systems, 18-color FACS experiments are now routine, and 30-color cytometers have recently become commercially available (Chattopadhyay and Roederer, 2012). Due to the overlapping excitation and emission spectra of the fluorescent dyes, signals are measured not only in the primary channel, but also in neighboring channels. This spillover is correlated with the original signal in an approximately linear manner and can be corrected via a process called compensation (Bagwell and Adams, 1993). As the number of parameters measured increases, however, it becomes more difficult to optimize artifact-free staining panels, mostly due to the spreading error affecting channels to different extents upon compensation, which complicates the detection of proteins of low abundance (Chattopadhyay and Roederer, 2012).
Mass cytometry, which uses metal isotopes as reporter to label antibodies, allows analysis of at least 40 parameters simultaneously (Bandura et al., 2009, Bendall et al., 2011, Chattopadhyay and Roederer, 2015). This technology has recently been exploited for imaging by coupling a laser ablation system to a mass cytometer (Bodenmiller, 2016, Giesen et al., 2014, Angelo et al., 2014). Imaging mass cytometry (IMC) enables the analysis of tissue sections stained with metal-tagged antibodies to generate highly multiplexed images at subcellular resolution (Bodenmiller, 2016, Giesen et al., 2014).
Although the amount of spillover observed in mass cytometry is generally small, spillover can considerably complicate interpretation of data and potentially lead to false conclusions. For example, signal crosstalk can result in incorrect identification of cells as expressing an intermediate level of a marker (Takahashi et al., 2016). In experiments conducted to date, the effects of spillover have been minimized by selecting only highly pure isotopes and by carefully designing antibody panels to optimize the signal to background ratio in each channel (Takahashi et al., 2016). Generating a low crosstalk antibody panel is complex and time consuming, however. It requires that the approximate antigen abundance is known for each marker used in the panel, which is not possible in many types of experiments. Further, with a purely experimental approach to avoid spillover, antibody-isotope conjugates are not easily transferable between panels. As spillover is proportional to the originating signal, it can be reduced by decreasing antibody concentrations, but this also reduces the signal-to-noise ratio, which limits its application. In practice, the above-mentioned strategies are not sufficient to completely prevent crosstalk between channels as shown in a recent study in which data from spillover-affected channels were excluded to avoid potentially misleading conclusions (Lun et al., 2017). Spillover-related issues have not yet been reported in IMC, but since the source and the measurement of metal signal in suspension mass cytometry and IMC are identical, both systems are expected to be affected in a similar manner.
Here we present a comprehensive workflow to estimate and systematically correct for signal spillover across all the channels used in a given mass cytometry experiment. Polystyrene capture beads were single stained with each antibody used in the experiment. To increase the throughput, the beads were then pooled and analyzed simultaneously in the mass cytometer. Mixing is critical to efficiency as it allows assessment of spillover in channels within minutes. The CATALYST R/Bioconductor package and an interactive Shiny-based web application were developed to accurately deconvolute the different bead populations, estimate spillover signal in all channels, and compensate the data. We demonstrate the utility of the approach in correction of signal interference in suspension mass cytometry and IMC experiments. Our approach will greatly facilitate the development of antibody panels, increase the flexibility of antibody-metal pairing, increase the number of usable isotopes, and enable generation of high-quality data devoid of spillover artifacts on samples with unknown and likely variable levels of antigen.
Results
Mass Cytometry Spillover Is Linear and Can Be Corrected Using Compensation
Fluorescent flow cytometry is affected by signal interference between channels. Since spillover signal is a defined fraction of the source signal, it can be corrected mathematically (Bagwell and Adams, 1993, Loken et al., 1977). In mass cytometry, the interference between channels is reduced but is still present due to instrument properties (abundance sensitivity), isotopic impurities, and oxidation (Figure 1A). To determine whether channel crosstalk observed in mass cytometry can be corrected in a manner similar to the one used for flow cytometry, we first determined whether the crosstalk in mass cytometry experiments is linear. We stained peripheral blood mononuclear cells (PBMCs) with anti-CD44 conjugated to 143Nd using antibody concentrations ranging from 0.01 to 1 μg/mL (Figure 1B). As expected, signal was observed in other mass channels including −1 (142Nd), +1 (144Nd), +2 (145Nd), +3 (146Nd), and +16 (due to the oxidation product 143Nd16O measured in 159Tb). The signal in the source and in the spillover channels could be fit by a linear model with a coefficient of determination (R2) greater than 0.99 in all cases (Figure 1C, left panels). Moreover, we showed that a signal over 200 counts was sufficient to provide an accurate estimate for spillover as low as 1%, calculated as the ratio of the spillover signal to the main signal for each concentration (Figure 1C, right panels).
Figure 1.

Properties of Mass Cytometry Spillover and Description of a Single-Stained Bead-Based Compensation Workflow
(A) Schematic view of sources of signal interference that affect mass cytometry.
(B) Histogram showing signal intensity upon staining of PBMCs with the indicated concentrations of anti-CD44 antibody.
(C) The panels on the left display, as scatterplots, the median intensities of signals obtained in the main channel (143Nd) and spillover-affected channels for PBMCs stained with anti-CD44 antibody. Linear models are shown as blue lines. For each relationship, the coefficient of determination is indicated. The panels on the right display the spillover percentage calculated for each concentration. The blue lines indicate the spillover as assessed based on the highest antibody concentration.
(D) Scatterplots showing the signals of the anti-CD44 antibody in the main channel and in the spillover-affected channels before compensation (left column), after compensation with the conventional fluorescent flow cytometry approach (middle column), and after compensation with the NNLS method (right column). The green box shows how the NNLS compensation better preserves the data structure of a channel unaffected by spillover (blue box) than standard flow cytometry compensation does (orange box).
(E) Depiction of the workflow used to correct for spillover. Staining of control antibody-capture beads and samples are performed in parallel. Single-stained beads are pooled, and mass cytometry data are acquired on the beads and the samples. The CATALYST R package enables identification of the single-positive bead populations, calculates the compensation matrix, and applies the matrix to correction of sample data for spillover.
Applying these spillover coefficients on the single-stained cells removed the spillover (Figure 1D, middle panels). However, this strategy substantially modified the structure of the data by introducing artificial negative values (Figure 1D, compare orange and blue boxes), which specifically influenced channels strongly affected by spillover. Negative ion counts are not present in uncompensated mass cytometry data, and, more importantly, data with negative values require different treatment than strictly non-negative abundance data. A recent study aimed at unmixing signals in multispectral fluorescent flow cytometry made similar observations and suggested use of approaches that specifically incorporate a non-negativity constraint such as the non-negative least-squares (NNLS) approach (Novo et al., 2014). This method calculates the optimal non-negative solution for the compensation problem using the least-squares criterion. Applied to our data, the NNLS approach removed the spillover without changing the data structure, making empty but spillover-affected channels look similar to empty channels not affected by spillover (Figure 1D, compare green and blue boxes). Taken together, our data show that spillover in mass cytometry is linear and can be corrected while preserving the data structure using the NNLS approach.
Systematic Correction of Spillover in Mass Cytometry
Inspired by methods used in flow cytometry, in which controls stained with single antibodies are used to estimate signal crosstalk, we developed an approach to systematically correct for signal interference in mass cytometry experiments. A 36-antibody panel was designed to detect the main immune cell populations in PBMCs (Table S1). This panel was not optimized to avoid spillover effects and contained identical antibodies in different mass channels to facilitate the identification of spillover artifacts. In parallel to multiplexed sample staining, control samples stained with individual antibodies were generated by staining polystyrene antibody-capture beads (Figure 1E). After staining, beads were pooled and run as a single sample in the mass cytometer.
To apply our approach for semi-automatic spillover correction in mass cytometry, we created an R/Bioconductor package, CATALYST, and a web application (Figures S1A and S1B). In the first step, the FCS file containing data on the bead sample is deconvoluted to identify the individual single-antibody-positive bead populations using a new R implementation of the debarcoding algorithm from Zunder et al. (2015). Each bead is assigned to a specific population based on the dominant signal, and the purity of the bead populations is further increased by automatically applying estimated sample-specific cutoffs (Figure S1C). Upon debarcoding, the purity of the bead populations was assessed to ensure that no beads had been wrongly assigned and that no antibody exchange had occurred during the bead mixing, which could influence the spillover estimate (Figure S2A). In a second step, the spillover matrix is calculated based on the spillover observed for single-stained populations. Due to the mass cytometry data structure, characterized by an absence of negative values and a low background, we observed that spillover estimation was more accurate when the spillover was assessed at the single-bead level rather than at the bead-population level (Figures S2B–S2D; see the STAR Methods for details). By default, the method only takes into account interference between channels expected to interact based on abundance sensitivity, metal impurity, and oxidation (Figures S2E and S2F), but also allows the user to check for unexpected spillover. In a final step, the compensation matrix from the solved linear system (NNLS or “classical”) is applied to the bead and cell samples to remove interfering signal. This workflow provides a fully integrated and easy to use experimental and computational solution for compensation of mass cytometry spillover.
Cellular Metal Load Influences Signal Spillover
The spillover matrix generated by our bead approach revealed that the total amount of spillover originating from a single channel ranged from 0% for 165Ho to over 8% for 148Nd, oxidation ranged from 0% to 2%, and spillover due to mixed effects of impurity and abundance sensitivity may reach 4% (Figure 2A). Signal interference due to abundance sensitivity alone was virtually absent on the machine used. To assess the stability of the spillover matrix over time and instruments, we collected data on single-stained beads on different mass cytometers over months (Figure S3). Although the spillover matrix was stable over months, our results showed that for optimal compensation the spillover matrix should be acquired simultaneously with the sample of interest.
Figure 2.

Spillover Estimation and Current Limitations of Compensation due to Saturation Effects
(A) Spillover matrix calculated based on single-stained beads. Values on the diagonals are 1. By default, spillover is calculated only in potentially affected channels, which include M±1, those corresponding to known isotopic impurities, and M+16 (Figure S2D). Numbers in the cells indicate percentages of spillover by channels in rows into channels in columns. Numbers in the last column show the total amount of signal received in the corresponding channels.
(B) Scatterplots showing signal due to anti-HLA-ABC labeled with 172Yb and anti-CD3 labeled with 173Yb from pooled single-stained beads and multiplexed-stained PBMCs before and after compensation with standard flow cytometry methods (middle) and NNLS (bottom).
(C) Dot plots showing the median counts in each channel potentially affected by spillover for uncompensated data, compensated data, and NNLS-compensated data obtained upon analyses of single-stained beads and multiplexed-stained PBMCs. For multiplexed-staining, cells were stained with two panels where half of the channels were left empty, see (Table S1) to enable spillover assessment in absence of staining. For each dataset, the average sum of squares is shown on top of the graph.
(D) Dot plots showing the spillover in percent for the indicated relationships assessed on cells stained with increasing amount of barcoding reagents and identical antibody concentration. A linear model was fit to each relationship (blue lines), and the slope is indicated above each plot.
(E) Dot plots showing the spillover in absolute counts for the indicated relationships assessed on cells stained with increasing amount of barcoding reagents and identical antibody concentration.
(F) Scatter plot showing the relationship between the original signal and the most affected spillover channel for the indicated antibody-metal pairs on a linear scale. The dotted line and the red line show how the linear relationship is lost above 5,000 dual counts.
As expected, the application of the spillover matrix to beads stained with individual antibodies revealed virtually perfect compensation using both traditional and NNLS approaches (Figures 2B and 2C). When this matrix was applied to the multiplexed-stained cell samples, the spillover was also corrected for, but traditional compensation systematically overcompensated the data (Figures 2B and 2C). One possible explanation for the difference observed in spillover between single-stained beads and multiplexed-stained cells might be the difference in total ion load, with high loads leading to detector saturation effects. Indeed, we found that an increased amount of barcoding, simulating higher ion loads, was associated with a progressive decrease of spillover, both in terms of percentage and absolute count (Figures 2D and 2E). For spillover below two counts, the signal interference was completely abolished (Figure 2E). Moreover, above 5,000 dual counts in a given channel, the linear relationship was progressively lost (Figure 2F). Together, this set of data revealed some limitations of spillover correction due to the physical properties of mass cytometry measurement and showed that maintaining the signal within the linear range of the instrument and using the NNLS compensation addresses these issues.
Compensation Corrects for Spillover-Mediated Artifacts in Mass Cytometry
Analyzing the PBMCs stained with the 36-antibody panel using the dimensionality reduction algorithm t-SNE (Amir et al., 2013, van der Maaten and Hinton, 2008) enabled us to identify the main immune cell populations based on individual marker expression (Figure S4A). The proteins CD3, CD8, and HLA-DR were each detected with antibodies conjugated to two different metal labels. In uncompensated data, we observed different signal profiles that depended on the metal isotope used to label the antibody (Figure 3A, left panel). After compensation, the signals observed for the same antibodies conjugated with different metal isotopes were virtually identical (Figures 3A, right panel and S4B). This was further demonstrated by displaying the same relationships on scatterplots, which highlighted how compensation simultaneously removed artefactual signal and reconstituted the data structure observed in channel stained with the same antibody but not affected by spillover (Figure 3B). Thus, compensation removes artifacts and therefore prevents data misinterpretation.
Figure 3.

Correction of Spillover Artifacts in Mass Cytometry Data Using Compensation
(A) t-SNE map displaying data on a subset of 20,000 PBMCs analyzed with our 36-antibody panel and colored by marker expression for three pairs of antibodies labeled with two different metal isotopes before (left) and after (right) spillover correction based on NNLS compensation. The percentages of spillover affecting each channel in the uncompensated dataset are indicated.
(B) Scatterplots showing the relationships between the channels displayed in (A) and the channels responsible for most of the spillover before and after compensation. The same relationship is shown for the same antibody in channels not affected by spillover.
(C) Heatmaps showing the expression of the indicated markers in the different clusters before compensation (upper panel) and after NNLS compensation (lower panel). Dashed boxes highlight regions in the plot that changed upon compensation.
(D) Plots showing the frequency of significant correlations (Spearman, p < 0.005) between markers for each cluster containing more than 200 cells. Frequency was set to 1 for the uncompensated values.
(E) Correlation heatmap across all markers for cluster 12 before (upper panel) and after NNLS compensation (lower panel). The clustering is based on uncompensated data.
Applying the PhenoGraph clustering algorithm (Levine et al., 2015) to our dataset led to the identification of 20 PBMC subsets (Figure S4C). Comparison of heatmaps of signals in uncompensated versus compensated data highlighted how marker expression signatures of the different clusters can be misinterpreted without spillover correction (Figure 3C). Lack of compensation caused several clusters to be wrongly identified as having intermediate abundances of certain antigens even though the signal was actually due to channel crosstalk. In particular, an intermediate level of CD3-173Yb was observed on all the non-T cell subsets (Figure 3C). Further, most T cell and natural killer cell subsets were wrongly identified as expressing intermediate levels of HLA-DR-171Yb. Artifacts caused by crosstalk were particularly strong in channels 154, 158, 161, 163, 168, 171, 173, and 174.
Characterization of newly identified clusters or signaling network inference often involves the systematic correlation analysis of markers at the single-cell level to identify co-regulated proteins or genes, and this approach can be strongly affected by channel interference. Analysis of marker correlations within each cluster before and after compensation systematically reduced spurious correlations (Figures 3D and 3E). A systematic analysis over all the clusters showed that, in our dataset, between 25% and 45% of the significant marker correlations within clusters were actually due to spillover (Figures 3D and 3E, Spearman correlation, p < 0.005). Collectively, this set of analyses showed that spillover can be responsible for various artifacts, which were removed with our compensation approach.
Spillover Observed in IMC Can Be Corrected Using a Similar Compensation Approach
In IMC, tissue stained with metal-tagged antibodies is ablated with a laser, and the tissue aerosol is analyzed in a mass cytometer (Giesen et al., 2014). Images generated with the IMC system provide subcellular resolution and are high dimensional; information has been collected from 32 different channels (Bodenmiller, 2016, Giesen et al., 2014). To determine how signal interference affects IMC measurements, metal isotopes were arrayed on a slide and measured by IMC. Using this approach, we demonstrated that a linear relationship exists between the original signal and the interfering signals (Figure 4A). This indicated that spillover in IMC could be corrected using the bead-based compensation approach applied to suspension mass cytometry. We used the CATALYST package to calculate a spillover matrix based on the pixel values of the individually spotted heavy metals (Figure S5A). Comparing individual spillover values obtained in suspension and IMC, we found that spillover due to abundance sensitivity and impurities were in the same range for all metals except for 148Nd and 176Yb, which came from different isotope batches for the IMC experiment than those used for the suspension analysis (Figures S5B–S5D). Values observed for oxidation in the M+16 channel were systematically lower in IMC than in suspension mass cytometry. This was expected given that the tissue aerosol is transported in an argon and helium gas stream and no water is used for sample introduction, thus much less oxygen is present in the plasma of the mass cytometer to generate oxides (Figure S5E).
Figure 4.

Spillover Affects IMC Data and Can Be Corrected Using Our Compensation Strategy
(A) Binning the signals of an imaged 166Er metal spot (to the 95th percentile of the 166Er pixel values) into 20 bins with equal pixel numbers shows a linear relationship between 166Er and 167Er over several orders of magnitude (upper panel). The relationship between 166Er and 168Er appears linear but saturates at the higher counts (lower panel).
(B) Representative image section of a breast cancer tissue sample imaged by IMC. Top row shows uncompensated images of 166Er (used to label antibody to carbonic anhydrase), 167Er (no antibody labeled with this metal), and 168Er (used to label anti-KI67). The bottom row shows corresponding NNLS compensated images. For visualization, a 3 × 3 pixel median filter was used to reduce noise. Scale bars, 20 μm. Red arrows indicate part of the image where low signal was removed by compensation.
(C) Segmentation mask shown on representative images described in (B). The mean pixel intensities of the signals observed in the indicated channels per cell are displayed.
(D) Scatterplots from single-cell segmentation data from the IMC images before (left) and after (right) compensation. Arcsinh transformed ion counts (cofactor of 2) are shown.
Based on this spillover matrix, a breast cancer tissue section imaged by IMC was compensated at the pixel level using a custom written CellProfiler module (Carpenter et al., 2006). This compensation approach specifically removed the low signal due to spillover (Figure 4B). The carbonic anhydrase antibody, which was labeled with 166Er, showed a predominantly membranous signal. No antibodies were labeled with 167Er (the +1 channel) to enable assessment of the spillover. In the uncompensated data, there was a perfect, but lower intensity image of the 166Er channel in the 167Er channel. Thus, without compensation, the channel 167Er is not suitable for detection of a low-level marker. 168Er was used to label an antibody against Ki67, a protein tightly regulated during cell-cycle progression. Even though the spillover from 166Er into 168Er is only estimated to be 0.2%, due to the low background in IMC, the carbonic anhydrase signal was still clearly visible in the Ki67 channel. This could lead to the misinterpretation that Ki67 is localized in the cytoplasm and on the membrane. Upon compensation, the shadow images of the 166Er channel in the 167Er and 168Er channels were removed (Figure 4B).
IMC images are often segmented to identify individual cells in the images enabling single-cell data analysis (Giesen et al., 2014, Schapiro et al., 2017). After segmentation, the single-cell mask mean signal intensities for the channels of interest were calculated using a customized CellProfiler module and subsequently analyzed and compensated in R using the CATALYST package (Figure 4C). A scatterplot of this image clearly shows the spillover artifact and how our compensation approach applied to the single-cell data largely removed it (Figure 4D). Together, this set of data indicates that spillover observed in IMC data can be, and should be, corrected using the compensation approach developed for correction of suspension mass cytometry data.
Discussion
Relative to fluorescence leakage in flow cytometry, channel interference is considerably reduced in mass cytometry, but it is not absent. Two reports have highlighted the challenges posed by spillover to mass cytometry data analysis and interpretation (Lun et al., 2017, Takahashi et al., 2016). Although issues related to channel interference in IMC analyses have not yet been reported, our observations show that imaging and suspension mass cytometry are similarly affected by signal interference between channels. The main issue is the virtually absent background signal in mass cytometry, which enables the reliable detection of signals at low counts (∼10 counts). Given the dynamic range over four orders of magnitude in mass cytometry, even a few percent signal spillover from a high ion count channel into a low ion count channel can easily result in difficulties in data interpretation. Moreover, high-dimensional mass cytometry data are commonly analyzed using unsupervised approaches, which present many advantages but involve a risk of misinterpretation of the data due to such artifacts. Currently, mass cytometry is transitioning from an emerging to a well-established technology, and this step requires the development of common standards and improved data quality assessment. Here, we present a combined experimental and computational approach that can be used both in suspension and IMC to ensure accurate correction of signal spillover.
In this study, we performed a comprehensive analysis of channel interference and showed that spillover is a linear function of the primary signal and therefore can be corrected using signal compensation similarly to flow cytometry. However, we found important differences between flow cytometry and mass cytometry data that prevented a direct transposition of the method used in flow cytometry. First, we found that assessing the spillover coefficient in single-stained beads using summary statistics at the population level tended to overcompensate the single-stained controls. Second, we observed that traditional compensation, by introducing negative values, changed the original structure of the data, characterized by a low background and an absence of negative events. This artifact is not critical in fluorescent flow cytometry data as there are negative values in uncompensated data, but it has important consequences in mass cytometry data, in which negative events do not exist. The presence of physically impossible negative counts also changes the statistical properties of the data, as data can no longer be interpreted as abundances. Although not widely acknowledged, this problem has been already addressed in flow cytometry compensation methods used in multiparametric data analysis (Novo et al., 2014). Third, we observed that the usage of a compensation matrix based on single-stained beads tended to overcompensate the spillover observed in multiplexed-stained cells, likely due to a detector saturation effect observed at higher ion counts, which more strongly affect low abundance signals than high abundance signals.
Our bead-based compensation workflow, including R-based software and a web tool, will make mass cytometry more reliable and easy to use. In many situations, this approach will avoid artifacts and improve the sensitivity of mass cytometry by increasing the signal-to-noise ratio. It will also open the way to using less pure isotopes, thereby increasing the number of epitopes that can be measured simultaneously. It should be noted that spillover compensation also has some limitations. Although a signal in the range of around 200 counts was sufficient to provide a good estimate of spillover as low as 1%, working with high signal intensities prevents the use of compensation, since the linearity between the main signal and the spillover is progressively lost above 5,000 dual counts. Moreover, since the increasing total ion load on multiplexed stained cells reduces the spillover, the estimate provided by single-stained beads is less accurate for high levels of total ion load, further indicating that the staining level should be kept as low as possible. We note that loss of weak signal due to total ion load as well as signal nonlinearities outside the linear detection range seem to be a general property of CyTOF data, but are particularly noticeable when analyzing a linear effect such as spillover. Finally, as it is the case in fluorescent flow cytometry, compensation in mass cytometry also results in a higher spread of the negative data affected by spillover. Therefore, minimizing spillover by careful design of the antibody panel and working at non-saturating antibody concentration will still be required.
Additional measures could further improve the correction of channel crosstalk in mass cytometry. For long measurements, running compensation beads together with the sample would ensure that any variation occurring over time due to signal drift is captured. Compensation beads could then be used both for spillover compensation and for channel-specific signal drift normalization in each channel independently. To run beads and samples together, it would be advantageous to have a second “bead-identification” channel on the beads to enable reliable detection and exclusion of bead-sample doublets. To facilitate a general use of this method in the mass cytometry community, single metal-coated beads should ideally be made available commercially and provided with each batch of antibody. Using beads directly coated with metal isotopes would mean that antibodies are not needed for non-antibody-based probe measurements.
To conclude, the work presented in this study improves mass cytometry and IMC data quality. The approach simplifies the development of new antibody panels and increases flexibility for antibody-metal pairing. Use of the NNLS-based compensation method will reduce incorrect cell phenotype assignments and will greatly facilitate analysis of complex and poorly characterized tissues such as tumor samples.
STAR★Methods
Key Resources Table
| REAGENT or RESOURCE | SOURCE | IDENTIFIER |
|---|---|---|
| Antibodies | ||
| CD8a (RPA-T8) – purified | Biolegend | Cat# 301002; RRID:AB_314120 |
| CD64 (10.1) – purified | Biolegend | Cat# 305002; RRID:AB_314486 |
| CD23 (EBVCS-5) – purified | Biolegend | Cat# 338502; RRID:AB_1279181 |
| CD68 (Y1/82A) – purified | Biolegend | Cat# 333802; RRID:AB_1089058 |
| CD36 (5-271) – purified | Biolegend | Cat# 336215; RRID:AB_2563745 |
| CD4 (RPA-T4) – purified | Biolegend | Cat# 300502; RRID:AB_314070 |
| CD20 (H1(FB1)) – purified | Becton Dickinson | Cat# 555677; RRID:AB_396030 |
| CD68 (KP1) – purified | Biolegend | Cat# 916104; RRID:AB_2616797 |
| CD20 (L26) – purified | eBioscience | Cat# 14-0202-82; RRID:AB_10734340 |
| CD123 (6H6) – purified | Biolegend | Cat# 306002; RRID:AB_314576 |
| CD11b (M1/70) – purified | Biolegend | Cat# 101202; RRID:AB_312785 |
| CD99 (HCD99) – purified | Biolegend | Cat# 318002; RRID:AB_604112 |
| CD273/PD-L2 (MIH18) – purified | Biolegend | Cat# 345502; RRID:AB_1953319 |
| CXCR4 (12G5) – purified | Biolegend | Cat# 306502; RRID:AB_314608 |
| CD7 (M-T701) – purified | Becton Dickinson | Cat# 555359; RRID:AB_395762 |
| CD32 (FUN-2) – purified | Biolegend | Cat# 303202; RRID:AB_314334 |
| CD16 (3G8) – purified | Biolegend | Cat# 302002; RRID:AB_314202 |
| CD14 (RMO52) – purified | Beckman Coulter | Cat# A22331; RRID:AB_10639528 |
| HLA-ABC (W6/32) – purified | Biolegend | Cat# 311402; RRID:AB_314871 |
| HLA-DR (L243) – purified | Biolegend | Cat# 307602; RRID:AB_314680 |
| CD15 (HI98) – purified | Biolegend | Cat# 301902; RRID:AB_314194 |
| CD3 (UCHT1) – purified | Biolegend | Cat# 300402; RRID:AB_314056 |
| CD45 (HI30) – purified | Biolegend | Cat# 304002; RRID:AB_314390 |
| CD8b (SIDI8BEE) - purified | eBioscience | Cat# 14-5273; RRID:AB_11043400 |
| CD22 (HIB22) - purified | Biolegend | Cat# 302502; RRID:AB_314264 |
| CD66a/c/e (ASL-32) | Biolegend | Cat# 342302; RRID:AB_1626265 |
| CD192 (K036C2) | Biolegend | Cat# 357202; RRID:AB_2561851 |
| CD93 (R139) | eBioscience | Cat# 14-0939-82; RRID:AB_891508 |
| carbonic anhydrase IX (polyclonal) | R&D Systems | Cat# AF2188; RRID:AB_416562 |
| KI67 (8D5) | CST | Cat# 9449BF; RRID:AB_2715512 |
| Biological Samples | ||
| Buffy Coat | Zurich Blood Transfusion Service | N/A |
| Breast cancer tissue sections | University Hospital Zurich - Archives of the Institute of Surgical Pathology | N/A |
| Chemicals, Peptides, and Recombinant Proteins | ||
| Paraformaldehyde | Electron Microscopy Sciences | Cat# 15710 |
| Bromoacetamidobenzyl-EDTA (BABE) | Dojindo Laboratories | Cat# B437-10 |
| Maleimido mono amide DOTA (mDOTA) | Macrocyclics | Cat# B-272 |
| Iridium | Fluidigm | Cat# 201192A |
| Maxpar X8 Multimetal labeling kit | Fluidigm | Cat# 201300 |
| Lanthanide (III) metal isotopes as chloride salts | Fluidigm | N/A |
| FcR Blocking Reagent, human | Miltenyi Biotech | Cat# 130-059-901 |
| Deposited Data | ||
| Mass cytometry data | This paper | https://doi.org/10.17632/v58yj49pfr.1 |
| Imaging mass cytometry data | This paper | https://doi.org/10.17632/v58yj49pfr.1 |
| Software and Algorithms | ||
| FlowJo v10.0.7 | N/A | https://www.flowjo.com/ |
| Cytobank | Kotecha et al., 2010 | https://www.cytobank.org/ |
| Concatenation tool | Cytobank, Inc | https://support.cytobank.org/hc/en-us/articles/206336147-FCS-file-concatenation-tool |
| Normalizer | Finck et al., 2013 | https://github.com/nolanlab/bead-normalization/releases |
| Single cell debarcoder | Zunder et al., 2015 | https://github.com/nolanlab/single-cell-debarcoder |
| t-SNE | van der Maaten and Hinton, 2008 | https://github.com/jkrijthe/Rtsne |
| PhenoGraph | Levine et al., 2015 | https://github.com/jacoblevine/PhenoGraph |
| CATALYST | This paper | http://bioconductor.org/packages/CATALYST |
| Python 3.4.3 | Python Software Foundation. |
www.python.org |
| Ilastik 1.1.19 | Sommer et al., 2011 | www.ilastik.org |
| R 3.3.2 | R Core Team, 2016 | https://www.R-project.org |
| CellProfiler | Kamentsky et al., 2011 | www.cellprofiler.org |
Contact for Reagent and Resource Sharing
Further information and requests for resources and reagents should be directed to and will be fulfilled by the Lead Contact, Bernd Bodenmiller (bernd.bodenmiller@imls.uzh.ch).
Experimental Model and Subject Details
Cell and Tissue Preparation
PBMCs were isolated using histopaque (Sigma Aldrich) density gradient centrifugation of buffy coats from healthy donors obtained from the Zurich Blood Transfusion Service (www.zhbsd.ch). Cells at the interphase were harvested, washed twice in PBS, immediately fixed in 1.6% paraformaldehyde (Electron Microscopy Sciences) for 10 min at room temperature, and stored at -80 °C.
Tissue sections for imaging analyses were obtained from the archives of the Institute of Surgical Pathology of the University Hospital Zurich as Formalin-fixed paraffin-embedded tissue samples. This project was approved by the local Commission of Ethics (ref. no. StV 12-2005).
Method Details
Antibodies and Surface Staining
Provider, clone, and metal tag of each antibody used for suspension mass cytometry analysis are listed in Figure 2A. Antibody conjugations were performed using the MaxPAR antibody conjugation kit (Fluidigm) according to manufacturer’s instruction. After labeling, the concentration of each antibody was assessed using a Nanodrop (Thermo Scientific) and adjusted to 200 μg/mL in Candor Antibody Stabilizer. To determine the optimal concentration for PBMC staining, each conjugated antibody was titrated between 0.25 and 4 μg/mL. All antibodies used in this study were managed using the cloud-based platform AirLab (Catena et al., 2016).
Cell Barcoding
To assess the effect of total metal load on spillover, 0.3-0.8 x 10⁶ cells from each tumor sample were barcoded using a 60-well barcoding scheme consisting of unique combinations of four out of eight barcoding reagents as previously described (Zunder et al., 2015). Six palladium isotopes (102Pd, 104Pd, 105Pd, 106Pd, 108Pd, and 110Pd, Fludigm) were conjugated to bromoacetamidobenzyl-EDTA (BABE) and two indium isotopes (113In and 115In, Fludigm) were conjugated to 1,4,7,10-tetraazacy-clododecane-1,4,7-tris–acetic acid 10-maleimide ethylacetamide (mDOTA) following standard procedures (Zivanovic et al., 2013). For each concentration (20, 40, 80, 160, and 320 mM), cells were stained in triplicate using three random barcodes. Cells were barcoded using the transient partial permeabilization protocol described by Behbehani and colleagues (Behbehani et al., 2014). Upon barcoding, cells were pooled and stained with the antibody mix.
Cell and Bead Staining
Before antibody staining, cells were incubated with FcR blocking reagent (Miltenyi Biotech) for 10 min at 4°C. One million of PBMCs were stained with 100 μl of the antibody mix (Figure 2A) for 30 min at 4°C. Cells were washed twice in cell staining medium (CSM, PBS with 0.5% bovine serum albumin and 0.02% sodium azide) and resuspended in 1 mL of nucleic acid Ir-Intercalator (Fluidigm) in 1.6% PFA/PBS for 1 h at room temperature. Cells were then washed twice in PBS and twice in water. Before acquisition, cells were diluted to 0.5 x 10⁶ cells/mL in water. For bead-based compensation, aliquots of BD Compbead Ig κ beads (BD Biosciences) were stained individually with each of the antibodies used in the panel according to manufacturer’s instructions. Briefly, for each channel assessed in the panel, one full drop of BD Compbead was loaded in a well of a v-bottom 96 well plate and stained with 1 μg of the corresponding metal-labeled antibody. Beads were stained for 15 min at room temperature. After staining, beads were washed three times in CSM and then pooled in a single tube. Beads were then fixed in 1.6% PFA/PBS for 1 h at room temperature. After fixation, beads were washed twice in PBS and twice in water. Before acquisition, beads were resuspended in 500 μL of water. Bead and cell data were acquired on a Helios mass cytometer (Fluidigm) using instrument-based dual-count calibration, noise reduction, and randomization. Cells were selected based on event length between 10 and 75 pushes. When required, exported flow cytometry standard (FCS) files were uploaded into Cytobank, populations of interest were manually gated, and events of interest were exported as new FCS files.
IMC
To assess signal interference in IMC, metal isotopes were diluted to a concentration of 0.05 mM in Trypan Blue and arrayed on an agarose-coated microscopy slide (2% agarose dried on slide). For each individual metal spot, an area of 400 x 5 pixels was ablated at a frequency of 200 Hz using the Hyperion mass cytometry system (Fluidigm). Breast cancer tissue sections (ethic approval: StV 12-2005) were stained with a combination of anti-carbonic anhydrase-166Er (polyclonal, R&D Systems) and anti-KI67-168Er (8D5, CST) as previously described (Schapiro et al., 2017). Upon staining, a region was analyzed by IMC using the Hyperion system (Fluidigm).
Quantification and Statistical Analysis
Single-Cell Deconvolution
In order to identify single-positive populations from beads acquired as a pool, we applied the single-cell deconvolution (SCD) algorithm described in Zunder et al. (Zunder et al., 2015). In brief, events were preliminarily assigned to the sample for which their signal was strongest. Subsequently, doublet events (i.e., events whose separation between the primary channels and second highest signal fell below a threshold value) were excluded. We optionally allowed for i) population-specific separation thresholds and ii) automated estimation of these thresholds. For the estimation of cutoff parameters, we considered yields upon debarcoding as a function of the applied cutoffs. Commonly, this function will be characterized by an initial weak decline, where doublets are excluded, and subsequent rapid decline in yields to zero. In between, low numbers of counts with intermediate barcode separation give rise to a plateau. As shown in Figure S1C, to facilitate robust estimation of an optimal cutoff, we fit a linear and a three-parameter log-logistic function (Finney, 1971) to the yields function:
The goodness of the linear fit relative to the log-logistic fit was weighted as follows:
The cutoffs for both functions were defined as:
The final cutoff estimate c was defined as the weighted mean between these estimates:
Estimation of the Spillover Matrix
To estimate the spillover matrix (SM), we made use of controls stained with individual antibodies. Because any signal not in a single-staining experiment’s primary channel j results from channel crosstalk, each spill entry sij can be approximated by the slope of a linear regression with channel j signal as the response and channel i signals as the predictors, where i ∈ wj.
In a population-based fashion, this slope can be approximated as the ratio between the median signal of channel i positive events in channels j and i, and . The expected background signal in these channels was computed as the median (or trimmed mean) signal of events that are i) negative in the channels i and j for which the spillover is investigated, ii) not assigned to interacting channels, and iii) not unassigned. These medians were indicated as and , and subtracted:
Due to mass cytometry data structure characterized by a low background and the absence of negative events, we found that the following single-cell derived estimate was accurate: Let i+ denote the set of cells that are positive in channel i, and be the channel i to j spill computed for a cell c that has been assigned to this population. We approximated as the ratio between the signal in the unstained spillover receiving and stained spillover emitting channel, Ij and Ii, respectively. Background signal was computed as above and subtracted from all measurements:
Each entry sij in SM was then computed as the median spillover across all cells c ∈ i+:
On the basis of their additive nature, spill values were estimated independently for every pair of interacting channels. By default, the current framework exclusively takes into account interactions that are sensible from a chemical and physical point of view: M±1 channels (abundance sensitivity), the M+16 channel (oxide formation), and channels measuring potentially contaminated metals (isotopic impurities). Optionally, all n·(n−1) possible interactions may be considered, and estimates below a threshold can be set to 0.
To generate the spillover matrix for imaging data, the single-stained images were imported into R and processed with the CATALYST package using individual pixels instead of individual cells as a readout.
Calculation of Spillover and Compensation
As demonstrated in Figure 1C, spillover is linear and using single-stained beads enabled capture of the spillover due to the metal impurities, the oxidation, and the abundance sensitivity. The intensity observed in a given channel j is a linear combination of real signal and contributions from other channels that spill into it. If sij denotes the proportion of channel j signal that is due to channel i and wj the set of channels that spill into channel j, then:
In matrix notation, measurement intensities may be viewed as the convolution of real intensities with a squared spillover matrix of dimensions p x p where p denotes the number of measurement parameters:
Note that for diagonal entries sii = 1 for all i ∈ 1, ..., n, where n denotes the number of measurement parameters, so that spill is relative to the total signal measured in a given channel. Assuming the correctness of this relationship, the resulting system of linear equations is traditionally solved exactly using linear algebra.
Although mathematically exact, the solution to this equation does not account for measurement error or for the fact that the real signal would result in strictly non-negative counts. A simple and computationally efficient way to address this is to use non-negative least squares (NNLS) (Novo et al., 2014). In brief, NNLS solves for Ireal such that the least squares criterion is optimized under the constraint of non-negativity:
To arrive at such a solution we applied the Lawson-Hanson algorithm for NNLS as implemented in the 'nnls' R package.
For the image pixel compensation, the spillover matrix was exported as a tiff image and used for compensation using a custom written CellProfiler plugin (https://github.com/BodenmillerGroup/ImcPluginsCP) (Carpenter et al., 2006). The images were visualized using ImageJ.
Segmentation and Single-Cell Measurements
For segmentation, image stacks containing channels useful for segmentation were generated from the IMC raw data using the ‘imctools’ python package (https://github.com/BodenmillerGroup/imctools). The images were scaled up two fold using a CellProfiler pipeline and re-exported as tiff files suitable for Ilastik pixel classification. Using Ilastik the pixels of the image were classified as nuclei, cytoplasm/membrane, or background. The class information was exported as probability maps and used in CellProfiler for single-cell segmentation. The multiplexed images were measured in CellProfiler using a customized CellProfiler plugin (https://github.com/BodenmillerGroup/ImcPluginsCP). The single-cell data were then exported as csv files and imported into R for compensation with CATALYST and plotting.
CATALYST R Package
An R package called CATALYST was developed to enable an automated compensation of mass cytometry data. Using flowCore (Hahne et al., 2009) infrastructure, CATALYST provides a user-friendly R implementation of the normalization algorithm (Finck et al., 2013) and of the single-cell debarcoding algorithm (Zunder et al., 2015). Furthermore, the package includes a function for estimation of the SM from a priori identified single-positive populations. The matrix returned by this workflow may be directly applied to the measurement data or exported for further use (e.g., to FlowJo or Cytobank). The data processing pipeline can be run at the command line or, alternatively, in an interactive shiny-based app as either a local version (requires installation of several R packages in addition to CATALYST) or online. Detailed examples to facilitate the use of the different functions are included in the package vignette.
Data and Software Availability
The accession number for the data (.fcs files) reported in this paper is MendeleyData: https://doi.org/10.17632/v58yj49pfr.1. The scripts used to generate the key figures are available on Github (https://github.com/BodenmillerGroup/cyTOFcompensation). The R package developed in this study, including installation instructions and source code is available from Bioconductor (http://bioconductor.org/packages/CATALYST). The CellProfiler plugin developed to measure the multiplexed mass cytometry images is available on Github (https://github.com/BodenmillerGroup/ImcPluginsCP). The online version of the CATALYST application is available via: https://catalyst-project.github.io/
Additional Resources
Links, installation instructions, example datasets, and vignettes are accessible from the CATALYST project page: https://catalyst-project.github.io/. This address also provides a link to a file-size-limited online version of the interactive shiny based application.
Acknowledgments
The authors thank Dr. Hartland Jackson for providing the breast cancer tissue samples (ethic approval ref. no. StV 12–2005), the Bodenmiller and the Robinson laboratories for fruitful discussions, and the CyTOF facility of the University of Zurich for providing access to its instrument. This work was supported by the Swiss National Science Foundation (SNSF) R'Equip grant, an SNSF Assistant Professorship grant PP00P3-144874, the PhosphonetPPM and MetastasiX SystemsX grant, an NIH grant (UC4 DK108132), and funding from the European Research Council (ERC) under the European Union's Seventh Framework Program (FP/2007-2013)/ERC grant agreement no. 336921. S.C. was funded by a Roche Postdoctoral Fellowship.
Author Contributions
S.C., V.R.T.Z., M.D.R., and B.B. conceived the study. S.C. performed all single-cell experiments with help from V.R.T.Z. and H.C. S.E. performed the imaging experiments with help from V.R.T.Z. H.C. developed the CATALYST R package and the shiny app with input from V.R.T.Z., M.D.R., S.C., and B.B. H.C., V.R.T.Z., S.C., and M.D.R. performed data analysis and interpretation. S.C., V.R.T.Z., and H.C. wrote the manuscript with input from all authors.
Declaration of Interests
The authors declare no competing interests.
Published: March 28, 2018
Footnotes
Supplemental Information includes five figures and one table and can be found with this article online at https://doi.org/10.1016/j.cels.2018.02.010.
Contributor Information
Mark D. Robinson, Email: mark.robinson@imls.uzh.ch.
Bernd Bodenmiller, Email: bernd.bodenmiller@imls.uzh.ch.
Supplemental Information
References
- Amir E.D., Davis K.L., Tadmor M.D., Simonds E.F., Levine J.H., Bendall S.C., Shenfeld D.K., Krishnaswamy S., Nolan G.P., Pe’er D. viSNE enables visualization of high dimensional single-cell data and reveals phenotypic heterogeneity of leukemia. Nat. Biotechnol. 2013;31:545–552. doi: 10.1038/nbt.2594. [DOI] [PMC free article] [PubMed] [Google Scholar]
- Angelo M., Bendall S.C., Finck R., Hale M.B., Hitzman C., Borowsky A.D., Levenson R.M., Lowe J.B., Liu S.D., Zhao S. Multiplexed ion beam imaging of human breast tumors. Nat. Med. 2014;20:436–442. doi: 10.1038/nm.3488. [DOI] [PMC free article] [PubMed] [Google Scholar]
- Bagwell C.B., Adams E.G. Fluorescence spectral overlap compensation for any number of flow cytometry parameters. Ann. N. Y. Acad. Sci. 1993;677:167–184. doi: 10.1111/j.1749-6632.1993.tb38775.x. [DOI] [PubMed] [Google Scholar]
- Bandura D.R., Baranov V.I., Ornatsky O.I., Antonov A., Kinach R., Lou X., Pavlov S., Vorobiev S., Dick J.E., Tanner S.D. Mass cytometry: technique for real time single cell multitarget immunoassay based on inductively coupled plasma time-of-flight mass spectrometry. Anal. Chem. 2009;81:6813–6822. doi: 10.1021/ac901049w. [DOI] [PubMed] [Google Scholar]
- Behbehani G.K., Bendall S.C., Clutter M.R., Fantl W.J., Nolan G.P. Single-cell mass cytometry adapted to measurements of the cell cycle. Cytometry A. 2012;81:552–566. doi: 10.1002/cyto.a.22075. [DOI] [PMC free article] [PubMed] [Google Scholar]
- Behbehani G.K., Thom C., Zunder E.R., Finck R., Gaudilliere B., Fragiadakis G.K., Fantl W.J., Nolan G.P. Transient partial permeabilization with saponin enables cellular barcoding prior to surface marker staining. Cytometry A. 2014;85:1011–1019. doi: 10.1002/cyto.a.22573. [DOI] [PMC free article] [PubMed] [Google Scholar]
- Bendall S.C., Simonds E.F., Qiu P., Amir A.D., Krutzik P.O., Finck R., Bruggner R.V., Melamed R., Trejo A., Ornatsky O.I. Single- cell mass cytometry of differential immune and drug responses across a hu- man hematopoietic continuum. Science. 2011;332:687–696. doi: 10.1126/science.1198704. [DOI] [PMC free article] [PubMed] [Google Scholar]
- Bodenmiller B. Multiplexed epitope-based tissue imaging for discovery and healthcare applications. Cell Syst. 2016;2:225–238. doi: 10.1016/j.cels.2016.03.008. [DOI] [PubMed] [Google Scholar]
- Carpenter A.E., Jones T.R., Lamprecht M.R., Clarke C., Kang I.H., Friman O., Guertin D.A, Chang J.H., Lindquist R.A, Moffat J. CellProfiler: image analysis software for identifying and quantifying cell phenotypes. Genome Biol. 2006;7:R100. doi: 10.1186/gb-2006-7-10-r100. [DOI] [PMC free article] [PubMed] [Google Scholar]
- Catena R., Özcan A., Jacobs A., Chevrier S., Bodenmiller B. AirLab: a cloud-based platform to manage and share antibody-based single-cell research. Genome Biol. 2016;17:142. doi: 10.1186/s13059-016-1006-0. [DOI] [PMC free article] [PubMed] [Google Scholar]
- Chattopadhyay P.K., Roederer M. Cytometry: today’s technology and tomorrow’s horizons. Methods. 2012;57:251–258. doi: 10.1016/j.ymeth.2012.02.009. [DOI] [PMC free article] [PubMed] [Google Scholar]
- Chattopadhyay P.K., Roederer M. A mine is a terrible thing to waste: high content, single cell technologies for comprehensive immune analysis. Am. J. Transplant. 2015;15:1155–1161. doi: 10.1111/ajt.13193. [DOI] [PubMed] [Google Scholar]
- Chevrier S., Levine J.H., Zanotelli V.R.T., Silina K., Schulz D., Bacac M., Ries C.H., Ailles L., Jewett M.A.S., Moch H. An immune atlas of clear cell renal cell carcinoma. Cell. 2017;169:736–749.e18. doi: 10.1016/j.cell.2017.04.016. [DOI] [PMC free article] [PubMed] [Google Scholar]
- Finck R., Simonds E.F., Jager A., Krishnaswamy S., Sachs K., Fantl W., Pe’er D., Nolan G.P., Bendall S.C. Normalization of mass cytometry data with bead standards. Cytometry A. 2013;83:483–494. doi: 10.1002/cyto.a.22271. [DOI] [PMC free article] [PubMed] [Google Scholar]
- Finney D.J. Probit analysis. J. Pharm. Sci. 1971;60:1432. [Google Scholar]
- Giesen C., Wang H.A.O., Schapiro D., Zivanovic N., Jacobs A., Hattendorf B., Schüffler P.J., Grolimund D., Buhmann J.M., Brandt S. Highly multiplexed imaging of tumor tissues with subcellular resolution by mass cytometry. Nat. Methods. 2014;11:417–422. doi: 10.1038/nmeth.2869. [DOI] [PubMed] [Google Scholar]
- Hahne F., LeMeur N., Brinkman R.R., Ellis B., Haaland P., Sarkar D., Spidlen J., Strain E., Gentleman R. flowCore: a Bioconductor package for high throughput flow cytometry. BMC Bioinformatics. 2009;10:106. doi: 10.1186/1471-2105-10-106. [DOI] [PMC free article] [PubMed] [Google Scholar]
- Kamentsky L., Jones T.R., Fraser A., Bray M.A., Logan D.J., Madden K.L., Ljosa V., Rueden C., Eliceiri K.W., Carpenter A.E. Improved structure, function and compatibility for cellprofiler: Modular high-throughput image analysis software. Bioinformatics. 2011;27:1179–1180. doi: 10.1093/bioinformatics/btr095. [DOI] [PMC free article] [PubMed] [Google Scholar]
- Kotecha N., Krutzik P.O., Irish J.M. Web-based analysis and publication of flow cytometry experiments. Curr. Protoc. Cytom. 2010 doi: 10.1002/0471142956.cy1017s53. Chapter 10, Unit10.17. [DOI] [PMC free article] [PubMed] [Google Scholar]
- Levine J.H., Simonds E.F., Bendall S.C., Davis K.L., Amir E.D., Tadmor M.D., Litvin O., Fienberg H.G., Jager A., Zunder E.R. Data-driven phenotypic dissection of AML reveals progenitor-like cells that correlate with prognosis. Cell. 2015;162:184–197. doi: 10.1016/j.cell.2015.05.047. [DOI] [PMC free article] [PubMed] [Google Scholar]
- Loken M.R., Parks D.R., Herzenberg L.A. Two-color immunofluorescence using a fluorescence-activated cell sorter. J. Histochem. Cytochem. 1977;25:899–907. doi: 10.1177/25.7.330738. [DOI] [PubMed] [Google Scholar]
- Lun X.K., Zanotelli V.R., Wade J.D., Schapiro D., Tognetti M., Dobberstein N., Bodenmiller B. Influence of node abundance on signaling network state and dynamics analyzed by mass cytometry. Nat. Biotechnol. 2017;35:164–172. doi: 10.1038/nbt.3770. [DOI] [PMC free article] [PubMed] [Google Scholar]
- Novo D., Grégori G., Bartek R. Generalized unmixing model for multispectral flow cytometry utilizing nonsquare compensation matrices. Cytometry A. 2014;83:508–520. doi: 10.1002/cyto.a.22272. [DOI] [PMC free article] [PubMed] [Google Scholar]
- Perfetto S.P., Chattopadhyay P.K., Roederer M. Seventeen-colour flow cytometry: unravelling the immune system. Nat. Rev. Immunol. 2004;4:648–655. doi: 10.1038/nri1416. [DOI] [PubMed] [Google Scholar]
- Schapiro D., Jackson H.W., Raghuraman S., Fischer J.R., Zanotelli V.R.T., Schulz D., Giesen C., Catena R., Varga Z., Bodenmiller B. histoCAT: analysis of cell phenotypes and interactions in multiplex image cytometry data. Nat. Methods. 2017;14:873–876. doi: 10.1038/nmeth.4391. [DOI] [PMC free article] [PubMed] [Google Scholar]
- Sommer C., Straehle C., Ullrich K., Hamprecht F.A. ILASTIK: interactive learning and segmentation toolkit. Eighth IEEE International Symposium on Biomedical Imaging (ISBI), Proceedings. IEEE. 2011:230–233. [Google Scholar]
- Takahashi C., Au-Yeung A., Fuh F., Ramirez-Montagut T., Bolen C., Mathews W., O’Gorman W.E. Mass cytometry panel optimization through the designed distribution of signal interference. Cytometry A. 2016;91:39–47. doi: 10.1002/cyto.a.22977. [DOI] [PubMed] [Google Scholar]
- van Der Maaten L., Hinton G. Visualizing data using t-SNE. J. Mach. Learn. Res. 2008;9:2579–2605. [Google Scholar]
- Zivanovic N., Jacobs A., Bodenmiller B. A practical guide to multiplexed mass cytometry. Curr. Top. Microbiol. Immunol. 2013;377:95–109. doi: 10.1007/82_2013_335. [DOI] [PubMed] [Google Scholar]
- Zunder E.R., Finck R., Behbehani G.K., Amir E.-A.D., Krishnaswamy S., Gonzalez V.D., Lorang C.G., Bjornson Z., Spitzer M.H., Bodenmiller B. Palladium-based mass tag cell barcoding with a doublet-filtering scheme and single-cell deconvolution algorithm. Nat. Protoc. 2015;10:316–333. doi: 10.1038/nprot.2015.020. [DOI] [PMC free article] [PubMed] [Google Scholar]
Associated Data
This section collects any data citations, data availability statements, or supplementary materials included in this article.