Abstract
Kaposi’s sarcoma–associated herpesvirus (KSHV) is a gammaherpesvirus that is the etiological agent of the endothelial cell cancer Kaposi’s sarcoma (KS) and 2 B cell lymphoproliferative disorders, primary effusion lymphoma (PEL) and multicentric Castleman’s disease (MCD). KSHV ORF36, also known as viral protein kinase (vPK), is a viral serine/threonine kinase. We previously reported that KSHV vPK enhances cell proliferation and mimics cellular S6 kinase to phosphorylate ribosomal protein S6, a protein involved in protein synthesis. We created a mouse model to analyze the function of vPK in vivo. We believe this is the first mouse tumor model of a viral kinase encoded by a pathogenic human virus. We observed increased B cell activation in the vPK transgenic mice compared with normal mice. We also found that, over time, vPK transgenic mice developed a B cell hyperproliferative disorder and/or a high-grade B cell non-Hodgkin lymphoma at a greatly increased incidence compared with littermate controls. This mouse model shows that a viral protein kinase is capable of promoting B cell activation and proliferation as well as augmenting lymphomagenesis in vivo and may therefore contribute to the development of viral cancers.
Keywords: Oncology, Virology
Keywords: Lymphomas, Oncogenes
Introduction
Kaposi’s sarcoma–associated herpesvirus (KSHV) is a large double-strand DNA herpesvirus that codes for a myriad of proteins that interfere with normal host cellular processes to promote the viral life cycle. These alterations of host cellular processes promote cell survival and other changes that, in the long term, result in the development of cancer in immune-compromised individuals, such as HIV-positive individuals or transplant recipients. KSHV is associated with the endothelial cell cancer Kaposi’s sarcoma (KS) and 2 B cell proliferative diseases, primary effusion lymphoma (PEL) and the plasmablastic variant of multicentric Castleman’s disease (MCD) (1–5).
PEL is a lymphomatous effusion localized to pleural, pericardial, and peritoneal cavities. PEL can also present as mass lesions and are classified as either extracavitary or solid (6). Morphologically, PEL is characterized as an immunoblastic/anaplastic large cell lymphoma. Immunophenotypically, PEL are CD45 positive, but lack typical B cell markers, such as CD19, CD20, CD22, and CD79 (6, 7). PEL cells frequently lack surface and cytoplasmic expression of the immunoglobulin light chains κ and λ (6–8). Contrary to the immune phenotype, PEL cells exhibit clonal immunoglobulin heavy chain gene rearrangements and evidence of somatic hypermutation, which suggest that PEL cells have traversed the germinal center (6, 9). PEL cells also express markers associated with activation, including CD30, CD38, and EMA as well as the plasma cell markers CD138 and MUM-1/IRF-4 (6, 10, 11). Expression of these plasma cell markers suggests that PEL cells derive from a post–germinal center B cell.
KSHV-MCD is a polyclonal B cell lymphoproliferative disorder that affects organs such as the spleen and lymph nodes. MCD in persons living with HIV/AIDS is characterized by KSHV-infected plasmablasts in the mantle zones of follicles. Unlike PEL, which appears to derive from a germinal center or post–germinal center B cell, KSHV-MCD is thought to derive from naive IgM λ-expressing B cells (12). KSHV-MCD is associated with immune deregulation and the production of inflammatory cytokines, such as IL-6 and IL-10 (13). The incidence of MCD is increasing in HIV-infected individuals (14).
KSHV encodes 2 kinases: ORF21, a homolog of cellular thymidine kinase, and a viral protein kinase (vPK) encoded by ORF36. ORF36 is expressed during lytic replication in vitro, but may also be expressed in the absence of full lytic replication (15, 16). The ORF36 gene, which is located within the ORF 34–37 cluster, contains a hypoxia-inducible factor (HIF) response element within the promoter region. Upon exposure to hypoxia, vPK expression increases in PEL cells (17, 18). Thus, vPK expression is likely to be induced in hypoxic environments, independently of full-blown lytic replication. Although only a small proportion of KS spindle cells express lytic markers (19–23), 59% of KS biopsies from KS-afflicted patients show detectable vPK transcripts (24, 25). In PEL, depending on the cell line and growth conditions, 5%–10% of cells also express an extended complement of lytic KSHV genes (26). Moreover, ORF36/vPK is also expressed in MCD and has been used as a therapeutic target to treat MCD (27).
vPK shares some homology with the protein kinases expressed by the other herpesviruses, underscoring the importance of this kinase in the herpesvirus life cycle and infection, although there are very significant differences in the cellular localization and function of these kinases among the different herpesviruses (15).
vPK is expressed in the nucleus and cytoplasm and has been shown to have a multitude of functions in vitro (15, 16). Phosphorylation of MKK4 and MKK7 by vPK results in the subsequent phosphorylation of c-Jun N-terminal kinase and late viral gene expression (15). Other cellular targets that are phosphorylated by vPK include the acetyltransferase TIP60, a regulator of chromatin remodeling and the DNA damage response (DDR) (28). Activation of the DDR during herpesvirus infection promotes viral replication (28–30). In human and mouse cell lines, vPK inhibits the activation of the IFN-β promoter and the production of IFN-β (31). Moreover, vPK exhibits cyclin-dependent kinase-like function by inducing the phosphorylation of Rb and lamin A, thereby promoting cell cycle progression (32).
We reported that vPK resembles and mimics the activity of the cellular ribosomal protein S6 kinase β-1 (S6KB1) (25). S6KB1 is downstream in the PI3K pathway and is phosphorylated by mTOR, a serine/threonine kinase that is part of several complexes within the PI3K pathway (33). Activated S6KB1 phosphorylates multiple targets, some of which are involved in protein synthesis, such as ribosomal protein S6 (S6) and eukaryotic initiation factor 4B (eIF4B). S6 is part of the 40S ribosome, and eIF4B is part of the translation preinitiation complex (34). Ectopic expression of vPK results in increased de novo protein synthesis, tubule formation, and anchorage-independent growth, suggesting that vPK may be an oncogenic protein (25).
To date, our understanding of vPK function has been based on culture models. Here, we generated a vPK transgenic mouse to explore its function in vivo.
Results
The generation of vPK transgenic mice.
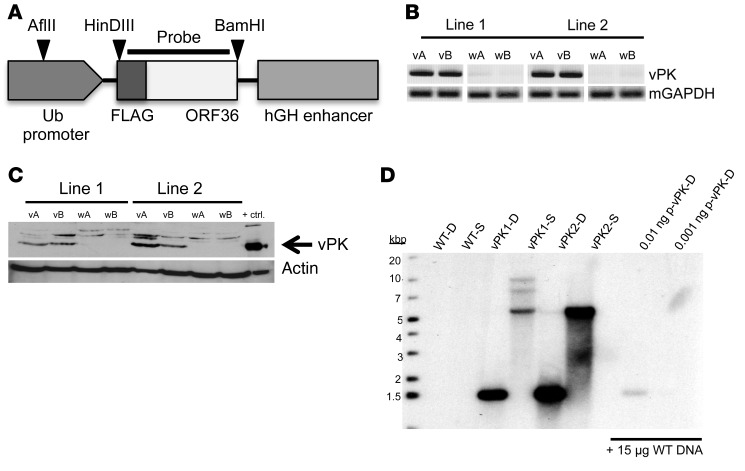
A FLAG-vPK gene was inserted downstream of the ubiquitin (Ub) promoter in the vector pBS.Ub.hGH (Figure 1A). The transgene fragment was microinjected into fertilized embryos of C57BL/6 mice and implanted into pesudopregnant females. After screening the pups for the vPK transgene by PCR, we bred 2 vPK founders to C57BL/6 mice. We confirmed expression of the vPK transgene and protein in both lines by PCR and Western blot, respectively (Figure 1, B and C).
Figure 1. Generation of vPK transgenic mice.
FLAG-tagged vPK was cloned, using HinDIII-HF and BamHI-HF, into a plasmid containing a Ub- and hGH-stabilization element. The linearized transgene fragment was microinjected into the embryos of C57BL/6 mice and implanted into pseudopregnant female mice. Each vPK line was developed from breeding a vPK founder to a C57BL/6 mouse. (A) Schematic of the linearized construct used to generate the vPK transgenic mice, as well as the cut sites and probe for the Southern blot in D. (B) DNA from the tails of 2 WT (wA and wB) and 2 vPK transgenic mice (vA and vB) for lines 1 and 2 was isolated and evaluated by PCR for the vPK transgene. (C) Expression of vPK protein in lysates from spleens of the mice in B as determined by SDS-PAGE and Western blot. Lysate from HEK-293 cells that transiently express vPK was used as a positive control for vPK expression. (D) Southern blot of WT, vPK1, and vPK2. DNA was isolated from the spleens of WT and vPK lines 1 and 2. D, double digest with HinDIII-HF and BamHI-HF; S, single digestion with AFlII; p-vPK, plasmid Ub.vPK.hGH.
To determine the independence of both lines, we performed a Southern blot using DNA isolated from spleens of vPK transgenic or WT control animals. No bands were observed in the lanes of WT controls (Figure 1D). With double digestion, we observe a band around 1.5 kb for both vPK lines, confirming the presence of the transgene in both lines (Figure 1D). With single digestion we observed a prominent band at approximately 5.5 kb in both lines, suggesting multiple tandem insertions. In addition to a band at 5.5 kb, 7 and 10 kb bands were also present in vPK1 but not in vPK2, underscoring that these lines have different vPK insertion sites (Figure 1D). As positive controls, we could also detect double-cut plasmid vPK in the presence of WT DNA (Figure 1D).
Because vPK expression is controlled by the Ub promoter, we expected vPK to be expressed in all tissues. We detected vPK protein in the clarified lysates from liver, spleen, kidney, heart, lung, thymus, and lymph nodes, but not in lysates from WT littermate control organs, by SDS-PAGE and Western blot using a polyclonal vPK antibody (Supplemental Figure 1; supplemental material available online with this article; https://doi.org/10.1172/JCI97053DS1).
vPK transgenic mice have altered splenic B cell subsets.
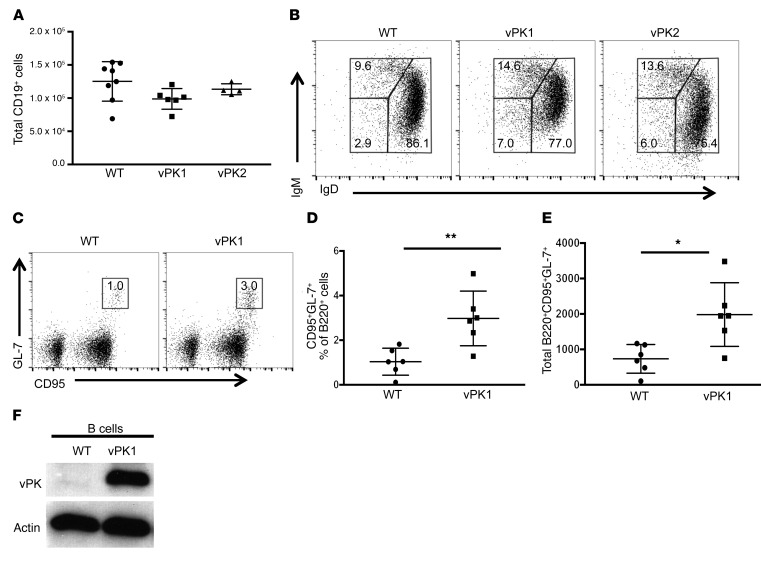
To determine whether KSHV vPK expression modulates the normal composition of B cell subsets, we extracted spleens from 60- to 188-day-old vPK transgenic and age-matched WT mice and evaluated the frequencies of B cell subsets by flow cytometry. We did not detect differences in the total number of CD19+ B cells between WT and vPK transgenic mice (Figure 2A). The most notable observation was a 2-fold increase in the frequency of CD19+IgM–IgD– B cells in the spleens of vPK transgenic mice compared with WT (Figure 2B).
Figure 2. vPK transgenic mice have increased class-switched and germinal center B cells compared with WT controls.
The total number and frequencies of B cells and B cell subsets from the spleens of WT, vPK1, and vPK2 mice was determined by flow cytometry. Data represent mean ± SD. (A) The total number of B cells (CD19+) in gated live splenocytes from WT, vPK1, and vPK2. These data represent 3 experiments in which n = 17 WT, n = 12 vPK1, and n = 7 vPK2. (B) Frequencies of class-switched B cells (IgM–IgD–) of live CD19+ splenocytes shown in A. (C) Representative figure for the gating strategy to determine the frequencies of live germinal center B cells (B220+CD95+GL-7+) in spleens. (D) Frequencies of live germinal center B cells (B220+CD95+GL-7+). n = 6 per group. (E) Total number of live germinal center B cells (B220+CD95+GL-7+). n = 6 per group. (F) Representative Western blot for vPK protein expression in enriched B cells using a vPK polyclonal antibody. n = 7 WT; n = 4 vPK. *P = 0.01; **P = 0.006, Student’s 2-tailed t test.
To determine whether there are differences in the frequencies of germinal center B cells, we extracted spleens from normal vPK transgenic and WT mice and evaluated the frequency of B220+CD95+GL-7+ cells by flow cytometry. In mice, all B cells express B220 until plasma cell differentiation. Germinal center cells acquire GL-7 expression upon recruitment into the germinal center. CD95 or FasR is highly expressed, specifically on germinal center B cells (35). Without antigen stimulation, the overall frequency of germinal center B cells is low in WT spleens (Figure 2C). But despite the lack of antigen stimulation, we observed that vPK transgenic spleens have a significant increase in both the frequency and total number of B220+CD95+GL-7+ cells compared with WT controls (P ≤ 0.01 by Student’s t test, n = 6 per group; Figure 2, D and E), suggesting that naive vPK mice have activated B cell germinal centers.
Although we had observed expression of vPK protein in the spleens and lymph nodes of vPK transgenic mice (Figure 1C and Supplemental Figure 1), we wanted to confirm that vPK is specifically expressed in B cells. We enriched for total B cells by negative selection in splenic cell suspensions from vPK transgenic and WT mice using biotin-conjugated antibodies against CD43, CD4, and Ter-119 and anti-biotin microbeads. We ascertained B cell purity by evaluating B220+ cells by flow cytometry, which ranged from 98% to 99% (n=11). Enriched B cells from vPK transgenic spleens, but not from WT controls, expressed vPK protein, as determined by SDS-PAGE and Western blot (Figure 2F). We observed vPK expression in B cells in all 4 vPK transgenic mice evaluated.
vPK transgenic mice have a greater incidence of B cell hyperproliferative disorder and/or lymphoma than WT controls over time.
We followed a cohort of n = 72 vPK transgenic and age-matched WT mice for 483 to 869 days after birth. We collected lung, liver, spleen, and kidney as well as any observed masses from vPK transgenic or age-matched WT mice. A third of each tissue was preserved in 10% buffered formalin or RNAlater (QIAGEN) or was flash frozen. Whole blood was collected for serum, and ear biopsies were taken for genotype confirmation. All genotypes were reconfirmed for vPK transgenic and WT mice by PCR.
Blinded H&E-stained slides from lung, liver, spleen, and kidney and representative tissue masses were independently reviewed by a board-certified veterinary pathologist and a board-certified hematopathologist. Based on H&E morphology, each pathologist scored individual slides as positive for lymphoma or negative for lymphoma. The histological diagnosis of lymphoma was assigned to tissues in which there was effacement of normal tissue architecture by a population of atypical or pleomorphic cells. Interobserver agreement was high (>95%), and rare discordant cases were resolved by consensus.
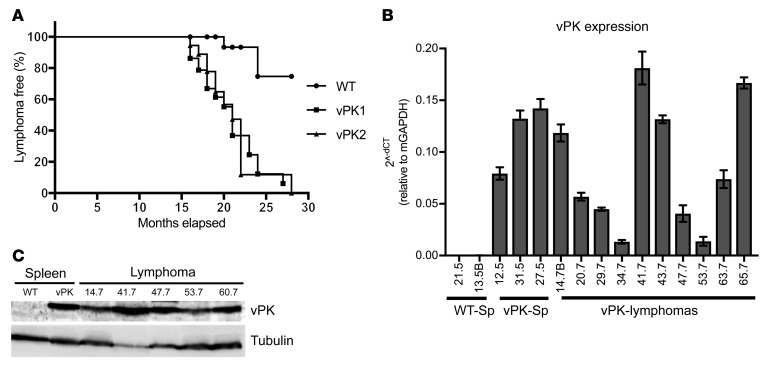
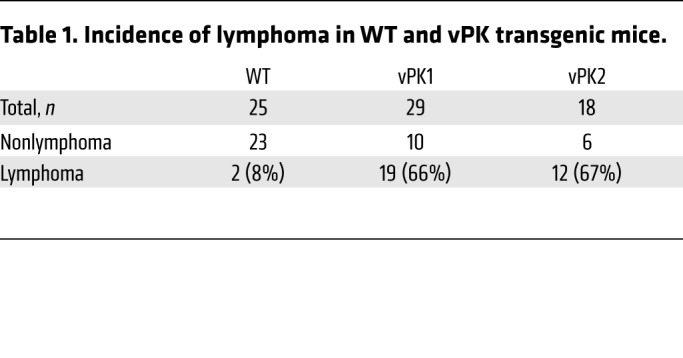
To determine the incidence of lymphoma, any mouse with an organ positive for lymphoma based on the histological evaluation was categorized as positive for lymphoma. Likewise, a mouse not having an organ positive for lymphoma was assigned to the nonlymphoma group. Using this classification system in conjunction with the age of the mice, we observed significantly reduced percentages of lymphoma-free vPK transgenic mice compared with WT over the period of 16 to 28 months (χ2 = 17.71, vPK1 vs. WT; χ2 = 17.85, vPK2 vs. WT, P ≤ 0.0001; Figure 3A). The overall incidence of lymphoma in vPK transgenic mice was approximately 66%, whereas the incidence of lymphoma in WT mice was about 8% (Table 1).
Figure 3. Aged vPK transgenic mice develop a greater incidence of lymphoma than aged WT mice, and these lymphomas express vPK.
(A) Kaplan-Meier curve showing the percentages of lymphoma-free aged vPK mice (n = 29 vPK1; n=18 vPK2) compared with lymphoma-free aged WT mice (n = 25). χ2 = 17.71 (vPK1 vs. WT); χ2 = 17.85 (vPK2 vs. WT), log-rank (Mantel-Cox) test; degree of freedom, 1. (B) vPK transcript expression in spleens (Sp) from WT and in spleens and masses (vPK-Lymphomas) from vPK transgenic mice. Each sample was normalized to murine GAPDH expression. Numbers along the x axis are labels for individual mice. Data represent mean ± SD. (C) vPK protein expression was determined by SDS-PAGE and Western blot in lysates from 5 masses. Numbers indicate individual mice.
Table 1. Incidence of lymphoma in WT and vPK transgenic mice.
Some reports indicate that female C57BL/6 mice have a greater incidence of lymphoma than C57BL/6 male mice upon aging (36), which may cause a bias if there are more female mice in the vPK group compared with the WT control group. To address this issue, we evaluated the numbers of male and female transgenic and WT mice separately. Fifty-six percent of the WT mice were female (Supplemental Table 1). Female mice made up about 34% and 61% of the vPK1 and vPK2 groups, respectively (Supplemental Table 1). We observed that the incidence of lymphoma was not significantly higher in vPK females than in vPK males for both vPK transgenic lines (Supplemental Table 1).
Lymphomas from vPK transgenic mice express vPK.
To determine whether the lymphomas from vPK mice transcribe the transgene, we isolated RNA from a subset of the masses and performed reverse-transcription PCR (RT-PCR) for vPK. We observed transcripts in the masses from transgenic mice as well as in the spleens from vPK transgenics without lymphoma (Figure 3B). Based on the availability of tissue from masses, we evaluated 5 tumors for vPK protein by SDS-PAGE and Western blot and found that these 5 masses were positive for vPK protein and tubulin (Figure 3C). These data suggest the possibility that vPK contributes directly to lymphomagenesis.
Lymphomas and B cell lymphoproliferations were located throughout the bodies of vPK transgenic mice.
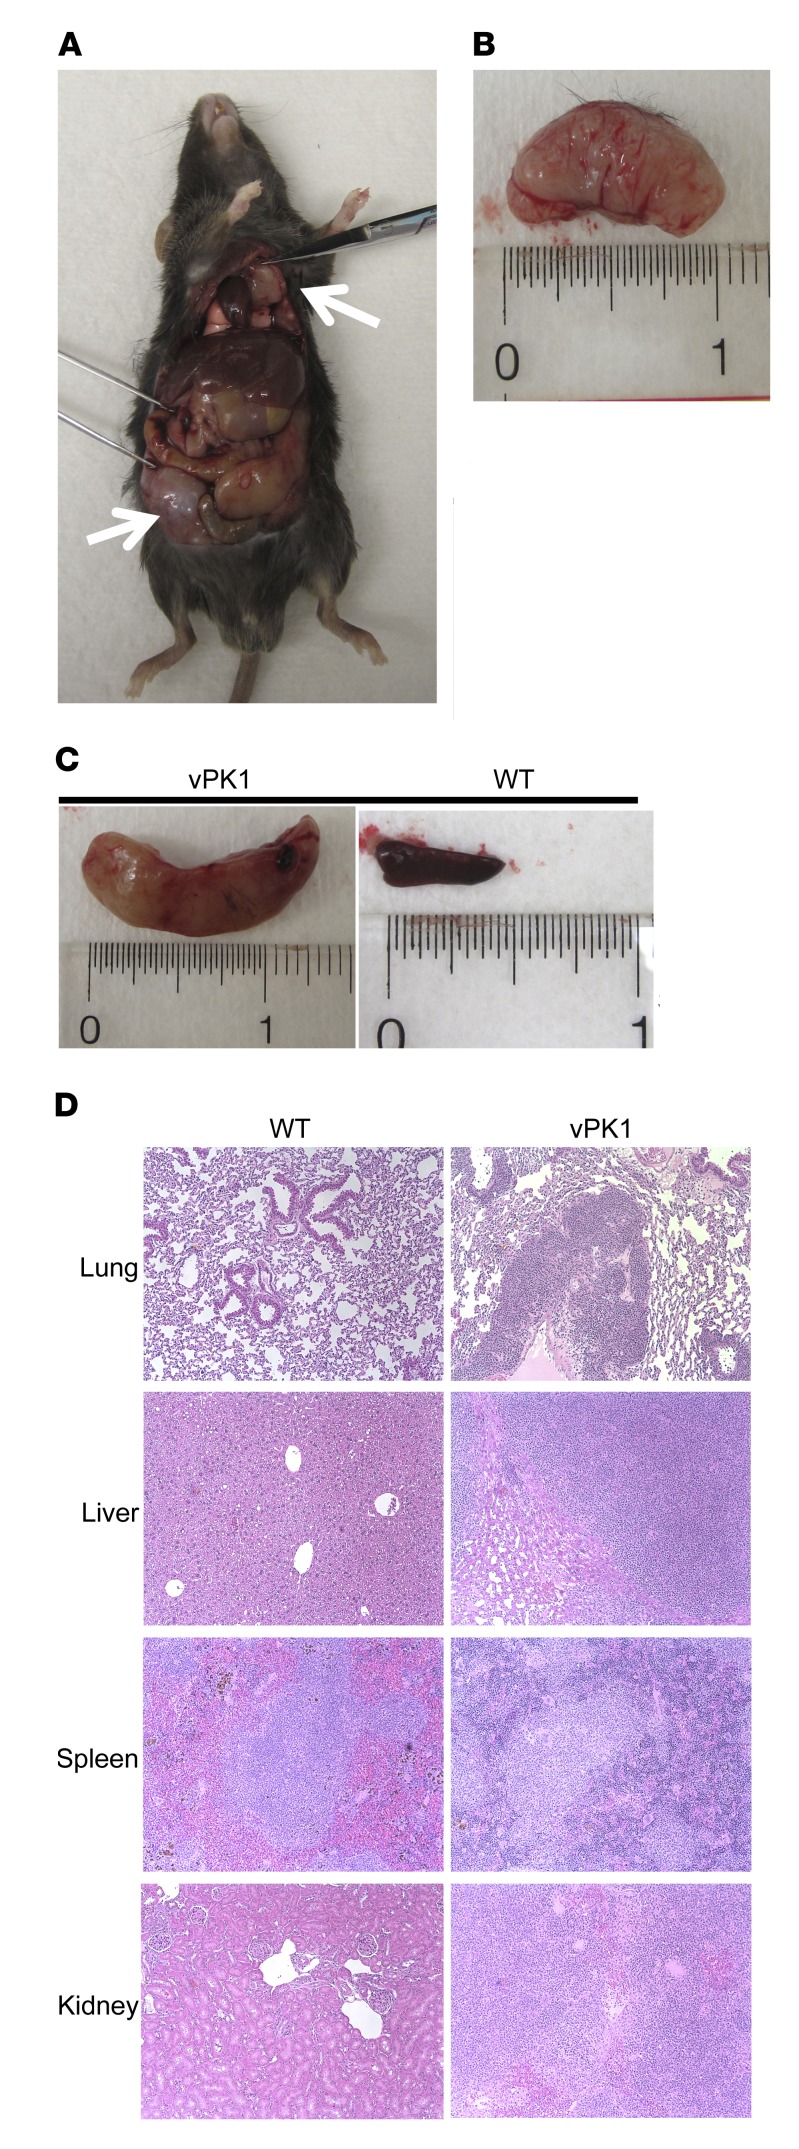
We observed lymphomas and B cell lymphoproliferations arising throughout the body (Figure 4A). The lymphomas and B cell lymphoproliferations were large and white with a fleshy appearance (Figure 4B). By gross observation, spleens with lymphoma were often enlarged, having prominent white nodules indicating expanded follicles or prominent white pulp compared with WT spleens (Figure 4C). In some cases, we observed lymphomatous infiltrate in lung, liver, spleen, and kidney of older vPK animals by H&E staining (Figure 4D).
Figure 4. Aged vPK transgenic mice develop lymphomas throughout the body and in multiple organs.
Mice with more than 2 lymphomas. n = 12. (A) vPK1 transgenic mouse with lymphomas at 18 months. White arrows indicate masses. (B) Abdominal mass from A. (C) Left panel shows a spleen from mouse in A. Right panel shows an 18-month-old WT mouse spleen. (D) H&E-stained sections of lung, liver, spleen, and kidney from 20-month-old WT and vPK1 transgenic mouse with lymphoma. Original magnification, ×100.
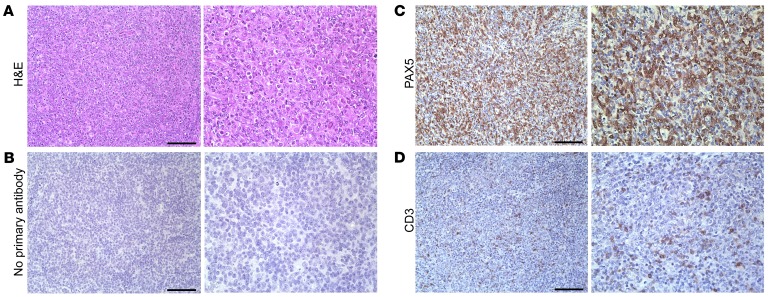
By H&E staining of the masses, we observed the effacement of normal tissue architecture by a diffuse proliferation of discohesive neoplastic cells with high-grade nuclear features, including irregular nuclear contours, prominent nucleoli, frequent mitotic figures, and abundant pyknotic debris (Figure 5A). We also observed some small lymphocytes and plasma cells intermixed in the background of the H&E-stained masses.
Figure 5. Aged vPK transgenic mouse lymphomas are composed predominantly of B cells with interspersed T cells.
(A) H&E, (B) no primary antibody, (C) PAX5, and (D) CD3. Scale bars: 100 μm. Original magnification, ×200 (left panels); ×400 (right panels). Representative of 9 stained tissues with lymphoma, including nodes, spleen, lung, and kidney.
Because the classification of lymphomas is currently based on a combination of morphologic, immunophenotypic, and molecular/genetic features, we next evaluated expression of various markers in both lines of transgenic mice by IHC. We also included nonlymphoma WT spleens as controls as well as relevant positive and negative staining controls.
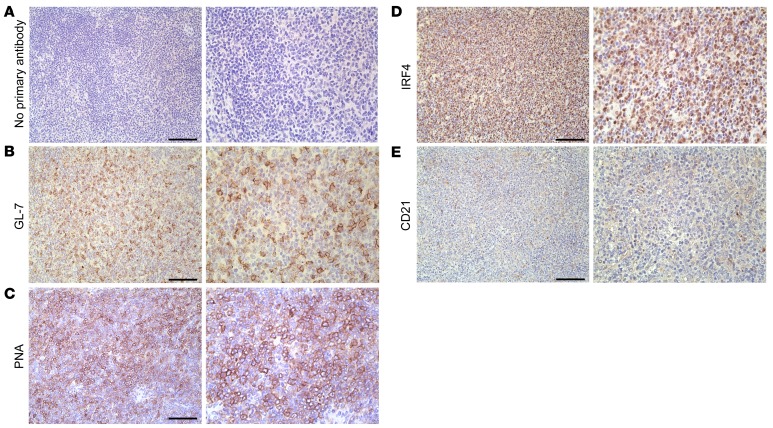
We observed robust PAX5 staining of the large neoplastic cells, indicating that the masses were composed predominantly of B cells (Figure 5C) with an interspersion of small, presumably nonneoplastic CD3-positive T cells (Figure 5D). There was negligible background in the negative control (Figure 5B). Interestingly, the neoplastic cells showed mixed expression of germinal center (PNA and GL-7) (Figure 6, B and C) and post–germinal center (IRF4) markers in representative cases, although the relative proportion of neoplastic cells staining for these markers was somewhat variable between masses (Figure 6D and data not shown). We did not observe background staining in the negative control (Figure 6A). We did not detect an intact follicular dendritic cell meshwork, as indicated by a lack of CD21 staining, indicating a diffuse growth pattern (Figure 6E), whereas we detected CD21-positive meshworks in normal WT spleens (Supplemental Figure 2).
Figure 6. Lymphomas from aged vPK transgenic mice are of germinal center and post–germinal center origin.
Stained tissue sections of the same mass shown in Figure 5. Representative images for (A) no primary antibody, (B) GL-7, (C) PNA, (D) IRF4, and (E) CD21. Scale bars: 100 μm. Original magnification, ×200 (left panels); ×400 (right panels). Representative of 9 stained tissues with lymphoma, including nodes, spleen, lung, and kidney.
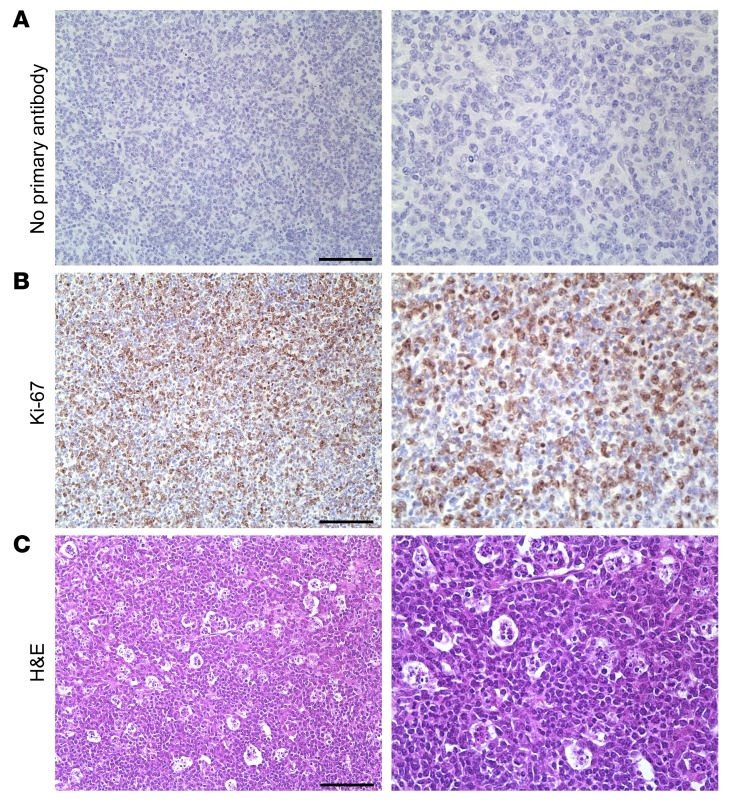
By H&E, we noted that lymphomas and B cell lymphoproliferations from vPK mice had numerous mitotic figures, suggesting that there was a high proliferative rate. Supporting these observations, we also observed intense Ki-67 staining in the tumor (Figure 7B), but not in the negative control (Figure 7A). Moreover, in some cases, we observed abundant tingible body macrophages (Figure 7C). This further supports a high proliferative rate, as tingible body macrophages are a hallmark of rapidly proliferating, i.e., high-grade, lymphomas. Thus far, our data suggest that vPK transgenic mice are susceptible to a B cell hyperproliferative disorder and/or high grade B cell non-Hodgkin lymphoma (NHL).
Figure 7. Aged vPK transgenic mouse lymphomas have robust proliferation.
Tissue sections from the same mass shown in Figure 5. Images show (A) no primary antibody, (B) Ki-67, (C) H&E staining showing tingible body macrophages. Scale bars: 100 μm. Original magnification, ×200 (left panels); ×400 (right panels). Representative of 9 stained tissues with lymphoma, including nodes, spleen, lung, and kidney.
B cells from vPK mice lose IgM and IgD expression over time.
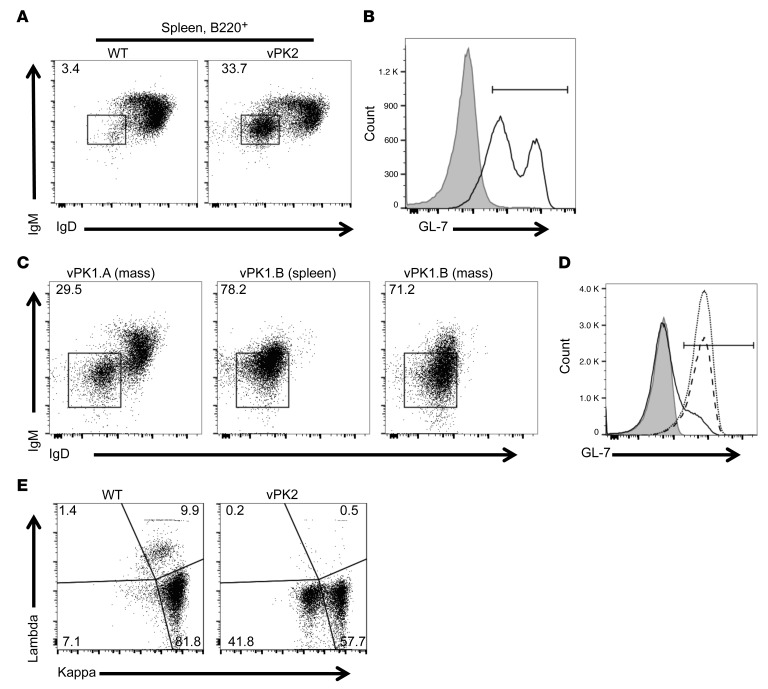
In naive adult vPK transgenic mice without lymphomas, we noted an increase in the frequency of B cells that were negative for the expression of IgM and IgD (Figure 2B). To determine whether this immunological phenotype exists or is changed as the vPK transgenic mice age, we evaluated the frequencies of these cells in spleens from aged vPK transgenic and WT mice by flow cytometry. We observed that there was a dramatic and significant increase in the frequency of splenic B220+IgM–IgD– B cells from aged vPK transgenic mice with lymphoma compared with age-matched WT mice (Figure 8A). Moreover, B cells (B220+) from vPK transgenic mice had increased GL-7 expression compared with age-matched WT B cells (Figure 8B). These data support our previous observations by IHC (Figure 6B) and suggest that the vPK transgenic lymphoma is of germinal center B cell origin.
Figure 8. Increased class-switched B cells from aged vPK transgenic versus age-matched WT mice.
(A) Frequency of B220+IgM–IgD– cells WT spleen (3.4%) and vPK with splenic lymphoma (33.7%). (B) Frequency of B220+GL-7+ from the mice shown in A, WT (gray, 2.1%) and vPK (black line, 77.4%). (C) Frequency of B220+IgM–IgD– cells in a mass (vPK1.A, 29.5%), lymphoma spleen (vPK1.B, 78.2%), and mass (vPK1.B, 71.2%). n = 12 vPK. (D) Frequency of B220+GL-7+-expressing cells from the lymphomas shown in C. Gray, unstained, 0.074%; solid line, vPK1.A, 15.1%; dotted line, vPK1.B spleen, 91.7%; dashed line. vPK1.B mass, 89.7%. (E) Representative of frequency of κ/λ B220+ cells from WT spleen and vPK spleen with lymphoma (n = 9 total, 5 spleens and 4 nodes). n = 3 normal WT spleens.
We also evaluated the frequencies of B cell subsets in masses in older vPK transgenic mice. In one small mass isolated from the abdomen from a vPK transgenic mouse, we observed that about 30% of the B cells were IgM–IgD– (Figure 8C). In a spleen with lymphoma from a different mouse and a mass from this same animal, we observed very high frequencies, approximately 78% and approximately 71%, respectively, of B cells that were IgM–IgD– (Figure 8C). B cells from these tissues also had increased GL-7 expression, indicative of activated germinal center B cells (Figure 8D).
To determine whether the B cells from vPK transgenic mouse lymphomas were monotypic, we evaluated splenic B cells for surface-membrane immunoglobulin light chain expression by flow cytometry. One indicator of B cell monoclonality is a B cell light chain restriction. Although we did not see overt evidence of light chain restriction, we did observe aberrant expression levels of surface light chains. Specifically, we observed a loss of λ expression and a significant reduction in κ surface immunoglobulin–expressing splenic B cells from aged vPK transgenics compared with age-matched WT mice (Figure 8E). In humans, one can expect an approximate 2:1 distribution of κ- to λ-bearing B cells, whereas, in the mouse, the distribution is heavily skewed toward κ, as exemplified in the WT control mice (Figure 8E).
vPK lymphomas display monoclonal or polyclonal IgH rearrangements.
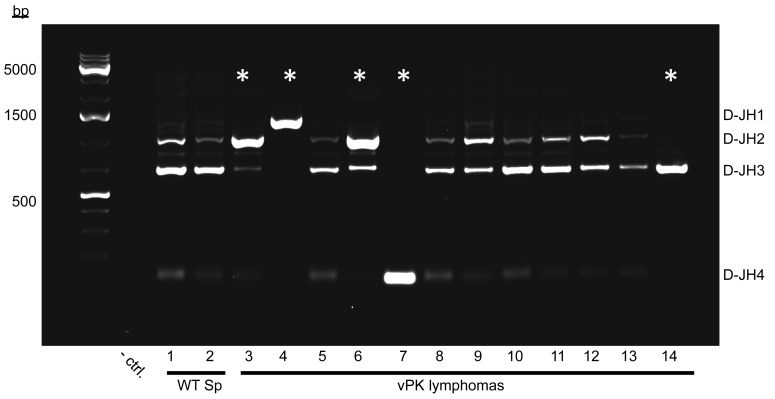
To determine B cell clonality of the lymphomas from aged mice, we evaluated the D–J segments of IgH in genomic DNA by PCR (37–39). We observed multiple D–JH segments in spleens from aged WT mice (Figure 9, lanes 1 and 2). Seven out of twelve lymphomas from aged vPK transgenic mice had multiple D–JH segments indicating polyclonality (Figure 9, lanes 5 and 8–13). Five vPK mouse lymphomas showed a preferential amplification of one of the D–JH segments (Figure 9, lanes 3, 4, 6, 7, and 14), suggesting the emergence of a clonal B cell lymphoma population in those tissues. We evaluated a total of 20 masses or tissues that had been histologically categorized as lymphomas taken from different vPK mice and noted that 8 had an emerging B cell clonal population, as indicated by one preferentially amplified D–JH segment. The remaining 12 tissues had multiple D–JH segments, indicating polyclonality.
Figure 9. Lymphomas from individual aged vPK mice are monoclonal or polyclonal.
D–JH segments of IgH in genomic DNA were PCR amplified, electrophoresed, and stained with ethidium bromide. D–JH segments of IgH in normal WT spleens (WT Sp) and vPK lymphomas. Node, mouse 3; liver, mice 4, 7, and 13; spleen, mice 6, 8–12, and 14. Asterisks indicate the preferential amplification of 1 D–JH segment. A total of 20 lymphoma tissues each from a different aged vPK mouse were evaluated. Polyclonal, n = 12; monoclonal, n = 8.
Aged vPK mice with monoclonal lymphomas had a reduced lymphoma-free incidence compared with vPK and WT mice with polyclonal B cell lesions (Supplemental Figure 3). Two of the vPK transgenic mice having monoclonal lesions (Figure 9, mice 4 and 7) had masses in multiple organs, which upon analysis, revealed the same D–JH segment usage (Supplemental Figure 4, mice 4 and 7).
To substantiate the finding that aged vPK mice develop polyclonal or monoclonal lesions, we profiled the variable regions of the B cell receptor (BCR) immunoglobulin heavy chain. Using isolated RNA from WT (n = 3) and vPK tissues with lymphoma (n = 6), as determined by histology, we prepared a targeted cDNA library and amplified the BCR immunoglobulin heavy chain mRNAs. The cDNAs were sequenced using Illumina MiSeq. The sequences were aligned to the murine immunoglobulin heavy chain locus. Similarly to what was found in the analysis of D–JH segments by PCR, we observed that vPK mouse lymphomas were either polyclonal or had an emerging monoclonal B cell population, as indicated by a reduction of the sequence repertoire of the variable region (data not shown). Aged WT mouse spleens were included and had a more diverse variable sequence repertoire indicating polyclonality (data not shown). Because aged vPK mice had polyclonal or monoclonal lesions, aged vPK mice appear susceptible to developing a B cell hyperproliferative disorder and/or high grade B cell lymphoma, respectively.
vPK mice have increased serum levels of inflammatory cytokines.
Inflammation has been found to promote the development of various cancers and to support the progression of cancer by multiple mechanisms (40). This is of particular clinical importance in people living with HIV/AIDS (41–43). To determine whether inflammation may be contributing to the development of lymphoma in vPK transgenic mice, we evaluated cytokines and growth factors in the serum from aged vPK transgenic and WT mice using a multiplex magnetic bead panel and Luminex. We evaluated an array of 20 analytes. IL-10, IL-1α, KC, and IL-4 were at or below the level of detectability (data not shown). Moreover, for the majority of analytes evaluated, we did not observe significant differences in analyte serum levels between WT and vPK (Supplemental Figure 5).
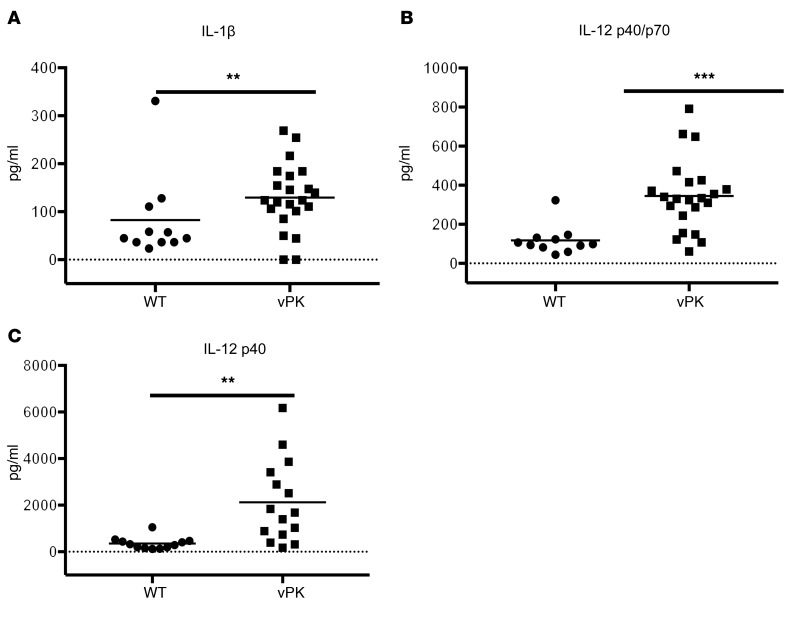
Of the cytokines and growth factors evaluated, we observed a significant (P = 0.00496) increase in IL-1β levels in vPK transgenic compared with WT mice (Figure 10A). Increased levels of IL-1β have been found to promote the growth, angiogenesis, and metastasis of various cancers (44–46). We also observed that IL-12 p40/p70 was increased (P = 0.0000532) in the serum of vPK transgenic mice compared with WT controls (Figure 10B). IL-12 p40/p70 includes IL-12 p70 and p40 monomers and dimers as well as IL-23. Due to this ambiguity, we evaluated IL-12 p70 and IL-12 p40 separately. By ELISA, we did not observe detectable levels of IL-12 p70, except in serum from 2 WT mice (data not shown). Using the Luminex platform, we observed increased levels (P = 0.000601) of IL-12 p40 in the serum from vPK transgenic compared with WT mice (Figure 10C). Although serum IL-12 p40 is not associated with NHL risk (47–49), elevated serum IL-12 p40 levels are associated with the 2 types of NHL, follicular lymphoma and diffuse large B cell lymphoma (DLBCL) (50). Thus, IL-12 p40 and IL-1β may be components in the cellular milieu that promote the progression of lymphoma in vPK transgenic mice.
Figure 10. Aged vPK transgenic mice have increased inflammatory cytokines in the serum compared with age-matched WT.
The cytokine levels in the serum were determined by Luminex. Mean is represented. n = 11 WT; n = 15–22 vPK. (A) IL-1β levels, (B) IL-12 p40/p70 levels, (C) IL-12 p40 levels. Solid line indicates the mean. **P < 0.005; ***P < 0.0005, Mann-Whitney U test.
vPK mouse lymphomas highly express proteins involved in translation.
Our lab has previously shown that vPK is an S6KB1 mimic (25). S6KB1 is downstream in the PI3K/mTOR pathway and is phosphorylated by mTOR. Activated S6KB1 phosphorylates multiple targets, including S6. S6 is a component of the 40S ribosome subunit, and its phosphorylation is important for the ribosomal biogenesis transcriptional program (51). vPK phosphorylates S6, and increased phosphorylated S6 correlates with increased global protein synthesis, tubule formation, and anchorage-independent growth in cell culture (25). These data suggest that one potential mechanism by which vPK promotes tumorigenesis may be by its phosphorylation of S6.
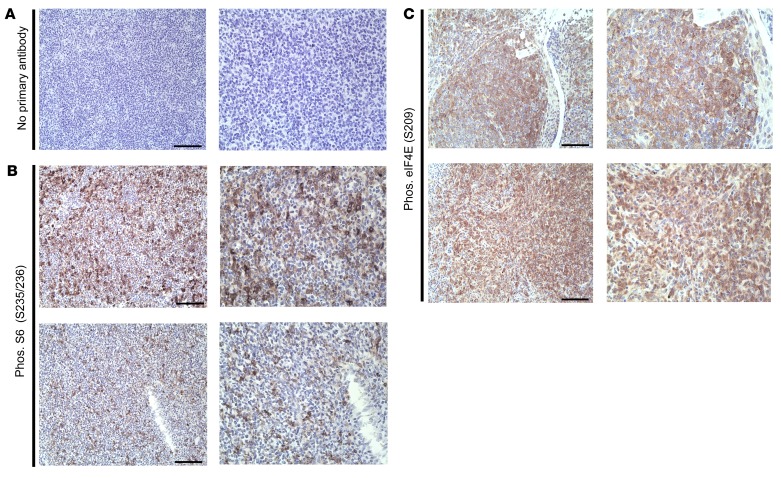
To determine whether vPK may promote phosphorylated S6 in vPK lymphomas, we probed lesions from vPK mice for phosphorylated S6 by IHC. We observed minimal background staining of secondary antibody in the no–primary antibody control (Figure 11A). We observed robust expression of phosphorylated S6 in the lymphomas from vPK transgenic mice (Figure 11B).
Figure 11. Expression of phosphorylated S6 and eIF4E in lymphomas from aged vPK transgenic mice.
(A) No primary antibody. (B) Phosphorylated S6 (S235/236). (C) Phosphorylated eIF4E (S209). Each row shows 1 mouse. Scale bars: 100 μm. Original magnification, ×200 (left panels); ×400 (right panels). Representative 2 of 9 stained tissues with lymphoma, including nodes, spleen, lung, and kidney.
Although S6KB1 and vPK share some of the same substrates, such as S6, vPK expression also appears to promote the phosphorylation of proteins that are not substrates of S6KB1, such as eIF4E (25). Eukaryotic initiation factor 4E binds to the mRNA 5′ cap structure, thereby promoting recruitment of mRNA to the ribosome. In vivo, eIF4E is an oncogene, and its tumorigenic activity is dependent on its phosphorylation at serine 209 (52–54). Phosphorylated eIF4E transforms cells in vitro, facilitates tumorigenesis in vivo, and has been shown to promote metastasis (52, 55, 56).
To determine whether phosphorylated eIF4E may have a role in the ongoing development of a B cell hyperproliferative disorder and/or lymphoma in vPK transgenic mice, we evaluated phosphorylated eIF4E (S209) in lesions from aged vPK transgenic mice by IHC. We detected phosphorylated eIF4E in the lesions from vPK mice (Figure 11C). Because phosphorylated eIF4E is increased in various cancers, including gastric cancer (57), we included gastric cancer as a positive control and observed positive and negative cells for phosphorylated eIF4E within the same tissue, suggesting antibody specificity (Supplemental Figure 6A). We did observe a small degree of phosphorylated eIF4E in normal spleen from an aged WT mouse, but to a much lesser extent than in spleen from a vPK mouse with lymphoma (Supplemental Figures 6, B and C). Finding elevated levels of phosphorylated S6 and eIF4E in the lesions from vPK mice strongly suggests ongoing active translation and protein synthesis.
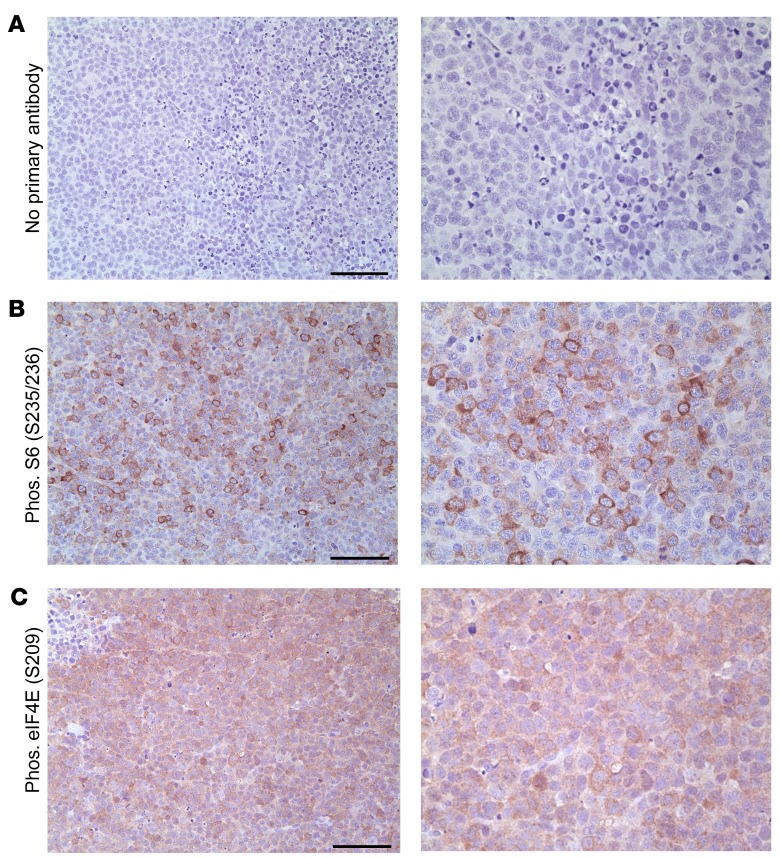
We observed high levels of phosphorylated S6 and eIF4E in lymphomas from the vPK transgenic mice (Figure 11, B and C). Because the lymphomas from vPK transgenic mice share some features of PEL, we evaluated PEL xenograft tumors for phosphorylated eIF4E by IHC. As observed previously, there was negligible staining in the no–primary antibody control (Figure 12A). PEL xenograft tumors had extensive expression of phosphorylated eIF4E (Figure 12C), which was present in the nuclei and cytoplasm (Figure 12C). A fraction of eIF4E localizes to the nucleus and is found in speckles within the nucleoplasm (58, 59). We also evaluated the levels of phosphorylated S6 in the same PEL xenograft tumor and observed increased levels of phosphorylated S6 (Figure 12B) (60). These data suggest that vPK may facilitate translation and protein synthesis in PEL via activation of S6 and eIF4E.
Figure 12. Expression of phosphorylated S6 and eIF4E in mouse xenograft PEL tumors.
(A) No primary antibody, (B) phosphorylated S6 (S235/236), n = 3 (C) phosphorylated eIF4E (S209). n = 7. Scale bars: 100 μm. Original magnification, ×200 (left panels); ×400 (right panels).
Discussion
KSHV establishes life-long latency, with episodic bouts of viral reactivation and lytic gene expression. Many lytic proteins are thought to induce the expression of angiogenic and inflammatory proteins that promote the survival and proliferation of latently infected cells in a paracrine fashion. Latent proteins expressed in latently infected cells are thought to spur tumorigenesis. Some in vivo models in which KSHV lytic or latent proteins are expressed support this paradigm. Transgenic mice that express the constitutively active lytic G protein–coupled receptor (GPCR) develop tumors that seem to arise from paracrine mechanisms. Only some of the tumor cells express viral GPCR, and inflammatory cytokines and angiogenic factors are present (61–63). This model supports the idea that viral lytic proteins promote tumor progression by the production of angiogenic and inflammatory proteins, whereas expression of latent protein v-FLIP during different stages of B cell development results in a high incidence of B cell–derived lymphoma (64).
Although expression of the latent protein v-FLIP results in a high incidence of lymphomas, expression of other latent proteins is only weakly oncogenic in vivo. When the entire latency locus is expressed, there is chronic activation of mature B cells, and yet only a fraction of these mice go on to develop lymphomas (65). But when the latency locus is expressed in conjunction with myc, the double-transgenic mice develop frank lymphoma (66). Likewise, latent protein vCyclin transgenic mice develop lymphomas at a low incidence unless the transgene is expressed in p53–/– mice (67, 68). Cumulatively, these data suggest that latent proteins require the contributions of other viral proteins and/or host factors to promote lymphomagenesis.
We generated 2 lines of transgenic mice that express vPK under a Ub promoter. Normal adult vPK transgenic mice had increased splenic class–switched B cells, suggesting a moderately, but constitutively activated, immune system. In older vPK transgenic mice, we observed an increased incidence of a B cell hyperproliferative disorder and lymphoma compared with WT controls. The lymphomas, which are composed predominantly of B cells can be found throughout the body and in multiple organs. The neoplastic cells express both germinal center (GL7, PNA) and post–germinal center (IRF4) markers, while also exhibiting a high rate of proliferation (Ki-67). Together, these features indicate a high-grade B cell NHL. Moreover, we noted high levels of phosphorylated S6 and eIF4E, which suggests that active translation and protein synthesis may be contributing to the aberrant B cell proliferation in vPK transgenic mice.
The lesions from vPK transgenic mice share some of the same features as those found in the KSHV B cell malignancy PEL. The B cell of PEL is thought to be of post–germinal center origin and preterminally differentiated (6, 9). For instance, PEL cells have been shown to express IRF4 (69–71) and in most cases lack surface immunoglobulin expression. Chadburn et al. found that 0% of PEL cases were positive for surface/cytoplasmic expression of κ and 15% (4/26) were positive for λ surface/cytoplasmic expression (6). Similar to PEL cells, the cells in vPK lymphomas appear to be of germinal center/post–germinal center origin, express IRF4, and lack surface immunoglobulin expression. Extracavitary or solid variants of PEL have also previously been observed (6), and the vPK lymphomas resemble such solid lymphomas.
PEL is composed of monoclonal B cells, and monoclonality supports a diagnosis of lymphoma. To determine whether vPK lesions are monoclonal, we evaluated surface immunoglobulin light chain expression by flow cytometry. An immunoglobulin light chain restriction is one indicator of monoclonality. Instead of a skewing toward κ or λ, we observed a reduction in the percentage of B cells that express either κ or λ from aged vPK transgenic mice. Although it’s not a conclusive inidicator of lymphoma, some reports suggest that aberrant light chain immunoglobulin expression can be a surrogate marker for lymphoma (72–74).
To further evaluate clonality in the tumors from aged vPK transgenic mice, we evaluated IgH rearrangements by PCR. We observed either a polyclonal or an emergence of monoclonal B cells in tissues that had been previously classified as lymphomas by histology. We determined clonality by evaluating IgH rearrangements in 1 section of 1 lesion per animal. There could be sampling bias that confounds these results. It is possible that background B cells in spleens could mask an emerging monoclonal B cell population.
The ORF36 gene contains hypoxia-responsive elements in its promoter, allowing for vPK expression under hypoxic conditions in the absence of full-blown lytic replication (18, 75). Thus, vPK may contribute to the development and phenotype of PEL directly during incomplete reactivation and indirectly through paracrine mediators (76). vPK may also be involved in KSHV+ DLBCL, which sometimes develops in KSHV-MCD patients as well as in HIV-positive individuals in the absence of PEL and MCD (77–79).
One mechanism by which vPK directly promotes lymphomagenesis in aging vPK transgenic mice may be by its phosphorylation of proteins involved in cap-dependent translation and protein synthesis. We have previously reported that vPK is an S6KB1 mimic in cell culture. S6KB1 is a kinase downstream of the mTORC1 complex, which is a major node in the PI3K/Akt/mTOR pathway. Activated S6KB1 phosphorylates a multitude of substrates that are involved in cell proliferation, cell survival, and protein synthesis, including S6 (80, 81). In the current study, we observed elevated levels of phosphorylated S6 in lymphomas that developed in vPK transgenic mice. S6 is a component of the 40S ribosome subunit, and its phosphorylation is important for the ribosomal biogenesis transcriptional program (51).
Although vPK does not phosphorylate all of the S6KB1 substrates involved in translation, such as eIF4B (S422), it phosphorylates other substrates not typically activated by S6KB1, including eIF4E (S209) (25). Eukaryotic initiation factor 4E binds the 5′-cap structure of eukaryotic mRNAs and aids in the recruitment of ribosomes. Aberrant hyperphosphorylation of eIF4E is involved in cell transformation, tumorigenesis, and metastasis in vitro and in in vivo mouse models of cancer (52, 55, 56). In the current study, we observed elevated levels of phosphorylated eIF4E in the lymphomas from vPK transgenic mice and in PEL xenograft tumors. Thus, vPK facilitates lymphomagenesis in vPK transgenic mice and likely contributes to tumorigenesis by facilitating the phosphorylation of eIF4E.
Promoting translation may not be the only mechanism by which vPK promotes lymphomagenesis. In normal and aged vPK mice, we observed elevated frequencies of class-switched, activated B cells (sIgM–, sIgD–). During the normal response to antigen, B cells undergo several genetic rearrangements that diversify the BCR and fine-tune it for antigen recognition. It is during these processes that mutations can be introduced and contribute to lymphomagenesis. Such alterations are prevalent in B cell lymphomas (82). We speculate that another way in which vPK contributes to lymphomagenesis is that vPK expression induces B cell activation, thereby promoting various genetic rearrangements of the BCR and facilitating the accumulation of mutations that contribute to the development of lymphoma.
Our discovery that vPK transgenic mice develop high-grade B cell lymphoma, as well as a B lymphoproliferative disorder, at an increased incidence supports the notion that vPK is a viral oncogenic protein.
Methods
Transgenic mice.
The KSHV ORF36 construct was previously described (25) and was cloned into the backbone pBS.Ub.hGH, a plasmid previously modified from pBluescript to include a Ub and a stabilization sequence (hGH). The plasmid was linearized with restriction enzymes PvuI-HF (high fidelity) and SapI from New England BioLabs. The transgene fragment was microinjected into fertilized embryos of C57BL/6 mice and implanted into pseudopregnant female mice by the UNC Animal Models Core Facility at the University of North Carolina at Chapel Hill. vPK-expressing mice were identified by isolating mouse genomic DNA from foot or tail biopsies and by completing PCR using primers specific for vPK. Two lines of vPK transgenic mice were generated by breeding 2 vPK founders to C57BL/6 mice (The Jackson Laboratory, 000664).
Southern blot.
Mouse genomic DNA was isolated from spleens using the DNeasy Blood and Tissue Kit from QIAGEN. Fifteen micrograms of DNA from each mouse was double digested with BamHI-HF and HindIII-HF (New England BioLabs) and single digested using AflII (New England BioLabs) in a total volume of 100 μl at 37°C overnight. Plasmid vPK at 0.01 ng or 0.001 ng was double digested with 15 μg of DNA from WT mouse spleens under the same conditions. The total volume for each sample was added to a 0.8% agarose gel. The samples were subjected to gel electrophoresis at 25 V overnight and stained with ethidium bromide. To confirm digestion, the gel was briefly exposed to UV light and an image captured. To nick the DNA, the gel was exposed to UV light for 3 minutes. The gel was then washed in a buffer of 0.4 N NaOH and 1 M NaCl 2 times each for 15 minutes. The DNA in the gel was transferred for 20 hours to a charged nylon membrane by a capillary transfer system. The DNA was then crosslinked to the membrane by exposure at 120 mJ/cm2 in a UV crosslinker. The membrane was hybridized with prehybridization buffer at 42°C for 1 hour. For the probe, plasmid vPK (Ub.vPK.hgH) was double digested with BamHI-HF and HindIII-HF and gel purified. One hundred nanograms of this DNA was used as a template to make a radiolabeled deoxycytidine triphosphate [α-32P]-dCTP (PerkinElmer, BLU513Z250UC) probe per the manufacturer’s instructions (Thermo Scientific DecaLabel DNA Labeling Kit, K0622). After the labeling was complete, the probe was filtered through a GE ProbeQuant G-50 Micro Column, boiled for 5 minutes, and cooled on ice. The probe was added to the membrane and prehybridization buffer and incubated at 42°C overnight. The probe and buffer were removed, and the membrane was washed in a series of buffers containing varying concentrations of SSC and SDS. The membrane was then exposed to x-ray film for 2 days at room temperature.
Genotyping and PCR.
To evaluate the presence of vPK, each tissue sample was resuspended in 0.1 ml of solution A (25 mM NaOH, 0.2 mM EDTA, pH of approximately 12) for 1 hour at 95°C. Then, 0.1 ml of solution B (40 mM Tris-HCL, pH of approximately 5) was added and the samples were vortexed and centrifugated for 3 minutes at approximately 10,000 g. Two microliters of mouse genomic DNA was then added to a PCR mix of buffer (QIAGEN), primers, Taq polymerase (QIAGEN), and dNTPs (QIAGEN).
Primers.
The following primers were used for vPK genotyping: vPK forward, 5′-CGCCTTCGGAATCATTGTGC-3′; vPK reverse, 5′-TTAGAGCCGGAATGCAGAGC-3′, murine GAPDH forward, 5′-ATCACTGCCACCCAGAAGAC-3′; and murine GAPDH reverse, 5′-GGATGCAGGGATGATGTTCT-3′. The primers used for RT-PCR for vPK included the following: forward, 5′-CCCTAACATGGGCCTGACTA-3′; reverse, 5′-TGACCACTCGTGGGATCATA-3′. The murine GAPDH primers were used both for genotyping and RT-PCR. The primers used for IgH rearrangements have been previously reported (37–39) and included the following: DSF, 5′-AGGGATCCTTGTGAAGGGATCTACTACTGTG; JH4, 5′-AAAGACCTGCAGAGGCCATTCTTACC.
Immunoblots.
Tissues were immediately flash-frozen in a dry ice/ethanol slurry following extraction. The frozen tissues were maintained at –80°C until processed. Each tissue sample was homogenized in RIPA buffer containing protease (Roche, 11-697-498-001) and phosphatase inhibitors (Roche, 04-906-837-001). The samples were then centrifuged at 16,000 g for 15 minutes at 4°C. Protein expression was evaluated using the Pierce BCA protein assay. Equal amounts of protein (100 μg) were loaded per lane and resolved by SDS-PAGE. Blots were probed for actin (Santa Cruz Biotechnology Inc., SC-1615) to evaluate total protein levels or vPK, using a polyclonal vPK antibody (83) that was provided by Hsing-Jien Kung and Yoshihiro Izumiya (UCD School of Medicine, Sacramento, California, USA), followed by an HRP-linked, anti-rabbit IgG secondary antibody (Cell Signaling, catalog 7074).
B cell enrichment and immunoblot.
A single-cell suspension was prepared from WT or vPK transgenic mouse spleens. B cells were enriched by negative selection using a mouse B cell isolation kit from Miltenyi Biotec according to the manufacturer’s instructions. B cell purity was determined by evaluating the percentage of B220-positive cells compared with those that were unstained by flow cytometry. Purity was greater than 98%. For the immunoblot, the purified B cells were lysed with an NP-40 lysis buffer (0.1% NP-40, 150 mM NaCl, 25 mM Tris/HCl pH 8.0) containing a cocktail of protease (Roche) and phosphatase (Roche) inhibitors. Protein levels in clarified lysates were determined by a Bradford assay (Bio-Rad).
Flow cytometry.
A single cell suspension was prepared from mouse spleens by mashing the organ on ice with the top of a sterile syringe plunger in a 6-well dish containing cold DMEM. This suspension was filtered through a 40-μm strainer. All procedures were carried out on ice. Cells were washed in cold PBS and then incubated with ACK lysis buffer for 5 minutes and washed again with cold PBS. Cells were resusupended in FACS buffer composed of PBS and 1% BSA. Cells were counted, incubated with mouse Fc block (BD Biosciences, 553142), and stained with fluorochrome-conjugated antibodies in FACS buffer at 106/100 μl per reaction on ice for 30 minutes in the dark. After staining, cells were washed in FACS buffer ×3 and resuspended in FACS buffer containing 1% formaldehyde. The fluorochrome-conjugated antibodies used for flow cytometry were purchased from eBioscience: CD19 e450 (catalog 48-0193-80/clone ID3), live/dead e780 (catalog 65-0865-14), IgM PE (catalog 12-5890-81/clone eB121-15F9), IgD FITC (catalog 11-5993-81/clone 11-26c), B220 e450 (catalog 48-0452/clone RA3-6B2), GL-7 AF488 (catalog 53-5902-80/clone GL7), and CD95 PE (catalog 12-0951-81/clone 15A7). Samples were processed and data acquired on a MACSQuant VYB (Miltenyi Biotec). Data were analyzed using FlowJo software (Tree Star).
Tissue extraction.
Mice were sacrificed by exposure to carbon dioxide and subsequent cervical dislocation. Blood was collected in serum gel z1.1 tubes (Sarstedt). An ear biopsy was also collected for genotype confirmation. Lungs, liver, spleen, and kidney were collected, and mass was determined. Each tissue was divided into 3 pieces to be preserved by snap-freezing in a dry ice/ethanol slurry, RNAlater (QIAGEN), and 10% buffered formalin preservation.
Relative real-time PCR for vPK.
Twenty to thirty micrograms of RNAlater-preserved (QIAGEN) tissue was disrupted and lysed using a TissueLyser (QIAGEN). Total RNA was isolated using QIAGEN’s RNeasy Plus Mini Kit according to the manufacturer’s instructions. Isolated RNA was further treated to remove any residual gDNA (ActicZymes, catalog 80200). In order to generate cDNA, 1.8 μg RNA was reverse transcribed using the High-Capacity RNA-to-cDNA Kit (Applied Biosystems, catalog 4368814) reagents. Real-time PCR was performed for ORF36 using the cDNA as a template in SYBR Green PCR Master Mix. Murine GAPDH was used as an endogenous control for each sample. The samples were processed using a QuantStudio 6 Flex Real-Time PCR machine from Applied Biosystems.
Cytokine detection in serum.
For cytokine detection, we used the Luminex platform and the following reagents: Mouse Cytokine Magnetic 20-Plex Panel (Invitrogen, catalog LMC0006M) and the IL-12/IL-23 p40 Mouse ProcartaPlex Simplex Kit (Invitrogen, EPX01A-26033-901). According to the standard curves, the limits of detection were 24.91 pg/ml (IL-1β), 16.73 pg/ml (IL-12 p40/p70), and 7.48 pg/ml (IL-12 p40).
IHC.
Tissues were collected in 10% buffered formalin. After 3 to 7 days, the tissues were placed in cassettes, washed with water for 10 minutes, and then placed in 70% ethanol. Paraffin-embedded tumors were cut into 4 μm sections and placed on slides. To prepare tissues for IHC staining, the tissues were heated in an oven for 1 to 2 hours at 58°C. The tissues were put through two 5-minute incubations in Histoclear (National Diagnostics) to deparaffinize and subsequent 3-minute incubations in a descending gradient of ethanol. The sections were placed in the Dako PT Link containing a prewarmed (75°C) citrate pH 6.0 or Tris-EDTA pH 9.0 buffer and heated to 95°C for 25 minutes. After cooling to about 75°C, the sections were washed for 5 minutes in 1× Dako EnVision Flex wash buffer. To quench peroxidase activity, the sections were incubated in a 3% hydrogen peroxide solution for 10 minutes. Next, the sections were exposed to a blocking buffer containing 10% horse serum, 0.005% BSA, and 0.03% Triton X-100 in PBS for 30 minutes at room temperature. The blocking buffer was replaced with primary antibody diluted in blocking buffer and incubated overnight in a humidified chamber at 4°C. Some sections only received blocking buffer as a no–primary antibody control. Sections then underwent three 5-minute washes with PBS. Using the appropriate Vectastain ABC HRP Kit (Vector Laboratories), the sections were incubated with the secondary antibody for 45 minutes at room temperature. Sections underwent three 5-minute washes with PBS and were subsequently incubated in preformed Avidin DH biotinylated horseradish peroxidase H complex (Vector Laboratories) for 1 hour. Sections were developed with 3, 3′-diaminobenzidine peroxidase substrate (Vector Laboratories) and subsequently counterstained with hematoxylin, dehydrated, and coverslipped. The sections were imaged using the Leica DM LS histology microscope with the following objectives: 4/0.10 numerical aperture (NA) C plan, a 10/0.25 NA N plan achromat, a 20/0.70 NA HC plan apochromat, and a 40/0.75 NA HCX PL Fluotar semi-apochromat objective. Images were acquired using the Leica DFC480 camera and associated Leica Application Suite (LAS) software, version 4.8. Images were saved as TIFF files on a PC under Windows 7 Professional.
IHC antibodies.
IHC antibodies were as follows: Pax5 (Cell Signaling Technology, 12709/D7H5X), CD3 (Dako, A0452), Ki-67 (Thermo Fisher Scientific, RM-9106-S1), biotinylated peanut agglutinin (Vector Laboratories, B-1075), CD21 (Abcam, 75985/EP3093), IRF-4 (Santa Cruz Biotechnology Inc., SC-6059/M-17), phosphorylated S6 (Ser235/236) (Cell Signaling Technology, 2211), phosphorylated eIF4E (Abcam, 76256/EP2151Y), and GL-7 (Thermo Fisher Scientific, 14-5902/GL7).
IgH gene rearrangements.
DNA was isolated from mouse tissues using the Qiagen DNeasy Blood and Tissue Purification Kit (catalog 69504). One hundred nanograms of DNA for each sample was PCR amplified using the DSF/JH4 primers and PCR conditions as previously described (37, 38). The PCR products were electrophoresed on a 2% agarose gel and stained with ethidium bromide.
BCR IgG heavy chain profiling.
We isolated RNA using the QIAGEN RNeasy Plus Mini Kit (catalog 74136) and completed on-the-column DNAse treatment with the QIAGEN RNase-free DNase Kit (catalog 79254). We evaluated RNA concentrations using Qubit fluorometric quantitation. Using 1.3 μg of RNA for each sample (WT = 3 spleens and vPK = 6 tissues with lymphoma), we amplified the variable regions of the BCR heavy chain and generated a cDNA library using the SMARTer Mouse BCR IgG H Profiling Kit (Takara Bio, 634422). The samples were then submitted to the University of North Carolina School of Medicine High-Throughput Sequencing Facility for 300 bp ID multiplex Illumina MiSeq processing. Illumina bcl2fastq pipeline (v.2.18.012) was used for initial processing. This yielded paired-end reads. Adapter-trimming, quality trimming, and paired-end repair were performed using bbmap v.37.67. Reads were aligned to the murine IgH locus (NG_005838.1) using Geneious software 11.04. Only reads that uniquely aligned to 1 position on the target were used to calculate coverage for each of the annotated VH, D, and J segments as well as the constant regions. Coverage graphs were analyzed in R 3.4.2 (2017-09-28). Code and coverage data are available at the Atlassian Bitbucket site (https://bitbucket.org/ddittmer/pennyigh).
PEL xenograft tumors.
PEL xenograft tumors were generated as previously described (60).
Statistics.
All statistical analysis was completed using GraphPad Prism. All statistical tests and P values indicating significance are included in each figure legend. Student’s 2-tailed t test was used, and P ≤ 0.05 was considered significant.
Study approval.
The Institutional Animal Care and Use Committees at the University of North Carolina at Chapel Hill approved all experiments.
Author contributions
PMA and BD designed experiments. PMA executed experiments, analyzed data, created figures, and wrote the manuscript. NDM and SAM analyzed data, acquired images, and provided intellectual input. APB provided the vPK construct, PEL xenograft tumors, and intellectual input. DPD helped with data analysis. BD obtained funding for all the experiments, analyzed data, provided intellectual input, and helped write the manuscript.
Supplementary Material
Acknowledgments
We thank Yoshihiro Izumiya and Hsing-Jien Kung for the vPK antibody. PMA was supported by NIH grant T32-AI007419. BD is supported by NIH grants CA096500, CA019014, and AI109965. DPD is supported by NIH grants CA163217 and DE023946. BD is a Leukemia and Lymphoma Society Scholar and a Burroughs Wellcome Fund Investigator in Infectious Disease. The University of North Carolina Transgenic Models Core and the University of North Carolina High Throughput Sequencing Facility are supported by NIH Cancer Center core grant P30 CA016086.
Version 1. 05/07/2018
Electronic publication
Version 2. 06/01/2018
Print issue publication
Footnotes
Conflict of interest: The authors have declared that no conflict of interest exists.
Reference information: J Clin Invest. 2018;128(6):2519–2534.https://doi.org/10.1172/JCI97053.
See the related Commentary at A viral protein kinase drug target for tumors?.
References
- 1.Cesarman E, Chang Y, Moore PS, Said JW, Knowles DM. Kaposi’s sarcoma-associated herpesvirus-like DNA sequences in AIDS-related body-cavity-based lymphomas. N Engl J Med. 1995;332(18):1186–1191. doi: 10.1056/NEJM199505043321802. [DOI] [PubMed] [Google Scholar]
- 2.Soulier J, et al. Kaposi’s sarcoma-associated herpesvirus-like DNA sequences in multicentric Castleman’s disease. Blood. 1995;86(4):1276–1280. [PubMed] [Google Scholar]
- 3.Gessain A, et al. Kaposi sarcoma-associated herpes-like virus (human herpesvirus type 8) DNA sequences in multicentric Castleman’s disease: is there any relevant association in non-human immunodeficiency virus-infected patients? Blood. 1996;87(1):414–416. [PubMed] [Google Scholar]
- 4.Chadburn A, Cesarman E, Nador RG, Liu YF, Knowles DM. Kaposi’s sarcoma-associated herpesvirus sequences in benign lymphoid proliferations not associated with human immunodeficiency virus. Cancer. 1997;80(4):788–797. doi: 10.1002/(SICI)1097-0142(19970815)80:4<788::AID-CNCR18>3.0.CO;2-P. [DOI] [PubMed] [Google Scholar]
- 5.Chang Y, et al. Identification of herpesvirus-like DNA sequences in AIDS-associated Kaposi’s sarcoma. Science. 1994;266(5192):1865–1869. doi: 10.1126/science.7997879. [DOI] [PubMed] [Google Scholar]
- 6.Chadburn A, Hyjek E, Mathew S, Cesarman E, Said J, Knowles DM. KSHV-positive solid lymphomas represent an extra-cavitary variant of primary effusion lymphoma. Am J Surg Pathol. 2004;28(11):1401–1416. doi: 10.1097/01.pas.0000138177.10829.5c. [DOI] [PubMed] [Google Scholar]
- 7.Nador RG, et al. Primary effusion lymphoma: a distinct clinicopathologic entity associated with the Kaposi’s sarcoma-associated herpes virus. Blood. 1996;88(2):645–656. [PubMed] [Google Scholar]
- 8.Arvanitakis L, et al. Establishment and characterization of a primary effusion (body cavity-based) lymphoma cell line (BC-3) harboring kaposi’s sarcoma-associated herpesvirus (KSHV/HHV-8) in the absence of Epstein-Barr virus. Blood. 1996;88(7):2648–2654. [PubMed] [Google Scholar]
- 9.Matolcsy A, Nádor RG, Cesarman E, Knowles DM. Immunoglobulin VH gene mutational analysis suggests that primary effusion lymphomas derive from different stages of B cell maturation. Am J Pathol. 1998;153(5):1609–1614. doi: 10.1016/S0002-9440(10)65749-5. [DOI] [PMC free article] [PubMed] [Google Scholar]
- 10.Carbone A, et al. Establishment and characterization of EBV-positive and EBV-negative primary effusion lymphoma cell lines harbouring human herpesvirus type-8. Br J Haematol. 1998;102(4):1081–1089. doi: 10.1046/j.1365-2141.1998.00877.x. [DOI] [PubMed] [Google Scholar]
- 11.Carbone A, et al. Expression of MUM1/IRF4 selectively clusters with primary effusion lymphoma among lymphomatous effusions: implications for disease histogenesis and pathogenesis. Br J Haematol. 2000;111(1):247–257. doi: 10.1046/j.1365-2141.2000.02329.x. [DOI] [PubMed] [Google Scholar]
- 12.Du MQ, et al. Kaposi sarcoma-associated herpesvirus infects monotypic (IgM lambda) but polyclonal naive B cells in Castleman disease and associated lymphoproliferative disorders. Blood. 2001;97(7):2130–2136. doi: 10.1182/blood.V97.7.2130. [DOI] [PubMed] [Google Scholar]
- 13.Oksenhendler E, et al. High levels of human herpesvirus 8 viral load, human interleukin-6, interleukin-10, and C reactive protein correlate with exacerbation of multicentric castleman disease in HIV-infected patients. Blood. 2000;96(6):2069–2073. [PubMed] [Google Scholar]
- 14.Powles T, et al. The role of immune suppression and HHV-8 in the increasing incidence of HIV-associated multicentric Castleman’s disease. Ann Oncol. 2009;20(4):775–779. doi: 10.1093/annonc/mdn697. [DOI] [PubMed] [Google Scholar]
- 15.Hamza MS, Reyes RA, Izumiya Y, Wisdom R, Kung HJ, Luciw PA. ORF36 protein kinase of Kaposi’s sarcoma herpesvirus activates the c-Jun N-terminal kinase signaling pathway. J Biol Chem. 2004;279(37):38325–38330. doi: 10.1074/jbc.M400964200. [DOI] [PubMed] [Google Scholar]
- 16.Park J, Lee D, Seo T, Chung J, Choe J. Kaposi’s sarcoma-associated herpesvirus (human herpesvirus-8) open reading frame 36 protein is a serine protein kinase. J Gen Virol. 2000;81(Pt 4):1067–1071. doi: 10.1099/0022-1317-81-4-1067. [DOI] [PubMed] [Google Scholar]
- 17.Haque M, Wang V, Davis DA, Zheng ZM, Yarchoan R. Genetic organization and hypoxic activation of the Kaposi’s sarcoma-associated herpesvirus ORF34-37 gene cluster. J Virol. 2006;80(14):7037–7051. doi: 10.1128/JVI.00553-06. [DOI] [PMC free article] [PubMed] [Google Scholar]
- 18.Davis DA, Singer KE, Reynolds IP, Haque M, Yarchoan R. Hypoxia enhances the phosphorylation and cytotoxicity of ganciclovir and zidovudine in Kaposi’s sarcoma-associated herpesvirus infected cells. Cancer Res. 2007;67(14):7003–7010. doi: 10.1158/0008-5472.CAN-07-0939. [DOI] [PubMed] [Google Scholar]
- 19.Stürzl M, et al. Expression of HHV-8 latency-associated T0.7 RNA in spindle cells and endothelial cells of AIDS-associated, classical and African Kaposi’s sarcoma. Int J Cancer. 1997;72(1):68–71. doi: 10.1002/(SICI)1097-0215(19970703)72:1<68::AID-IJC10>3.0.CO;2-6. [DOI] [PubMed] [Google Scholar]
- 20.Staskus KA, et al. Kaposi’s sarcoma-associated herpesvirus gene expression in endothelial (spindle) tumor cells. J Virol. 1997;71(1):715–719. doi: 10.1128/jvi.71.1.715-719.1997. [DOI] [PMC free article] [PubMed] [Google Scholar]
- 21.Katano H, Sato Y, Kurata T, Mori S, Sata T. Expression and localization of human herpesvirus 8-encoded proteins in primary effusion lymphoma, Kaposi’s sarcoma, and multicentric Castleman’s disease. Virology. 2000;269(2):335–344. doi: 10.1006/viro.2000.0196. [DOI] [PubMed] [Google Scholar]
- 22.Dupin N, et al. Distribution of human herpesvirus-8 latently infected cells in Kaposi’s sarcoma, multicentric Castleman’s disease, and primary effusion lymphoma. Proc Natl Acad Sci U S A. 1999;96(8):4546–4551. doi: 10.1073/pnas.96.8.4546. [DOI] [PMC free article] [PubMed] [Google Scholar]
- 23.Dittmer D, Lagunoff M, Renne R, Staskus K, Haase A, Ganem D. A cluster of latently expressed genes in Kaposi’s sarcoma-associated herpesvirus. J Virol. 1998;72(10):8309–8315. doi: 10.1128/jvi.72.10.8309-8315.1998. [DOI] [PMC free article] [PubMed] [Google Scholar]
- 24.Hosseinipour MC, et al. Viral profiling identifies multiple subtypes of Kaposi’s sarcoma. MBio. 2014;5(5):e01633–e01614. doi: 10.1128/mBio.01633-14. [DOI] [PMC free article] [PubMed] [Google Scholar]
- 25.Bhatt AP, et al. A viral kinase mimics S6 kinase to enhance cell proliferation. Proc Natl Acad Sci U S A. 2016;113(28):7876–7881. doi: 10.1073/pnas.1600587113. [DOI] [PMC free article] [PubMed] [Google Scholar]
- 26.Arias C, et al. KSHV 2.0: a comprehensive annotation of the Kaposi’s sarcoma-associated herpesvirus genome using next-generation sequencing reveals novel genomic and functional features. PLoS Pathog. 2014;10(1):e1003847. doi: 10.1371/journal.ppat.1003847. [DOI] [PMC free article] [PubMed] [Google Scholar]
- 27.Uldrick TS, et al. High-dose zidovudine plus valganciclovir for Kaposi sarcoma herpesvirus-associated multicentric Castleman disease: a pilot study of virus-activated cytotoxic therapy. Blood. 2011;117(26):6977–6986. doi: 10.1182/blood-2010-11-317610. [DOI] [PMC free article] [PubMed] [Google Scholar]
- 28.Li R, et al. Conserved herpesvirus kinases target the DNA damage response pathway and TIP60 histone acetyltransferase to promote virus replication. Cell Host Microbe. 2011;10(4):390–400. doi: 10.1016/j.chom.2011.08.013. [DOI] [PMC free article] [PubMed] [Google Scholar]
- 29.Tarakanova VL, et al. Gamma-herpesvirus kinase actively initiates a DNA damage response by inducing phosphorylation of H2AX to foster viral replication. Cell Host Microbe. 2007;1(4):275–286. doi: 10.1016/j.chom.2007.05.008. [DOI] [PMC free article] [PubMed] [Google Scholar]
- 30.Hollingworth R, Skalka GL, Stewart GS, Hislop AD, Blackbourn DJ, Grand RJ. Activation of DNA damage response pathways during lytic replication of KSHV. Viruses. 2015;7(6):2908–2927. doi: 10.3390/v7062752. [DOI] [PMC free article] [PubMed] [Google Scholar]
- 31.Hwang S, et al. Conserved herpesviral kinase promotes viral persistence by inhibiting the IRF-3-mediated type I interferon response. Cell Host Microbe. 2009;5(2):166–178. doi: 10.1016/j.chom.2008.12.013. [DOI] [PMC free article] [PubMed] [Google Scholar]
- 32.Kuny CV, Chinchilla K, Culbertson MR, Kalejta RF. Cyclin-dependent kinase-like function is shared by the beta- and gamma- subset of the conserved herpesvirus protein kinases. PLoS Pathog. 2010;6(9):e1001092. doi: 10.1371/journal.ppat.1001092. [DOI] [PMC free article] [PubMed] [Google Scholar]
- 33.Fruman DA, Rommel C. PI3K and cancer: lessons, challenges and opportunities. Nat Rev Drug Discov. 2014;13(2):140–156. doi: 10.1038/nrd4204. [DOI] [PMC free article] [PubMed] [Google Scholar]
- 34.Ma XM, Blenis J. Molecular mechanisms of mTOR-mediated translational control. Nat Rev Mol Cell Biol. 2009;10(5):307–318. doi: 10.1038/nrm2672. [DOI] [PubMed] [Google Scholar]
- 35.Shinall SM, Gonzalez-Fernandez M, Noelle RJ, Waldschmidt TJ. Identification of murine germinal center B cell subsets defined by the expression of surface isotypes and differentiation antigens. J Immunol. 2000;164(11):5729–5738. doi: 10.4049/jimmunol.164.11.5729. [DOI] [PubMed] [Google Scholar]
- 36.Brayton CF, Treuting PM, Ward JM. Pathobiology of aging mice and GEM: background strains and experimental design. Vet Pathol. 2012;49(1):85–105. doi: 10.1177/0300985811430696. [DOI] [PubMed] [Google Scholar]
- 37.Kawamoto H, Ikawa T, Ohmura K, Fujimoto S, Katsura Y. T cell progenitors emerge earlier than B cell progenitors in the murine fetal liver. Immunity. 2000;12(4):441–450. doi: 10.1016/S1074-7613(00)80196-X. [DOI] [PubMed] [Google Scholar]
- 38.Curreli S, et al. B cell lymphoma in HIV transgenic mice. Retrovirology. 2013;10:92. doi: 10.1186/1742-4690-10-92. [DOI] [PMC free article] [PubMed] [Google Scholar]
- 39.Chang Y, Paige CJ, Wu GE. Enumeration and characterization of DJH structures in mouse fetal liver. EMBO J. 1992;11(5):1891–1899. doi: 10.1002/j.1460-2075.1992.tb05241.x. [DOI] [PMC free article] [PubMed] [Google Scholar]
- 40.Grivennikov SI, Greten FR, Karin M. Immunity, inflammation, and cancer. Cell. 2010;140(6):883–899. doi: 10.1016/j.cell.2010.01.025. [DOI] [PMC free article] [PubMed] [Google Scholar]
- 41.Shiels MS, et al. Cancer burden in the HIV-infected population in the United States. J Natl Cancer Inst. 2011;103(9):753–762. doi: 10.1093/jnci/djr076. [DOI] [PMC free article] [PubMed] [Google Scholar]
- 42.Goncalves PH, Montezuma-Rusca JM, Yarchoan R, Uldrick TS. Cancer prevention in HIV-infected populations. Semin Oncol. 2016;43(1):173–188. doi: 10.1053/j.seminoncol.2015.09.011. [DOI] [PMC free article] [PubMed] [Google Scholar]
- 43.Borges AH, Dubrow R, Silverberg MJ. Factors contributing to risk for cancer among HIV-infected individuals, and evidence that earlier combination antiretroviral therapy will alter this risk. Curr Opin HIV AIDS. 2014;9(1):34–40. doi: 10.1097/COH.0000000000000025. [DOI] [PMC free article] [PubMed] [Google Scholar]
- 44.Voronov E, et al. IL-1 is required for tumor invasiveness and angiogenesis. Proc Natl Acad Sci U S A. 2003;100(5):2645–2650. doi: 10.1073/pnas.0437939100. [DOI] [PMC free article] [PubMed] [Google Scholar]
- 45.Krelin Y, et al. Interleukin-1beta-driven inflammation promotes the development and invasiveness of chemical carcinogen-induced tumors. Cancer Res. 2007;67(3):1062–1071. doi: 10.1158/0008-5472.CAN-06-2956. [DOI] [PubMed] [Google Scholar]
- 46.Elaraj DM, et al. The role of interleukin 1 in growth and metastasis of human cancer xenografts. Clin Cancer Res. 2006;12(4):1088–1096. doi: 10.1158/1078-0432.CCR-05-1603. [DOI] [PubMed] [Google Scholar]
- 47.Saberi Hosnijeh F, et al. Plasma cytokines and future risk of non-Hodgkin lymphoma (NHL): a case-control study nested in the Italian European Prospective Investigation into Cancer and Nutrition. Cancer Epidemiol Biomarkers Prev. 2010;19(6):1577–1584. doi: 10.1158/1055-9965.EPI-09-1237. [DOI] [PubMed] [Google Scholar]
- 48.Rabkin CS, et al. Circulating cytokine levels, Epstein-Barr viremia, and risk of acquired immunodeficiency syndrome-related non-Hodgkin lymphoma. Am J Hematol. 2011;86(10):875–878. doi: 10.1002/ajh.22119. [DOI] [PMC free article] [PubMed] [Google Scholar]
- 49.Gu Y, et al. Circulating cytokines and risk of B-cell non-Hodgkin lymphoma: a prospective study. Cancer Causes Control. 2010;21(8):1323–1333. doi: 10.1007/s10552-010-9560-3. [DOI] [PMC free article] [PubMed] [Google Scholar]
- 50.Charbonneau B, et al. Pretreatment circulating serum cytokines associated with follicular and diffuse large B-cell lymphoma: a clinic-based case-control study. Cytokine. 2012;60(3):882–889. doi: 10.1016/j.cyto.2012.08.028. [DOI] [PMC free article] [PubMed] [Google Scholar]
- 51.Chauvin C, et al. Ribosomal protein S6 kinase activity controls the ribosome biogenesis transcriptional program. Oncogene. 2014;33(4):474–483. doi: 10.1038/onc.2012.606. [DOI] [PubMed] [Google Scholar]
- 52.Wendel HG, et al. Dissecting eIF4E action in tumorigenesis. Genes Dev. 2007;21(24):3232–3237. doi: 10.1101/gad.1604407. [DOI] [PMC free article] [PubMed] [Google Scholar]
- 53.Wendel HG, et al. Survival signalling by Akt and eIF4E in oncogenesis and cancer therapy. Nature. 2004;428(6980):332–337. doi: 10.1038/nature02369. [DOI] [PubMed] [Google Scholar]
- 54.Flynn A, Proud CG. Serine 209, not serine 53, is the major site of phosphorylation in initiation factor eIF-4E in serum-treated Chinese hamster ovary cells. J Biol Chem. 1995;270(37):21684–21688. doi: 10.1074/jbc.270.37.21684. [DOI] [PubMed] [Google Scholar]
- 55.Topisirovic I, Ruiz-Gutierrez M, Borden KL. Phosphorylation of the eukaryotic translation initiation factor eIF4E contributes to its transformation and mRNA transport activities. Cancer Res. 2004;64(23):8639–8642. doi: 10.1158/0008-5472.CAN-04-2677. [DOI] [PubMed] [Google Scholar]
- 56.Robichaud N, et al. Phosphorylation of eIF4E promotes EMT and metastasis via translational control of SNAIL and MMP-3. Oncogene. 2015;34(16):2032–2042. doi: 10.1038/onc.2014.146. [DOI] [PMC free article] [PubMed] [Google Scholar]
- 57.Fan S, Ramalingam SS, Kauh J, Xu Z, Khuri FR, Sun SY. Phosphorylated eukaryotic translation initiation factor 4 (eIF4E) is elevated in human cancer tissues. Cancer Biol Ther. 2009;8(15):1463–1469. doi: 10.4161/cbt.8.15.8960. [DOI] [PMC free article] [PubMed] [Google Scholar]
- 58.Lejbkowicz F, Goyer C, Darveau A, Neron S, Lemieux R, Sonenberg N. A fraction of the mRNA 5’ cap-binding protein, eukaryotic initiation factor 4E, localizes to the nucleus. Proc Natl Acad Sci U S A. 1992;89(20):9612–9616. doi: 10.1073/pnas.89.20.9612. [DOI] [PMC free article] [PubMed] [Google Scholar]
- 59.Dostie J, Lejbkowicz F, Sonenberg N. Nuclear eukaryotic initiation factor 4E (eIF4E) colocalizes with splicing factors in speckles. J Cell Biol. 2000;148(2):239–247. doi: 10.1083/jcb.148.2.239. [DOI] [PMC free article] [PubMed] [Google Scholar]
- 60.Bhatt AP, Bhende PM, Sin SH, Roy D, Dittmer DP, Damania B. Dual inhibition of PI3K and mTOR inhibits autocrine and paracrine proliferative loops in PI3K/Akt/mTOR-addicted lymphomas. Blood. 2010;115(22):4455–4463. doi: 10.1182/blood-2009-10-251082. [DOI] [PMC free article] [PubMed] [Google Scholar]
- 61.Bais C, et al. G-protein-coupled receptor of Kaposi’s sarcoma-associated herpesvirus is a viral oncogene and angiogenesis activator. Nature. 1998;391(6662):86–89. doi: 10.1038/34193. [DOI] [PubMed] [Google Scholar]
- 62.Yang TY, et al. Transgenic expression of the chemokine receptor encoded by human herpesvirus 8 induces an angioproliferative disease resembling Kaposi’s sarcoma. J Exp Med. 2000;191(3):445–454. doi: 10.1084/jem.191.3.445. [DOI] [PMC free article] [PubMed] [Google Scholar]
- 63.Guo HG, Sadowska M, Reid W, Tschachler E, Hayward G, Reitz M. Kaposi’s sarcoma-like tumors in a human herpesvirus 8 ORF74 transgenic mouse. J Virol. 2003;77(4):2631–2639. doi: 10.1128/JVI.77.4.2631-2639.2003. [DOI] [PMC free article] [PubMed] [Google Scholar]
- 64.Ballon G, Chen K, Perez R, Tam W, Cesarman E. Kaposi sarcoma herpesvirus (KSHV) vFLIP oncoprotein induces B cell transdifferentiation and tumorigenesis in mice. J Clin Invest. 2011;121(3):1141–1153. doi: 10.1172/JCI44417. [DOI] [PMC free article] [PubMed] [Google Scholar]
- 65.Sin SH, Dittmer DP. Viral latency locus augments B-cell response in vivo to induce chronic marginal zone enlargement, plasma cell hyperplasia, and lymphoma. Blood. 2013;121(15):2952–2963. doi: 10.1182/blood-2012-03-415620. [DOI] [PMC free article] [PubMed] [Google Scholar]
- 66.Sin SH, Kim Y, Eason A, Dittmer DP. KSHV Latency Locus Cooperates with Myc to Drive Lymphoma in Mice. PLoS Pathog. 2015;11(9):e1005135. doi: 10.1371/journal.ppat.1005135. [DOI] [PMC free article] [PubMed] [Google Scholar]
- 67.Verschuren EW, Klefstrom J, Evan GI, Jones N. The oncogenic potential of Kaposi’s sarcoma-associated herpesvirus cyclin is exposed by p53 loss in vitro and in vivo. Cancer Cell. 2002;2(3):229–241. doi: 10.1016/S1535-6108(02)00123-X. [DOI] [PubMed] [Google Scholar]
- 68.Verschuren EW, Hodgson JG, Gray JW, Kogan S, Jones N, Evan GI. The role of p53 in suppression of KSHV cyclin-induced lymphomagenesis. Cancer Res. 2004;64(2):581–589. doi: 10.1158/0008-5472.CAN-03-1863. [DOI] [PubMed] [Google Scholar]
- 69.Carbone A, et al. Expression profile of MUM1/IRF4, BCL-6, and CD138/syndecan-1 defines novel histogenetic subsets of human immunodeficiency virus-related lymphomas. Blood. 2001;97(3):744–751. doi: 10.1182/blood.V97.3.744. [DOI] [PubMed] [Google Scholar]
- 70.Arguello M, et al. Disruption of the B-cell specific transcriptional program in HHV-8 associated primary effusion lymphoma cell lines. Oncogene. 2003;22(7):964–973. doi: 10.1038/sj.onc.1206270. [DOI] [PubMed] [Google Scholar]
- 71.Carbone A, Gloghini A, Capello D, Gaidano G. Genetic pathways and histogenetic models of AIDS-related lymphomas. Eur J Cancer. 2001;37(10):1270–1275. doi: 10.1016/S0959-8049(01)00119-8. [DOI] [PubMed] [Google Scholar]
- 72.Li S, Eshleman JR, Borowitz MJ. Lack of surface immunoglobulin light chain expression by flow cytometric immunophenotyping can help diagnose peripheral B-cell lymphoma. Am J Clin Pathol. 2002;118(2):229–234. doi: 10.1309/57G0-1BNF-KB9R-L4HN. [DOI] [PubMed] [Google Scholar]
- 73.Kaleem Z, Zehnbauer BA, White G, Zutter MM. Lack of expression of surface immunoglobulin light chains in B-cell non-Hodgkin lymphomas. Am J Clin Pathol. 2000;113(3):399–405. doi: 10.1309/28ED-MM0T-DT3B-MT4P. [DOI] [PubMed] [Google Scholar]
- 74.Picker LJ, Weiss LM, Medeiros LJ, Wood GS, Warnke RA. Immunophenotypic criteria for the diagnosis of non-Hodgkin’s lymphoma. Am J Pathol. 1987;128(1):181–201. [PMC free article] [PubMed] [Google Scholar]
- 75.Davis DA, et al. Hypoxia induces lytic replication of Kaposi sarcoma-associated herpesvirus. Blood. 2001;97(10):3244–3250. doi: 10.1182/blood.V97.10.3244. [DOI] [PubMed] [Google Scholar]
- 76.Mesri EA, Cesarman E, Boshoff C. Kaposi’s sarcoma and its associated herpesvirus. Nat Rev Cancer. 2010;10(10):707–719. doi: 10.1038/nrc2888. [DOI] [PMC free article] [PubMed] [Google Scholar]
- 77.Deloose ST, Smit LA, Pals FT, Kersten MJ, van Noesel CJ, Pals ST. High incidence of Kaposi sarcoma-associated herpesvirus infection in HIV-related solid immunoblastic/plasmablastic diffuse large B-cell lymphoma. Leukemia. 2005;19(5):851–855. doi: 10.1038/sj.leu.2403709. [DOI] [PubMed] [Google Scholar]
- 78.Dupin N, et al. HHV-8 is associated with a plasmablastic variant of Castleman disease that is linked to HHV-8-positive plasmablastic lymphoma. Blood. 2000;95(4):1406–1412. [PubMed] [Google Scholar]
- 79.Dong HY, Scadden DT, de Leval L, Tang Z, Isaacson PG, Harris NL. Plasmablastic lymphoma in HIV-positive patients: an aggressive Epstein-Barr virus-associated extramedullary plasmacytic neoplasm. Am J Surg Pathol. 2005;29(12):1633–1641. doi: 10.1097/01.pas.0000173023.02724.1f. [DOI] [PubMed] [Google Scholar]
- 80.Tavares MR, Pavan IC, Amaral CL, Meneguello L, Luchessi AD, Simabuco FM. The S6K protein family in health and disease. Life Sci. 2015;131:1–10. doi: 10.1016/j.lfs.2015.03.001. [DOI] [PubMed] [Google Scholar]
- 81.Harada H, Andersen JS, Mann M, Terada N, Korsmeyer SJ. p70S6 kinase signals cell survival as well as growth, inactivating the pro-apoptotic molecule BAD. Proc Natl Acad Sci U S A. 2001;98(17):9666–9670. doi: 10.1073/pnas.171301998. [DOI] [PMC free article] [PubMed] [Google Scholar]
- 82.Blombery PA, Wall M, Seymour JF. The molecular pathogenesis of B-cell non-Hodgkin lymphoma. Eur J Haematol. 2015;95(4):280–293. doi: 10.1111/ejh.12589. [DOI] [PubMed] [Google Scholar]
- 83.Izumiya Y, et al. Kaposi’s sarcoma-associated herpesvirus-encoded protein kinase and its interaction with K-bZIP. J Virol. 2007;81(3):1072–1082. doi: 10.1128/JVI.01473-06. [DOI] [PMC free article] [PubMed] [Google Scholar]
Associated Data
This section collects any data citations, data availability statements, or supplementary materials included in this article.


