Abstract
Background
Currently, there is no established non-invasive imaging approach to directly evaluate myocardial microcirculatory function in order to diagnose microvascular disease independent of co-existing epicardial disease. In this work, we developed a methodological framework for quantification of intramyocardial blood volume (IMBV) as a novel index of microcirculatory function with SPECT/CT imaging of 99mTc-labeled red blood cells (RBCs).
Methods
Dual-gated myocardial SPECT/CT equilibrium imaging of 99mTc-RBCs was performed on twelve canines under resting conditions. Five correction schemes were studied: cardiac gating with no other corrections (CG), CG with attenuation correction (CG 1 AC), CG 1 AC with scatter correction (CG 1 AC 1 SC), dual cardiorespiratory gating with AC 1 SC (DG 1 AC 1 SC), and DG 1 AC 1 SC with partial volume correction (DG 1 AC 1 SC 1 PVC). Quantification of IMBV using each approach was evaluated in comparison to those obtained from all corrections. The in vivo SPECT estimates of IMBV values were validated against those obtained from ex vivo microCT imaging of the casted hearts.
Results
The estimated IMBV with all corrections was 0.15 ± 0.03 for the end-diastolic phase and 0.11 ± 0.03 for the end-systolic phase. The cycle-dependent change in IMBV (ΔIMBV) with all corrections was 23.9 ± 8.6%. Schemes that applied no correction or partial correction resulted in significant over-estimation of IMBV and significant under-underestimation of ΔIMBV. Estimates of IMBV and ΔIMBV using all corrections were consistent with values reported in the literature using invasive techniques. In vivo SPECT estimates of IMBV strongly correlated (R2 ≥ 0.70) with ex vivo measures for the various correction schemes, while the fully corrected scheme yielded the smallest bias.
Conclusions
Non-invasive quantification of IMBV is feasible using 99mTc-RBCs SPECT/CT imaging, however, requires full compensation of physical degradation factors.
Keywords: Intramyocardial blood volume, partial volume correction, SPECT-CT imaging, microCT, coronary microcirculation, cardio-respiratory motion correction
INTRODUCTION
Ischemic heart disease (IHD) remains a leading cause of death worldwide, accounting for 17.3 million deaths per year,1 a number that is expected to increase by 36% by 2030. IHD can be attributed to obstructive coronary artery disease (CAD) and/or coronary microvascular disease (CMD). CMD is characterized by structural and functional impairments of the coronary microcirculation (<500 µm), while CAD affects the larger diameter epicardial arteries (>500 µm). Quantification of myocardial blood flow (MBF) and coronary flow reserve (CFR) using positron emission tomography (PET) with radiotracers such as 82Rubidium, 13N-Ammonia, or 15O-water provides one of the most widely applied non-invasive imaging approaches for evaluation and management of patients with IHD,2–4 however, these methods cannot separate CAD from CMD. Currently, there is no single non-invasive approach to directly evaluate coronary microcirculatory function independent of CAD in order to diagnose MVD and monitor response to treatment.
CMD exists in a large proportion of patients with IHD and other cardiovascular diseases (i.e. hypertrophic heart disease, aortic stenosis) and may occur in individuals with and without CAD.5–7 A recent study reported that approximately two-thirds of patients with chest pain and non-obstructive CAD had some degree of microvascular dysfunction.8 Longitudinal studies indicate that CMD increases the risk of mortality independent of CAD.9–11 The exact mechanisms of CMD are unclear, although many risk factors have been proposed to contribute to CMD, such as chronic inflammation,12 insulin resistance,13 obesity,14 and chemotherapy and radiation therapy.15
The microvasculature dynamically maintains coronary perfusion in response to changes in metabolism or perfusion pressure through the process of autoregulation. In the presence of an epicardial coronary stenosis of increasing severity (up to approximately 85% diameter stenosis) there is maintenance of resting flow via microvascular recruitment and expansion of the intramyocardial blood volume (IMBV, fraction of myocardium volume that is occupied by blood) distal to the stenotic vessel through vasodilatation.16 Since changes in IMBV represent functional changes in the microvasculature in response to changes in homeostatic coronary perfusion, the measurement of resting and cycle-dependent changes in IMBV have been proposed as sensitive biomarkers of coronary microcirculatory function. In addition, patients with coronary MVD are expected to have decreased resting IMBV compared to subjects without microvascular disease due to microvascular rarefaction.17,18 Therefore, non-invasive measurement of IMBV is an ideal approach to study the coronary microcirculatory capacitance and function, and may offer a novel approach to detect CMD independent of epicardial CAD.
Ex-vivo radio-labeled red blood cell (RBC) studies have been previously proposed for measuring IMBV since RBCs remain intravascularly,19,20 except under conditions of severe vascular injury. Thus, the quantification of 99mTc-labeled-RBCs within the myocardial vasculature through non-invasive nuclear imaging provides a novel method to quantify the dynamic changes in IMBV in vivo. Therefore, the use of SPECT/CT 99mTc-RBC imaging to detect CMD could have a significant impact on clinical practice and management of patients with cardiovascular disease.
Critical technical issues may result in physical degradation of SPECT images and compromise quantitative accuracy of our estimation of IMBV.21,22 We propose a novel imaging approach that enables quantification of IMBV over the cardiac cycle that employs cardiorespiratory-gated 99mTc-RBC SPECT/CT imaging, along with techniques for correction of scatter, attenuation, and partial volume effects. Pre-clinical imaging studies were performed under resting conditions with a dedicated cardiac hybrid SPECT/CT system, and IMBV was estimated in the end-diastolic and end-systolic phases of the cardiac cycle. We systematically evaluated the impact of various correction schemes to improve our quantification of IMBV.
MATERIALS AND METHODS
Animal Preparation
Twelve retired female beagle breeders (weight 10.8 ± 1.0 kg) were scanned during this project. All experiments were performed in accordance with Yale University Institutional Animal Care and Use Committee standards and approval. All dogs were purchased from a commercial laboratory animal supplier (Marshall BioResources) and were acclimatized to their new environment and fed a standard diet for at least five days prior performing any procedures.
Dogs were sedated with propofol (5–7.5 mg/kg) via intravenous (IV) injection in the foreleg cephalic vein, and then were rapidly intubated for mechanical ventilation (Veturi; Cardiopulmonary Corp. Milford, CT) and anesthesia maintenance. Anesthesia was maintained with 1.0%-2.0% isoflurane, 45% nitrous oxide, and 55% oxygen. The level of anesthesia was monitored and adjusted based on heart rate, blink reflex, and jaw tone. Blood gases, electrolytes (VetStat Electrolyte and Blood Gas Analyzer, IDEXX Laboratories) and hematocrit were serially measured throughout the study and ventilator settings adjusted accordingly to maintain gases in the physiological conditions. Cardiac rhythm and rate (ECG), oxygen saturation (pulse oximeter), and body temperature (rectal temperature probe) were monitored via a Phillips InteliVue MP50 monitor. Aortic and left ventricular (LV) pressures were measured with a dual pressure large animal catheter (Millar, Inc.) connected with a Bridge Amp (AD Instruments) to a PowerLab (AD instruments) data acquisition system. Following a small carotid cut-down (4 cm), a 7F introducer sheath was placed in the right carotid artery. The 5F pressure catheter was then inserted into the sheath and was placed in the LV and aorta under fluoroscopic guidance (Philips Allura Xper FD20, Philips Medical), while simultaneously monitoring pressure waveforms. Cardiac rhythm and rate and central pressures were continuously monitored throughout the experiment with a dedicated workstation and software package (LabChart 8.0, AD Instruments) that was also used for subsequent offline data analysis, while other vital signs were recorded every 15 minutes. IV fluids were administered through cephalic vein access.
RBC Labeling
Prior to imaging, arterial blood (~3 mL) was withdrawn from a femoral artery catheter into a heparinized vacutainer. Under sterile conditions, RBCs were labeled in vitro with sodium pertechnetate (10–25 mCi) in a reaction vial with the FDA-approved ULTRATAG® RBC kit (Mallinkckrodt inc, St Louis, MO). Immediately following RBC labeling (~30 minutes), 99mTc-labeled RBCs (18.8 ± 4.3 mCi) were intravenously injected into the animal and allowed to recirculate for 15 minutes before initiation of equilibrium blood-pool SPECT imaging.
Hybrid SPECT/CT Imaging
Imaging was performed using a dedicated cardiac hybrid SPECT/CT system (GE Discovery NM/CT 570c) equipped with 19 solid-state CZT pixelated detector modules and focused pinhole collimators to enable stationary cardiorespiratory-gated cardiac SPECT imaging.23 These modules yield a 32 × 32 × 19 projection matrix with a pixel size of 2.46 × 2.46 mm2. The pinhole collimators focus on the heart with a FOV of ~ 19 cm in diameter and a spatial resolution of about 7 mm FWHM in the center of FOV.24 The system also incorporates a 64-slice CT scanner to generate non-contrast and contrast-enhanced CT images.
The SPECT data was acquired in list-mode over 10 minutes under resting conditions, with dual-gating for respiratory (5 gates) and cardiac (8 gates) motion correction using a dual respiratory-cardiac gating box (Ivy Biomedical Systems, Branford, CT, USA).25 A low-dose (non-contrast) CT was acquired for attenuation correction (CTAC) immediately following SPECT imaging with the following parameters: 120 kVp, 20 mA, a slice thickness of 5 mm, pitch of 0.97:1, and a rotation speed of 0.8 seconds. The CTAC was reconstructed with a filtered back projection (FBP) algorithm. Following the CTAC, a contrast-enhanced CT (CECT) was performed with retrospective ECG gating (10 cardiac gates) during end-expiration. End-expiration for the CECT was achieved by temporarily disconnecting the animal from the ventilator. Iodinated contrast (Omnipaque, GE Healthcare) was administered centrally via the femoral vein using a power injector (Stellant D; MEDRAD, Warrendale, PA) interfaced with the CT camera and was delivered using a 3-phase injection at a constant flow rate of 3 mL/second (contrast: 10 mL; contrast (50%)/0.9% saline (50%); 5 mL and 0.9% saline; 10 mL). A timing bolus acquisition (120 kVp, 80 mA) was first performed to determine the optimal timing delay necessary for near equal opacification of the left and right ventricles. The acquisition parameters of the CECT were: 120 kVp, 350 mA, a slice thickness of 0.625 mm, a pitch of 0.24:1 and a rotation speed of 0.8 seconds. The CECT was also reconstructed with FBP.
SPECT Image Reconstruction and Data Correction
SPECT list-mode data was rebinned into five respiratory and eight cardiac gates using an offline rebin algorithm.25 The respiratory motion trace showed minimal motion in the second, third, and fourth respiratory gates, corresponding to end-expiration phase. Dual-motion correction was performed by summing the motion-free end-expiration respiratory gates to yield a high-count projection data for each cardiac phase. An energy window of 133–148 keV was used to generate the aforementioned primary projection data. Scatter projection data was generated by using a secondary energy window of 105–130 keV and was used to facilitate a previously developed scatter correction method dedicated for pinhole CZT SPECT.26 In this study we focused on the end-diastolic and end-systolic cardiac phases.
SPECT images were reconstructed using the maximum likelihood expected-maximization algorithm27 (MLEM, maximum iterations 80). Attenuation and scatter correction was performed within the MLEM reconstruction framework. A body-contour (BC) was delineated using the CT attenuation map to constrain the spatial support for image reconstruction.28 Forward and back projections were implemented with a precomputed system matrix incorporated with collimator-detector response (GE Healthcare).
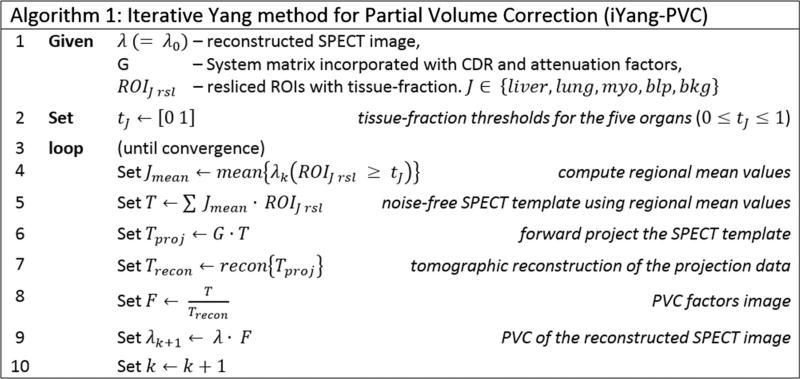
Post-reconstruction partial volume correction (PVC) was performed on the end-diastolic and end-systolic cardiac phases as follows:29,30 (1) CECT images from the end-diastolic and end-systolic phases were rigidly registered to the attenuation map using Vinci1 4.38 software.31 Care was taken to ensure that the resulting CECT images were also registered with the phase-matched reconstructed SPECT images. (2) Multi-organ segmentation of CECT images was performed manually using MITK2 software.32 Five regions (ROIs) were segmented that included the liver (ROIliver), lung (ROIlung), myocardium (ROImyo), blood pool (ROIblp), and background (ROIbkg). (3) High-resolution ROIs were resliced at the SPECT resolution to obtain voxel-wise tissue-fraction maps for each organ (ROIliver rsl, ROIlung rsl, ROImyo rsl, ROIblp rsl, ROIbkg rsl).30 (4) Re-sliced ROIs were used to estimate and correct for partial volume effects using the proposed iterative Yang33 approach (iYang-PVC) outlined in Algorithm 1 (Figure 1).
Figure 1.
Iterative Yang method for partial volume correction (iYang-PVC).
PVC is performed by voxel-wise scaling of the reconstructed SPECT image, λ, with PVC factor image F (Step 9, Algorithm 1). F is obtained as an element-by-element ratio of template image, T, and reconstructed template image Trecon (Step 8, Algorithm 1). T is formed by scaling the resliced ROIs with corresponding regional mean values obtained in Step 4 (Algorithm 1) followed by an additive combination (Step 5, Algorithm 1). T incorporates tissue-fraction effects at the organ boundaries and is forward projected and reconstructed, using the SPECT system matrix and attenuation map, to yield Trecon (Step 7, Algorithm 1). For each iteration, k, refined estimates of regional mean values are computed using the previous partial volume compensated SPECT image. This process is iterated till no further significant changes are observed in regional mean values. The iYang-PVC is practical to implement and converged within 10 iterations in our experiments. This approach required access to the SPECT system matrix for forward and back projection operations. The system matrix for dedicated cardiac SPECT scanner has a size of ~0.5 GB and can be saved on a laptop. Projection operations were implemented as matrix-vector products in MATLAB version 9.1.0.441655 (R2016b).
The following set of images were obtained: (a) CG: end-diastolic/end-systolic data obtained from cardiac gating with no respiratory gating (i.e. summed projection data for the five respiratory gates) or other physical corrections. (b) CG + AC: similar to (a) above with the inclusion of attenuation correction. (c) CG + AC + SC: similar to (b) above with the inclusion of scatter correction.26 (d) DG + AC + SC: end-diastolic/end-systolic data with end-expiration respiratory gating with incorporation of attenuation correction and scatter correction. (e) DG + AC + SC + PVC: similar to (d) above with additional PVC using iYang-PVC (Algorithm 1, Figure 1). This approach represents the fully corrected dataset to which all other approaches were compared.
IMBV Quantification
To quantify IMBV, we applied the resliced myocardium (ROImyo rsl) and blood-pool (ROILV-blp rsl) masks onto the reconstructed SPECT images to compute the mean activity in the myocardium (Cmyo) and the left ventricular (LV) blood pool (CLV-blp). In addition, we quantified IMBV at the end-diastolic (IMBVdiastole) and end-systolic (IMBVsystole) phases of the cardiac cycle to study cycle-dependent changes in IMBV (ΔIMBV) under resting conditions. IMBV and ΔIMBV are computed as follows:
Ex-vivo Validation Using MicroCT
To validate our in vivo SPECT approach for IMBV quantification, we performed high-resolution microCT coronary angiograms in explanted casted hearts for six out of the twelve dogs. Ex vivo coronary angiograms and microCT imaging have been previously used as a validation tool to quantify intramyocardial blood volume.34 In order to cast the hearts in the end-diastole phase, animals were euthanized via IV injection of saturated potassium chloride following a heparin bolus (20,000 units). Following euthanasia, the heart was rapidly excised and rinsed in a saline bath. The left main coronary artery was then dissected and cannulated through the aortic left main ostium with polyethylene tubing (PE-200). The PE tubing was connected to a saline filled flask with a manometer. The left coronary arteries were rinsed with saline to expel intravascular blood at a physiological pressure of 120 mmHg. After the saline rinse, the left sided vessels were perfused at a pressure of 120 mmHg with either a 5% gelatin solution containing 10% (weight/volume) bismuth particles (300–500 nm) (N = 3), a 1% gelatin solution containing 5–10% (weight/volume) copper (Cu) particles (1–5 µm) (N = 2), or a combination of 10% Cu particles in 1% gelatin solution and 10% Tungsten particles (10–20 µm) in 10% gelatin solution (N = 1), until the solution began to empty into the right ventricular cavity. Larger particles were chosen mid-study to avoid vascular leakiness observed with bismuth nanoparticles that required additional image postprocessing. The cavities were rinsed with saline and the heart was placed in a chilled saline (4 °C) bath for 5–10 minutes to allow the gelatin to set. After the gelatin was set, the heart was fixed in 10% buffered formalin for 24–48 hours.
After fixation, the heart was imaged using a high-resolution microCT scanner (eXplore CT120, GE Healthcare) with a ~25 µm reconstruction resolution. The CT scan was operated at 80 kVp, 32 mA, 100 millisecond per projection, 1200 projections, 1 × 1 detector binning model, 360° angle range, and 0.3° increments per view. Two scans were needed to cover the entire heart in the z-axis. These acquisitions resulted in two sets of contiguous VFF-formatted images of the entire heart. After initial reconstruction to stitch the two sets of images together, microCT data were transferred to the Advanced Workstation (version 4.4; GE Healthcare) and different post-processing techniques were applied to determine the optimal segmentation parameters.
IMBVµCT is the IMBV derived from the microCT scans and was computed as follows: (1) The microCT image was globally thresholded in the range of −200 to 1000 HU to eliminate non-tissue voxels and those with excessive accumulation of contrast due to vascular leaking. (2) The LV and right ventricular (RV) myocardium were manually segmented using MITK software. (3) The HU in the RV myocardium was computed using the mask from the previous step. Canines have left dominant coronary circulation and, since only the left main coronary artery was perfused with contrast, only the LV myocardium was perfused with contrast and not the RV. Therefore, we used the mean HU and the standard deviation of the RV myocardium (µRV and σRV respectively) to define the attenuation attributed to the myocardial tissue. In some cases, animals had anomalous coronary anatomy that led to some, but not all, of the RV being perfused with contrast. In these cases, only the portion of the RV that was not perfused with contrast was segmented and used to compute RV myocardial HUs. (4) The LV myocardium was thresholded with a lower bound of µRV + kσRV. The appropriate choice of k was made at the threshold where the RV myocardium just disappeared from the microCT image. For four out of six dogs, k was chosen to be 1.5 and for the remaining two dogs, with more streaking artifacts due to contrast leaking, k was chosen to be 2.5. (5) Finally, the IMBVµCT was determined as the ratio between the number of thresholded voxels in the previous step, which were considered the myocardial vasculature, and the total number of voxels in the LV myocardium (IMBVµCT = Contrast filled LV voxels/Total LV voxels).
Statistical Analysis
IMBV and ΔIMBV obtained with and without corrections were computed and expressed as mean ± standard deviation (µ ± σ) for all 12 animals. IMBV and ΔIMBV obtained from the fully corrected data set (i.e. DG + AC + SC + PVC) was considered as reference truth for subsequent statistical analysis. Student t test analysis was used to test if significant differences existed between the mean of IMBV (and, similarly, ΔIMBV) obtained from uncorrected and partially corrected data and the reference truth. Likewise, F test statistic was used to compare standard deviations (σ) between various correction schemes. Coefficient of variation (COV) was computed as the ratio of σ/µ and provided a surrogate measure of variability in the dataset. For each no/partial correction scheme, a scatter plot was generated and correlated with reference truth using linear regression (R2 analysis). Quantitative agreement between uncorrected and partially corrected data and the reference truth was studied with Bland-Altman analysis. 95% confidence interval (CI) of agreement were plotted as µ ± RPC, where RPC is defined as coefficient of repeatability (±1.96σ). Graphical analysis was carried out using a fused scatter-box plot. For each correction scheme, physiological parameters from the end-diastolic and end-systolic phases were pooled-in to create a larger data set. A P value of less than 0.05 was considered statistically significant. For validation of in vivo measures, correlation plots, and correlation coefficients were generated between IMBV derived from SPECT and ex vivo microCT imaging for various correction schemes.
RESULTS
Resting Hemodynamics
Resting (anesthetized) hemodynamics of the dog studies are summarized in Table 1. Differences in resting cardiac metabolic demand were identified using the rate pressure product (RPP). RPP is defined as the product of systolic blood pressure and heart rate. COV of the resting cardiac metabolic demand among dogs was 18.9%.
Table 1.
Resting hemodynamics
| N = 12 dogs | LV (µ ± σ) | Aortic (µ ± σ) |
|---|---|---|
| Systolic pressure (mmHg) | 82.5 ± 7.2 | 82.1 ± 8.3 |
| Diastolic pressure (mmHg) | 11.7 ± 4.2 | 53.2 ± 8.1 |
| Pulse pressure (mmHg) | 70.8 ± 8.0 | 28.9 ± 8.3 |
| Heart rate (bpm) | 95.7 ± 12.2 | 92.0 ± 12.4 |
| Rate pressure product (mmHg bpm) | 7583.7 ± 1429.7 |
Qualitative Analysis of SPECT Images
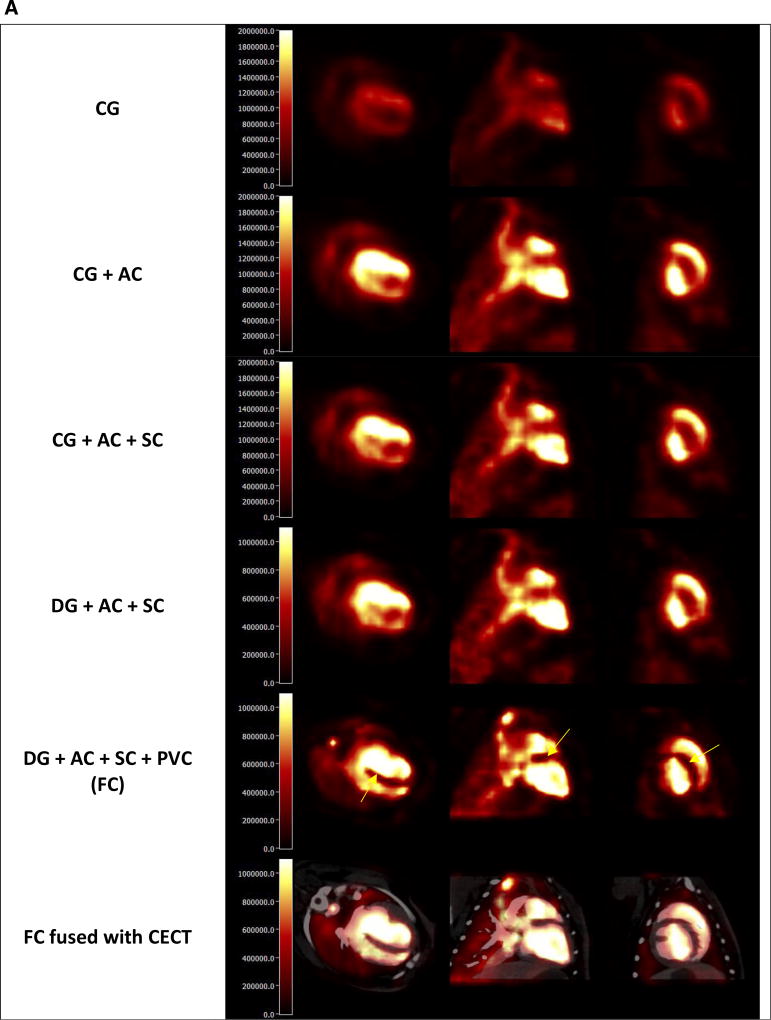
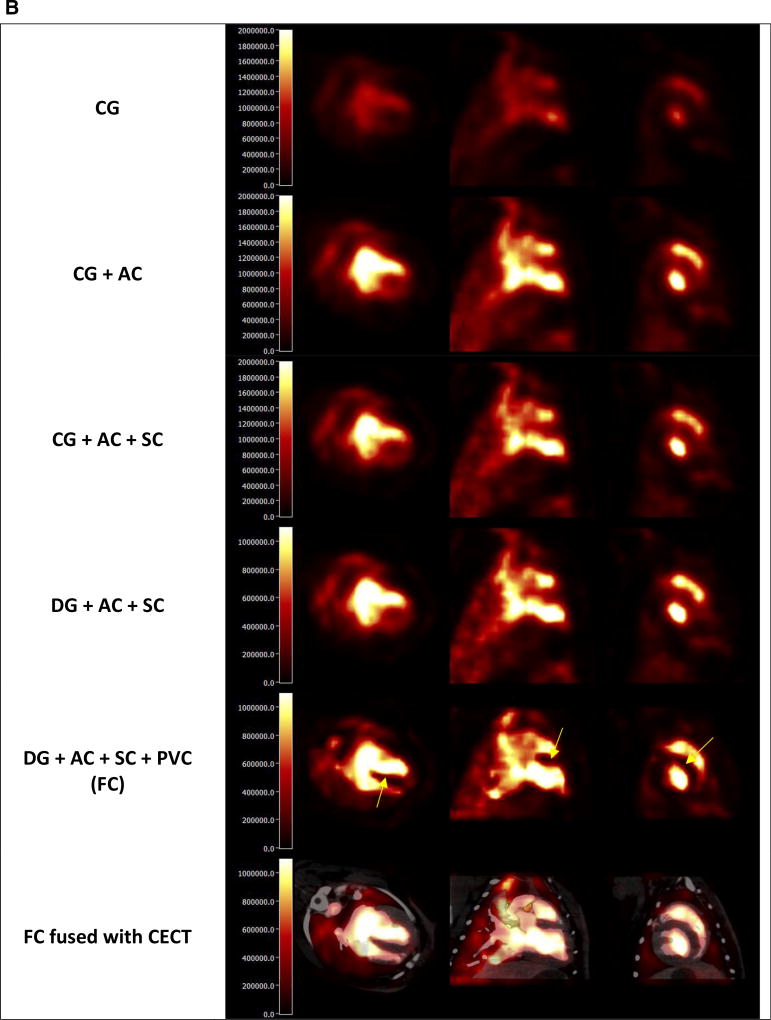
Figure 2 shows representative reconstructed SPECT images (end-diastolic and end-systolic phases) derived using various correction schemes. Visual inspection reveals that the fully corrected dataset (DG + AC + SC + PVC) provides images with superior quality, enhanced contrast/resolution, and sharp functional boundaries. Contrast enhancement is particularly visible in the septal region where spillover of activity occurs from both the LV and RV blood pool. Without PVC, myocardium-to-blood pool contrast is lower along the lateral-inferior wall and higher in the septal region. With PVC, intramyocardial RBC activity is homogenous, and the contrast is evenly restored over the entire left ventricular myocardium.
Figure 2.
Transaxial, coronal, and sagittal slices of reconstructed SPECT image with different correction schemes: (A) End-Diastolic Phase, (B) End-Systolic Phase. CG: no physical corrections, CG + AC: attenuation correction only, CG + AC + SC: attenuation and scatter correction, DG + AC + SC: respiratory gating, attenuation and scatter correction, DG + AC + SC + PVC: Dual-gating, attenuation, scatter, and partial volume correction (FC fully corrected), and FC fused with CECT: fully corrected dataset fused with co-registered, phase-matched contrast-enhanced CT. Fully corrected dataset (DG + AC + SC + PVC) provides images with superior quality, enhanced contrast/resolution and sharp functional boundaries.
Assessment of IMBV Quantification
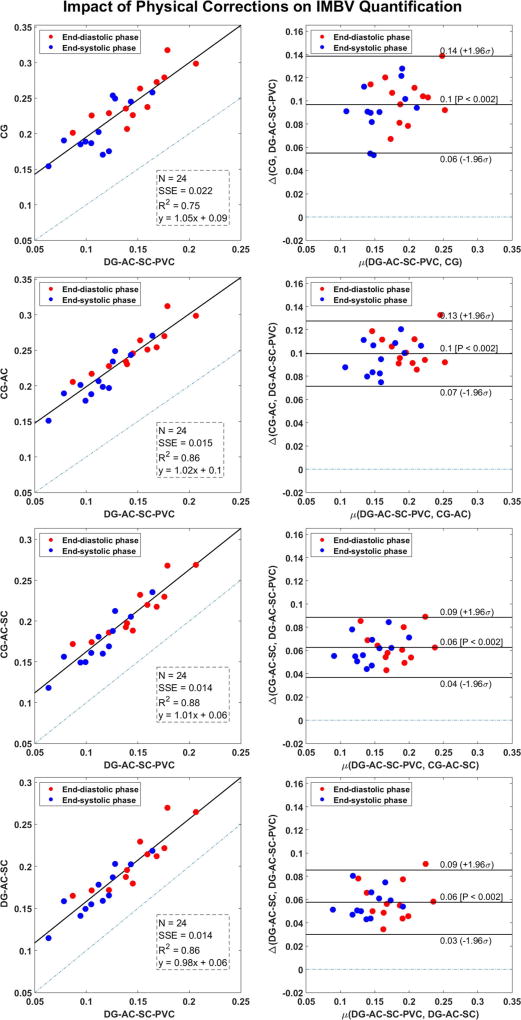
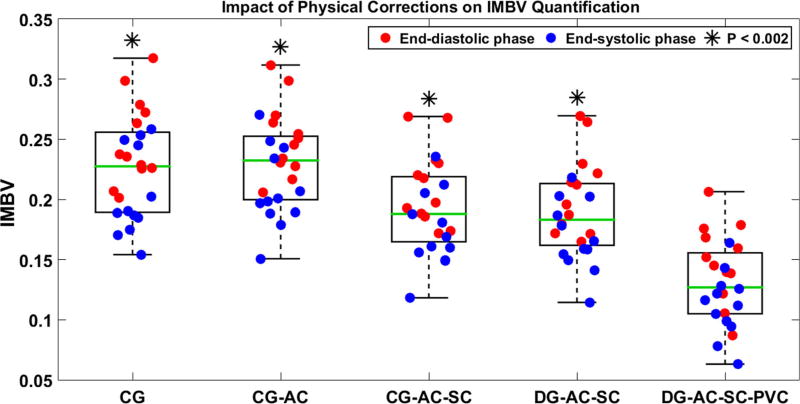
The application of no correction or partial correction schemes resulted in significant over-estimation of IMBV (P < 0.002) in the end-diastolic and end-systolic phases as compared to fully corrected data (Table 2). Bland-Altman analysis showed that compensation of all degradation factors significantly reduced positive bias in our estimation of IMBV (Figure 3). In the diastolic phase, compared to CG, CG + AC, CG + AC + SC, and DG + AC + SC correction schemes, the DG + AC + SC + PVC with all corrections provided 68%, 69%, 43%, and 40% reduction in bias in the quantitative estimation of IMBV, respectively relative to the other schemes. Likewise, in the systolic phase, we obtained a bias reduction of 82%, 86%, 54%, and 50%, respectively.
Table 2.
IMBV at end-diastolic and end-systolic phases using various correction schemes
| IMBV
|
||
|---|---|---|
| (N = 12) | End-diastolic phase | End-systolic phase |
| CG | 0.25 ± 0.04 (P < 0.002) | 0.21 ± 0.04 (P < 0.002) |
| CG + AC | 0.25 ± 0.03 (P < 0.002) | 0.21 ± 0.03 (P < 0.002) |
| CG + AC + SC | 0.21 ± 0.03 (P < 0.002) | 0.17 ± 0.03 (P < 0.002) |
| DG + AC + SC | 0.21 ± 0.04 (P < 0.002) | 0.17 ± 0.03 (P < 0.002) |
| DG + AC + SC + PVC | 0.15 ± 0.03 | 0.11 ± 0.03 |
Each approach was compared (paired t test) to the reference fully corrected dataset (DG + AC + SC + PVC) presumed to be the best estimate. P < 0.05 was considered statistically significant
CG−Cardiac gating only with no other physical corrections
CG + AC−Cardiac gating with attenuation correction
CG + AC + SC−Cardiac gating with attenuation and scatter correction
DG + AC + SC−Dual cardiac and respiratory gating, attenuation and scatter correction
DG + AC + SC + PVC−Dual-gating, attenuation, scatter, and partial volume correction
IMBV intramyocardial blood volume
Data is represented as µ ± σ(P value)
Figure 3.
Scatter and Bland-Altman plots of IMBV (end-diastolic and end-systolic phases) for various physical corrections against fully corrected dataset (i.e. DG + AC + SC + PVC). Scatter plots also display the sum of squared error (SSE), Pearson correlation-value squared (R2), and the slope/intercept of linear regression fit. Bland-Altman plots show lines of 95% confidence intervals (mean ± 1.96σ). µ(a, b) computes the mean of its arguments and Δ(a, b) computes the difference of its arguments (a – b). P < 0.05 was considered statistically significant.
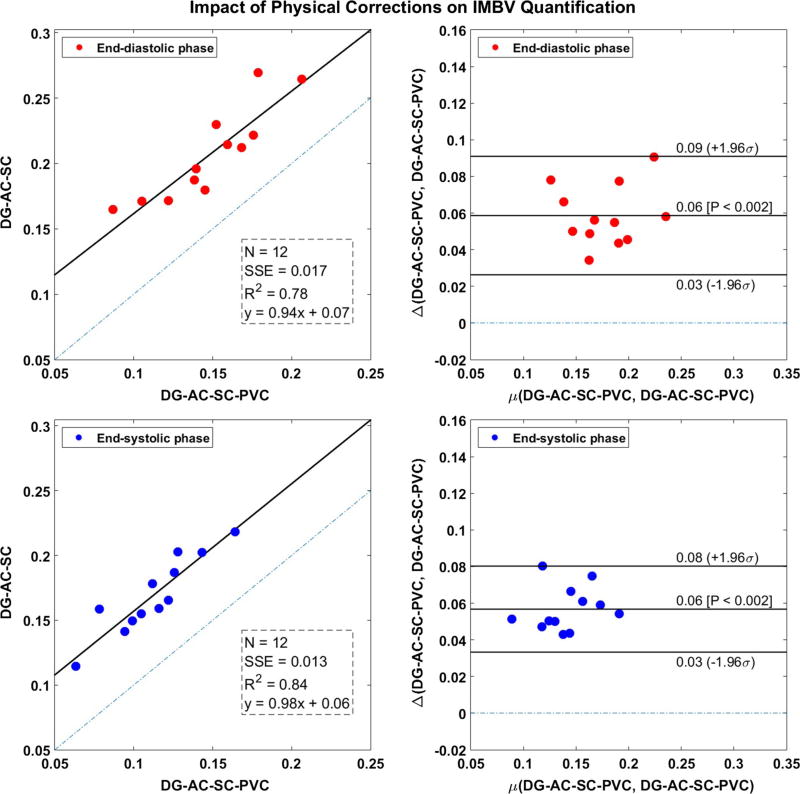
Our estimation of IMBV for various corrections schemes is summarized in Figure 4. F test yielded nonsignificant differences in σIMBV. In addition, DG + AC + SC and DG + AC + SC + PVC corrections schemes at end-diastolic and end-systolic phases were compared (Figure 5). The difference in the correlation coefficient between end-diastolic and end-systolic phases was nonsignificant (P = 0.709). The two cardiac phases had a positive bias of 0.06 and overlapping 95% CI bands.
Figure 4.
Fused scatter-box plot of IMBV for various correction schemes. On each box, the central mark (green line) is the median, the edges of the notch are 25th and 75th percentiles, and the whiskers extend to the extreme outliers. Red circles represent IMBVdiastole and blue circles represent IMBVsystole.
Figure 5.
Scatter and Bland-Altman plots of IMBV (end-diastolic and end-systolic phases) comparing DG + AC + SC and DG + AC + SC + PVC correction schemes. Scatter plots also display the sum of squared error (SSE), Pearson correlation-value squared (R2), and the slope/intercept of linear regression fit. Bland-Altman plots show lines of 95% confidence intervals (mean ± 1.96σ). µ(a, b) computes the mean of its arguments and Δ(a, b) computes the difference of its arguments (a – b). P < 0.05 was considered statistically significant.
Assessment of ΔIMBV Quantification
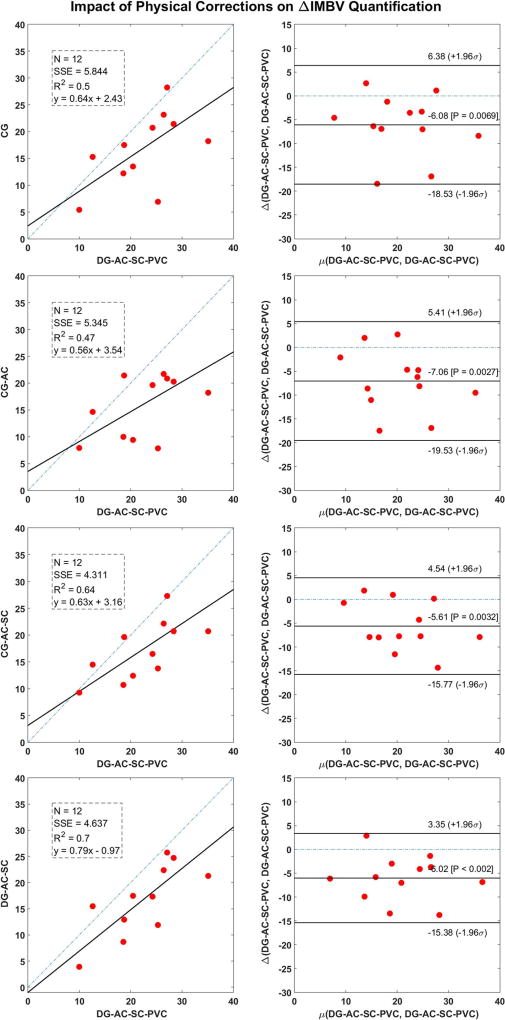
The application of no correction or partial correction schemes resulted in significant under-estimation of ΔIMBV (P ≤ 0.007) compared to fully corrected data (Table 3). Regression slopes from the linear regression analyses were consistently below 1.0 (Figure 6). Bland-Altman analysis showed that compensation of physical degradation factors significantly reduced negative bias in the estimation of the ΔIMBV (Figure 6). Complete data correction reduced variability in ΔIMBV about the sample mean (i.e. COV) compared to no or partial correction schemes (Table 3). F test yielded non-significant differences in σΔIMBV.
Table 3.
ΔIMBV in end-diastolic and end-systolic phases from various correction schemes and statistically compared (paired t test) to the reference truth i.e., fully corrected dataset (DG + AC + SC + PVC)
| (N = 12) | ΔIMBV |
|---|---|
| CG | 17:8% ± 7:9% (COV = 44:0%) (P = 0:007) |
| CG + AC | 16:9% ± 7:0% (COV = 41:5%) (P = 0:003) |
| CG + AC + SC | 18:3% ± 6:8% (COV = 37:3%) (P = 0:003) |
| DG + AC + SC | 17:9% ± 8:1% (COV = 45:2%) (P = 0:001) |
| DG + AC + SC + PVC | 23:9% ± 8:6% (COV = 35:9%) |
P < 0.05 was considered statistically significant
CG−Cardiac gating only with no other physical corrections
CG + AC−Cardiac gating with attenuation correction
CG + AC + SC−Cardiac gating with attenuation and scatter correction
DG + AC + SC−Dual cardiac and respiratory gating, attenuation and scatter correction
DG + AC + SC + PVC−Dual-gating, attenuation, scatter, and partial volume correction
ΔIMBV−cycle-dependent change in
COV coefficient of variation
Data is represented as µ ± σ(COV) (P value)
Figure 6.
Scatter and Bland-Altman plots of ΔIMBV for various physical corrections against fully corrected dataset (i.e. DG + AC + SC + PVC). Scatter plots also display the sum of squared error (SSE), Pearson correlation-value squared (R2), and the slope/intercept of linear regression fit. Bland-Altman plots show lines of 95% confidence intervals (mean ± 1.96σ). µ(a, b) computes the mean of its arguments and Δ(a, b) computes the difference of its arguments (a – b). P < 0.05 was considered statistically significant.
Validation of SPECT Derived IMBV with MicroCT
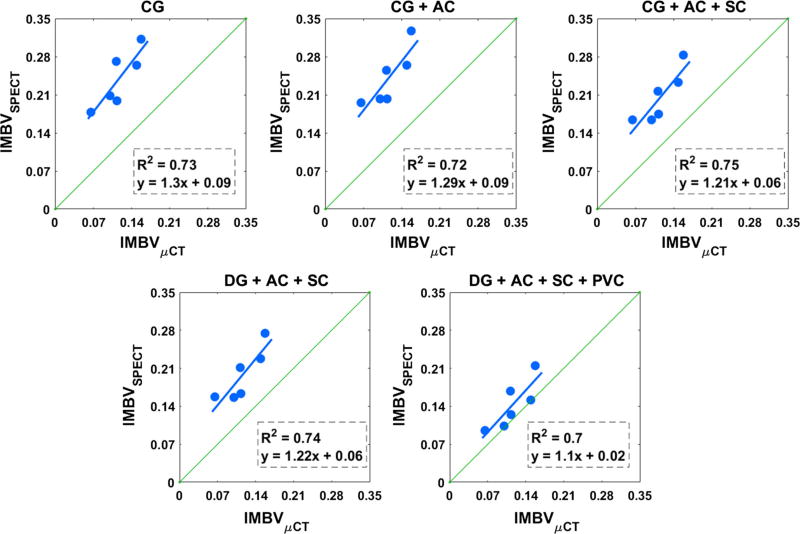
Figure 7A is a representative 3D rendering obtained from a microCT of a casted heart showing the macro-and microvasculature. Figure 7B shows perfused LV myocardium and non-perfused RV myocardium for the same dog. Figure 7C shows a zoomed microCT slice in the LV. Figure 8 shows correlation plots of IMBV obtained from SPECT and ex vivo microCT imaging for various correction schemes. Strong correlations (0.70 ≤ R2 ≤ 0.75) were observed for all corrections schemes (P < 0.05). Notably, IMBV obtained from the fully corrected SPECT data set are closest to the line of identity and showed the least bias compared with ex vivo IMBVµCT.
Figure 7.
(A) 3D volume-rendered microCT image of the macro- and microvasculature, (B) coronal slices showing the perfused LV myocardium and the non-perfused RV myocardium, and (C) zoomed microCT slice in the LV myocardium. Mean HU and the standard deviation of the RV myocardium (µRV and σRV respectively) are used to segment out the intramyocardial microvasculature.
Figure 8.
Correlation plots between IMBV values derived from in vivo SPECT and ex vivo microCT imaging for various correction schemes. Plots also display Pearson correlation-value squared (R2), and the slope/intercept of linear regression fit. Green line is the line of identity. Fully corrected dataset (DG + AC + SC + PVC) resulted in the least overestimation (minimum bias) compared to no correction or partial correction schemes.
DISCUSSION
In this work, we demonstrated the feasibility to quantify IMBV in vivo with 99mTc-RBC hybrid SPECT-CT imaging. We evaluated the efficacy of various correction schemes for quantification of IMBV and ΔIMBV in older normal beagle dogs. As outlined above, five approaches were studied that incorporated incremental corrections and compared each of the schemes to an approach that incorporated full correction of all of the critical physiological and physical confounders (cardiac and respiratory motion, attenuation, scatter, and partial volume errors). Data obtained from hybrid SPECT/CT images that incorporated the full correction scheme were used as the reference for comparative quantitative analysis. The quantitative estimates of IMBV and ΔIMBV from our non-invasive SPECT approach were also compared to estimates of the IMBV determined by microCT imaging of hearts following intravascular casting, and also found to be comparable to results reported in the existing literature using other non-invasive and more invasive techniques.
Incorporation of physiological and physical corrections significantly reduced quantitative overestimation of IMBV in the end-diastolic and end-systolic phases. Applying all of the corrections yielded an estimated IMBV of 0.15 ± 0.03 in the diastolic phase. This is consistent with values reported in the literature for both in vivo imaging studies (0.06–0.20)34–36 and ex vivo validation assays (0.05–0.14).36–40 IMBV was, on average, ~23% less in systolic phase compared to diastolic phase (i.e. ΔIMBV = 23%). This is also consistent with what is reported in the literature (20–25%).34,41 The explanation for this decrease in systole compared to diastolic values represent the well-characterized decrease in coronary flow that occurs during systole due to high intramyocardial forces that expel (squeeze) blood out of the coronary vessels.42–44 Since the myocardium is assumed to be incompressible,45 the change in total volume that occurs over the cardiac cycle is due to changes in the intramyocardial blood volume.
Validation of our in vivo measurement of IMBV was performed by correlating SPECT derived IMBV estimates with those obtained from ex vivo microCT imaging following vascular casting under physiological pressures. Full compensation of physiological and physical degradation factors (DG + AC + SC + PVC) yielded a strong correlation and the least overestimation. These findings demonstrated the efficacy of the proposed approach for quantification of IMBV in vivo. While the correlations are high, the SPECT derived IMBV values are generally higher than microCT derived values. This discrepancy may be caused by the resolution limit of the microCT scan (~25 µm), leading to smaller vessels being excluded from segmentation and a potential underestimation of IMBV. While different particles were used for vascular casting, we found that the appropriate choice of k was not dependent upon the particle types, but directly related to the amount of streaking artifacts caused by vascular leaking. Therefore, even though three different particle schemes were used in our 6 animal studies, our method of determining microCT IMBV using individual RV HU threshold effectively accounts for the particle differences and was appropriate for the purpose of ex vivo validation of the in vivo results.
The CG + AC + SC scheme demonstrated the highest correlation coefficient (R2 = 0.88), a reduced bias (P < 0.002), and a tighter 95% CI band. It can be inferred that for semi-quantitative analysis of IMBV, for applications such as monitoring IMBV over time for the same patient, respiratory motion correction and PVC may not be needed. This indicates that semi-quantitative IMBV can be measured by SPECT systems without a high-end CT to acquire CTA data. That being said, for quantification of IMBV, all corrections are needed. The impact of each correction scheme was also studied separately for end-diastolic and end-systolic phases, and demonstrated no significant differences between the results in the two phases. This demonstrates the robustness of the proposed approach across different cardiac phases with respect to phase-dependent degradation and PVE. Full correction had a higher (COV = 26.8%) in IMBV compared to other correction schemes (16.8%-19.7%). This might be attributed to the true physiologic variability in the dataset (COV = 18.9%).
In contrast to IMBV overestimation, ΔIMBV was significantly under-estimated without correction or with only partial correction schemes (all P ≤ 0.007) . The difference in correlation coefficients from various correction schemes was not significant (all P > 0.1). The DG + AC + SC scheme had the highest correlation coefficient (R2 = 0.70), a reduced bias (P = 0.001), and a wide 95% CI band. These data indicated that incorporation of all corrections would be needed to accurately estimate ΔIMBV, and to track temporal changes in IMBV over the cardiac cycle.
Fully corrected SPECT images exhibited superior image quality and contrast enhancement compared to schemes with incomplete correction of physical and physiological confounding variables. Partial volume effect (PVE) was considerably reduced resulting in sharp functional boundaries and uniform contrast in the entire myocardium. A limitation of iYang’s approach is the time needed for intensive multi-organ segmentation of CECT. Fully automatic segmentation methods such as atlas-based segmentation approach could minimize this limitation and merits further investigation. Another limitation of this approach is the organ-specific choice of tissue-fraction thresholds, tJ, used to compute regional mean values (Steps 2 and 4, Algorithm 1). Mean values for lung, liver, and background did not vary much with tJ ∈ [0:10:99]. We chose tJ = 0.7 for these regions in all dog studies. For myocardium and LV blood pool, tJ was carefully chosen (subjectively) so that voxels away from organ boundaries are selected for computation of mean values.
NEW KNOWLEDGE GAINED
We present, for the first time, a methodological framework for in vivo quantification of IMBV using cardiorespiratory-gated hybrid 99mTc-RBC SPECT/CT imaging. The proposed approach for assessment of IMBV along with the cycle-dependent changes in IMBV has the potential of detecting and quantifying early changes in microvascular function. This approach may uniquely permit the discrimination of obstructive CAD from microvascular disease in the setting of impaired flow reserve. We also demonstrated the importance of corrections of attenuation, scatter, and partial volume errors for improved quantification of IMBV.
This hybrid 99mTc-RBC SPECT/CT imaging approach may have other additional important clinical implications. For example, equilibrium radionuclide angiography (ERNA) or SPECT imaging following injection of 99Tc-RBC is often performed for evaluation of cardiac dysfunction associated with chemotherapy-induced cardiotoxicity. Unfortunately, the detection of a decrease in cardiac function may be a late manifestation of cardiotoxicity. However, the additional simultaneous evaluation of changes in IMBV or ΔIMBV may provide a unique index of microvascular injury that might precede the development of mechanical dysfunction associated with chemotherapy. Therefore, this SPECT imaging approach may offer advantages over methods that rely only on the assessment of changes in cardiac function for detection of cardiotoxicity.
CONCLUSIONS
The feasibility to quantify IMBV and cycle-dependent changes in IMBV in vivo with 99mTc-RBC SPECT/CT imaging was established in a large animal model. We demonstrate that the accurate quantification of IMBV requires the use of anatomic information from adjunctive contrast CT imaging and corrections for cardio-respiratory motion, attenuation, scatter, and partial volume effects.
Supplementary Material
Acknowledgments
The authors wish to thank Dr. Eva Romito, Dr. Attila Feher, Dr. Jing Wu, Sharon Wang, Tsa Shelton, and Christi Hawley for their help in conducting the experiments.
Funding This study was supported by NIH Grants R01HL123949, R01HL113352, S10RR025555, and T32HL098069.
Abbreviations
- SPECT/
Single photon emission computed
- CT
tomography/computed tomography
- CECT
Contrast-enhanced CT
- CTAC
Non-contrast CT for attenuation correction
- CVD
Cardiovascular disease
- CMD
Coronary microvascular disease
- CAD
Coronary artery disease
- LV, RV
Left ventricle, right ventricle
- IMBV
Intramyocardial blood volume
- ΔIMBV
Cycle-dependent change in IMBV
- CLV-blp
99mTc-RBC uptake in the LV blood
- Cmyo
pool or myocardium
Footnotes
Electronic supplementary material The online version of this article (doi:10.1007/s12350-017-0970-4) contains supplementary material, which is available to authorized users.
Disclosure
Hassan Mohy-ud-Din, Nabil E. Boutagy, John C. Stendahl, Zhen W. Zhuang, Albert J. Sinusas, and Chi Liu claim no potential conflict of interests.
Ethical approval
All experiments were performed in accordance with Yale University Institutional Animal Care and Use Committee standards and approval.
References
- 1.Association AH. Heart disease and stroke statistics–at-a-glance. 2015 [Google Scholar]
- 2.Prior JO, Allenbach G, Valenta I, Kosinski M, Burger C, Verdun FR, et al. Quantification of myocardial blood flow with 82Rb positron emission tomography: clinical validation with 15O–water. Eur J Nucl Med Mol Imaging. 2012;39:1037–47. doi: 10.1007/s00259-012-2082-3. [DOI] [PMC free article] [PubMed] [Google Scholar]
- 3.Mohy-ud-Din H, Lodge MA, Rahmim A. Quantitative myocardial perfusion PET parametric imaging at the voxel-level. Phys Med Biol. 2015;60:6013. doi: 10.1088/0031-9155/60/15/6013. [DOI] [PubMed] [Google Scholar]
- 4.Fiechter M, Ghadri JR, Gebhard C, Fuchs TA, Pazhenkottil AP, Nkoulou RN, et al. Diagnostic value of 13N–ammonia myocardial perfusion PET: added value of myocardial flow reserve. J Nucl Med. 2012;53:1230–4. doi: 10.2967/jnumed.111.101840. [DOI] [PubMed] [Google Scholar]
- 5.Qian J, Ge J, Baumgart D, Sack S, Haude M, Erbel R. Prevalence of microvascular disease in patients with significant coronary artery disease. Herz. 1999;24:548–57. doi: 10.1007/BF03044227. [DOI] [PubMed] [Google Scholar]
- 6.Fearon WF. Letter by Faron regarding article, “Primary coronary microvascular dysfunction: clinical presentation, pathophysiology, and management”. Circulation. 2011;123:e212. doi: 10.1161/CIRCULATIONAHA.110.977058. author reply e3. [DOI] [PMC free article] [PubMed] [Google Scholar]
- 7.Lanza GA, Crea F. Primary coronary microvascular dysfunction: clinical presentation, pathophysiology, and management. Circulation. 2010;121:2317–25. doi: 10.1161/CIRCULATIONAHA.109.900191. [DOI] [PubMed] [Google Scholar]
- 8.Sara JD, Widmer RJ, Matsuzawa Y, Lennon RJ, Lerman LO, Lerman A. Prevalence of coronary microvascular dysfunction among patients with chest pain and nonobstructive coronary artery disease. JACC. 2015;8:1445–53. doi: 10.1016/j.jcin.2015.06.017. [DOI] [PubMed] [Google Scholar]
- 9.Lin T, Rechenmacher S, Rasool S, Varadarajan P, Pai RG. Reduced survival in patients with “coronary microvascular disease”. Int J Angiol. 2012;21:089–94. doi: 10.1055/s-0032-1315799. [DOI] [PMC free article] [PubMed] [Google Scholar]
- 10.Marks DS, Gudapati S, Prisant LM, Weir B, DiDonato-Gonzalez C, Waller JL, et al. Mortality in patients with microvascular disease. J Clin Hypertens. 2004;6:304–9. doi: 10.1111/j.1524-6175.2004.03254.x. [DOI] [PMC free article] [PubMed] [Google Scholar]
- 11.Britten MB, Zeiher AM, Schächinger V. Microvascular dysfunction in angiographically normal or mildly diseased coronary arteries predicts adverse cardiovascular long-term outcome. Coron Artery Dis. 2004;15:259–64. doi: 10.1097/01.mca.0000134590.99841.81. [DOI] [PubMed] [Google Scholar]
- 12.Recio-Mayoral A, Mason JC, Kaski JC, Rubens MB, Harari OA, Camici PG. Chronic inflammation and coronary microvascular dysfunction in patients without risk factors for coronary artery disease. Eur Heart J. 2009 doi: 10.1093/eurheartj/ehp205. ehp205. [DOI] [PubMed] [Google Scholar]
- 13.Camici PG, Crea F. Coronary microvascular dysfunction. N Engl J Med. 2007;356:830–40. doi: 10.1056/NEJMra061889. [DOI] [PubMed] [Google Scholar]
- 14.Selthofer-Relatić K, Bošnjak I, Kibel A. Obesity related coronary microvascular dysfunction: from basic to clinical practice. Cardiol Res Pract. 2016:2016. doi: 10.1155/2016/8173816. [DOI] [PMC free article] [PubMed] [Google Scholar]
- 15.Gallucci G, Capobianco AM, Coccaro M, Venetucci A, Suriano V, Fusco V. Myocardial perfusion defects after radiation therapy and anthracycline chemotherapy for left breast cancer: a possible marker of microvascular damage. Three cases and review of the literature. Tumori. 2008;94:129–33. doi: 10.1177/030089160809400124. [DOI] [PubMed] [Google Scholar]
- 16.Wu CC, Feldman MD, Mills JD, Manaugh CA, Fischer D, Jafar MZ, et al. Myocardial contrast echocardiography can be used to quantify intramyocardial blood volume—New insights into structural mechanisms of coronary autoregulation. Circulation. 1997;96:1004–11. doi: 10.1161/01.cir.96.3.1004. [DOI] [PubMed] [Google Scholar]
- 17.Porter TR. Capillary blood flow abnormalities in the skeletal muscle and microvascular complications in diabetes lessons that cannot be learned from larger vessels. J Am Coll Cardiol. 2009;53:2184–5. doi: 10.1016/j.jacc.2009.03.015. [DOI] [PubMed] [Google Scholar]
- 18.Mohammed SF, Hussain S, Mirzoyev SA, Edwards WD, Maleszewski JJ, Redfield MM. Coronary microvascular rarefaction and myocardial fibrosis in heart failure with preserved ejection fraction. Circulation. 2014 doi: 10.1161/CIRCULATIONAHA.114.009625. CIRCULATIONAHA. 114.009625. [DOI] [PMC free article] [PubMed] [Google Scholar]
- 19.Jayaweera AR, Edwards N, Glasheen WP, Villanueva FS, Abbott RD, Kaul S. In vivo myocardial kinetics of air-filled albumin microbubbles during myocardial contrast echocardiography. Comparison with radiolabeled red blood cells. Circ Res. 1994;74:1157–65. doi: 10.1161/01.res.74.6.1157. [DOI] [PubMed] [Google Scholar]
- 20.Judd RM, Levy BI. Effects of barium-induced cardiac contraction on large- and small-vessel intramyocardial blood volume. Circ Res. 1991;68:217–25. doi: 10.1161/01.res.68.1.217. [DOI] [PubMed] [Google Scholar]
- 21.Bailey DL, Willowson KP. An evidence-based review of quantitative SPECT imaging and potential clinical applications. J Nucl Med. 2013;54:83–9. doi: 10.2967/jnumed.112.111476. [DOI] [PubMed] [Google Scholar]
- 22.Bailey DL, Willowson KP. Quantitative SPECT/CT: SPECT joins PET as a quantitative imaging modality. Eur J Nucl Med Mol Imaging. 2014;41:S17–25. doi: 10.1007/s00259-013-2542-4. [DOI] [PubMed] [Google Scholar]
- 23.Bocher M, Blevis IM, Tsukerman L, Shrem Y, Kovalski G, Volokh L. A fast cardiac gamma camera with dynamic SPECT capabilities: design, system validation and future potential. Eur J Nucl Med Mol Imaging. 2010;37:1887–902. doi: 10.1007/s00259-010-1488-z. [DOI] [PMC free article] [PubMed] [Google Scholar]
- 24.Kennedy JA, Israel O, Frenkel A. 3D iteratively reconstructed spatial resolution map and sensitivity characterization of a dedicated cardiac SPECT camera. J Nucl Cardiol. 2014;21:443–52. doi: 10.1007/s12350-013-9851-7. [DOI] [PubMed] [Google Scholar]
- 25.Chan C, Harris M, Le M, Biondi J, Grobshtein Y, Liu Y-H, et al. End-expiration respiratory gating for a high resolution stationary cardiac SPECT system. Phys Med Biol. 2014;59:6267. doi: 10.1088/0031-9155/59/20/6267. [DOI] [PMC free article] [PubMed] [Google Scholar]
- 26.Fan P, Hutton BF, Holstensson M, Ljungberg M, Pretorius PH, Prasad R, et al. Scatter and crosstalk corrections for 99mTc/123I dual-radionuclide imaging using a CZT SPECT system with pinhole collimators. Med Phys. 2015;42:6895–911. doi: 10.1118/1.4934830. [DOI] [PubMed] [Google Scholar]
- 27.Shepp L, Vardi Y. Maximum likelihood reconstruction for emission tomography. IEEE trans Med imaging. 1982;1:113–22. doi: 10.1109/TMI.1982.4307558. [DOI] [PubMed] [Google Scholar]
- 28.Chan C, Dey J, Grobshtein Y, Wu J, Liu Y-H, Lampert R, et al. The impact of system matrix dimension on small FOV SPECT reconstruction with truncated projections. Med Phys. 2016;43:213–24. doi: 10.1118/1.4938098. [DOI] [PMC free article] [PubMed] [Google Scholar]
- 29.Chan C, Liu H, Grobshtein Y, Stacy MR, Sinusas AJ, Liu C. Simultaneous partial volume correction and noise regularization for cardiac SPECT/CT; 2013 IEEE Nuclear Science Symposium and Medical Imaging Conference.2013. [Google Scholar]
- 30.Liu H, Chan C, Grobshtein Y, Ma T, Liu Y, Wang S, et al. Anatomical-based partial volume correction for low-dose dedicated cardiac SPECT/CT. Phys Med Biol. 2015;60:6751. doi: 10.1088/0031-9155/60/17/6751. [DOI] [PMC free article] [PubMed] [Google Scholar]
- 31.Vollmar S, Sué M, Klein J, Jacobs A, Herholz K. VINCI-volume imaging in neurological research, co-registration and ROIs included [Google Scholar]
- 32.Nolden M, Zelzer S, Seitel A, Wald D, Müller M, Franz AM, et al. The medical imaging interaction toolkit: challenges and advances. Int J Comput Assisted Radiol Surg. 2013;8:607–20. doi: 10.1007/s11548-013-0840-8. [DOI] [PubMed] [Google Scholar]
- 33.Yang J, Mega M, Huang SC, Lin KP, Toga A, Small G, et al. Investigation of partial volume correction methods for brain FDG-PET studies. 1995 IEEE Nucl Sci Symp Med Imaging Conf Rec. 1996;1–3:1670–4. [Google Scholar]
- 34.Liu Y, Bahn RC, Ritman EL. Dynamic intramyocardial blood volume: evaluation with a radiological opaque marker method. Am J Physiol-Heart C. 1992;263:H963–7. doi: 10.1152/ajpheart.1992.263.3.H963. [DOI] [PubMed] [Google Scholar]
- 35.Wu X, Ewert D, Liu Y, Ritman EL. In vivo relation of intramyocardial blood volume to myocardial perfusion. Evidence supporting microvascular site for autoregulation. Circulation. 1992;85:730–7. doi: 10.1161/01.cir.85.2.730. [DOI] [PubMed] [Google Scholar]
- 36.McCommis KS, Goldstein TA, Zhang H, Misselwitz B, Gropler RJ, Zheng J. Quantification of myocardial blood volume during dipyridamole and doubtamine stress: a perfusion CMR study. J Cardiovasc Magn Reson. 2007;9:785–92. doi: 10.1080/10976640701545206. [DOI] [PubMed] [Google Scholar]
- 37.Morgenstern C, Höljes U, Arnold G, Lochner W. The influence of coronary pressure and coronary flow on intracoronary blood volume and geometry of the left ventricle. Pflügers Archiv. 1973;340:101–11. doi: 10.1007/BF00588169. [DOI] [PubMed] [Google Scholar]
- 38.Kassab GS, Lin DH, Fung Y. Morphometry of pig coronary venous system. Am J Physiol-Heart C. 1994;267:H2100–13. doi: 10.1152/ajpheart.1994.267.6.H2100. [DOI] [PubMed] [Google Scholar]
- 39.Hoffman E, Ritman E. Intramyocardial blood volume—implications for analysis of myocardial mechanical characteristics via in vivo imaging of the heart. Activ Metab Perfus Heart. 1987:421–32. [Google Scholar]
- 40.Spaan J. Coronary diastolic pressure-flow relation and zero flow pressure explained on the basis of intramyocardial compliance. Circ Res. 1985;56:293–309. doi: 10.1161/01.res.56.3.293. [DOI] [PubMed] [Google Scholar]
- 41.Pascotto M, Wei K, Micari A, Bragadeesh T, Goodman NC, Kaul S. Phasic changes in arterial blood volume is influenced by collateral blood flow: implications for the quantification of coronary stenosis at rest. Heart. 2007;93:438–43. doi: 10.1136/hrt.2006.089631. [DOI] [PMC free article] [PubMed] [Google Scholar]
- 42.Heusch G. Heart rate in the pathophysiology of coronary blood flow and myocardial ischaemia: benefit from selective bradycardic agents. Br J Pharmacol. 2008;153:1589–601. doi: 10.1038/sj.bjp.0707673. [DOI] [PMC free article] [PubMed] [Google Scholar]
- 43.Spaan JA, Breuls NP, Laird JD. Diastolic-systolic coronary flow differences are caused by intramyocardial pump action in the anesthetized dog. Circ Res. 1981;49:584–93. doi: 10.1161/01.res.49.3.584. [DOI] [PubMed] [Google Scholar]
- 44.Duncker DJ, Koller A, Merkus D, Canty JM. Regulation of coronary blood flow in health and ischemic heart disease. Prog Cardiovasc Dis. 2015;57:409–22. doi: 10.1016/j.pcad.2014.12.002. [DOI] [PMC free article] [PubMed] [Google Scholar]
- 45.Tsuiki K, Ritman EL. Direct evidence that left ventricular myocardium is incompressible throughout systole and diastole. Tohoku J Exper Med. 1980;132:119–20. doi: 10.1620/tjem.132.119. [DOI] [PubMed] [Google Scholar]
Associated Data
This section collects any data citations, data availability statements, or supplementary materials included in this article.


