

Abstract
Nonapeptide receptors, like oxytocin receptor (OTR) and vasopressin 1a receptor (V1aR), modulate a variety of functions across taxa, and mediate phenotypic variation within and between species. Despite the popularity of studying nonapeptides in adults, developmental perspectives on properties of OTR and V1aR expression are lacking. Study of prairie voles (Microtus ochrogaster) has facilitated an understanding of mechanisms of social behavior, and provides great potential to inform how early life experiences alter phenotype. We provide the first comprehensive profiling of OTR and V1aR in male and female prairie voles across postnatal development and into adulthood. Differences in receptor densities across the forebrain were region- and sex-specific. Postnatal changes in receptor expression fell into four themes: (1) constant over time, (2) increasing with age, (3) decreasing with age, or (4) peaking during late pre-weaning (postnatal day 15–21). We also examined the influence of post-weaning social and spatial enrichment (i.e., environmental complexity) on OTR and V1aR. Environmental complexity appeared to promote expression of OTR in males and females, and reduced expression of V1aR across several brain regions in males. Our results show that nonapeptide receptor profiles are plastic over development, and suggest that different patterns of expression might represent functional differences in sensitivity to nonapeptide activation over a period when social environments are dynamic. Our results on environmental complexity suggest that nonapeptide sensitivity responds flexibly to different environmental contexts during development. Understanding the developmental trajectories of nonapeptide receptors provides a better understanding of the dynamic nature of social behavior and the underlying mechanisms.
Keywords: nonapeptide, environmental enrichment, socio-spatial complexity, social behavior network, pair bond, Microtus ochrogaster
Graphical Abstract
We provide the first comprehensive profiling of oxytocin and vasopressin 1a receptor over prairie vole development. We also characterized the impact of environmental enrichment. Overall, if brain regions expressed change, OTR increased, V1aR (mostly) decreased, and enrichment impacted V1aR (but not OTR) in males in more forebrain regions than females.
INTRODUCTION
Nonapeptide hormones, oxytocin (OT), vasopressin (VP) and their non-mammalian homologues, act as neuromodulators to support a suite of behavioral and regulatory functions throughout the forebrain (Albers, 2012; Borrow and Cameron, 2012; Wacker and Ludwig, 2012; Young et al., 2011; Young and Wang, 2004). Variation in the density of their receptors (oxytocin receptor, OTR and vasopressin receptor 1a, V1aR) introduces measurable differences that often translate into observable behavioral differences both within and between species (Albers, 2015; Beery et al., 2008; Dumais and Veenema, 2016). Therefore, characterizing the expression patterns of OTR and/or V1aR has informed much of our understanding of the natural variation in brain-behavior relationships, particularly in the area of social behavior.
The majority of the work in this area has focused on animals within a single age group. However, it is imperative to consider the dynamic action of nonapeptide systems across distinct developmental time-points. To the extent that the ontogeny of OTR and V1aR expression has been studied, the evidence indicates that OTR and V1aR can be dynamic in some regions of the forebrain but highly stable in others as animals age and mature (Hammock and Levitt, 2013; Olazabal and Alsina-Llanes, 2016; Shapiro and Insel, 1989; Smith et al. 2017; Tamborski et al., 2016; Tribollet et al., 1989; Tribollet et al., 1991; Wang and Young, 1997; Wang et al., 1997). Specifically, OTR or V1aR may be transiently high or low during infancy or juvenile life stages in some forebrain regions, whereas receptor expression remains constant throughout development into adulthood in other regions (reviewed in Grinevich et al., 2015; Hammock, 2015; Miller and Caldwell, 2015). These region-specific trajectories of OTR and V1aR development suggest that the influence of nonapeptides varies across developmental stages, with distributions of OTR and V1aR across the forebrain seeming to follow developmental programs. However, the majority of this work has focused on rats, with only a few studies in other species (including mice and voles). The literature across species shows some consistency, but more inconsistencies, which indicates that the nonapeptide system has responded to different selection pressures over the course of evolution (Goodson et al., 2012; Kelly and Ophir, 2015; Ren et al., 2015). Indeed, species differences in these region-specific trajectories may be linked to concurrent socio-behavioral differences across development. A better understanding of the natural development of receptor expression has the potential to reveal the ways in which evolution has shaped various networks in the brain important for processing and mediating social behavior (Ketterson and Nolan, 1999).
The environment introduces a major source of variation on the nonapeptide system, and both social and ecological experiences can have profound influences on the expression and function of VP, OT, and their receptors in adulthood (Bales and Perkeybile, 2012; Carter, 2003; Cushing, 2013). For example, research across rodent species demonstrates the plastic response of nonapeptides systems to variation in early life social experiences (Bales and Perkeybile, 2012; Curley et al., 2011). Female prairie voles, Microtus ochrogaster, raised without fathers (i.e., single-mother rearing) exhibit increased OT mRNA expression in the PVN (Ahern and Young, 2009). Previous work from our lab demonstrates that male prairie voles experiencing single-mother rearing demonstrate greater V1aR expression in the RSC compared to males raised with both parents (Prounis et al., 2015). In this same study, post-weaning social environments also influenced OT and VP systems, with males living in isolation as juveniles developing greater OTR expression in several regions of the brain as adults (Prounis et al., 2015). The plasticity of OTR and V1aR that results from early life experiences presumably reflects, at least in part, the outcome of variation of endogenous OT and VP release and binding over development that ultimately impacts adult receptor phenotype. Indeed, early life OT manipulation in prairie voles influences the expression of adult species-typical behaviors, including pair bonding and alloparental care, in a sex-specific manner (Bales and Carter, 2003a; Bales et al., 2004). Early OT and VP manipulations also influence aggressive behavior differentially in adult males and females (Bales and Carter, 2003b; Stribley and Carter, 1999). Taken together, the evidence suggests that the natural development of OTR and V1aR is not only dynamic over the course of development, but that it is an open system that can be impacted by environmental context during development.
Over the past 25 years or more, prairie voles have served as an excellent species to understand the roles that nonapeptides play in mediating several rare and human-like behaviors, including bonding, monogamy, and bi-parental care. In this time, several studies have manipulated the early life experiences (behaviorally or pharmacologically; see above) in prairie voles to observe the consequences, yet we know relatively little about the natural patterns of OTR and V1aR over the course of development. Due to the prominence of the prairie vole in research on development and social behavior, and the importance of the nonapeptide system therein, the field is in need of a thorough developmental profile of OTR and V1aR expression in both male and female prairie voles, comparable to the work that has explored OTR and V1aR ontogeny in rats. Doing so will also provide the ability to expand what we know about species differences among rodents in a meaningful way (Kelly and Ophir, 2015).
Here we conduct the most thorough analysis to date of the development of OTR and V1aR expression throughout the forebrain of both male and female prairie voles. We also investigated the ways in which social and spatial complexity experienced during post-weaning influences developmental trajectories of OTR and V1aR in each sex. We predicted that the patterns of OTR and V1aR over development in rats (and other species) will differ from many of the patterns observable in prairie voles, presumably reflecting the important socio-behavioral characteristics of this species (e.g., pair-bonding behavior, paternal care, and alloparental care) (Gobrogge and Wang, 2016). We also predicted that complex (and more naturalistic) social environments should produce differences in OTR and V1aR, which may relate to behavioral variation observed within the species (Okhovat et al., 2015; Ophir et al., 2008a; Ophir et al., 2008b; Ophir et al., 2008c; Perkeybile et al., 2013; Zheng et al., 2013). Expanding research on OTR and V1aR ontogeny across taxa, and on the influence of early life environments on this development, will advance our understanding of how nonapeptide systems might mediate species-typical behaviors across life stages.
MATERIALS AND METHODS
Pre-weaning and post-weaning housing conditions
We established 26 breeding pairs from F2 animals taken from our breeding colony, which was established using wild prairie voles we trapped in Champagne-Urbana, Illinois, USA. All breeders for this study were weaned at postnatal day (PND) 21, and separated into same-sex litters housed in standard polycarbonate cages (29 × 18 × 13 cm) lined with Sani-chip bedding and provided nesting material. No animals in this experiment were raised in isolation. Water and rodent chow (Rodent Chow 5000, Harlan Teklad, Madison, WI, USA) were provided ad libitum and animals were maintained on a 14:10 hr light:dark cycle (lights on at 0600) with ambient temperature maintained at 20±2°C. All procedures were approved by the Institutional Animal Care and Use Committee.
After the animals reached sexual maturity (i.e., > PND 45) we paired males and females to create breeding pairs. To establish breeding pairs, we sexually primed females by adding a mixture of dirty bedding material and urine-soaked Sani-chips to the females’ cages. This is a natural, robust, and non-invasive method of inducing sexual receptivity and estrus cycling in this species (Carter et al., 1980; Dluzen et al., 1981; Richmond and Stehn, 1976). After 48 hours of exposing a female to these conditions, we introduced a male to each cage containing a female. Immediately after pairing, we monitored the animals for signs of overt aggression or potential harm. All pairs acclimated to the new housing conditions within 10 min, and the pairs were left alone to breed naturally. Twenty days after pairs were created, we began closely monitoring them for offspring; prairie vole gestation is approximately 21 days.
Pups from each breeding pair served as subjects for this study. We documented the birthday for each litter upon discovery of the litter. Litter size and sex ratios were also recorded for each litter. Pups from each litter were left alone until they reached one of seven ages: PND 6, 9, 12, 15, 18, 21, and 60. For animals assigned to pre-weaning groups (PND 6 – 21), we removed pups from the home cage at the pre-assigned age and collected brains (see below). At least five males and five females were sampled for each age group (see below for final N-values).
We also created two groups of adult aged offspring (PND 60). Animals that were assigned to the PND 60 groups were weaned at 21 days, and housed with a same-sex sibling until they were 60 days old. One set of the PND 60 animals (N = 5 males, 9 females) was raised in standard housing conditions (as described above; with one same sex sibling in a standard shoebox cage). We refer to this group as ‘Simple Adults’ because they were provided relatively minimal social and environmental enrichment.
The second group of the PND 60 animals (N = 8 males, 8 females) was housed in cages exactly as those described above. However, each cage had a 7.6 cm hole in the side of the shoebox cage, which was connected to a four-sided clear Plexiglas arena (120cm × 120cm × 60cm) through a clear Plexiglas tunnel. The four sibling pairs that were housed in these ‘satellite’ cages were unrelated and unfamiliar to each other. The central arena was covered with alfalfa bedding, and contained PVC tubes for cover and a running wheel. Access to each ‘satellite’ cage was blocked with a wire cloth gate that prevented the pair from entering the arena. Every 24 h, we removed the wire gate for one of the satellite cages, allowing only the sibling pair in that cage access to the center arena. After 24 hours, the animals were returned to their satellite cage and the gate was replaced. The alfalfa was disrupted to remove any ‘tunneling’ in the arena and the running wheel was rotated 90° counterclockwise to the right. We then removed the gate for the next cage positioned to the counter clockwise adjacent wall. Although only one pair of siblings could freely enter the arena at any given moment, visual and olfactory contact at the wire cloth boundaries was possible when voles living in a blocked cage approached the blocked entryway. We rotated access to each satellite cage each day from age 21 to age 60. Our rotation paradigm ensured high levels of olfactory complexity in the central chamber, with constantly changing patterns of urinary odors between each access window for a sibling pair. Although there were some factors we could not control using this design, our aim was to expose a juvenile vole to a spatially and socially complex environment that was more similar to what would be experienced in a natural habitat, at least when compared to standard laboratory housing. For these reasons, we referred to these animals as ‘Enriched Adults’.
Tissue collection
As mentioned above, we collected brains from male and female pups at seven ages: PND 6, 9, 12, 15, 18, 21, and 60. Breeding pairs contributed no more than 1 male and 1 female to each age group, which were chosen at random from the litter. Immediately after extraction, we flash froze brains on powdered dry ice and wrapped them in aluminum foil, which was individually marked. All frozen brains were stored at −80 °C until cryosectioning. Later, we coronally sectioned brains at −18±2 °C to a thickness of 20 μm. Sections were mounted in four sets at 100 μm intervals on Superfrost Plus slides (Fisher Scientific Co., Pittsburgh, PA, USA). Each of four sets was then stored at −80 °C until they were used to visualize receptor density using autoradiography (see below).
OTR and V1aR autoradiography and figure preparation
We used our validated autoradiography protocol to visualize OTR and V1aR in subjects (see Ophir et al. 2013). We used 125I-labeled radioligands to visualize oxytocin receptor (ornithine vasotocin analogue ([125I]-OVTA); NEX254, PerkinElmer; Waltham, MA, USA) and vasopressin receptor (vasopressin (Linear), V-1A antagonist (Phenylacetly1, O-Me-D-Tyr2, [125I-Arg6]-); NEX310, PerkinElmer). We exposed radiolabelled tissue to film (GE Healthcare, Little Chalfont, UK) for 4 days. We assessed the relative density of ligand binding by inferring that receptor density relates to the optical density of exposed film. In this way, optical density measurements serve as a proxy for receptor density. We used 125I-labelled radiographic standards (American Radiolabeled Chemicals, St Louis, MO, USA) to allow for conversion of optical density to receptor density. Films were digitized on a Microtek ArtixScan M1 (Microtek, Santa Fe Springs, CA, USA) at 1200 ppi with 8-bit gray-scale settings; contrast and brightness were uniformly (across all individuals) adjusted to maximize gray tones. Measurements of optical densities were collected using IMAGE-J (NIH, Bethesda, MD, USA). To assemble figures, the original digitized images were imported into Adobe Photoshop CS6 (v. 13.0×64) where non-tissue backgrounds were removed and contrast and brightness were adjusted to minimize among-individual differences in nonspecific staining. Figures were assembled and labeled in PowerPoint (for Mac 2011, v. 14.7.3).
We calculated receptor density on each section by first converting optical density to disintegrations per minute (dpm), adjusted for tissue equivalence (TE; for 1 mg in the rat brain), by using a log function to fit curves generated by radiographic standards. To generate our measures of interest, we measured receptor optical density for each structure three times (once on a series of three brain sections, bilaterally). We also measured non-specific binding on each section by measuring the background levels collected (bilaterally) from fibrous areas that do not express either receptor on each of the same sections measured. The values for each structure were averaged, converted to dpm/mg TE, and adjusted to represent specific binding by subtracting nonspecific binding from total binding for each area.
We assessed receptor density across the forebrain regions where OTR and V1aR are frequently and prominently expressed in prairie voles. Note that although several structures demonstrated different receptor expression levels as a function of age, no structures appeared to express receptors in adulthood but not at a young age, or vice versa. OTR was measured (rostral to caudal) in the PFC, ICa, NAcc, SHi, LS, CP, ICm, CeA, BLA, HPC, and ICp. V1aR was measured (rostral to caudal) in the OBm, OBa, VPall, LS, BNST, PVN, SCN, AH, LDTh, MDTh, VPTh, RSC, CeA, MeA, and VMH. All regions of interest were identified using the rat atlas (Paxinos and Watson, 2013); outlines of selected regions are depicted in the representative autoradiograms in Figs 1–9. Tissue damage during processing prevented scoring of particular regions in select individuals; final sample sizes for each region in each age group are reflected in Tables 1–4.
Figure 1.

Prefrontal cortex (PFC) oxytocin receptor (OTR) expression over development and due to environmental enrichment. (A) Autoradiogram of typical OTR binding in the PFC of an adult. Dashed line encircles the PFC to indicate the borders of this region. Scale bar = 1 mm. (B) Mean (±SEM) PFC OTR expression (dpm/mg TE) in females at early pre-wean (PND 6, 9, 12), late pre-wean (PND 15, 18, 21), and adulthood (PND 60). Adults living in simple (solid black line) and enriched (dashed line) environments are overlaid. (C) Mean (±SEM) PFC OTR expression (dpm/mg TE) in males, following panel B. Greek characters (α β, and γ) denote significant post hoc comparisons (P ≤ 0.05), with shared characters indicating statistical similarity between groups; bars that do not share a character were significantly different.
Figure 9.

Lateral septum (LS) V1aR expression over development and due to environmental enrichment. (A) Autoradiogram of typical V1aR binding in the LS of an adult. Dashed line encircles the LS to indicate the borders of this region. Scale bar = 1 mm. (B–C) Mean (±SEM) LS V1aR (dpm/mg TE) for females and males, respectively, following Figure 1.
Table 1.
Oxytocin Receptor 125I Binding (Mean ± SEM dpm/mg TE) across all pre-wean ages and adulthood in male prairie voles. Grey shaded columns represent the groups that were compared in statistical analyses. Early Pre Wean (EPW) ages encompassed animals postnatal days 6, 9 and 12; Late Pre Wean (LPW) ages encompassed animals postnatal days 15, 18 and 21.
| Early Pre Wean (EPW) ages | Late Pre Wean (LPW) ages | Adult | ||||||||||||||||||
|---|---|---|---|---|---|---|---|---|---|---|---|---|---|---|---|---|---|---|---|---|
|
| ||||||||||||||||||||
| (S= simple, E= enriched) | ||||||||||||||||||||
|
| ||||||||||||||||||||
| 6 | 9 | 12 | EPW | 15 | 18 | 21 | LPW | 60S | 60E | |||||||||||
| Mean ±SE |
N | Mean ±SE |
N | Mean ±SE |
N | Mean ±SE |
N [*] |
Mean ±SE |
N | Mean ±SE |
N | Mean ±SE |
N | Mean ±SE |
N [*] |
Mean ±SE |
N [*] |
Mean ±SE |
N [*] |
|
| PFC | 33.5±7.2 | 8 | 24.2±5.3 | 5 | 26.6±2.4 | 6 | 28.9±3.4 | 19 [α] | 59.9±5.9 | 4 | 45.9±5.0 | 6 | 68.6±17.4 | 6 | 57.9±7.0 | 16 [β] | 79.4±31.5 | 5 [βγ] | 113.9±19.2 | 8 [γ] |
|
| ||||||||||||||||||||
| ICa | 51.5±7.5 | 8 | 39.8±7.2 | 5 | 47.9±9.8 | 6 | 47.3±4.7 | 19 [α] | 57.0±6.0 | 4 | 41.0±5.6 | 6 | 53.3±9.0 | 6 | 49.6±4.4 | 16 [α] | 43.4±5.0 | 5 [α] | 76.1±7.9 | 8 [β] |
|
| ||||||||||||||||||||
| NAcc | 13.2±2.2 | 8 | 18.7±6.8 | 5 | 17.5±3.6 | 6 | 16.0±2.2 | 19 [α] | 51.8±14.1 | 4 | 43.2±9.9 | 6 | 56.6±13.6 | 6 | 50.4±6.9 | 16 [β] | 77.9±33.8 | 5 [β] | 98.3±20.6 | 8 [β] |
|
| ||||||||||||||||||||
| SHi | 89.0±20.9 | 8 | 164.2±36.8 | 5 | 255.4±84.7 | 6 | 158.2±32.0 | 19 [ns] | 598.4±203.5 | 4 | 381.0±171.3 | 6 | 391.4±169.6 | 6 | 439.2±99.5 | 16 [ns] | 206.3±90.4 | 5 [ns] | 244.2±46.6 | 8 [ns] |
|
| ||||||||||||||||||||
| LS | 34.1±4.6 | 8 | 34.4±9.6 | 5 | 53.0±10.1 | 6 | 40.1±4.7 | 19 [ns] | 89.0±22.9 | 4 | 56.8±18.6 | 6 | 51.0±11.8 | 6 | 62.7±10.1 | 16 [ns] | 64.6±11.5 | 5 [ns] | 42.6±6.3 | 8 [ns] |
|
| ||||||||||||||||||||
| CP | 11.1±2.3 | 8 | 11.3±4.8 | 5 | 15.6±5.8 | 6 | 12.6±2.3 | 19 [α] | 33.4±6.2 | 4 | 20.7±5.4 | 6 | 22.4±4.4 | 6 | 24.5±3.1 | 16 [β] | 24.4±5.1 | 5 [βγ] | 60.6±17.8 | 8 [γ] |
|
| ||||||||||||||||||||
| ICm | 50.2±3.6 | 8 | 33.5±7.5 | 5 | 44.6±8.9 | 6 | 44.0±3.9 | 19 [ns] | 35.6±3.5 | 4 | 43.1±9.1 | 6 | 37.0±8.4 | 6 | 38.9±4.5 | 16 [ns] | 52.3±12.2 | 5 [ns] | 44.9±8.1 | 8 [ns] |
|
| ||||||||||||||||||||
| BLA | 41.6±12.5 | 8 | 41.0±9.4 | 5 | 110.8±52.4 | 6 | 63.3±18.1 | 19 [α] | 94.0±46.9 | 4 | 139.7±36.8 | 6 | 151.8±43.0 | 6 | 132.8±23.4 | 16 [β] | 88.7±13.6 | 5 [αβ] | 202.3±34.5 | 8 [γ] |
|
| ||||||||||||||||||||
| CeA | 41.5±7.7 | 8 | 65.4±13.4 | 5 | 117.4±57.0 | 6 | 71.8±19.1 | 19 [α] | 146.5±46.7 | 4 | 153.7±51.4 | 6 | 134.9±25.6 | 6 | 144.8±22.9 | 16 [β] | 103.2±19.5 | 5 [β] | 197.6±45.0 | 8 [β] |
|
| ||||||||||||||||||||
| HPC | 75.4±9.7 | 8 | 119.6±37.4 | 5 | 136.8±42.7 | 6 | 106.4±17.3 | 19 [ns] | 152.8±44.6 | 4 | 124.7±53.1 | 6 | 102.1±41.3 | 6 | 123.3±26.3 | 16 [ns] | 59.4±17.8 | 5 [ns] | 72.9±12.1 | 8 [ns] |
|
| ||||||||||||||||||||
| ICp | 45.6±5.5 | 8 | 24.1±5.7 | 5 | 25.6±5.6 | 6 | 33.6±3.9 | 19 [ns] | 32.0±11.6 | 4 | 24.8±4.0 | 6 | 29.2±4.4 | 6 | 28.2±3.4 | 16 [ns] | 31.1±7.3 | 5 [ns] | 41.7±7.5 | 8 [ns] |
Significance [*] is indicated by Greek characters (α, β, and γ) that denote significant post hoc comparisons (P ≤ 0.05), with shared characters indicating statistical similarity between groups (EPW, LPW, 60S, and 60E). Groups that do not share a character were significantly different. Bolded Greek characters denote non-significant trends (see Data Analysis in Materials and Methods) between groups.
Table 4.
Vasopressin Receptor 1a 125I Binding (Mean ± SEM dpm/mg TE) across all pre-wean ages and adulthood in female prairie voles. Grey shaded columns represent the groups that were compared in statistical analyses. Early Pre Wean (EPW) ages encompassed animals postnatal days 6, 9 and 12; Late Pre Wean (LPW) ages encompassed animals postnatal days 15, 18 and 21.
| Early Pre Wean (EPW) ages | Late Pre Wean (LPW) ages | Adult | ||||||||||||||||||
|---|---|---|---|---|---|---|---|---|---|---|---|---|---|---|---|---|---|---|---|---|
|
| ||||||||||||||||||||
| (S= simple, E= enriched) | ||||||||||||||||||||
|
| ||||||||||||||||||||
| 6 | 9 | 12 | EPW | 15 | 18 | 21 | LPW | 60S | 60E | |||||||||||
| Mean ±SE |
N | Mean ±SE |
N | Mean ±SE |
N | Mean ±SE |
N [*] |
Mean ±SE |
N | Mean ±SE |
N | Mean ±SE |
N | Mean ±SE |
N [*] |
Mean ±SE |
N [*] |
Mean ±SE |
N [*] |
|
| OBm | 478.4±116.4 | 7 | 520.4±135.1 | 5 | 834.3±189.0 | 5 | 595.5±87.0 | 17 [α] | 717.3±115.7 | 5 | 1258.0±257.7 | 5 | 1224.8±270.2 | 5 | 1066.7±137.6 | 15 [β] | 1583.7±227.5 | 9 [βγ] | 1905.5±313.9 | 8 [γ] |
|
| ||||||||||||||||||||
| OBa | 2626.0±380.7 | 7 | 2982.1±427.3 | 5 | 3797.7±424.5 | 5 | 3075.4±253.0 | 17 [α] | 4358.5±255.5 | 5 | 5756.9±285.2 | 5 | 4994.9±468.9 | 5 | 5036.8±241.3 | 15 [β] | 5051.2±217.6 | 9 [β] | 5632.3±396.4 | 8 [β] |
|
| ||||||||||||||||||||
| VPall | 5882.0±401.2 | 7 | 5767.3 255.6 | 5 | 5183.0±211.4 | 5 | 5642.7±196.4 | 17 [α] | 5320.1±339.0 | 5 | 5198.0±435.7 | 5 | 5177.4±243.4 | 5 | 5231.8±187.0 | 15 [αβ] | 4757.6±205.4 | 9 [β] | 4735.8±262.1 | 8 [β] |
|
| ||||||||||||||||||||
| LS | 1732.7±204.0 | 7 | 2217.1±494.3 | 5 | 1910.0±111.2 | 5 | 1927.3±166.8 | 17 [ns] | 2291.8±277.8 | 5 | 2503.8±339.8 | 5 | 2390.8±361.3 | 5 | 2395.5±177.0 | 15 [ns] | 2381.8±383.8 | 9 [ns] | 2475.7±374.2 | 8 [ns] |
|
| ||||||||||||||||||||
| BNST | 2730.3±214.6 | 7 | 2409.3±222.8 | 5 | 2885.8±327.6 | 5 | 2681.6±144.4 | 17 [ns] | 2790.0±343.8 | 5 | 2556.8±406.5 | 5 | 2843.0±177.2 | 5 | 2730.0±176.3 | 15 [ns] | 2344.3±135.9 | 9 [ns] | 2484.7±180.7 | 8 [ns] |
|
| ||||||||||||||||||||
| PVN | 1528.9±137.8 | 7 | 2016.8±100.9 | 5 | 1496.9±176.5 | 5 | 1663.0±96.1 | 17 [α] | 1254.3±190.6 | 5 | 744.7±172.2 | 5 | 1491.7±213.1 | 5 | 1163.6±132.5 | 15 [β] | 863.5±228.7 | 9 [βγ] | 705.6±79.5 | 8 [γ] |
|
| ||||||||||||||||||||
| SCN | 1582.7±298.7 | 7 | 1711.7±183.9 | 5 | 1230.4±207.7 | 5 | 1517.0±147.5 | 17 [ns] | 1167.5±267.1 | 5 | 1042.1±238.8 | 5 | 1616.4±224.9 | 5 | 1275.3±146.2 | 15 [ns] | 1058.3±170.2 | 9 [ns] | 1219.8±174.7 | 8 [ns] |
|
| ||||||||||||||||||||
| AH | 3508.8±314.4 | 7 | 4142.0±375.6 | 5 | 3527.3±536.8 | 5 | 3700.4±227.8 | 17 [α] | 2956.5±358.9 | 5 | 2866.5±436.4 | 5 | 3216.6±174.9 | 5 | 3013.2±186.8 | 15 [β] | 2301.0±249.6 | 9 [γ] | 2401.9±192.0 | 8 [γ] |
|
| ||||||||||||||||||||
| LDTh | 1188.6±476.2 | 7 | 4468.0±556.5 | 5 | 5093.3±427.2 | 5 | 3301.5±519.7 | 17 [α] | 5375.5±733.7 | 5 | 5732.5±215.0 | 5 | 5120.8±1197.7 | 5 | 5409.6±443.6 | 15 [β] | 4409.0±366.6 | 8 [γ] | 5572.3±489.0 | 8 [β] |
|
| ||||||||||||||||||||
| MDTh | −92.0±119.5 | 7 | 959.0±669.3 | 5 | 2481.0±647.6 | 5 | 973.9±370.1 | 17 [α] | 2286.5±516.2 | 5 | 3207.4±672.5 | 5 | 3875.1±955.3 | 5 | 3123.0±430.9 | 15 [β] | 2292.6±540.1 | 8 [β] | 3156.6±540.0 | 8 [β] |
|
| ||||||||||||||||||||
| VPTh | 15.3±119.5 | 7 | 1975.5±669.3 | 5 | 1983.0±647.6 | 5 | 1170.6±352.2 | 17 [α] | 2979.7±516.2 | 5 | 3148.8±672.5 | 5 | 3827.8±955.3 | 5 | 3318.8±451.6 | 15 [β] | 1276.8±540.1 | 8 [α] | 1992.4±540.0 | 8 [α] |
|
| ||||||||||||||||||||
| RSC | 2363.6±414.4 | 7 | 3624.5±582.9 | 5 | 4233.6±185.9 | 5 | 3284.5±307.5 | 17 [α] | 3826.2±595.3 | 5 | 3223.5±694.9 | 5 | 3321.9±578.3 | 5 | 3457.2±341.4 | 15 [α] | 1326.5±541.1 | 9 [β] | 2428.2±428.2 | 8 [αβ] |
|
| ||||||||||||||||||||
| CeA | 3449.6±295.8 | 7 | 3168.1±606.9 | 5 | 2712.3±666.5 | 5 | 3150.0±281.2 | 17 [ns] | 1935.7±435.7 | 5 | 2865.0±542.7 | 5 | 3376.8±440.4 | 5 | 2725.8±300.0 | 15 [ns] | 3174.7±347.1 | 9 [ns] | 3181.1±408.9 | 8 [ns] |
|
| ||||||||||||||||||||
| MeA | 2069.0±283.0 | 7 | 2639.7±347.7 | 5 | 2318.6±334.4 | 5 | 2310.3±181.6 | 17 [ns] | 2040.2±354.0 | 5 | 2570.0±156.8 | 5 | 3275.5±596.1 | 5 | 2628.5±257.7 | 15 [ns] | 2430.9±196.1 | 9 [ns] | 2976.2±344.8 | 8 [ns] |
|
| ||||||||||||||||||||
| VMH | 3427.8±249.2 | 7 | 4154.9±401.3 | 5 | 3198.8±448.4 | 5 | 3574.3±213.4 | 17 [ns] | 2875.4±517.4 | 5 | 3526.0±466.3 | 5 | 3727.8±314.8 | 5 | 3376.4±255.1 | 15 [ns] | 3123.6±215.6 | 9 [ns] | 3262.9±236.4 | 8 [ns] |
Significance [*] is indicated by Greek characters (α, β, and γ) that denote significant post hoc comparisons (P ≤ 0.05), with shared characters indicating statistical similarity between groups (EPW, LPW, 60S, and 60E). Groups that do not share a character were significantly different. Bolded Greek characters denote non-significant trends (see Data Analysis in Materials and Methods) between groups.
Data Analysis
We binned the pre-weaning aged animals into two groups for our analysis to capture the first half (PND 6, 9, 12; Early Pre-Wean) and second half (PND 15, 18, 21; Late Pre-Wean) of postnatal pre-weaning development. We chose to group our animals this way because these ages reflect specific behavioral and physiological milestones of prairie vole development (McGuire & Novak, 1984). Prairie voles just begin to enter the early stages of locomotion and independent behavior around PND 6–12, and become highly active, obtaining their own solid food, and engaging in play behavior by PND 15–21. Furthermore, these age-spans capture important neurodevelopmental stages of growth and brain development in rodents and humans (Gottlieb et al. 1977; Semple et al. 2013). Finally, our results demonstrated that nonapeptide receptor expression generally did not differ within these binned age groups (see Results and Tables 1–4 below).
As just explained, our study compared the influence of environmental and social enrichment on brain development. We operationally defined an effect of enrichment using at least one of the two following criteria. We considered enrichment to have impacted nonapeptide receptor neural phenotype either (1) when Enriched Adult animals were different from Late Pre-Wean animals (ages 15 to 21), but Simple Adult animals were not, or (2) when Simple and Enriched Adult values differed.
For practical reasons, male and female brains were labeled in separate autoradiography procedures, preventing direct comparison of expression values. We therefore limit discussion of sex differences to qualitative differences in patterns that are observed between the two sexes for any given region. We performed a nonparametric Kruskal-Wallis test, and the Dunn’s test was used for post hoc pairwise multiple comparisons to compare receptor densities within each region across our four groups (Early Pre-Wean, Late Pre-Wean, Simple Adult, Enriched Adult). Nonparametric statistics were necessary because the assumption of homogeneity of variances between groups was not met, as determined by the Bartlett test. Dunn test P-values were rounded to nearest one-hundredth decimal, and we considered alpha ≤ 0.05 to be statistically significant.
Unfortunately, due to practical constraints, our sample sizes – particularly for the adult animal groups – were relatively small, placing us at risk of making type 2 statistical errors. Thus, although we did not consider such trends to be significantly different, in some instances non-statistically significant trends are worth mentioning for the readers consideration. Our intention in this paper is to shine a light on general patterns of receptor expression as a function of development and enrichment. Therefore, we include some discussion of non-statistically significant trends (1) to highlight the overarching patterns, (2) openly characterize those patterns and the specific data comparisons, and (3) provide the reader with such information within a relatively conservatively defined window in case type 2 errors were made. We limited our discussion of trends based on the following. Firstly, we calculated an estimated effect size of the average statistically different post hoc comparison for receptor expression between any group. That mean effect size (Cohen’s d) was 1.36. We then used G*Power (v3.1.9.3; Faul et al. 2007, 2009) to estimate the necessary sample size per group needed to safely assess the contrasts. Based on these results, we only considered a non-significant trend to be at risk of being under powered and therefore worthy of discussion if the power analysis output indicated that an increase in sample size of one third or less was necessary; for example requiring an increase in sample size from 4 to 6.
RESULTS
Patterns of Oxytocin Receptor Development
Patterns of developmental change in OTR densities across the forebrain were region-specific, and in some cases, sex-specific (Figs. 1–4, Table 1 and 3). In certain forebrain regions, expression profiles were stable and did not differ across development or as a function of enrichment in adulthood. However, in many brain regions OTR density increased in expression over development, increased in expression due to enrichment, or both. Regions were analyzed individually and are reported separately below.
Figure 4.

Hippocampus (HPC) OTR expression over development and due to environmental enrichment. (A) Autoradiogram of typical OTR binding in the HPC of an adult. Dashed line encircles the HPC to indicate the borders of this region. Scale bar = 1 mm. (B–C) Mean (±SEM) HPC OTR (dpm/mg TE) for females and males, respectively, following Figure 1.
Table 3.
Oxytocin Receptor 125I Binding (Mean ± SEM dpm/mg TE) across all pre-wean ages and adulthood in female prairie voles. Grey shaded columns represent the groups that were compared in statistical analyses. Early Pre Wean (EPW) ages encompassed animals postnatal days 6, 9 and 12; Late Pre Wean (LPW) ages encompassed animals postnatal days 15, 18 and 21.
| Early Pre Wean (EPW) ages | Late Pre Wean (LPW) ages | Adult | ||||||||||||||||||
|---|---|---|---|---|---|---|---|---|---|---|---|---|---|---|---|---|---|---|---|---|
|
| ||||||||||||||||||||
| (S= simple, E= enriched) | ||||||||||||||||||||
|
| ||||||||||||||||||||
| 6 | 9 | 12 | EPW | 15 | 18 | 21 | LPW | 60S | 60E | |||||||||||
| Mean ±SE |
N | Mean ±SE |
N | Mean ±SE |
N | Mean ±SE |
N [*] |
Mean ±SE |
N | Mean ±SE |
N | Mean ±SE |
N | Mean ±SE |
N [*] |
Mean ±SE |
N [*] |
Mean ±SE |
N [*] |
|
| PFC | 73.8±7.3 | 9 | 66.6±11.7 | 5 | 85.6±25.8 | 5 | 75.0±7.8 | 19 [α] | 169.1±21.2 | 5 | 243.8±41.6 | 5 | 232.2±50.3 | 5 | 215.0±22.9 | 15 [β] | 276.5±28.1 | 6 [βγ] | 349.8±41.9 | 8 [γ] |
|
| ||||||||||||||||||||
| ICa | 73.9±16.3 | 9 | 41.2±14.1 | 5 | 85.8±23.8 | 5 | 68.5±10.8 | 19 [α] | 84.4±22.9 | 5 | 149.2±25.6 | 5 | 92.2±18.0 | 5 | 108.6±14.3 | 15 [β] | 112.1±21.4 | 6 [βγ] | 181.3±30.1 | 8 [γ] |
|
| ||||||||||||||||||||
| NAcc | 63.0±23.4 | 9 | 54.1±14.0 | 5 | 145.5±27.8 | 5 | 82.4±15.9 | 19 [α] | 132.3±22.6 | 5 | 134.1±24.6 | 5 | 171.7±59.0 | 5 | 146.0±21.5 | 15 [β] | 203.1±48.9 | 6 [β] | 193.6±38.4 | 8 [β] |
|
| ||||||||||||||||||||
| SHi | 219.9±50.0 | 9 | 407.4±121.1 | 5 | 503.3±156.2 | 5 | 343.8±60.4 | 19 [ns] | 466.3±49.6 | 5 | 621.8±62.4 | 5 | 466.5±155.0 | 5 | 518.2±57.2 | 15 [ns] | 497.7±103.1 | 6 [ns] | 493.1±108.2 | 8 [ns] |
|
| ||||||||||||||||||||
| LS | 121.8±24.0 | 9 | 166.4±36.9 | 5 | 269.0±31.9 | 5 | 172.2±21.6 | 19 [ns] | 237.9±45.7 | 5 | 250.7±39.1 | 5 | 234.6±27.9 | 5 | 241.1±20.6 | 15 [ns] | 243.6±51.7 | 6 [ns] | 234.8±44.2 | 8 [ns] |
|
| ||||||||||||||||||||
| CP | 81.9±12.7 | 9 | 71.7±22.1 | 5 | 104.4±27.2 | 5 | 85.1±10.7 | 19 [α] | 97.3±11.1 | 5 | 137.7±11.9 | 5 | 106.1±20.2 | 5 | 113.7±9.3 | 15 [αβ] | 190.9±45.0 | 6 [βγ] | 180.8±23.3 | 8 [γ] |
|
| ||||||||||||||||||||
| ICm | 118.4±11.5 | 9 | 80.0±21.0 | 5 | 120.8±41.9 | 5 | 108.9±13.2 | 19 [α] | 132.2±27.5 | 5 | 169.3±24.4 | 5 | 123.3±50.8 | 5 | 141.6±20.1 | 15 [β] | 200.7±21.0 | 6 [γ] | 191.7±14.8 | 8 [γ] |
|
| ||||||||||||||||||||
| BLA | 225.3±37.1 | 9 | 202.9±31.3 | 5 | 191.0±41.2 | 5 | 210.4±21.4 | 19 [α] | 310.8±54.7 | 5 | 280.7±40.7 | 5 | 254.0±74.5 | 5 | 281.8±31.8 | 15 [β] | 340.6±59.9 | 6 [βγ] | 390.1±41.9 | 8 [γ] |
|
| ||||||||||||||||||||
| CeA | 247.1±27.1 | 9 | 220.7±45.4 | 5 | 268.4±69.0 | 5 | 245.8±23.9 | 19 [α] | 360.3±81.1 | 5 | 313.2±45.4 | 5 | 313.1±60.2 | 5 | 328.9±34.7 | 15 [β] | 411.7±73.1 | 6 [βγ] | 511.7±57.5 | 8 [γ] |
|
| ||||||||||||||||||||
| HPC | 193.9±39.0 | 9 | 340.7±73.0 | 5 | 300.3±87.0 | 5 | 260.5±36.2 | 19 [ns] | 447.2±98.7 | 5 | 312.4±48.6 | 5 | 301.8±84.4 | 5 | 353.8±46.3 | 15 [ns] | 341.8±36.5 | 6 [ns] | 272.8±30.8 | 8 [ns] |
|
| ||||||||||||||||||||
| ICp | 159.5±23.7 | 9 | 252.5±52.9 | 5 | 219.8±53.8 | 5 | 199.8±23.2 | 19 [ns] | 313.0±74.0 | 5 | 240.6±45.5 | 5 | 254.8±55.4 | 5 | 269.5±32.9 | 15 [ns] | 286.1±28.3 | 6 [ns] | 261.4±23.4 | 8 [ns] |
Significance [*] is indicated by Greek characters (α, β, and γ) that denote significant post hoc comparisons (P ≤ 0.05), with shared characters indicating statistical similarity between groups (EPW, LPW, 60S, and 60E). Groups that do not share a character were significantly different. Bolded Greek characters denote non-significant trends (see Data Analysis in Materials and Methods) between groups.
Prefrontal Cortex (PFC)
Both males (x2(3) = 26.77, P < 0.0001; Fig 1C, Table 1) and females (x2(3) = 34.25, P < 0.0001; Fig 1B, Table 3) showed increases in PFC OTR expression over development and demonstrated increases in PFC OTR as a result of enrichment. Post hoc tests showed that PFC OTR expression in Late Pre-Wean males, Simple Adult males, and Enriched Adult males was significantly greater than in Early Pre-Wean males (Dunn’s test; P = 0.0002, P = 0.007 and P < 0.0001, respectively), and Enriched Adult males had significantly more PFC OTR than Late Pre-Wean males (P = 0.04). Late Pre-Wean females, Simple Adult females, and Enriched Adult females showed significantly more PFC OTR than Early Pre-Wean females (all P < 0.0001), and Enriched Adult females had significantly more PFC OTR than Late Pre-Wean females (all P < 0.0001); Enriched Adult females had significantly more PFC OTR than Late Pre-Wean females (P = 0.05). No differences in PFC OTR were found in the remaining group comparisons (Male PFC OTR: Late Pre-Wean vs Simple Adult: P = 0.48, Simple Adult vs Enriched Adult: P = 0.10; Female PFC OTR: Late Pre-Wean vs Simple Adult: P = 0.17, Simple Adult vs Enriched Adult: P = 0.32).
Insular Cortex, anterior (ICa)
Both males (x2(3) = 9.76, P = 0.02; Table 1) and females (x2(3) = 12, P = 0.005; Table 3) demonstrated significant increases in ICa OTR as a result of enrichment, but only females demonstrated significant increases over development. ICa OTR expression in Enriched Adult males was significantly greater than in all other male groups (Early Pre-Wean: P = 0.003; Late Pre-Wean: P = 0.005; Simple Adult: P = 0.005). A similar pattern was found in females, with significantly greater ICa OTR expression in Enriched Adult females than in Early Pre-Wean females and Late Pre-Wean females (P = 0.0003 and P = 0.04, respectively). Simple Adult females and Late Pre-Wean females also had higher expression than Early Pre-Wean females (P = 0.04 and P = 0.02, respectively). No differences in ICa OTR were found in the remaining group comparisons (Male ICa OTR: Early Pre-Wean vs Late Pre-Wean: P = 0.49, Early Pre-Wean vs Simple Adult: P = 0.25, Late Pre-Wean vs Simple Adult: P = 0.25; Female ICa OTR: Late Pre-Wean vs Simple Adult: P = 0.37, Simple Adult vs Enriched Adult: P = 0.13).
Nucleus Accumbens (NAcc)
Both males (x2 (3) = 24.32, P < 0.0001; Fig 2C, Table 1) and females (x2(3) = 12.04, P = 0.007; Fig 2B, Table 3) demonstrated significant increases in NAcc OTR across development. NAcc OTR expression in Late Pre-Wean males, Simple Adult males, and Enriched males was significantly greater than in Early Pre-Wean males (P = 0.0001, P = 0.001, and P < 0.0001, respectively). NAcc OTR among females showed the same pattern: NAcc OTR expression in Late Pre-Wean females, Simple Adult females, and Enriched females was significantly greater than in Early Pre-Wean females (P = 0.01, P = 0.007, and P = 0.003, respectively). No differences in NAcc OTR were found in the remaining group comparisons (Male NAcc OTR: Late Pre-Wean vs Simple Adult: P = 0.30, Late Pre-Wean vs Enriched Adult: P = 0.13, Simple Adult vs Enriched Adult: P = 0.35; Female NAcc OTR: Late Pre-Wean vs Simple Adult: P = 0.23, Late Pre-Wean vs Enriched Adult: P = 0.19, Simple Adult vs Enriched Adult: P = 0.49).
Figure 2.

Nucleus accumbens (NAcc) OTR expression over development and due to environmental enrichment. (A) Autoradiogram of typical OTR binding in the NAcc of an adult. Dashed line encircles the NAcc to indicate the borders of this region. Scale bar = 1 mm. (B–C) Mean (±SEM) NAcc OTR (dpm/mg TE) for females and males, respectively, following Figure 1. Greek characters (α β, and γ) denote significant post hoc comparisons (P ≤ 0.05), with shared characters indicating statistical similarity between groups; bars that do not share a character were significantly different.
Caudate-Putamen (CP)
Both males (x2(3) = 18.38, P = 0.0004; Table 1) and females (x2(3) = 15.76, P = 0.001; Table 3) demonstrated significant increases in CP OTR over development, but only males demonstrated a significant increase in CP OTR as a result of enrichment. CP OTR expression in Late Pre-Wean males, Simple Adult males, and Enriched Adult males was significantly higher than in Early Pre-Wean males (P = 0.004, P = 0.03, and P < 0.0001, respectively). Enriched Adult males also had significantly higher CP OTR expression than Late Pre-Wean males (P = 0.03). CP OTR expression in Simple Adult females and Enriched Adult females was significantly higher than in Early Pre-Wean females (P = 0.004 and P = 0.0002, respectively). Further, Enriched Adult females had significantly higher CP OTR expression than Late Pre-Wean females (P = 0.02). Two non-significant trends were also found in females, suggesting that Late Pre-Wean females had higher CP OTR expression than Early Pre-Wean females (P = 0.06) and Simple Adult females had higher CP OTR expression than Late Pre-Wean females (P = 0.07). No differences in CP OTR were found in the remaining group comparisons (Male CP OTR: Late Pre-Wean vs Simple Adult: P = 0.47, Simple Adult vs Enriched Adult: P = 0.09; Female CP OTR: Simple Adult vs Enriched Adult: P = 0.34).
Insular Cortex, medial (ICm)
An increase in ICm OTR across development was found in females only (x2(3) = 15.59, P = 0.001; Table 3). ICm OTR expression in Late Pre-Wean females, Simple Adult females, and Enriched Adult females was significantly higher than in Early Pre-Wean females (P = 0.04, P = 0.0009, and P = 0.0008, respectively). Further, ICm OTR expression in Simple Adult females and Enriched Adult females was significantly higher than in Late Pre-Wean females (P = 0.04 and P = 0.05, respectively). No differences in ICm OTR were found in the remaining group comparisons (Female ICm OTR: Simple Adult vs Enriched Adult: P = 0.41). In males, ICm OTR was stable across development and did not differ (x2(3) = 1.41, P = 0.70; Table 1).
Central Amygdala (CeA)
Both males (x2(3) = 19.19, P = 0.0003; Table 1) and females (x2(3) = 18.13, P = 0.0004; Table 3) demonstrated significant increases in CeA OTR over development. Furthermore, CeA OTR in females demonstrated significant increases in CeA OTR as a result of enrichment. CeA OTR expression in Late Pre-Wean, Simple Adult males, and Enriched Adult males was greater than in Early Pre-Wean males (P = 0.0004, P = 0.05, and P = 0.0001, respectively). CeA OTR expression in Late Pre-Wean females, Simple Adult females, and Enriched Adult females was significantly higher than in Early Pre-Wean females (P = 0.03, P = 0.006, and P < 0.0001, respectively). CeA OTR expression in Enriched Adult females was also significantly higher than in Late Pre-Wean females (P = 0.009). No differences in CeA OTR were found in the remaining group comparisons (Male CeA OTR: Late Pre-Wean vs Simple Adult: P = 0.26, Late Pre-Wean vs Enriched Adult: P = 0.14, Enriched Adult vs Simple Adult males P = 0.08; Female CeA OTR: Late Pre-Wean vs Simple Adult: P = 0.13, Simple Adult vs Enriched Adult: P = 0.17).
Basolateral Amygdala (BLA)
Both males (x2(3) = 19.05, P = 0.0003; Table 1) and females (x2(3) = 14.29, P = 0.003; Table 3) showed significant increases in BLA OTR expression as a result of enrichment. BLA OTR significantly increased in females over development, whereas males demonstrated a non-significant trend following the same pattern. BLA OTR expression in Late Pre-Wean males and Enriched Adult males was significantly higher than in Early Pre-Wean males (P = 0.002 and P < 0.0001, respectively). Enriched Adult males also had significantly higher BLA OTR expression than Late Pre-Wean males and Simple Adult males (both P’s = 0.04). A non-significant trend was also found in males, suggesting Simple Adult males have higher BLA OTR than Early Pre-Wean males (P = 0.07). BLA OTR expression in Late Pre-Wean females, Simple Adult females, and Enriched Adult females was significantly higher than in Early Pre-Wean females (P = 0.03, P = 0.01, and P = 0.0003, respectively). Moreover, BLA OTR expression in Enriched Adult females was significantly higher than in Late Pre-Wean females (P = 0.03). No differences in BLA OTR were found in the remaining group comparisons (Male BLA OTR: Late Pre-Wean vs Simple Adult: P = 0.33; Female BLA OTR: Late Pre-Wean vs Simple Adult: P = 0.19, Simple Adult vs Enriched Adult: P = 0.24).
Septohippocampal Nucleus (SHi), Lateral Septum (LS), Hippocampus (HPC), and Insular Cortex, posterior (ICp)
In both males and females, OTR expression in the SHi (males: x2(3) = 5.48, P = 0.14; females: x2(3) = 5.63, P = 0.13; Table 1 and 3), LS (males: x2(3) = 5.02, P = 0.17; females: x2(3) = 5.08, P = 0.17; Fig 3, Table 1 and 3), HPC (males: x2(3) = 2.35, P = 0.50; females: x2(3) = 4.38, P = 0.22; Fig 4, Table 1 and 3), and ICp (males: x2(3) = 2.19, P = 0.53; females: x2(3) = 5.69, P = 0.13; Table 1 and 3) was stable across development and showed no statistical differences.
Figure 3.

Lateral septum (LS) OTR expression over development and due to environmental enrichment. (A) Autoradiogram of typical OTR binding in the LS of an adult. Dashed line encircles the LS to indicate the borders of this region. Scale bar = 1 mm. (B–C) Mean (±SEM) LS OTR (dpm/mg TE) for females and males, respectively, following Figure 1.
Patterns of Vasopressin Receptor Development
Patterns of developmental change in V1aR densities across the forebrain were region-specific, and in some cases, sex-specific (Figs. 5–9, Table 2 and 4). In certain forebrain regions, expression profiles were stable and did not differ across development or as a function of enrichment in adulthood. However, V1aR density was dynamic over development, was influenced by enrichment, or both in most brain regions we investigated. Compared to OTR regions, patterns of V1aR developmental trajectories were more variable, and included regions where peak V1aR expression occurred during Early Pre-Wean and/or Late Pre-Wean. The influences of enrichment on V1aR were also nearly exclusively seen in males. Generally, enrichment was associated with less V1aR when compared to the other groups. Regions were analyzed individually and are reported separately below.
Figure 5.

Ventral pallidum (VPall) V1aR expression over development and due to environmental enrichment. (A) Autoradiogram of typical V1aR binding in the VPall of an adult. Dashed line encircles the VPall to indicate the borders of this region. Scale bar = 1 mm. (B–C) Mean (±SEM) VPall V1aR (dpm/mg TE) for females and males, respectively, following Figure 1. Greek characters (α β, and γ) denote significant post hoc comparisons (P ≤ 0.05), with shared characters indicating statistical similarity between groups; bars that do not share a character were significantly different. †denotes non-significant trends (P < 0.07) between groups.
Table 2.
Vasopressin Receptor 1a 125I Binding (Mean ± SEM dpm/mg TE) across all pre-wean ages and adulthood in male prairie voles. Grey shaded columns represent the groups that were compared in statistical analyses. Early Pre Wean (EPW) ages encompassed animals postnatal days 6, 9 and 12; Late Pre Wean (LPW) ages encompassed animals postnatal days 15, 18 and 21.
| Early Pre Wean (EPW) ages | Late Pre Wean (LPW) ages | Adult | ||||||||||||||||||
|---|---|---|---|---|---|---|---|---|---|---|---|---|---|---|---|---|---|---|---|---|
|
| ||||||||||||||||||||
| (S= simple, E= enriched) | ||||||||||||||||||||
|
| ||||||||||||||||||||
| 6 | 9 | 12 | EPW | 15 | 18 | 21 | LPW | 60S | 60E | |||||||||||
| Mean ±SE |
N | Mean ±SE |
N | Mean ±SE |
N | Mean ±SE |
N [*] |
Mean ±SE |
N | Mean ±SE |
N | Mean ±SE |
N | Mean ±SE |
N [*] |
Mean ±SE |
N [*] |
Mean ±SE |
N [*] |
|
| OBm | 30.2±7.4 | 8 | 31.5±13.0 | 5 | 59.5±18.2 | 5 | 38.7±7.3 | 18 [α] | 78.9±11.8 | 5 | 87.5±11.7 | 5 | 96.1±20.8 | 6 | 88.0±9.0 | 16 [β] | 177.0±45.0 | 4 [γ] | 199.3±41.9 | 8 [γ] |
|
| ||||||||||||||||||||
| OBa | 268.0±34.8 | 8 | 234.6±37.2 | 5 | 302.9±50.5 | 5 | 268.4±22.7 | 18 [α] | 480.0±52.1 | 5 | 435.3±35.0 | 5 | 498.2±40.1 | 6 | 472.9±24.0 | 16 [β] | 611.4±52.4 | 4 [βγ] | 551.6±99.0 | 8 [γ] |
|
| ||||||||||||||||||||
| VPall | 550.4±22.5 | 8 | 675.4±88.3 | 5 | 489.5±13.2 | 6 | 564.0±28.9 | 19 [α] | 572.7±74.4 | 5 | 432.3±47.6 | 5 | 454.7±26.9 | 6 | 484.6±31.3 | 16 [α] | 565.3±76.3 | 5 [α] | 373.4±34.7 | 8 [β] |
|
| ||||||||||||||||||||
| LS | 216.6±20.7 | 8 | 312.2±45.9 | 5 | 225.8±29.6 | 6 | 244.7±19.0 | 19 [ns] | 276.4±37.3 | 5 | 207.1±18.2 | 5 | 223.4±32.5 | 6 | 234.9±18.2 | 16 [ns] | 242.2±31.0 | 5 [ns] | 198.8±29.0 | 8 [ns] |
|
| ||||||||||||||||||||
| BNST | 208.4±14.1 | 8 | 199.4±10.5 | 5 | 201.7±12.4 | 6 | 203.9±7.3 | 19 [α] | 258.0±39.8 | 5 | 165.4±10.0 | 5 | 150.2±15.7 | 6 | 188.6±17.9 | 16 [β] | 165.8±25.3 | 5 [αβγ] | 125.4±14.4 | 8 [γ] |
|
| ||||||||||||||||||||
| PVN | 134.6±17.7 | 8 | 114.4±30.2 | 5 | 107.9±27.8 | 6 | 120.8±13.4 | 19 [α] | 124.4±24.4 | 5 | 55.2±21.0 | 5 | 90.5±23.4 | 6 | 90.1±14.3 | 16 [β] | 42.5±8.4 | 5 [βγ] | 19.1±7.2 | 8 [γ] |
|
| ||||||||||||||||||||
| SCN | 118.6±12.5 | 8 | 94.3±28.4 | 5 | 101.8±17.7 | 6 | 106.9±10.3 | 19 [α] | 82.7±23.3 | 5 | 48.4±14.9 | 5 | 85.9±13.5 | 6 | 73.1±10.2 | 16 [β] | 61.6±10.4 | 5 [β] | 9.0±12.3 | 8 [γ] |
|
| ||||||||||||||||||||
| AH | 376.0±28.9 | 8 | 276.4±35.7 | 5 | 326.5±47.7 | 6 | 334.1±22.4 | 19 [α] | 390.3±48.9 | 5 | 276.6±19.4 | 5 | 248.3±19.6 | 6 | 301.5±22.9 | 16 [α] | 170.0±26.5 | 5 [β] | 167.3±16.2 | 8 [β] |
|
| ||||||||||||||||||||
| LDTh | 124.5±45.6 | 8 | 547.0±102.2 | 5 | 603.6±87.8 | 6 | 387.0±66.6 | 19 [α] | 827.5±50.3 | 4 | 634.2±64.0 | 5 | 768.3±80.7 | 6 | 739.4±43.6 | 15 [β] | 636.9±103.1 | 4 [αβ] | 470.0±23.2 | 8 [α] |
|
| ||||||||||||||||||||
| MDTh | 53.4±15.0 | 8 | 68.3±10.6 | 5 | 263.2±58.2 | 6 | 123.6±29.0 | 19 [α] | 451.2±82.0 | 4 | 346.3±57.0 | 5 | 359.5±52.7 | 6 | 379.6±35.0 | 15 [γ] | 363.3±144.5 | 4 [βγ] | 173.9±37.4 | 8 [αβ] |
|
| ||||||||||||||||||||
| VPTh | 130.2±38.7 | 8 | 276.2±75.9 | 5 | 383.8±24.7 | 6 | 248.7±36.0 | 19 [α] | 448.3±101.8 | 4 | 312.4±23.8 | 5 | 370.4±45.1 | 6 | 371.9±33.6 | 15 [γ] | 223.3±97.1 | 4 [αβ] | 146.5±23.3 | 8 [β] |
|
| ||||||||||||||||||||
| RSC | 463.0±69.5 | 8 | 202.4±25.0 | 5 | 289.2±66.9 | 6 | 339.5±43.5 | 19 [α] | 501.2±108.8 | 4 | 366.0±40.9 | 5 | 357.2±56.3 | 6 | 398.6±39.5 | 15 [α] | 244.4±119.9 | 4 [αβ] | 135.7±23.7 | 8 [β] |
|
| ||||||||||||||||||||
| CeA | 245.0±32.6 | 8 | 228.0±35.3 | 5 | 149.9±25.8 | 6 | 210.5±20.0 | 19 [ns] | 175.1±53.3 | 4 | 206.9±29.2 | 5 | 170.3±39.1 | 6 | 183.8±21.9 | 15 [ns] | 211.4±42.9 | 4 [ns] | 158.8±19.1 | 8 [ns] |
|
| ||||||||||||||||||||
| MeA | 192.5±21.5 | 8 | 183.7±30.0 | 5 | 219.4±30.0 | 6 | 198.7±14.8 | 19 [α] | 201.3±17.3 | 4 | 159.8±29.9 | 5 | 146.7±28.8 | 6 | 165.6±16.0 | 15 [α] | 159.2±31.7 | 4 [αβ] | 111.4±13.9 | 8 [β] |
|
| ||||||||||||||||||||
| VMH | 281.5±36.7 | 8 | 266.3±46.9 | 5 | 245.9±33.0 | 6 | 266.3±21.4 | 19 [α] | 260.6±36.0 | 4 | 187.4±34.3 | 5 | 164.8±34.6 | 6 | 197.9±21.6 | 15 [β] | 194.6±55.9 | 4 [αβγ] | 129.0±14.9 | 8 [γ] |
Significance [*] is indicated by Greek characters (α, β, and γ) that denote significant post hoc comparisons (P ≤ 0.05), with shared characters indicating statistical similarity between groups (EPW, LPW, 60S, and 60E). Groups that do not share a character were significantly different. Bolded Greek characters denote non-significant trends (see Data Analysis in Materials and Methods) between groups.
Main Olfactory Bulbs (OBm)
Both males (x2(3) = 29.2, P < 0.0001; Table 2) and females (x2(3) = 21.9, P < 0.0001; Table 4) showed increases in OBm V1aR expression over development. OBm V1aR expression in Late Pre-Wean males, Simple Adult males, and Enriched Adult males was significantly higher than in Early Pre-Wean males (Dunn’s test: P = 0.003, P = 0.0002, and P < 0.0001, respectively). Further, Simple Adult males and Enriched Adult males had significantly higher OBm V1aR expression than Late Pre-Wean males (P = 0.04 and P = 0.005, respectively). OBm V1aR expression in Late Pre-Wean females, Simple Adult females, and Enriched Adult females was significantly higher than in Early Pre-Wean females (P = 0.008, P = 0.0002, and P < 0.0001, respectively). Furthermore, OBm V1aR expression in Enriched Adult females was significantly higher than in Late Pre-Wean females (P = 0.02). A non-significant trend was also found in females, suggesting Simple Adult females might have higher OBm V1aR expression than Late Pre-Wean females (P = 0.07). No differences in OBm V1aR were found in the remaining group comparisons (Male OBm V1aR: Simple Adult vs Enriched Adult: P = 0.39; Female OBm V1aR: Simple Adult vs Enriched Adult: P = 0.29).
Accessory Olfactory Bulbs (OBa)
Both males (x2(3) = 30.95, P < 0.0001; Table 2) and females (x2(3) = 26.07, P < 0.0001; Table 4) showed significant increases in OBa V1aR expression over development. OBa V1aR expression in Late Pre-Wean males, Simple Adult males, and Enriched Adult males was significantly higher than in Early Pre-Wean males (P = 0.0001, P = 0.0001, and P < 0.0001, respectively). OBa V1aR expression in Enriched Adult males was significantly higher than in Late Pre-Wean males (P = 0.04). A non-significant trend was also found in males, suggesting Simple Adult males might have higher OBa V1aR expression than Late Pre-Wean males (P = 0.07). OBa expression in Late Pre-Wean females, Simple Adult females, and Enriched Adult females was significantly higher than in Early Pre-Wean females (P < 0.0001, P = 0.0004, and P < 0.0001, respectively). No differences in OBa V1aR were found in the remaining group comparisons (Male OBa V1aR: Simple Adult vs Enriched Adult: P = 0.47; Female OBa V1aR: Late Pre-Wean vs Simple Adult: P = 0.49, Late Pre-Wean vs Enriched Adult: P = 0.15, Simple Adult vs Enriched Adult: P = 0.17).
Ventral Pallidum (VPall)
Males demonstrated significantly less VPall V1aR expression as a result of enrichment (x2(3) = 12.68, P = 0.01; Fig 5C, Table 2), whereas females demonstrated a significant decrease in VPall V1aR expression over development (x2(3) = 10.67, P = 0.01; Fig 5B, Table 4). VPall V1aR expression in Enriched Adult males was significantly lower than in Early Pre-Wean males, Late Pre-Wean males, and Simple Adult males (P = 0.0005, P = 0.02, and P < 0.003, respectively). A non-significant trend was also found in males, suggesting Late Pre-Wean males have lower VPall V1aR expression than Early Pre-Wean males (P = 0.07). VPall V1aR expression in Simple Adult females and Enriched Adult females was significantly lower than in Early Pre-Wean females (P = 0.003 and P = 0.005, respectively). A non-significant trend was also found in females, suggesting that expression for Late Pre-Wean females might be lower than Early Pre-Wean females (P = 0.07). No differences in VPall V1aR were found in the remaining group comparisons (Male VPall V1aR: Early Pre-Wean vs Simple Adult: P = 0.36, Late Pre-Wean vs Simple Adult: P = 0.09; Female VPall V1aR: Late Pre-Wean vs Simple Adult: P = 0.082, Late Pre-Wean vs Enriched Adult: P = 0.09, Simple Adult vs Enriched Adult: P = 0.50).
Bed Nucleus of the Stria Terminalis (BNST)
Males showed significantly less BNST V1aR expression as a result of enrichment (x2(3) = 14.18, P = 0.003; Table 2). Additionally, a non-significant trend in males suggest that BNST V1aR expression decreases over development. BNST V1aR expression in Late Pre-Wean males was significantly lower than in Early Pre-Wean males (P = 0.04). Enriched Adult males also had less BNST V1aR expression than Early Pre-Wean males and Late Pre-Wean males (P = 0.0001 and P = 0.01, respectively). A non-significant trend was found in males, suggesting that Simple Adult males might have lower BNST V1aR expression than Early Pre-Wean males (P = 0.07). No differences in BNST V1aR were found in the remaining group comparisons (Male BNST V1aR: Late Pre-Wean vs Simple Adult: P = 0.37, Enriched Adult vs Simple Adult: P = 0.08). In females, BNST V1aR was stable across development and showed no statistical differences (x2(3) = 2.88, P = 0.41; Table 4).
Paraventricular Nucleus (PVN)
Both males (x2(3) = 22.46, P < 0.0001; Table 2) and females (x2(3) = 18.40, P < 0.0004; Table 4) showed a decrease in PVN V1aR over development, and only females showed an apparent decrease in PVN V1aR as a result of enrichment. PVN V1aR expression in Late Pre-Wean males, Simple Adult males, and Enriched Adult males was significantly lower than in Early Pre-Wean males (P = 0.05, P = 0.005, and P < 0.0001, respectively). Further, PVN V1aR expression in Enriched Adult males was significantly lower than in Late Pre-Wean males (P = 0.001). A non-significant trend was also found in males, suggesting that Simple Adult males might have lower PVN V1aR expression than Late Pre-Wean males (P = 0.07). PVN V1aR expression in Late Pre-Weaning females and Simple Adult females were significantly lower than in Early Pre-Wean females (P = 0.01, P = 0.0006, and P = 0.0001, respectively). Furthermore, PVN V1aR expression in Enriched Adult females was significantly lower than in Late Pre-Wean females (P = 0.03). No differences in PVN V1aR were found in the remaining group comparisons (Male PVN V1aR: Simple Adult vs Enriched Adult: P = 0.16; Female PVN V1aR: Late Pre-Wean vs Simple Adult: P = 0.10, Simple Adult vs Enriched Adult: P = 0.29).
Suprachiasmic Nucleus (SCN)
Males showed a decrease in SCN V1aR over development and as a result of enrichment (x2(3) = 20.5, P = 0.0001; Table 2). SCN V1aR expression in Late Pre-Wean males, Simple Adult males, and Enriched Adult males was significantly lower than in Early Pre-Wean males (P = 0.02, P = 0.005, and P < 0.0001, respectively). Further, SCN V1aR expression in Enriched Adult males was significantly lower than in Late Pre-Wean males and in Simple Adult males (P = 0.003 and P = 0.05). No differences in SCN V1aR were found in the remaining group comparisons (Male SCN V1aR: Late Pre-Wean vs Simple Adult: P = 0.29). In females, SCN V1aR was stable across development and showed no statistical differences (x2(3) = 3.59, P = 0.31; Table 4).
Anterior Hypothalamus (AH)
Both males (x2(3) = 21.87, P < 0.0001; Table 2) and females (x2(3) = 17.58, P = 0.0005; Table 4) showed a decrease in AH V1aR expression over development. AH V1aR expression in Simple Adult males and Enriched Adult males was significantly lower than in Early Pre-Wean males (P = 0.0007 and P < 0.0001, respectively) and in Late Pre-Wean males (P = 0.006 and P = 0.001, respectively). AH V1aR expression in Late Pre-Wean females, Simple Adult females, and Enriched Adult females was significantly lower than in Early Pre-Wean females (P = 0.04, P = 0.0001, and P = 0.001, respectively). Further, AH V1aR expression in Simple Adult females and Enriched Adult females was significantly lower than in Late Pre-Wean females (P = 0.02 and P = 0.05, respectively). No differences in AH V1aR were found in the remaining group comparisons (Male AH V1AR: Early Pre-Wean vs Late Pre-Wean: P = 0.18, Simple Adult vs Enriched Adult: P = 0.46; Female AH V1AR: Simple Adult vs Enriched Adult: P = 0.35).
Laterodorsal Thalamus (LDTh)
Females (x2(3) = 14.75, P = 0.002; Fig 6B, Table 4) showed a peak of LDTh V1aR expression during Late Pre-Weaning, but also a significant increase in expression over the course of development. Males demonstrated a non-significant trend toward increasing V1aR expression over development (x2(3) = 16.56, P = 0.0009; Fig 6C, Table 2). Enrichment, however, appeared to produce an increase of LDTh V1aR expression in females, and a decrease of LDTh V1aR expression in males. LDTh V1aR expression in Late Pre-Wean males was significantly greater than in Early Pre-Wean males and Enriched Adult males (P = 0.0001 and P = 0.003, respectively). A non-significant trend was also found in males, suggesting that LDTh V1aR expression might be higher in Simple Adult males than in Early Pre-Wean males (P = 0.07). LDTh V1aR expression in Late Pre-Wean females and Enriched Adult females was significantly greater than in Early Pre-Wean females (P = 0.0009 and P = 0.001, respectively) and Simple Adult females (P = 0.03 and P = 0.02, respectively). No differences in LDTh V1aR were found in the remaining group comparisons (Male LDTh V1aR: Early Pre-Wean vs Enriched Adult: P = 0.39, Late Pre-Wean vs Simple Adult: P = 0.19, Simple Adult vs Enriched Adult: P = 0.12; Female LDTh V1aR: Early Pre-Wean vs Simple Adult: P = 0.28, Late Pre-Wean vs Enriched Adult: P = 0.32).
Figure 6.

Laterodorsal thalamus (LDTh) V1aR expression over development and due to environmental enrichment. (A) Autoradiogram of typical V1aR binding in the LDTh of an adult. Dashed line encircles the LDTh to indicate the borders of this region. Scale bar = 1 mm. (B–C) Mean (±SEM) LDTh V1aR (dpm/mg TE) for females and males, respectively, following Figure 1. Greek characters (α β, and γ) denote significant post hoc comparisons (P ≤ 0.05), with shared characters indicating statistical similarity between groups; bars that do not share a character were significantly different. †denotes a non-significant trend (P < 0.07) between groups.
Mediodorsal Thalamus (MDTh)
Both males (x2(3) = 21.01, P = 0.0001; Table 2) and females (x2(3) = 13.9, P = 0.003; Table 4) showed an increase in MDTh V1aR expression over development. In contrast, enrichment appeared to produce a decrease in MDTh V1aR expression in males only. MDTh V1aR expression in Late Pre-Wean males and Simple Adult males was significantly greater than in Early Pre-Wean males (P < 0.0001 and P = 0.01, respectively). MDTh V1aR expression in Enriched Adult males was significantly less than in Late Pre-Wean males (P = 0.009). MDTh V1aR expression in Late Pre-Wean females, Simple Adult females, and Enriched Adult females was significantly greater than in Early Pre-Wean females (P = 0.0005, P = 0.03, and P = 0.002, respectively). No differences in MDTh V1aR were found in the remaining group comparisons (Male MDTh V1aR: Early Pre-Wean vs Enriched Adult: P = 0.13, Late Pre-Wean vs Simple Adult: P = 0.30, Simple Adult vs Enriched Adult: P = 0.11; Female MDTh V1aR: Late Pre-Wean vs Simple Adult: P = 0.19, Late Pre-Wean vs Enriched Adult: P = 0.44, Simple Adult vs Enriched Adult: P = 0.18).
Ventroposterior Thalamus (VPTh)
Both males (x2(3) = 13.04, P = 0.005; Table 2) and females (x2(3) = 12.92, P = 0.005; Table 4) showed a peak of VPTh V1aR expression during Late Pre-Weaning. VPTh V1aR expression in Late Pre-Wean males was significantly greater than in Early Pre-Wean males, Simple Adult males, and Enriched Adult males (P = 0.01, P = 0.04, and P = 0.0003, respectively). VPTh V1aR expression in Enriched Adult males was significantly less than in Early Pre-Wean males (P = 0.04). In females, VPTh V1aR expression was significantly greater in Late Pre-Wean females than in Early Pre-Wean females, Simple Adult females, and Enriched Adult females (P = 0.0003, P = 0.006, and P = 0.05, respectively). No differences in VPTh V1aR were found in the remaining group comparisons (Male VPTh V1aR: Early Pre-Wean vs Simple Adult: P = 0.34, Simple Adult vs Enriched Adult: P = 0.19; Female VPTh V1aR: Early Pre-Wean vs Simple Adult: P = 0.39, Early Pre-Wean vs Enriched Adult: P = 0.12, Simple Adult vs Enriched Adult: P = 0.22).
Retrosplenial Cortex (RSC)
RSC V1aR expression for both males and females differed across treatments (males: x2(3) = 13.28, P = 0.004; females (x2(3) = 11.58, P = 0.009; Fig 7B–C, Table 2 and 4). Post hoc analyses revealed that the pattern of receptor expression progressively decreased over development for both sexes, but only females showed a significant difference over development. Specifically, Simple Adult males tended to express less RSC V1aR than Late Pre-Wean males (P = 0.07), whereas RSC V1aR expression in Simple Adult females was significantly less than in Early Pre-Wean females and Late Pre-Wean females (P = 0.002 and P = 0.001, respectively). RSC V1aR expression in Enriched Adult males was significantly less than in Early Pre-Wean males and Late Pre-Wean males (P = 0.003 and P = 0.0002, respectively). Moreover, Enriched Adult females tended to express less RSC V1aR than Late Pre-Wean females (P = 0.08). No differences in RSC V1aR were found in the remaining group comparisons (Male RSC V1aR: Early Pre-Wean vs Late Pre-Wean: P = 0.15, Early Pre-Wean vs Simple Adult: P = 0.19, Simple Adult vs Enriched Adult: P = 0.13; Female RSC V1aR: Early Pre-Wean vs Late Pre-Wean: P = 0.45, Early Pre-Wean vs Enriched Adult: P = 0.09, Simple Adult vs Enriched Adult: P = 0.09).
Figure 7.

Retrosplenial cortex (RSC) V1aR expression over development and due to environmental enrichment. (A) Autoradiogram of typical V1aR binding in the RSC of an adult. Dashed line encircles the RSC to indicate the borders of this region. Scale bar = 1 mm. (B–C) Mean (±SEM) RSC V1aR (dpm/mg TE) for females and males, respectively, following Figure 1. Greek characters (α β, and γ) denote significant post hoc comparisons (P ≤ 0.05), with shared characters indicating statistical similarity between groups; bars that do not share a character were significantly different. †denotes non-significant trends (P < 0.08) between groups.
Medial Amygdala (MeA)
Males showed a decrease in MeA V1aR due to enrichment (x2(3) = 9.84, P = 0.02; Fig 8C, Table 2). MeA V1aR expression in Enriched Adult males was significantly less than in Early Pre-Wean males and Late Pre-Wean males (P = 0.0009 and P = 0.02, respectively). No differences in MeA V1aR were found in the remaining group comparisons (Male MeA V1aR: Early Pre-Wean vs Late Pre-Wean: P = 0.10, Early Pre-Wean vs Simple Adult: P = 0.13, Late Pre-Wean vs Simple Adult: P = 0.38, Simple Adult vs Enriched Adult: P = 0.13). In females, MeA V1aR was stable across development and showed no significant differences (x2(3) = 3.71, P = 0.30; Fig 8B, Table 4).
Figure 8.

Medial amygdala (MeA) V1aR expression over development and due to environmental enrichment. (A) Autoradiogram of typical V1aR binding in the MeA of an adult. Dashed line encircles the MeA to indicate the borders of this region. Scale bar = 1 mm. (B–C) Mean (±SEM) MeA V1aR (dpm/mg TE) for females and males, respectively, following Figure 1. Greek characters (α β, and γ) denote significant post hoc comparisons (P ≤ 0.05), with shared characters indicating statistical similarity between groups; bars that do not share a character were significantly different.
Ventromedial Hypothalamus (VMH)
Males showed a decrease in VMH V1aR due to enrichment (x2(3) = 13.39, P = 0.004; Table 2). VMH V1aR expression in Enriched Adult males was significantly lower than in Early Pre-Wean males and Late Pre-Wean males (P = 0.0002 and P = 0.03, respectively). VMH V1aR expression was also significantly less in Late Pre-Wean males than in Early Pre-Wean males (P = 0.03). No differences in VMH V1aR were found in the remaining group comparisons (Male VMH V1aR: Early Pre-Wean vs Simple Adult: P = 0.13, Late Pre-Wean vs Simple Adult: P = 0.47, Enriched Adult vs Simple Adult: P = 0.07). In females, VMH V1aR was stable across development and showed no significant differences (x2(3) = 1.33, P = 0.72; Table 4).
Lateral Septum (LS) and Central Amygdala (CeA)
In both males and females, expression of LS V1aR (males: x2(3) = 1.87, P = 0.60; females: x2(3) = 3.92, P = 0.27; Fig 9, Table 2 and 4), and CeA V1aR (males: x2(3) = 2.35, P = 0.50; females: x2(3) = 1.41, P = 0.70; Table 2 and 4) was stable across development and showed no significant differences.
DISCUSSION
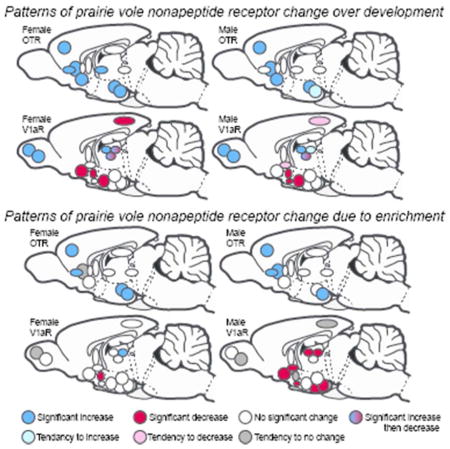
Our data strongly suggest that the developmental trajectories of OTR and V1aR throughout the forebrain of male and female prairie voles are dynamic and differ by location. Furthermore, the developmental trajectories of OTR are markedly different from those of V1aR. Whereas all OTR-expressing regions measured in males and females exhibited either no apparent change or an apparent increase over development and into adulthood, V1aR regions proved to be more dynamic, including numerous regions where expression of V1aR was highest in Early Pre-Wean and/or Late Pre-Wean (Fig 10). Environmental enrichment after weaning induced a remarkable sex-specific effect on V1aR development. In males only, post-weaning enrichment resulted in lower expression of V1aR in several regions; in females, this effect was only observed in the PVN (Fig 11, bottom). The effects of post-weaning enrichment on OTR expression were nearly identical in males and females, resulting in higher OTR expression in many regions of the brain (Fig 11, top). Below we expand on these general patterns across development, the effects of enrichment, and sex differences, with a limited focus on a few structures or patterns that merit commentary.
Figure 10.

Developmental trajectories for OTR and V1aR in male and female prairie voles. Sagittal summary schematic for OTR (top) and V1aR (bottom) expressing neural structures in females (left) and males (right). Blue represents increases in receptor expression over development. Red represents decreases in receptor expression over development. Blue-red represents a peak in receptor expression (increase then decrease) over development. Light colors represent non-significant trends. White indicates receptor density was stable over development. Abbreviations as defined in text.
Figure 11.

Influence of environmental enrichment on OTR and V1aR in male and female prairie voles. Sagittal summary schematic for OTR (top) and V1aR (bottom) expressing neural structures in females (left) and males (right). Blue represents increases in receptor expression resulting from enrichment. Red represents decreases in receptor expression resulting from enrichment. Dark grey represents non-significant trends suggesting no effect of enrichment. White indicates receptor density was not affected by enrichment. Abbreviations as defined in text.
Inferring developmental trajectories of OTR and V1aR under standard laboratory housing
In this section we focus our discussion on prairie vole patterns of receptor expression from early pre-wean to adulthood while living in standard laboratory conditions. Several forebrain regions in our study exhibited what appeared to be stable expression of OTR and V1aR over development. Indeed, in both males and females OTR did not differ for the HPC, ICp, LS, and SHi (Fig 10, top). Similarly, V1aR did not differ across development in the CeA, MeA, LS, or VMH in males or females (Fig 10, bottom). Most of these structures were also insensitive to the influence of enrichment, and showed no significant differences in any comparison for either sex (OTR: ICp, HPC, LS, SHi; V1aR: CeA, LS; Fig 10). Presumably, receptor density reflects the likelihood that either OT or VP will bind in a particular region; the greater the receptor density, the greater the chance of binding, and thus the greater sensitivity an area is likely to have for a particular ligand. It is interesting that receptor expression appears to remain constant over development in so many brain regions. Moreover, several of these areas that showed what appears to be stable sensitivity to OT or VP are noteworthy. For example, the LS, HPC, CeA and MeA serve as central nodes within the ‘social decision-making network’ (O’Connell and Hofmann, 2011). The lack of differences in receptor density across development and into adulthood suggests that sensitivity to OT and VP in these structures with known roles in mediating social behavior may serve the same functions irrespective of developmental stage or age. This stability also suggests that the impact of OT and VP in these structures has a continual and central role in the development of social behavior. If changes in receptor density at different periods over development translate into differential sensitivity to nonapeptides at different ages, then the apparent stability of OTR and V1aR in these structures indicates that their functions in these areas are independent of age.
Despite this relative stability across development, many OTR and V1aR expressing areas differed as animals aged. Among these areas, OTR expression exclusively increased over development, while the patterns of change in V1aR expression were more varied. For example, regions containing V1aR were characterized by higher expression in adulthood, lower expression in adulthood, or peak expression during late pre-weaning. Specifically, we found that OTR increased in both males and females in the BLA, CeA, CP, PFC, and NAcc (Fig 10, top). Females also increased OTR expression as they matured in the ICa and ICm. These differences were not seen in males. Like OTR, V1aR density also increased as animals aged in LDTh, MDTh, OBa, and OBm in both males and females (Fig 10, bottom). However beyond these exceptions, V1aR patterns of change differed from OTR. Specifically, V1aR expression appeared to decline over development in the AH, PVN, and RSC in both males and females, in BNST and SCN in males only, and in VPall in females only. A unique pattern of V1aR development was found in the VPTh, where V1aR expression peaked during late pre-weaning in both males and females. In the LDTh of females, we found that adults had higher V1aR expression than early pre-wean females, however the highest degree of expression occurred during late pre-weaning. In part, this suggests that V1aR in the LDTh of females follows a similar pattern to V1aR in the VPTh of both sexes.
The remarkable contrast between the developmental trajectories of OTR and V1aR expression is particularly interesting when considering that OT and VP frequently have functionally opposing influences on behavior, including learning and memory (Engelmann et al., 1996), anxiety (Neumann and Landgraf, 2012), and aggression (Bosch, 2013). Whether (and how) these bifurcating developmental patterns might relate to, or contribute to, the general antagonistic relationship between VP and OT is unclear. On the other hand, this observation may simply be an interesting coincidence. In either case, this pattern of opposition between VP/V1aR and OT/OTR merits further investigation.
Influences of post-weaning environmental enrichment on OTR and V1aR
Living in a socially and spatially complex, or ‘enriched’, environment resulted in a variety of OTR and V1aR differences in the forebrain. That said, roughly half of the structures we investigated showed no effect of enrichment in both males and females (OTR: HPC, ICm, ICp, LS, NAcc, and SHi; V1aR: AH, CeA, LS, OBa, OBm, RSC, VPTh; Fig 11). In the strictest sense only four structures in males, and one structure in females showed a difference between adults living in ‘Simple’ and ‘Enriched’ conditions. These included OTR in male BLA and ICa (both of which showed more OTR expression in the enriched condition; Table 1), and V1aR in male SCN and VPall (both of which showed less V1aR in the enriched condition; Fig 5C, Table 2). Only adult females in the ‘Enriched’ living condition showed more V1aR expression in the LDTh than in the ‘Simple’ living condition (Fig 6B, Table 4). However, several other areas of the forebrain appear to have been impacted by enrichment when placed in the context of development. Recall, we considered enrichment to have impacted nonapeptide receptor neural phenotype either when Enriched Adult animals were different from Late Pre-Wean animals, but Simple Adult animals were not, or when Simple and Enriched Adult values differed. Defining an effect of enrichment in these two ways captures two motifs: 1) when development has placed an animal on a particular trajectory (i.e., increasing or decreasing expression in a structure), enrichment enhances that trajectory even further (for example see OTR in the PFC of both males and females; Fig 1, Table 1 and 3), and 2) when a structure is apparently unaffected by development into adulthood but enrichment appears to induce a change (for example see OTR in the ICa of males; Table 1). Following these guidelines, our results showed that enrichment bolstered OTR expression in both males and females in the PFC, ICa, and BLA, the CP in just males, and in the CeA in just females (Fig 11, top). On the other hand, enrichment had a striking sex-specific effect on V1aR expression. For females, enrichment increased V1aR expression only in the LDTh, and decreased V1aR expression only in the PVN (Fig 11). On the other hand, enrichment decreased V1aR expression in the VPall, BNST, SCN, LDTh, MDTh, MeA, and VMH in males (Fig 11). Like the aforementioned patterns described over development, male OTR increased in expression while male V1aR decreased in expression when differences were found. In females, however, enrichment generally increased OTR and V1aR expression, with one exception (PVN V1aR). Five structures across males and females and receptor type demonstrated a non-significant trend for a difference between Late-Pre-Wean and Simple Adult animals in the context of no significant difference between Simple Adult and Enriched Adult animals (see above). Based on our criteria, we did not interpret these structures to have demonstrated an effect of enrichment (see Fig 7c for example). These structures are marked with dark grey in Figure 11.
Taken together, our results support the idea that post-wean developmental environmental complexity can induce an up- or down-regulation of nonapeptide receptor expression in structures of the forebrain. In light of the known influences that nonapeptide systems have on specific forebrain regions to influence prairie vole social behavior, the alteration or exaggeration of nonapeptide expression by post-wean living conditions may have far-reaching consequences on adult behavior.
Comparative perspectives of OTR and V1aR development within and between species
Our study is the first relatively exhaustive characterization of OTR and V1aR in prairie voles over development, and the only study that has also assessed the impact of post-wean enrichment on these systems. However, some earlier work investigated region-specific patterns of change over a different age range in a few structures and focused on species differences between prairie voles and their congener the montane vole (M. montanus) (Wang and Young, 1997; Wang et al., 1997). On balance, our results are consistent with these reports. For example, Wang et al. (1997) demonstrated that V1aR expression is reduced in the VPall and is static in the LS of male prairie voles as they age. Although Wang et al. (1997) and our study each found no evidence of receptor changes over prairie vole development in the LS, Wang and Young (1997) found increased expression of both OTR and V1aR in the LS of female prairie voles. It is difficult to reconcile the different outcomes in the LS between these studies. Methodological differences (like focus on different ages, the use of different radioligands, or possibly even neurological differences between sub-populations of voles) might explain some of these apparent idiosyncratic incongruences. Such differences do, however, raise the issue that there is a tremendous amount of individual variation in OTR and V1aR expression in prairie voles (Ophir et al., 2008a; Ophir et al., 2008b; Phelps and Young, 2003), and this is likely even more noticeable over the course of development. It is worth noting that pair-wise comparisons (i.e., Dunn test analysis) for LS OTR in our study suggests similar findings to those from Wang and Young (1997), however this post hoc test was not justified because overall statistical differences were not significant under the Kruskal-Wallis test.
Compared to voles, the ontogeny of OT and VP systems in rats has been well studied (Lukas et al., 2010; Shapiro and Insel, 1989; Smith et al. 2017; Tribollet et al., 1989; Tribollet et al., 1991). Similar to our findings, trajectories of OTR and V1aR during postnatal development in rats are highly specific to region. However, the characteristic patterns of OTR and V1aR we found in prairie voles contrast with the literature in rats and other rodents. For example, unlike what we found in prairie voles, OTR expression commonly follows a trajectory of reduction in male Sprague-Dawley rats. Specifically, the NAcc, CP, and thalamic nuclei (anterior and ventricular) are all intensely labeled in young rats, but later are faint or non-labeled in adulthood (Tribollet et al., 1989). In male and female C57BL/6J mice, a similar developmental pattern of OTR expression is found in the neocortex with peak expression occurring at PND 14 (Hammock and Levitt, 2013). In prairie voles, none of the seven OTR forebrain regions that differed as a function of development exhibited a reduction in receptor expression. Taken together, OTR is relatively dynamic in rodent forebrain structures over development, and structures that change tend to follow the same trajectory within a given species. However, patterns of increases or decreases in OTR expression over development and into adulthood appear to be species specific.
In contrast to OTR in other rodent species, rat V1aR expression in most forebrain regions either increases with age or remains stable (Lukas et al., 2010; Snijdewint et al., 1989; Tribollet et al., 1991). For example, V1aR in the SCN (Tribollet et al., 1991), LS, and piriform cortex (Lukas et al., 2010) expresses more in adulthood than during pre-weaning or juvenile development. Our results showed that the olfactory bulb regions (OBm and OBa), and the laterodorsal and mediodorsal thalamus (LDTh and MDTh) were the only V1aR expressing regions characterized by an increase with age. On the other hand, most structures (PVN, AH, VPall, and RSC) decreased V1aR expression over development. Interestingly, V1aR expression in the rat posterior cingulate cortex demonstrates a prominent peak of expression of V1aR around PND 10–13, followed by absence of binding after PND 19 (Tribollet et al., 1989). The posterior cingulate cortex is immediately anterior to the RSC, and the distinction between the two areas is poorly disambiguated structurally or functionally (Jones et al., 2005). The relationship between rat posterior cingulate V1aR and prairie vole RSC V1aR is unclear, but this seems to be consistent with our observation that compared to other rodents, prairie voles repeatedly demonstrate opposite themes in developmental patterns of OTR and V1aR expression. It is tempting to speculate whether these broadly defined, species-specific patterns of nonapeptide receptor development could account for some of the species-specific and developmentally regulated differences in social behaviors (e.g., pair bonding, or alloparental care), or mating tactics (see Ophir, 2017) that distinguish prairie voles from rats and mice.
Despite the importance of comparing behavioral and neural phenotype across species (c.f., Kelly and Ophir 2015, Stevenson et al 2017, Taborsky et al 2015), to our knowledge, there are very little data exploring the developmental trajectory of nonapeptide phenotype outside rodents (see above). However some studies in non-human primates provide the opportunity to explore the extent to which the developmental differences between rodent species just described are reflected in other taxa. The available data in primates consist primarily of OTR and V1aR expression in adult rhesus macaques, common marmosets, and copper titi monkeys, and these studies indicate intriguing species differences (Freeman et al. 2014a; Freeman et al. 2014b; Schorscher-Petcu et al. 2009; Young et al. 1999). Specifically, compared to macaques and marmosets, the development of OTR and V1aR in the socially monogamous copper titi monkey may follow a similar general rule that we found in the prairie vole: increasing OTR and decreasing V1aR between pre-weaning and adulthood. More developmental work in other taxa will provide an important foundation on which a broad understanding of nonapeptide development and function can be built (Kelly and Ophir 2015).
Some functional implications of the changes over development and/or due to enrichment
The behavioral and regulatory ramifications of the changes the nonapeptide system appears to undergo over development and as a result of enrichment holds great promise for future research. In particular, it is intriguing to consider how modification of OTR and V1aR expression throughout the social decision-making network (O’Connell and Hofmann, 2011, 2012) could result in behavioral changes during development. Such experiences may also place animals on particular trajectories that lead to different probabilities of engaging in important fitness-enhancing behaviors such as the decision to engage in a particular mating tactic, or the decision to form pair bonds - calling cards of prairie vole natural behavior (Ophir et al., 2008b; Zheng et al., 2013).
Social behavior and social decision-making
The social behavior network (SBN) is a network of neural structures central for the regulation and modulation of social behavior and includes the Preoptic Area, CeA, MeA, BNST, LS, AH, VMH, and the midbrain (i.e., periaqueductal grey) (Goodson, 2005; Newman, 1999). This network has been expanded into a so-called social decision-making network (SDMN), which is comprised of the SDM structures and the NAcc, VPall, CP, LS, BNST, BLA HPC, and ventral tegmental area (O’Connell and Hofmann, 2011, 2012). With the exception of the preoptic area and ventral tegmental area, all of these structures express OTR, V1aR, or both in prairie voles (Zheng et al., 2013). Note, we did not observe expression in the preoptic area and we did not characterize the ventral tegmental area. Although OTR and V1aR in some of these structures were insensitive to the influence of development or enrichment, expression within several of the SBN/SDMN structures were open to these forces, including AH, BLA, BNST, CeA, CP, MeA, NAcc, VMH, and VPall. Indeed, the ways in which nonapeptides regulate neural modulation and how this may affect social behavior in maturing animals could explain much about the extent to which animals vary in social responsiveness as they age. Increases or decreases in OTR or V1aR could indicate critical periods in development where individuals might be sensitized or deafened to the effects of nonapeptide signaling. It remains to be determined whether changes in receptor expression reflect a coming ‘on-line’ of the nonapeptide system or a pre-adult ‘tuning’ of OT/VP sensitivity at different developmental periods where animals may temporarily benefit from exaggerated OT/VP neural modulation of social behavior.
Moreover, the organizational consequences of a development-by-environment interaction could profoundly impact social responsiveness and social decision-making in adults. Indeed, mounting evidence supports the degree to which social environments impact OTR and V1aR development (Curley et al., 2011). Research in rats demonstrates that social and spatial environmental enrichment leads to increased OTR in the medial preoptic area, BNST, PVN, and the CeA (Champagne and Meaney, 2008). Maternal and paternal separation manipulations in rodents have also provided evidence for the influence of early life social environments on developmental outcomes of OTR and V1aR. In male Wistar rats, maternal separation resulted in outcomes specific to the nonapeptide system, with OTR in numerous regions (e.g., agranular insular cortex, LS, and CP) undergoing a reduction while V1aR increased (e.g., LS, and piriform cortex). We have demonstrated that pre-weaning and post-weaning social environments can interact to uniquely shape OTR and V1aR outcomes. Specifically, male prairie voles that experience single-mother rearing followed by social isolation as a juvenile are characterized by higher OTR expression in the LS (Prounis et al., 2015). Single-mother rearing had a main effect of promoting V1aR in the RSC, whereas post-weaning isolation had a main effect of promoting OTR in the PFC, BLA, and SHi (Prounis et al., 2015). Indeed, the nature in which OTR or V1aR is influenced by early social experiences is highly specific to region, and to the specific characteristics of the environmental manipulation.
Pair bonding
Prairie voles have served as the chief model for understanding the neural mechanisms for social attachment and pair bonding (Carter et al., 2008; Gobrogge and Wang, 2015; Johnson et al., 2016; Young and Wang, 2004). The accumulation of this work has outlined a central network of OT-, VP-, and dopamine-regulated neural structures that are necessary and sufficient for the formation of partner preferences and pair bonds. These include PFC, NAcc, LS, VPall, and ventral tegmental area (Young and Wang, 2004). All but one of these pair bond-governing neural structures is included in the SDMN. The network of structures that impacts pair bonding has been extended to include other supporting mechanisms and areas (including the MeA, BLA, CP, and PVN) (Johnson et al., 2016), which are also encompassed by the SDMN. Considering that social decision-making is central to the establishment of bonds, it is not terribly surprising that mechanisms important for pair bonding are largely contained within and modulated by the SBN/SDMN network.
We hypothesize that plastic responses of nonapeptide receptor systems over development and as a result of environmental enrichment may predispose an animal to adopt unique behavioral phenotypes in adulthood. For example, both males and females demonstrated an increase in PFC and NAcc OTR over development (e.g., Fig 12). Enrichment continued this trend in the PFC for both males and females. OT/OTR binding is sure to impact many important functions in the PFC and NAcc. However, the critical role that OT has in these structures for pair bonding seems particularly germane considering that increased OTR expression presumably translates to increased sensitivity to (or opportunity for) OT binding. In this sense, the OT system seems to come ‘on-line’ as animals grow, thereby enabling (among other things) the successful establishment of bonds in adults. A pattern of higher adult expression of OTR in the PFC and NAcc in males and females may therefore prepare the prairie vole brain for partner preference formation (Keebaugh and Young, 2011). When considering the species-specific nature of this increase in OTR (e.g., see above discussion of comparative perspectives), this developmental trajectory could represent a critical mechanism that led to (or was a consequence of) the evolution of the unique pair bonding behavior in prairie voles.
Figure 12.

Representative autoradiograms demonstrating increasing nucleus accumbens (NAcc) OTR expression over development in females (top) and males (bottom). Early pre-wean (PND 6, 9, 12), late pre-wean (PND 15, 18, 21), and adulthood (PND 60). Dashed lines encircle the NAcc to indicate the borders of this region. Scale bar = 1 mm.
Although VP/V1aR binding in the VPall is also directly implicated in modulating prairie vole pair bonding (Lim and Young, 2004), we note that the lack of change in males and the apparent reduction of VPall V1aR in females over development are interesting results that merit further investigation (Fig 13). This is because increased pallidal V1aR facilitates at least male bonding between mating partners (Lim and Young, 2004), and we therefore would have expected for VPall in males to increase over development. The reward-modulating NAcc-VPall circuit appears to be involved in both mediating sexual bonding and offspring bonding (Numan and Young, 2016), but it is unclear if vasopressin in the VPall in males and females functions the same in each behavioral context. For example, pregnant females show gradual decreases in pallidal V1aR as pregnancy advances (Ophir et al., 2013), potentially indicating that sex-specific changes in pallidal V1aR exist and follow this pattern of muted VP sensitivity in the VPall. Furthermore, it is unclear if male and female offspring differ in their propensity to bond with parents during postnatal development. Our data suggest this could be the case. For example, whereas VPall V1aR might be important for perinatal pups to bond with parents in both sexes (i.e., in early life), maintaining relatively high VPall V1aR may enable males to continually form or reinforce bonds with parents and siblings. As adults, VPall V1aR may be more important for males (possibly for pair bonding) than for females. These predicted behavioral outcomes would account for the decrease in female VPall V1aR over development.
Figure 13.

Representative autoradiograms demonstrating decreasing ventral pallidum (VPall) V1aR expression over development in females (top) and males (bottom). Early pre-wean (PND 6, 9, 12), late pre-wean (PND 15, 18, 21), and adulthood (PND 60). Dashed lines encircle the VPall to indicate the borders of this region. Scale bar = 1 mm.
The reduction of V1aR in the VPall of males as a result of an enriched post-wean social environment is especially perplexing. Considering that increased VP/V1aR binding in the VPall promotes bonding, reduction of V1aR in the VPall of enriched adult males should interfere with their probability of establishing partner preferences and pair bonds. It is worth noting that the specific manipulation in the enriched context exposed males to three pairs of unrelated males and no females, potentially signaling that opportunities for bonding are low and that remaining single and mating opportunistically is the best possible avenue to maximize reproductive success. This hypothesis is consistent with the idea that non-bonded prairie voles in nature might ‘choose’ to remain single and mate opportunistically based on the social context (Ophir, 2017; Ophir et al., 2012; Phelps and Ophir, 2009; Solomon and Jacquot, 2002, but see Blocker and Ophir, 2016). It would also suggest that early life social experiences impact the neural mechanisms that subserve the decision to adopt particular reproductive tactics, or at least place males on trajectories that bias them to succeed within a given reproductive tactic (Okhovat et al., 2015; Ophir et al., 2012; Ophir et al., 2008b).
Socio-spatial memory
We have argued elsewhere that social and spatial memory are particularly important for prairie voles to navigate their social landscape (Okhovat et al., 2015; Ophir, 2017; Ophir et al., 2012; Ophir et al., 2008b; Phelps and Ophir, 2009). Variation in the cognitive ecology of prairie voles has likely led to individual variation in brain-behavior phenotypes and ultimately appears to shape the reproductive tactics these animals adopt. Although the focus on nonapeptides in social behavior seems to have overshadowed their roles in memory, there is indeed a rich literature on the roles of OT/OTR and VP/V1aR in regulating various forms of memory (McEwen, 2004). Based on this foundation, Ophir (2017) argued that nonapeptides modulate the assessment of social and spatial information, and enable prairie voles to react to their social environment in a way that will enhance their probability of successfully reproducing.
One notable pattern of results from this study is that many OTR expressing areas of the forebrain that are important for memory (HPC, SHi, LS) were fairly stable in the degree to which they expressed receptors over development and as a result of differing socio-spatial enrichment. This was not the case for V1aR expressing ‘memory’ areas (RSC and LDTh) where changes occurred as a result of development and/or socio-spatial enrichment. For example, LDTh V1aR expression increased over development in males and females. However, enrichment affected LDTh V1aR in opposite directions for males and females, with expression being bolstered in females but reduced in males. RSC V1aR expression decreased over development in both males and females. Ophir et al. (2008b) first implicated RSC V1aR density in prairie vole mating tactics, leading to the overarching hypothesis that RSC V1aR impacts males’ ability to encode the spatial location of conspecifics, thus leading to variable mating tactics (so-called monogamous ‘residents’ and non-monogamous ‘wanderers’) (Ophir et al., 2008b; Ophir et al. 2008c; Phelps and Ophir, 2009). Supporting this hypothesis, polymorphisms in the prairie vole gene encoding V1aR in the RSC are related to fidelity (Okhovat et al., 2015). This allelic variation is also sensitive to functional epigenetic modification, suggesting that RSC V1aR expression responds to the social context. Moreover, the presence or absence of fathers can impact RSC V1aR expression (Prounis et al., 2015). In the current study, the RSC is one of the few regions where V1aR decreases over development in both males and females. This provides a template from which to better understand the mechanisms by which experience can shape differences in RSC V1aR expression in adults, and result in differences in behavior.
Conclusion
The region-specific developmental trajectories of OTR and V1aR we report in prairie voles highlights the dynamic nature by which nonapeptide systems are likely to regulate social behavior across the lifetime of an animal. Species-specific developmental profiles of OTR and V1aR likely contribute to interspecific variation in social behavior found in both infancy and adulthood. Many of the forebrain regions in our analysis constitute the social behavior network, and the extension of the SBN, the social decision-making network (Goodson, 2005; O’Connell and Hofmann, 2011). Given the complex nature of OTR and V1aR in regulating social behavior across regions of this network, one should be cautious not to over-interpret the behavioral function of an isolated pattern of receptor development within a single forebrain region with exclusion of others. Focus should be placed on the significance of developmental processes that characterize multiple regions collectively. The general tendency for OTR expression to increase and V1aR expression to decrease into adulthood may broadly address socio-behavioral differences in this species. The manner in which social environments experienced during post-wean juvenile and adolescent stages alter trajectories of OTR and V1aR expression might influence significant socio-behavioral outcomes in adulthood. In prairie voles, these may include differences in pair bonding behavior or reproductive decision-making.
Acknowledgments
We thank Eileen Chun for her assistance in completing the tissue preparation, autoradiography procedures, and receptor density analysis. We also thank Stephen Parry at the Cornell Statistical Consulting Unit for statistical input regarding our analyses. This work was supported by funding from the Eunice Kennedy Shriver National Institute of Child Health and Human Development to (HD065604 and HD079573 to AGO), and by the Cornell University College of Arts and Sciences.
ABBREVIATIONS
- AH
anterior hypothalamus
- BLA
basolateral amygdala
- BNST
bed nucleus of the stria terminalis
- CeA
central amygdala
- CP
caudate putamen
- HPC
hippocampus
- ICa
anterior insular cortex
- ICm
medial insular cortex
- ICp
posterior insular cortex
- LDTh
laterodorsal thalamus
- LS
lateral septum
- NAcc
nucleus accumbens
- MeA
medial amygdala
- MDTh
mediodorsal thalamus
- OBa
accessory olfactory bulbs
- OBm
main olfactory bulbs
- PFC
prefrontal cortex
- PVN
paraventricular nucleus
- RSC
retrosplenial cortex
- SCN
suprachiasmic nucleus
- SHi
septo-hippocampal nucleus
- VMH
ventromedial hypothalamus
- VPall
ventral pallidum
- VPTh
ventroposterior thalamus
References
- Ahern TH, Young LJ. The impact of early life family structure on adult social attachment, alloparental behavior, and the neuropeptide systems regulating affiliative behaviors in the monogamous prairie vole (Microtus ochrogaster) Frontiers in Behavioral Neuroscience. 2009:3. doi: 10.3389/neuro.08.017.2009. [DOI] [PMC free article] [PubMed] [Google Scholar]
- Albers HE. The regulation of social recognition, social communication and aggression: vasopressin in the social behavior neural network. Hormones and Behavior. 2012;61:283–292. doi: 10.1016/j.yhbeh.2011.10.007. [DOI] [PubMed] [Google Scholar]
- Albers HE. Species, sex and individual differences in the vasotocin/vasopressin system: relationship to neurochemical signaling in the social behavior neural network. Frontiers in Neuroendocrinology. 2015;36:49–71. doi: 10.1016/j.yfrne.2014.07.001. [DOI] [PMC free article] [PubMed] [Google Scholar]
- Bales KL, Carter CS. Developmental exposure to oxytocin facilitates partner preferences in male prairie voles (Microtus ochrogaster) Behavioral Neuroscience. 2003a;117:854–859. doi: 10.1037/0735-7044.117.4.854. [DOI] [PubMed] [Google Scholar]
- Bales KL, Carter CS. Sex differences and developmental effects of oxytocin on aggression and social behavior in prairie voles (Microtus ochrogaster) Hormones and Behavior. 2003b;44:178–184. doi: 10.1016/s0018-506x(03)00154-5. [DOI] [PubMed] [Google Scholar]
- Bales KL, Perkeybile AM. Developmental experiences and the oxytocin receptor system. Hormones and Behavior. 2012;61:313–319. doi: 10.1016/j.yhbeh.2011.12.013. [DOI] [PubMed] [Google Scholar]
- Bales KL, Pfeifer LA, Carter CS. Sex differences and developmental effects of manipulations of oxytocin on alloparenting and anxiety in prairie voles. Developmental Psychobiology. 2004;44:123–131. doi: 10.1002/dev.10165. [DOI] [PubMed] [Google Scholar]
- Beery AK, Lacey EA, Francis DD. Oxytocin and vasopressin receptor distributions in a solitary and a social species of tuco-tuco (Ctenomys haigi and Ctenomys sociabilis) Journal of Comparative Neurology. 2008;507:1847–1859. doi: 10.1002/cne.21638. [DOI] [PubMed] [Google Scholar]
- Blocker TD, Ophir AG. A preference to bond? Male prairie voles form pair bonds even in the presence of multiple receptive females. Animal Behaviour. 2016;122:89–97. doi: 10.1016/j.anbehav.2016.10.007. [DOI] [PMC free article] [PubMed] [Google Scholar]
- Borrow AP, Cameron NM. The role of oxytocin in mating and pregnancy. Hormones and Behavior. 2012;61:266–276. doi: 10.1016/j.yhbeh.2011.11.001. [DOI] [PubMed] [Google Scholar]
- Bosch OJ. Maternal aggression in rodents: brain oxytocin and vasopressin mediate pup defence. Philosophical Transactions of the Royal Society B. 2013:368. doi: 10.1098/rstb.2013.0085. [DOI] [PMC free article] [PubMed] [Google Scholar]
- Carter CS. Developmental consequences of oxytocin. Physiology and Behavior. 2003;79:383–397. doi: 10.1016/s0031-9384(03)00151-3. [DOI] [PubMed] [Google Scholar]
- Carter CS, Getz LL, Gavish L, Mcdermott JL, Arnold P. Male-related pheromones and the activation of female reproduction in the prairie vole (Microtus ochrogaster) Biology of Reproduction. 1980;23:1038–1045. doi: 10.1095/biolreprod23.5.1038. [DOI] [PubMed] [Google Scholar]
- Carter CS, Grippo AJ, Pournajafi-Nazarloo H, Ruscio MG, Porges SW. Oxytocin, vasopressin and sociality. Progress in Brain Research. 2008;170:331–336. doi: 10.1016/S0079-6123(08)00427-5. [DOI] [PubMed] [Google Scholar]
- Champagne FA, Meaney MJ. Transgenerational effects of social environment on variations in maternal care and behavioral response to novelty. Behavioral Neuroscience. 2008;122:266–266. doi: 10.1037/0735-7044.121.6.1353. [DOI] [PubMed] [Google Scholar]
- Curley JP, Jensen CL, Mashoodh R, Champagne FA. Social influences on neurobiology and behavior: Epigenetic effects during development. Psychoneuroendocrinology. 2011;36:352–371. doi: 10.1016/j.psyneuen.2010.06.005. [DOI] [PMC free article] [PubMed] [Google Scholar]
- Cushing BS. The organizational effects of oxytocin and vasopressin behavioral implications. In: Choleris E, Pfaff DW, Kavaliers M, editors. Oxytocin, vasopressin and related peptides in the regulation of behavior. Cambridge: Cambridge University Press; 2013. pp. 56–71. [Google Scholar]
- Dluzen DE, Ramirez VD, Carter CS, Getz LL. Male vole urine changes luteinizing-hormone-releasing hormone and norepinephrine in female olfactory bulb. Science. 1981;212:573–575. doi: 10.1126/science.7010608. [DOI] [PubMed] [Google Scholar]
- Dumais KM, Veenema AH. Vasopressin and oxytocin receptor systems in the brain: Sex differences and sex-specific regulation of social behavior. Frontiers in Neuroendocrinology. 2016;40:1–23. doi: 10.1016/j.yfrne.2015.04.003. [DOI] [PMC free article] [PubMed] [Google Scholar]
- Engelmann M, Wotjak CT, Neumann I, Ludwig M, Landgraf R. Behavioral consequences of intracerebral vasopressin and oxytocin: Focus on learning and memory. Neuroscience and Biobehavioral Reveiws. 1996;20:341–358. doi: 10.1016/0149-7634(95)00059-3. [DOI] [PubMed] [Google Scholar]
- Faul F, Erdfelder E, Lang AG, Buchner A. G*Power 3: A flexible statistical power analysis program for the social, behavioral, and biomedical sciences. Behavior Research Methods. 2007;39:175–191. doi: 10.3758/bf03193146. [DOI] [PubMed] [Google Scholar]
- Faul F, Erdfelder E, Buchner A, Lang AG. Statistical power analyses using G*Power 3.1: Tests for correlation and regression analyses. Behavior Research Methods. 2009;41:1149–1160. doi: 10.3758/BRM.41.4.1149. [DOI] [PubMed] [Google Scholar]
- Freeman SM, Inoue K, Smith AL, Goodman MM, Young LJ. The neuroanatomical distribution of oxytocin receptor binding and mRNA in the male rhesus macaque (Macaca mulatta) Psychoneuroendocrinology. 2014a;45:128–141. doi: 10.1016/j.psyneuen.2014.03.023. [DOI] [PMC free article] [PubMed] [Google Scholar]
- Freeman SM, Walum H, Inoue K, Smith AL, Goodman MM, Bales KL, Young LJ. Neuroanatomical distribution of oxytocin and vasopressin 1a receptors in the socially monogamous coppery titi monkey (Callicebus cupreus) Neuroscience. 2014b;273:12–23. doi: 10.1016/j.neuroscience.2014.04.055. [DOI] [PMC free article] [PubMed] [Google Scholar]
- Gobrogge K, Wang Z. The ties that bond: neurochemistry of attachment in voles. Current Opinions in Neurobiology. 2016;38:80–88. doi: 10.1016/j.conb.2016.04.011. [DOI] [PMC free article] [PubMed] [Google Scholar]
- Gobrogge K, Wang ZX. Neuropeptidergic regulation of pair-bonding and stress buffering: Lessons from voles. Hormones and Behavior. 2015;76:91–105. doi: 10.1016/j.yhbeh.2015.08.010. [DOI] [PMC free article] [PubMed] [Google Scholar]
- Goodson JL. The vertebrate social behavior network: Evolutionary themes and variations. Hormones and Behavior. 2005;48:11–22. doi: 10.1016/j.yhbeh.2005.02.003. [DOI] [PMC free article] [PubMed] [Google Scholar]
- Goodson JL, Kelly AM, Kingsbury MA. Evolving nonapeptide mechanisms of gregariousness and social diversity in birds. Hormones and Behavior. 2012;61:239–250. doi: 10.1016/j.yhbeh.2012.01.005. [DOI] [PMC free article] [PubMed] [Google Scholar]
- Gottlieb A, Keydar I, Epstein HT. Rodent brain growth stages: an analytical review. Biology of the Neonate. 1977;32:166–176. doi: 10.1159/000241012. [DOI] [PubMed] [Google Scholar]
- Grinevich V, Desarmenien MG, Chini B, Tauber M, Muscatelli F. Ontogenesis of oxytocin pathways in the mammalian brain: late maturation and psychosocial disorders. Frontiers in Neuroanatomy. 2015:8. doi: 10.3389/fnana.2014.00164. [DOI] [PMC free article] [PubMed] [Google Scholar]
- Hammock EAD. Developmental perspectives on oxytocin and vasopressin. Neuropsychopharmacology. 2015;40:24–42. doi: 10.1038/npp.2014.120. [DOI] [PMC free article] [PubMed] [Google Scholar]
- Hammock EAD, Levitt P. Oxytocin receptor ligand binding in embryonic tissue and postnatal brain development of the C57BL/6J mouse. Frontiers in Behavioral Neuroscience. 2013:7. doi: 10.3389/fnbeh.2013.00195. [DOI] [PMC free article] [PubMed] [Google Scholar]
- Johnson ZV, Walum H, Jamal YA, Xiao Y, Keebaugh AC, Inoue K, Young LJ. Central oxytocin receptors mediate mating-induced partner preferences and enhance correlated activation across forebrain nuclei in male prairie voles. Hormones and Behavior. 2016;79:8–17. doi: 10.1016/j.yhbeh.2015.11.011. [DOI] [PMC free article] [PubMed] [Google Scholar]
- Jones BF, Groenewegen HJ, Witter MP. Intrinsic connections of the cingulate cortex in the rat suggest the existence of multiple functionally segregated networks. Neuroscience. 2005;133:193–207. doi: 10.1016/j.neuroscience.2005.01.063. [DOI] [PubMed] [Google Scholar]
- Keebaugh AC, Young LJ. Increasing oxytocin receptor expression in the nucleus accumbens of pre-pubertal female prairie voles enhances alloparental responsiveness and partner preference formation as adults. Hormones and Behavior. 2011;60:498–504. doi: 10.1016/j.yhbeh.2011.07.018. [DOI] [PMC free article] [PubMed] [Google Scholar]
- Kelly AM, Ophir AG. Compared to what: What can we say about nonapeptide function and social behavior without a frame of reference? Current Opinions in Behavioral Science. 2015;6:97–103. doi: 10.1016/j.cobeha.2015.10.010. [DOI] [PMC free article] [PubMed] [Google Scholar]
- Ketterson ED, Nolan V. Adaptation, exaptation, and constraint: A hormonal perspective. American Naturalist. 1999;154:S4–S25. doi: 10.1086/303280. [DOI] [PubMed] [Google Scholar]
- Lim MM, Young LJ. Vasopressin-dependent neural circuits underlying pair bond formation in the monogamous prairie vole. Neuroscience. 2004;125:35–45. doi: 10.1016/j.neuroscience.2003.12.008. [DOI] [PubMed] [Google Scholar]
- Lukas M, Bredewold R, Neumann ID, Veenema AH. Maternal separation interferes with developmental changes in brain vasopressin and oxytocin receptor binding in male rats. Neuropharmacology. 2010;58:78–87. doi: 10.1016/j.neuropharm.2009.06.020. [DOI] [PubMed] [Google Scholar]
- McEwen B. The roles of vasopressin and oxytocin in memory processing. Elsevier Academic Press; San Diego, CA: 2004. [Google Scholar]
- McGuire B, Novak M. A comparison of maternal behaviour in the meadow vole (Microtus pennsylvanicus), prairie vole (M. ochrogaster) and pine vole (M. pinetorum) Animal Behaviour. 1984;32:1132–1141. [Google Scholar]
- Miller TV, Caldwell HK. Oxytocin during development: Possible organizational effects on behavior. Frontiers in Endocrinology. 2015:6. doi: 10.3389/fendo.2015.00076. [DOI] [PMC free article] [PubMed] [Google Scholar]
- Neumann ID, Landgraf R. Balance of brain oxytocin and vasopressin: Implications for anxiety, depression, and social behaviors. Trends in Neurosciences. 2012;35:649–659. doi: 10.1016/j.tins.2012.08.004. [DOI] [PubMed] [Google Scholar]
- Newman SW. The medial extended amygdala in male reproductive behavior. A node in the mammalian social behavior network. Annals of the New York Academy of Sciences. 1999;877:242–257. doi: 10.1111/j.1749-6632.1999.tb09271.x. [DOI] [PubMed] [Google Scholar]
- Numan M, Young LJ. Neural mechanisms of mother-infant bonding and pair bonding: Similarities, differences, and broader implications. Hormones and Behavior. 2016;77:98–112. doi: 10.1016/j.yhbeh.2015.05.015. [DOI] [PMC free article] [PubMed] [Google Scholar]
- O’Connell LA, Hofmann HA. The vertebrate mesolimbic reward system and social behavior network: a comparative synthesis. Journal of Comparative Neurology. 2011;519:3599–3639. doi: 10.1002/cne.22735. [DOI] [PubMed] [Google Scholar]
- O’Connell LA, Hofmann HA. Evolution of a vertebrate social decision-making network. Science. 2012;336:1154–1157. doi: 10.1126/science.1218889. [DOI] [PubMed] [Google Scholar]
- Okhovat M, Berrio A, Wallace G, Ophir AG, Phelps SM. Sexual fidelity tradeoffs promote regulatory variation in the prairie vole brain. Science. 2015;350:1371–1374. doi: 10.1126/science.aac5791. [DOI] [PubMed] [Google Scholar]
- Olazabal DE, Alsina-Llanes M. Are age and sex differences in brain oxytocin receptors related to maternal and infanticidal behavior in naive mice? Hormones and Behavior. 2016;77:132–140. doi: 10.1016/j.yhbeh.2015.04.006. [DOI] [PubMed] [Google Scholar]
- Ophir AG. Navigating monogamy: Nonapeptide sensitivity in a memory neural circuit may shape social behavior and mating decisions. Frontiers in Neuroscience. 2017:11. doi: 10.3389/fnins.2017.00397. [DOI] [PMC free article] [PubMed] [Google Scholar]
- Ophir AG, Campbell P, Hanna K, Phelps SM. Field tests of cis-regulatory variation at the prairie vole avpr1a locus: Association with V1aR abundance but not sexual or social fidelity. Hormones and Behavior. 2008a;54:694–702. doi: 10.1016/j.yhbeh.2008.07.009. [DOI] [PubMed] [Google Scholar]
- Ophir AG, Gessel A, Zheng DJ, Phelps SM. Oxytocin receptor density is associated with male mating tactics and social monogamy. Hormones and Behavior. 2012;61:445–453. doi: 10.1016/j.yhbeh.2012.01.007. [DOI] [PMC free article] [PubMed] [Google Scholar]
- Ophir AG, Phelps SM, Sorin AB, Wolff JO. Social but not genetic monogamy is associated with greater breeding success in prairie voles. Animal Behaviour. 2008c;75:1143–1154. [Google Scholar]
- Ophir AG, Sorochman G, Evans BL, Prounis GS. Stability and dynamics of forebrain vasopressin receptor and oxytocin receptor during pregnancy in prairie voles. Journal of Neuroendocrinology. 2013;25:719–728. doi: 10.1111/jne.12049. [DOI] [PMC free article] [PubMed] [Google Scholar]
- Ophir AG, Wolff JO, Phelps SM. Variation in neural V1aR predicts sexual fidelity and space use among male prairie voles in semi-natural settings. Proceedings of the National Academy of Sciences USA. 2008b;105:1249–1254. doi: 10.1073/pnas.0709116105. [DOI] [PMC free article] [PubMed] [Google Scholar]
- Paxinos G, Watson C. The rat brain stereotaxic coordinates. 7. Academic Press; 2013. [DOI] [PubMed] [Google Scholar]
- Perkeybile AM, Griffin LL, Bales KL. Natural variation in early parental care correlates with social behaviors in adolescent prairie voles (Microtus ochrogaster) Frontiers in Behavioral Neuroscience. 2013:7. doi: 10.3389/fnbeh.2013.00021. [DOI] [PMC free article] [PubMed] [Google Scholar]
- Phelps SM, Ophir AG. Monogamous brains and alternative tactics: Neuronal V1aR, space use and sexual infidelity among male prairie voles. In: Dukas R, Ratcliffe JM, editors. Cognitive ecology II: The evolutionary ecology of information processing and decision making. University of Chicago Press; Chicago, IL: 2009. [Google Scholar]
- Phelps SM, Young LJ. Extraordinary diversity in vasopressin (V1a) receptor distributions among wild prairie voles (Microtus ochrogaster): Patterns of variation and covariation. Journal of Comparative Neurology. 2003;466:564–576. doi: 10.1002/cne.10902. [DOI] [PubMed] [Google Scholar]
- Prounis GS, Foley L, Rehman A, Ophir AG. Perinatal and juvenile social environments interact to shape cognitive behaviour and neural phenotype in prairie voles. Proceedings of the Royal Society B. 2015:282. doi: 10.1098/rspb.2015.2236. [DOI] [PMC free article] [PubMed] [Google Scholar]
- Ren D, Lu G, Moriyama H, Mustoe AC, Harrison EB, French JA. Genetic diversity in oxytocin ligands and receptors in New World monkeys. PLoS One. 2015;10:e0125775. doi: 10.1371/journal.pone.0125775. [DOI] [PMC free article] [PubMed] [Google Scholar]
- Richmond ME, Stehn RA. Olfaction and reproductive behavior in microtine rodents. In: Doty RL, editor. Mammalian olfaction, reproductive processes and behavior. New York: Academic Press, New York; 1976. pp. 197–217. [Google Scholar]
- Schorscher-Petcu A, Dupre A, Tribollet E. Distribution of vasopressin and oxytocin binding sites in the brain and upper spinal cord of the common marmoset. Neuroscience Letters. 2009;461:217–222. doi: 10.1016/j.neulet.2009.06.016. [DOI] [PubMed] [Google Scholar]
- Semple BD, Blomgren K, Gimlin K, Ferriero DM, Noble-Haeusslein LJ. Brain development in rodents and humans: Identifying benchmarks of maturation and vulnerability to injury across species. Progress in Neurobiology. 2013;106–107:1–16. doi: 10.1016/j.pneurobio.2013.04.001. [DOI] [PMC free article] [PubMed] [Google Scholar]
- Shapiro LE, Insel TR. Ontogeny of oxytocin receptors in rat forebrain: A quantitative study. Synapse. 1989;4:259–266. doi: 10.1002/syn.890040312. [DOI] [PubMed] [Google Scholar]
- Smith CJ, Poehlmann ML, Li S, Ratnaseelan AM, Bredewold R, Veenema AH. Age and sex differences in oxytocin and vasopressin V1a receptor binding densities in the rat brain: focus on the social decision-making network. Brain Structure and Function. 2017;222:981–1006. doi: 10.1007/s00429-016-1260-7. [DOI] [PMC free article] [PubMed] [Google Scholar]
- Snijdewint FGM, Vanleeuwen FW, Boer GJ. Ontogeny of vasopressin and oxytocin binding sites in the brain of Wistar and Brattleboro rats as demonstrated by light-microscopical autoradiography. Journal of Chemical Neuroanatomy. 1989;2:3–17. [PubMed] [Google Scholar]
- Solomon NG, Jacquot JJ. Characteristics of resident and wandering prairie voles, Microtus ochrogaster. Canadian Journal of Zoology. 2002;80:951–955. [Google Scholar]
- Stevenson TJ, Alward BA, Ebling FJP, Fernald RD, Kelly AM, Ophir AG. The value of comparative animal research: Krogh’s principle facilitates scientific discoveries. Policy Insights from the Behavioral and Brain Sciences. 2017:1–8. doi: 10.1177/2372732217745097. [DOI] [PMC free article] [PubMed] [Google Scholar]
- Stribley JM, Carter CS. Developmental exposure to vasopressin increases aggression in adult prairie voles. Proceeding of the National Academy of Sciences USA. 1999;96:12601–12604. doi: 10.1073/pnas.96.22.12601. [DOI] [PMC free article] [PubMed] [Google Scholar]
- Taborsky M, Hofmann HA, Beery AK, Blumstein DT, Hayes LD, Lacey EA, Martins EP, Phelps SM, Solomon NG, Rubenstein DR. Taxon matters: Promoting integrative studies of social behavior NESCent Working Group on Integrative Models of Vertebrate Sociality: evolution, mechanisms, and emergent properties. Trends in Neuroscience. 2015;38:189–191. doi: 10.1016/j.tins.2015.01.004. [DOI] [PubMed] [Google Scholar]
- Tamborski S, Mintz EM, Caldwell HK. Sex differences in the embryonic development of the central oxytocin system in mice. Journal of Neuroendocrinology. 2016:28. doi: 10.1111/jne.12364. [DOI] [PubMed] [Google Scholar]
- Tribollet E, Charpak S, Schmidt A, Duboisdauphin M, Dreifuss JJ. Appearance and transient expression of oxytocin receptors in fetal, infant, and peripubertal rat brain studied by autoradiography and electrophysiology. Journal of Neuroscience. 1989;9:1764–1773. doi: 10.1523/JNEUROSCI.09-05-01764.1989. [DOI] [PMC free article] [PubMed] [Google Scholar]
- Tribollet E, Goumaz M, Raggenbass M, Duboisdauphin M, Dreifuss JJ. Early appearance and transient expression of vasopressin receptors in the brain of rat fetus and infant: An autoradiographical and electrophysiological study. Developmental Brain Research. 1991;58:13–24. doi: 10.1016/0165-3806(91)90232-8. [DOI] [PubMed] [Google Scholar]
- Wacker DW, Ludwig M. Vasopressin, oxytocin, and social odor recognition. Hormones and Behavior. 2012;61:259–265. doi: 10.1016/j.yhbeh.2011.08.014. [DOI] [PubMed] [Google Scholar]
- Wang ZX, Young LJ. Ontogeny of oxytocin and vasopressin receptor binding in the lateral septum in prairie and montane voles. Devopmental Brain Research. 1997;104:191–195. doi: 10.1016/s0165-3806(97)00138-7. [DOI] [PubMed] [Google Scholar]
- Wang ZX, Young LJ, Liu Y, Insel TR. Species differences in vasopressin receptor binding are evident early in development: Comparative anatomic studies in prairie and montane voles. Journal of Comparative Neurology. 1997;378:535–546. [PubMed] [Google Scholar]
- Young LJ, Toloczko D, Insel TR. Localization of vasopressin (V1a) receptor binding and mRNA in the rhesus monkey brain. Journal of Neuroendocrinology. 1999;11:291–297. doi: 10.1046/j.1365-2826.1999.00332.x. [DOI] [PubMed] [Google Scholar]
- Young KA, Gobrogge KL, Liu Y, Wang ZX. The neurobiology of pair bonding: Insights from a socially monogamous rodent. Frontiers in Neuroendocrinology. 2011;32:53–69. doi: 10.1016/j.yfrne.2010.07.006. [DOI] [PMC free article] [PubMed] [Google Scholar]
- Young LJ, Wang ZX. The neurobiology of pair bonding. Nature Neuroscience. 2004;7:1048–1054. doi: 10.1038/nn1327. [DOI] [PubMed] [Google Scholar]
- Zheng DJ, Larsson B, Phelps SM, Ophir AG. Female alternative mating tactics, reproductive success and nonapeptide receptor expression in the social decision-making network. Behavioural Brain Research. 2013;246:139–147. doi: 10.1016/j.bbr.2013.02.024. [DOI] [PMC free article] [PubMed] [Google Scholar]