Abstract
Autophagy increases lifespan of model organisms; however, its role in promoting mammalian longevity is less well-established1,2. Here, we report lifespan and healthspan extension in a mouse model with increased basal autophagy. To determine the effects of constitutively increased autophagy on mammalian health, we generated targeted mutant mice with a F121A (Becn1F121A/F121A) mutation in beclin 1 that decreases its interaction with the negative regulator, Bcl-2. We demonstrate that beclin 1/Bcl-2 interaction is disrupted in multiple tissues in Becn1F121A/F121A knock-in (KI) mice in association with higher levels of basal autophagic flux. Compared to wild-type (WT) littermates, the lifespan of both male and female KI mice is significantly increased. The healthspan of the KI mice also improves as aging-related phenotypes are diminished, including age-related renal and cardiac pathological changes and spontaneous tumorigenesis. Moreover, mice deficient in the anti-aging protein, Klotho3, have increased beclin 1/Bcl-2 interaction, decreased autophagy, premature lethality and infertility which are rescued by the beclin 1 F121A mutation. Taken together, our data demonstrate that disruption of the beclin 1/Bcl-2 complex is an effective mechanism to increase autophagy, prevent premature aging, improve healthspan and promote longevity in mammals.
Autophagy, an evolutionarily conserved lysosomal degradation pathway, plays a key role in tissue homeostasis, health, and disease4. In 2003, we showed that the autophagy gene, Bec-1 (C. elegans ortholog of yeast ATG6/mammalian beclin 1) was required for lifespan extension in nematodes with a loss-of-function in the insulin signaling pathway5. Subsequently, numerous loss-of-function studies in C. elegans and Drosophila have confirmed an essential role for the autophagy machinery in longevity1, 2, and tissue-specific deletion of core autophagy genes have shown that autophagy delays age-related changes in mouse tissues, including kidney and heart6,7. Moreover, physiological inducers (such as caloric restriction) as well as pharmacological inducers (such as spermidine) of autophagy increase mouse lifespan1,8,9. Despite these clues that autophagy may be a longevity pathway in mammals, definitive evidence is lacking that increased basal autophagy extends mammalian healthspan and lifespan.
An earlier study10 demonstrated an increase in lifespan of mice that transgenically overexpress Atg5. However, it is unclear how overexpression of Atg5, a protein necessary for autophagy but not directly involved in the regulation of autophagy levels, results in increased autophagy. Moreover, Atg5 has other key functions, especially the regulation of inflammation11, which are not shared by other genes in the autophagy pathway. Therefore, it is imperative to use a more direct and more specific genetic approach to assess the effects of enhanced basal autophagy on mammalian lifespan and healthspan. To do so, we focused on the mammalian autophagy protein, beclin 112, which is part of an autophagy-specific Class III phosphatidylinositol-3 kinase (PI3K) complex13 that plays a key role in regulation of the initiation of autophagosome formation14.
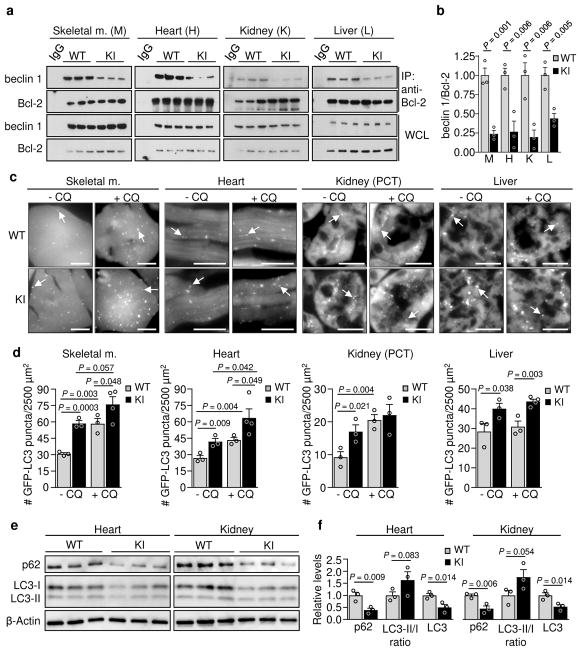
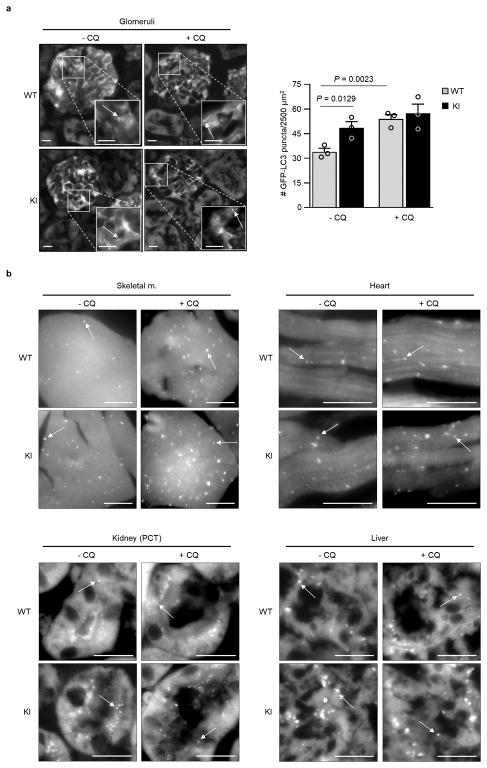
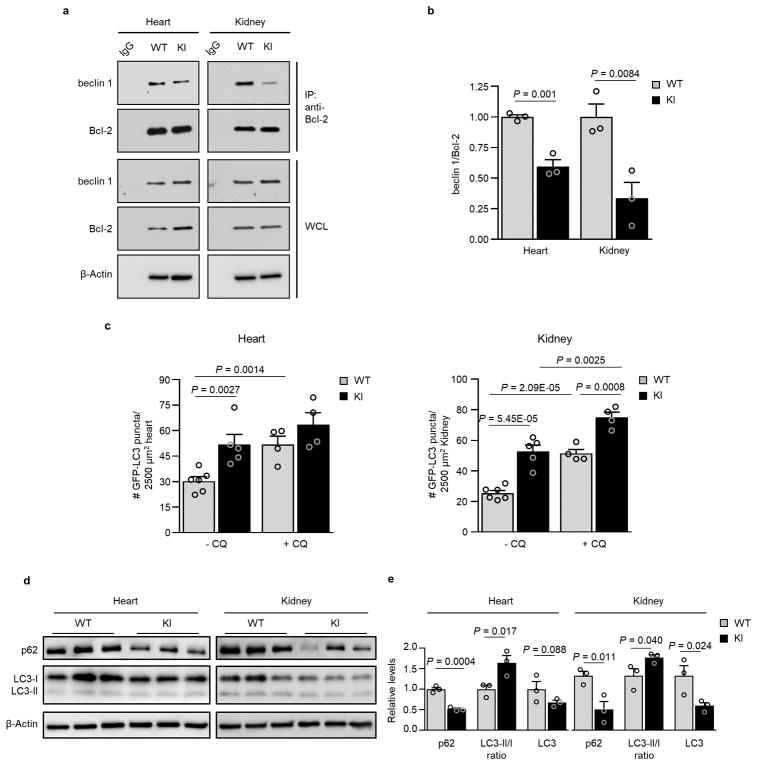
We recently reported the construction of mice with a knock-in (KI) substitution mutation in the BH3 domain of beclin 1, F121A15 (corresponding to human beclin 1 F123A), that decreases binding of two negative regulators of autophagy, Bcl-2 and Bcl-xL, to beclin 1 in vitro16,17. Using these mice, we performed co-immunoprecipitation of endogenous beclin 1 with Bcl-2 in muscle, heart, kidney and liver of two month-old WT and homozygous KI mice. We observed marked reduction in beclin 1 co-immunoprecipitation with Bcl-2 in tissues of the KI mice (Fig. 1a, b). In parallel, we analyzed autophagic flux by crossing WT or KI mice with animals that transgenically express GFP-LC318, a fluorescent marker of autophagosomes. In skeletal muscle, heart, renal glomeruli and proximal convoluted tubules, and liver, KI mice had significantly increased numbers of GFP-LC3 puncta compared to WT control littermates (Fig. 1c, d; Extended Data Fig. 1). In all tissues except for liver, there was a further increase in GFP-LC3 puncta upon treatment with chloroquine, an inhibitor of lysosomal acidification and autophagosome-lysosomal fusion, indicating that the increased numbers of GFP-LC3 puncta in KI mice represents a true increase in basal autophagic flux, rather than a block in autophagosomal maturation. We further confirmed that KI mice had increased autophagic flux by western blot analyses. Both hearts and kidneys had increased conversion of LC3-I to LC3-II (the lipidated, autophagosome-associated form of LC3), decreased levels of total LC3 and decreased levels of p62, a substrate of autophagy19 (Fig. 1e, f). Similar findings were also observed in hearts and kidneys of 6–8 month-old mice (Extended Data Fig. 2), indicating that the effects of the KI mutation are sustained over time in adulthood.
Figure 1. Effects of beclin 1 F121A mutation on beclin 1/Bcl-2 interaction and basal autophagy.
a, Co-immunoprecipitation of beclin 1 and Bcl-2 in indicated tissues from two month-old Becn1WT/WT (WT) and Becn1F121A/F121A (KI) animals. b, Quantitation of beclin 1 co-immunoprecipitated with Bcl-2 in (a). c, Representative images of GFP-LC3 puncta (autophagosomes) in indicated tissues from Becn1WT/WT:GFP-LC3 (WT) and Becn1F121A/F121A:GFP-LC3 (KI) mice +/− chloroquine (CQ) (50 mg kg−1, 6 h). Scale bars, 10 μm. (See enlarged images, Extended Data 1). White arrows denote representative GFP-LC3 puncta. d, Quantitation of GFP-LC3 puncta +/− CQ in indicated tissues. e, Western blot analysis of autophagy markers in hearts and kidneys of 2 month-old WT and KI mice. f, Quantitation of p62 and total LC3 levels (normalized to β-Actin) and LC3-II/I ratio in (e). Bars represent mean ± s.e.m for three mice per genotype. For (a) and (e), each lane represents a different mouse. One-sided unpaired t-test. PCT, renal proximal convoluted tubules. WCL, whole cell lysate. For uncropped gels, see Supplementary Fig. 1.
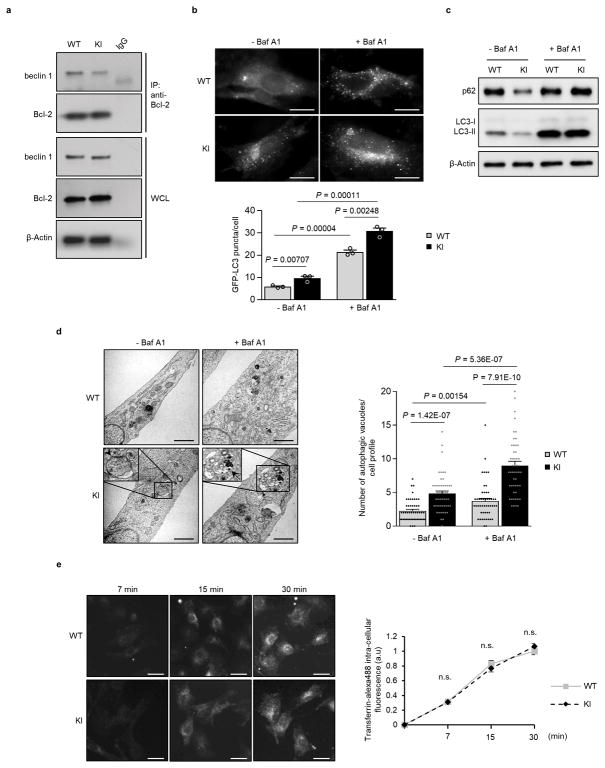
We further evaluated the effect of the KI mutation on autophagy using murine embryonic fibroblasts (MEFs) derived from KI or WT littermate controls. In KI MEFs, there was decreased beclin 1 co-immunoprecipitation with Bcl-2, increased numbers of GFP-LC3 puncta, decreased levels of p62 and total LC3 and increased numbers of autophagic structures (autophagosomes and autolysosomes) observed by quantitative electron microscopy (Extended Data Fig. 3a–d). Treatment with the lysosomal inhibitor, bafilomycin A1 (Baf A1) indicated a bona fide increase in autophagic flux in KI MEFs. To evaluate possible effects of the beclin 1 KI mutation other than autophagy, we examined endocytosis, a process thought to involve the beclin 1/Vps34-C2 complex20. We did not observe any significant differences in endocytosis in KI vs. WT MEFs, as measured by the kinetics of endocytic uptake of fluorescent transferrin (Extended Data Fig. 3e). This is expected as Bcl-2 binding to beclin 1 has not been shown to regulate beclin 1-dependent functions other than autophagy.
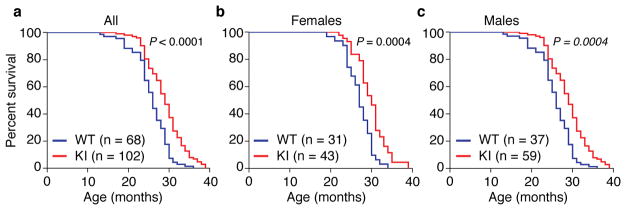
Taken together, these findings demonstrate that the Becn1F121A/F121A KI mouse model is useful for studying the effects of constitutively increased basal autophagy on mammalian lifespan and healthspan. Therefore, we evaluated the lifespan of a large cohort of beclin 1 KI and WT littermates (Fig. 2) on an inbred C57BL/6 background. The combined data for males and females showed a significant lifespan extension (Fig. 2a) of KI mice compared to WT littermate controls (WT median survival = 26 months; KI median survival = 29 months). This extension in longevity was observed both in females (WT median survival = 27 months; KI median survival = 30 months) and males (WT median survival = 25 months; KI median survival = 28 months) (Fig. 2b, c; Extended Data Table 1), showing a sex-independent effect of the beclin 1 F121A mutation on lifespan. Knock-in mice also had an increase in maximal lifespan (Extended Data Table 1). Thus, this gain-of-function mutation in a core autophagy gene, beclin 1, extends mammalian lifespan.
Figure 2. Beclin 1 F121A KI mutation extends lifespan in mice.
Kaplan-Meier survival curves for Becn1WT/WT (WT) and Becn1F121A/F121A (KI) mice, showing the lifespan of all mice in cohort (a), females alone (b) or males alone (c). N = number of mice per group. P-values are calculated by log-rank (Mantel-Cox) test.
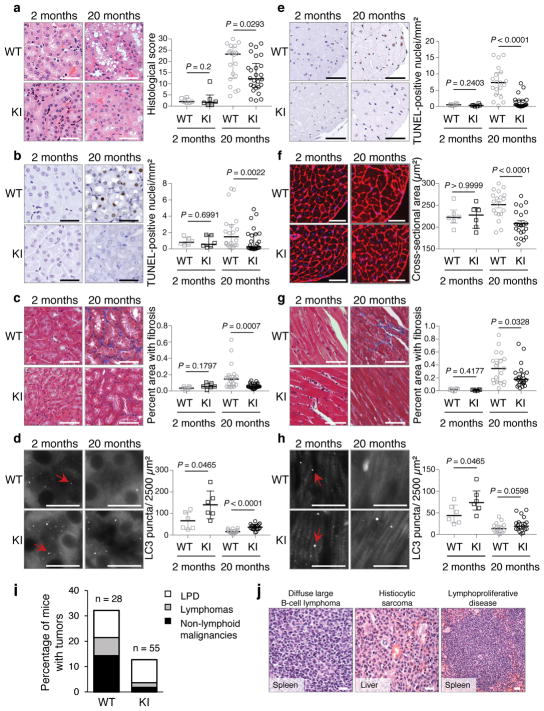
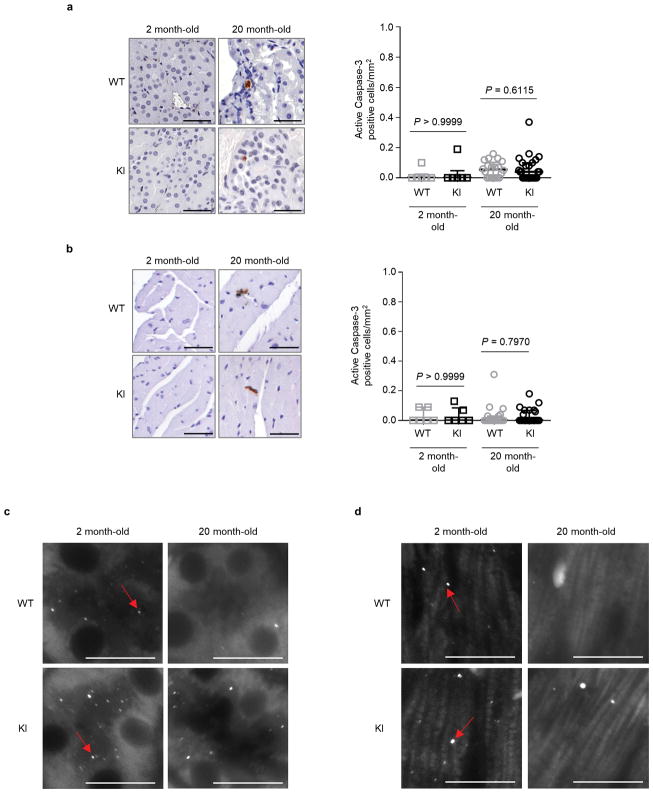
Next, we evaluated age-related phenotypes in two vital organs, kidney and heart, where we showed the beclin 1 F121A mutation disrupted beclin 1/Bcl-2 binding and increased basal autophagy. During aging, the kidney develops pathological changes, including fibrosis and nuclear damage, and proximal convoluted tubule (PCT)-specific deletion of the autophagy gene, Atg5, exacerbates these phenotypes6, 21. In 20 month-old KI mice and WT control littermates, the PCTs had increased vacuolar changes in WT as compared to KI mice (Fig. 3a). In this region, there was increased nuclear DNA damage, as measured by increased TUNEL staining of non-pyknotic/apoptotic-appearing nuclei (Fig. 3b) that did not stain positive for the apoptotic marker, active caspase 3 (Extended Data Fig. 4a). Consistent with this evidence of decreased cellular damage in the PCTs of KI mice, there was also decreased fibrosis (Fig. 3c). Similarly, we observed increased non-pyknotic/apoptotic-appearing, active caspase 3-negative, TUNEL-positive nuclei in the hearts of 20 month-old WT as compared to KI mice (Fig. 3e; Extended Data Fig. 4b). This phenotype was most pronounced in the subendocardial region of the left ventricle (the part of the myocardium subjected to greatest hemodynamic stress) and was accompanied by an increase in cardiomyocyte cross-sectional area in WT mice (Fig. 3f). Moreover, there was a significant increase in fibrosis, a hallmark of cardiac aging, in WT vs. KI mice (Fig. 3g). In young (2 month-old) mice, no genotype-specific differences were observed in any of the renal and cardiac parameters assessed, indicating that the decreased pathology in older KI mice genuinely reflects a reduction in age-related changes (rather than developmental differences) in these organs. Thus, the beclin 1 F121A knock-in mutation decreases age-related renal and cardiac changes, including fibrosis.
Figure 3. Beclin 1 F121A KI mutation improves healthspan in mice.
a–d, Representative images and quantitation of pathological score (a); TUNEL-positive nuclei (b); interstitial fibrosis (c) and endogenous LC3 puncta (autophagosomes) (see enlarged images, Extended Data Fig. 4c) (d) in the cortical region of the kidney. e–h, Representative images and quantitation of TUNEL-positive nuclei (e); cardiomyocyte cross-sectional fiber size (f); cardiac interstitial fibrosis (g); and endogenous LC3 puncta (see enlarged images, Extended Data Fig. 4d) (h) in the heart. Two month-old WT and KI mouse kidneys and hearts (n=6 per genotype) were analyzed. For kidney analyses, 20 month-old WT (n=20 and n=16) and KI (n=26 and n=19) mice were used for histopathological and autophagy analyses, respectively. For heart analyses, 20 month-old WT (n=19 and n=15) and KI (n=22 and n=19) mice were used for histopathological and autophagy analyses, respectively. Scatter plot bars represent median ± interquartile ranges. P-values for indicated comparisons, Mann-Whitney test. Autophagy analyses were one-sided and all other analyses were two-sided. i–j, Percentage of WT and KI mice (aged 20 months) with spontaneous tumors, including lymphoproliferative disease (LPD), lymphomas, and non-lymphoid malignancies (i) and representative images of most frequently observed neoplastic lesions from WT mice (j). See text for statistical analyses of data. Scale bars, 50 μm (a–c, e–g, j) and 10 μm (d, h). For (d) and (h), red arrows denote representative endogenous LC3 puncta.
In this cohort of 20 month-old mice, autophagosome numbers, as measured by endogenous staining of LC3, were markedly decreased in the kidneys and hearts of both WT and KI mice (Fig. 3d, h; Extended Data Fig. 4c, d), consistent with a predicted age-related decline in autophagic capacity2,22. However, the KI mouse kidneys and hearts still had more autophagosomes than their WT counterparts. Taken together, these data demonstrate that the beclin 1 F121A KI mutation delays, but does not prevent, age-related decline in mouse autophagic function in parallel with observed decreases in age-related organ pathology. This finding is predicted, as downstream autophagy gene expression decreases with aging2,22; thus, decreased negative regulation of beclin 1 per se is not sufficient to reverse age-related decline in autophagosome formation.
In mice and humans, aging results in increased susceptibility to a variety of cancers. Specifically, mice with a C57/BL6J genetic background display age-related increases in lymphoproliferative disease (LPD) and lymphomas, histiocytic sarcomas, lung cancers and liver cancers23. In a cohort of 20 month-old KI mice and WT littermates, there was a significant decrease in age-related spontaneous tumorigenesis in the KI mice (Fig. 3i, j), either when comparing all malignancies (chi-square; P = 0.034) or non-lymphoid malignancies alone (chi-square; P = 0.024). Thus, beclin 1 F121A KI mice with increased basal autophagy have a decreased incidence of age-related spontaneous cancer. The similar prevalence of LPD in both genotypes, coupled with increased prevalence of lymphomas in WT mice, is consistent with delayed onset of LPD and/or progression of LPDs to frank lymphoma in KI animals.
The central role of beclin 1/Bcl-2 disruption in promoting increased basal autophagy, lifespan extension and improved healthspan raised the question of whether known anti-aging factors might exert their longevity-promoting activity through disruption of beclin 1/Bcl-2 binding and autophagy. Klotho is a single-pass membrane-bound protein that can be cleaved and released into the circulation; it is highly expressed in the kidney, and it regulates aging24. Klotho expression decreases with aging in mice and humans24. Klotho deficiency in mice, either via hypomorphic expression or gene knockout, results in a syndrome resembling (but not completely recapitulating) aging3,25, including premature lethality (death within a few months of birth), infertility and multisystem defects. Klotho overexpression or administration of soluble Klotho protein extends lifespan and rescues most phenotypes in Klotho hypomorphic mice26,27. Moreover, soluble Klotho promotes autophagic flux in the kidney and, in the setting of renal ischemic injury, mitigates renal fibrosis and retards progression to end-stage renal disease28.
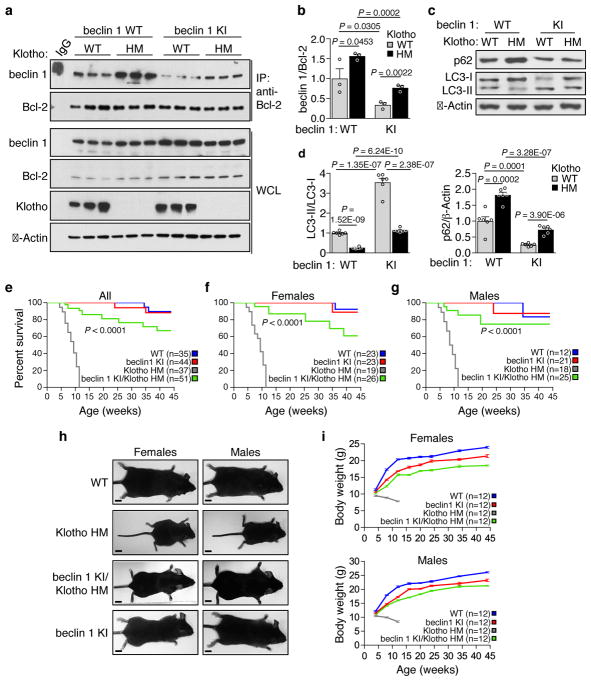
Therefore, we crossed the Becn1F121A/F121A (KI) mice with a well-characterized premature aging model in which animals harbor a hypomorphic mutation in Klotho3 (kl/kl; termed here klothoHM/HM). Klotho deficiency resulted in a marked increase in beclin 1 co-immunoprecipitation with Bcl-2 in kidney (Fig. 4a, b), in support of the concept that disruption of the beclin 1/Bcl-2 binding may play a mechanistic role in Klotho-induced autophagy. Consistent with this, recombinant soluble Klotho decreased beclin 1/Bcl-2 binding in cultured HeLa cells (Extended Data Fig. 5). The beclin 1 F121A mutation decreased beclin 1/Bcl-2 binding in klothoHM/HM (HM) kidney to levels similar to those observed in WT mice without discernible effects on Klotho protein expression (Fig. 4a, b). In parallel, the beclin 1 F121A mutation restored levels of autophagy in Klotho HM mice to those observed in WT mice, as measured by LC3-II conversion and p62 degradation (Fig. 4c, d). Strikingly, this reversal of the enhanced beclin 1/Bcl-2 binding and decreased autophagy in beclin 1 KI/Klotho HM mice nearly completely rescued the premature lethality phenotype of both female and male mice (Fig. 4e–g); 100% of the Klotho HM mice were dead by ~12 weeks, whereas the majority of beclin 1 KI/Klotho HM survived a 45-week observation period. Furthermore, both female and male infertility was rescued in beclin 1/Klotho HM mice. Finally, the severe growth retardation of Klotho HM mice was almost completely reversed by the beclin 1 F121A mutation (Fig. 4h, i). Taken together, these data indicate that a gain-of-function mutation in beclin 1, which disrupts beclin 1/Bcl-2 and increases autophagy, reverses the premature aging phenotypes resulting from Klotho deficiency.
Figure 4. Expression of beclin 1 F121A prevents lethality of Klotho-deficient mice.
a, Co-immunoprecipitation of beclin 1 and Bcl-2 in kidneys from mice of indicated genotype (n = 3 animals per genotype). b, Quantitation of beclin 1 co-immunoprecipitated with Bcl-2 in (a). c, Western blot analysis of autophagy markers in kidney from mice of indicated genotype. d, Quantitation of western blot analysis of p62 levels and LC3-II/I ratios (combined results are for six mice per genotype; each independent experiment had 1 mouse per genotype). Bars represent mean ± s.e.m. e–g, Kaplan-Meier survival curves for mice of indicated genotype, showing the lifespan of all mice in cohort (e), females alone (f) or males alone (g). N = number of mice per group. h, Representative images of 10 week-old mice of indicated genotype for body size comparison. Scale bars, 1 cm. i, Serial body weights in female and male mice of indicated genotype. Data points and error bars represent mean ± s.e.m for 12 mice per genotype. P-values in (b) and (d), one-sided unpaired t-test. P-values in (e–g), log-rank (Mantel-Cox) test. WCL, whole cell lysate. WT, wild-type mice; beclin 1 KI, Becn1F121A/F121A mice; Klotho HM, klothoHM/HM mice and beclin 1 KI/Klotho HM, Becn1F121A/F121A; klothoHM/HM mice. For uncropped gels, see Supplementary Fig. 1.
Our findings demonstrate that a knock-in gain-of-function point mutation in a key autophagy regulatory gene, beclin 1, in mice results in increased basal levels of autophagy, extends lifespan in both males and females, and improves healthspan, including a decrease in age-related renal and cardiac changes and age-related spontaneous malignancies. Importantly, the decreased beclin 1/Bcl-2 binding in vivo is not only associated with longevity and improved aging-related phenotypes, but it also has a dramatic effect on rescuing the early lethality and infertility of mice deficient in a well-established anti-aging protein, Klotho. Taken together, our results suggest that activation of the beclin 1/Class III PI3K autophagy-initiating complex may be an effective and safe way to bypass upstream aging signals to promote mammalian healthspan and lifespan. Specifically, we propose that disruption of beclin 1/Bcl-2 binding may be one such strategy, as our findings provide genetic proof that chronic in vivo disruption of this complex exerts substantial beneficial effects on mammalian lifespan and healthspan. More speculatively, it is possible that disruption of the beclin 1/Bcl-2 complex, and ensuant autophagy induction, underlies the anti-aging mechanism of Klotho and perhaps other longevity signaling pathways.
Online Content Methods, along with additional Extended Data display items, are available in the online version of the paper: references unique to these sections appear only in the online paper.
METHODS
Cell culture
HeLa cells were obtained from ATCC (American Type Culture Collection), tested negative for mycoplasma by PCR and authenticated by ATCC Cell Line Authentication Service. Primary murine embryonic fibroblasts (MEFs) were isolated from mouse embryos at day E13.5 and cultured as described29
Mice
Becn1F121A/F121A were generated as described15 and backcrossed for more than 12 generations to C57BL/6J mice (Jackson Laboratories). Becn1WT/WT (WT) and Becn1F121A/F121A (KI) littermate mice were crossed with GFP-LC3 transgenic animals18 in a pure C57BL/6J background and tissues of offspring were used for autophagic flux analyses. Klotho hypomorphic mice (best known as kl/kl; referred to as KlothoHM/HM [Klotho HM] in this manuscript to avoid confusion with Becn1F121A/F121A [KI]) have been previously described3 and were crossed with Becn1WT/WT (WT) and Becn1F121A/F121A (KI) to obtain double mutants. Mice were genotyped for the Klotho and Becn1 allele as described3,15. All mice were housed on a 12-h light/dark cycle and both males and females were used for all analyses. For sample size and randomization information, please see Life Sciences Reporting Summary. For survival analysis, mice were monitored weekly for the duration of the observation period. For western blot autophagy analyses, animals were starved overnight and re-fed for 3 h before sample collection to minimize variability due to differences in food intake. All animal procedures were performed in accordance with institutional guidelines and with approval from the UT Southwestern Medical Center Institutional Animal Care and Use Committee.
Immunoprecipitations
For beclin 1/Bcl-2 co-immunoprecipitation, frozen tissues were weighed and homogenized in ice-cold lysis buffer (25 mM HEPES, 150 mM NaCl, 1 mM EDTA, 1% TritonX-100; 1 ml/100 mg tissue) containing cOmplete, mini protease (Roche) and Halt phosphatase (Thermo Scientific) inhibitor cocktails for 30 min at 4°C. Lysates were centrifuged (16,000×g at 4°C for 30 min) and the supernatants were pre-cleared with 60 μl protein-G agarose beads for 2 h and incubated overnight with Bcl-2-agarose (or IgG) antibody. Immunoprecipitates were washed 5 times, resuspended in 2x SDS-PAGE loading buffer, boiled for 5 min and analyzed by western blot using anti-beclin 1 (sc-7382, Santa Cruz; 1:500 dilution), anti-Bcl-2 (sc-7382, Santa Cruz; 1:100 dilution), anti-Klotho (KO603, Trans Genic Inc. Japan; 1:1000 dilution) and anti-actin (sc-47778, Santa Cruz, 1:5000 dilution) antibodies.
For in vitro analyses of the effects of Klotho beclin 1/Bcl-2 binding, soluble full-length mouse Klotho protein was purified as previously described27, and HeLa (ATCC) cells were cells were treated either with phosphate-buffered solution (PBS) or Klotho protein (0.4 nM or 2.0 nM) for 24 h prior to co-immunoprecipitation using the same protocol described above for mouse tissues.
Autophagy analyses
For assessment of in vivo autophagy levels in different tissues, two and six month-old homozygous Becn1F121A/F121A;GFP-LC3 or Becn1WT/WT;GFP-LC3 mice (three mice per group) were treated with either PBS or chloroquine (50 mg kg−1) for 6 h. Mice were then perfused with 4% PFA in PBS and tissues were collected and processed for frozen sectioning as described18. The total number of GFP-LC3 puncta was counted per 2500 μm2 area (>15 randomly chosen fields were used per mouse) and the average value for each tissue for each mouse was determined by an observer blinded to genotype. The mouse muscle, heart, and liver tissue sections were imaged using a 63x objective and for renal glomeruli and proximal convoluted tubules, tissue sections were imaged using a 40x objective on a Zeiss AxioPlan 2 microscope.
For western blot analysis, frozen tissues were lysed in ice-cold lysis buffer (Tris-HCl pH 7.5 50 mM, NaCl 150 mM, 1 mM EDTA, 1% Triton X-100) with cOmplete, mini protease (Roche) and Halt phosphatase (Thermo Scientific) inhibitor cocktails for 30 min at 4°C. Lysates were centrifuged at 16,000×g for 30 min. Cleared lysates were diluted in 2× SDS-PAGE loading buffer and analyzed using anti-p62 (GP62-C, Progen, 1:1000 dilution), anti-LC3B (L7543, Sigma, 1:10000 dilution) and anti-actin (sc-47778, Santa Cruz, 1:5000 dilution) antibodies. Endogenous LC3 immunofluorescence staining of paraffin-embedded tissues was performed as previously described30.
Electron microscopic analyses of MEFs derived from Becn1WT/WT (WT) and Becn1F121A/F121A (KI) littermate mice was performed and analyzed as described16.
Measurement of endocytosis
Analysis of transferrin uptake by Becn1WT/WT (WT) and Becn1F121A/F121A (KI) MEFs as an indicator of endocytosis activity was performed as previously described31, 32.
Histopathological analyses
Becn1F121A/F121A (KI) and Becn1WT/WT (WT) control littermates aged 2 month-old and 20 month-old were perfused with 4% PFA in PBS prior to tissue collection, fixation, and preparation of paraffin-embedded sections for histopathological analyses. Standard hematoxylin & eosin (H&E) staining was performed for analyses of age-related neoplasia and renal histopathological score. H&E-stained tissues sections of multiple organs were evaluated per mouse in a genotype-blinded manner by a pathologist with expertise in the diagnosis of human and murine neoplasms and all cases of lymphoproliferative disease and non-lymphoid malignancies were recorded. TUNEL staining was performed according to manufacturer’s instructions (ApopTag® Peroxidase In Situ Apoptosis Detection Kit, Millipore) and active caspase 3 staining was performed using anti-active caspase 3 (ab3202, Abcam, 1:20 dilution) antibody overnight at 4 °C and an ABC kit according to manufacturer’s instructions. The total numbers of TUNEL-positive nuclei and active caspase 3-positive cells were counted in sections of the entire renal cortex of each mouse to calculate the number of TUNEL-positive nuclei and active caspase 3-positive cells per unit area, and the total numbers of TUNEL-positive nuclei and active caspase 3-positive cells were counted in each longitudinal section of the heart to calculate the number of TUNEL-positive nuclei and active caspase 3-positive cells per unit area. To determine the renal pathological score, ten random fields of the renal cortex sections were evaluated per mouse. Each field was given a pathological score using the following scale: 0, absence of damage; 1, <15% tissue area with damage; 2, 15–50% tissue area with damage; 3, >50% tissue area with damage. The scores of each field were summed to give a final histolopathological score for each mouse, ranging from 0 to 30. Wheat germ agglutinin (WGA) staining was performed by pre-incubating slides in citrate buffer at 50°C for 13 min, blocking with 1% BSA/5% goat serum in PBS for 1 h, and staining with Alexa Fluor 594-WGA (W11262, ThermoFisher Scientific, 1:100 dilution) for 1 h at room temperature. The average cross-sectional size of cardiomyocytes was determined by ImageJ; 100 cells were analyzed per mouse (using 20 cells per field and acquiring 5 fields per heart). Masson’s trichrome staining was performed according to the manufacturer’s instructions (ab150686, abcam) and used for analyses of renal cortex and cardiac fibrosis. The percentage area of tissue with fibrosis was measured. The fibrotic areas and total field size were manually outlined and quantified using ImageJ for 10 randomly chosen fields for the renal cortex per mouse and 5 randomly chosen fields for the heart per mouse. Quantitation of all histopathological analyses was performed by an observer blinded to experimental age and genotype.
Statistical analyses
Data were analyzed using the GraphPad Prism 7 and OASIS 2 software. Log-rank (Mantel-Cox) tests were used to analyze Kaplan-Meier curves, and a Booshloo’s test for maximum lifespan analysis (at 90% survival) was performed as described33. Chi-square test was used to compare the percentage of mice with spontaneous malignancies. One-tailed unpaired Student’s t-tests were used for analyses of beclin 1/Bcl-2 binding and autophagy in Becn1WT/WT mice versus Becn1F121A/F121A mice. For data with a non-normal distribution, the ROUT (Robust regression and Outlier removal) method34 was used to eliminate outliers with Q coefficient set at 1% and data were analyzed by two-tailed Mann-Whitney tests.
Data availability
Full scans for all western blots are provided in Supplementary Fig. 1. Source data for all graphs in this manuscript have been provided. All other data are available from the corresponding authors on reasonable request.
Extended Data
Extended Data Figure 1. Increased basal autophagy in tissues of beclin 1 F121A knock-in mice.
a, Representative images and quantitation of GFP-LC3 puncta (autophagosomes) in glomeruli from Becn1WT/WT:GFP-LC3 (WT) and Becn1F121A/F121A:GFP-LC3 (KI) mice +/− chloroquine (CQ) (50 mg kg−1, 6 h). Scale bars, 10 μm. Bars represent mean ± s.e.m for three mice per genotype. b, Enlarged versions of the images shown in Fig. 1c of main text. P-values, one-sided unpaired t-test. Arrows denote representative GFP-LC3 puncta.
Extended Data Figure 2. Sustained increase in basal autophagy during adulthood in beclin 1 F121A knock-in mice.
a, Co-immunoprecipitation of beclin 1 and Bcl-2 in representative samples of hearts and kidneys from 8 month-old Becn1WT/WT (WT) and Becn1F121A/F121A (KI) animals. b, Quantitation of beclin 1 co-immunoprecipitated with Bcl-2 in indicate tissues of 8 month-old WT and KI mice (n = 3 mice per genotype). c, Quantitation of GFP-LC3 puncta in hearts and tissues from 6 month-old in Becn1WT/WT:GFP-LC3 (WT) and Becn1F121A/F121A:GFP-LC3 (KI) mice +/− CQ (50 mg kg−1, 6 h). d, Western blot analysis of autophagy markers in hearts and kidneys from 8 month-old WT and KI mice. Each lane represents a different mouse. e, Quantitation of p62 and total LC3 levels (normalized to β-Actin), as well as LC3-II/I ratios from samples in (d). Bars represent mean ± s.e.m for three mice per genotype. P-values, one-sided unpaired t-test. WCL, whole cell lysate. For uncropped gels, see Supplementary Fig. 1.
Extended Data Figure 3. Increased autophagy, but not endocytosis, in beclin 1 F121A murine embryonic fibroblasts (MEFs).
a, Co-immunoprecipitation of beclin 1 and Bcl-2 in MEFs derived from Becn1WT/WT (WT) and Becn1F121A/F121A (KI) animals. b, Representative images (top) and quantitation (bottom) of GFP-LC3 puncta in WT and KI cells +/− bafilomycin A1 (BafA1) (10 nM, 3 h). Scale bars, 10 μm c, Western blot analysis of autophagy markers in WT and KI MEFs +/− Baf A1 (100 nM, 2 h). d, Representative images and quantitative electron microscopic analysis of autophagic structures in WT and KI MEFs +/− Baf A1 (100 nM, 3 h). Insets show representative autophagosome (arrowhead) and autolysosome (arrow). Scale bars, 1 μm. e, Representative images and quantitation of transferrin uptake kinetics in WT and KI cells. Scale bars, 20 μm. Results shown are representative of 2 and 4 independent experiments respectively for (a) and (c). Bars represent mean ± s.e.m for 3 replicates in (b) and for 50 cells per genotype and condition in (d). Data points on line graph in (e) represent mean ± s.e.m for cells at 7 min (n=63, WT; n=54, KI), 15 min (n=58, WT; n=52 KI), and 30 min (n=76, WT; n=83, KI). P-values for indicated comparisons, unpaired t-test one-sided for (b) and two-sided for (d) and (e). WCL, whole cell lysate. For uncropped gels, see Supplementary Fig. 1.
Extended Data Figure 4. Apoptosis and autophagy analyses in kidneys and hearts of aged mice.
Representative images and quantitation of active caspase 3-positive cells in kidneys (a) and hearts (b) from Becn1WT/WT (WT) and Becn1F121A/F121A (KI) animals. Two month-old WT and KI mouse kidneys and hearts (n=6 per genotype) were analysed. For kidney analyses, aged (20 month-old) WT (n=20) and KI (n=26) mice were used. For heart analyses, aged (20 month-old) WT (n=19) and KI (n=26) mice were used. Scatter plot bars represent median ± interquartile ranges. P-values, two-sided Mann-Whitney test. c–d, Enlarged versions of the endogenous LC3 puncta (autophagosome) images shown in Fig. 3d (c) and 3h (d) of main text. Arrows denote represent LC3 puncta.
Extended Data Figure 5. In vitro Klotho treatment disrupts beclin 1/Bcl-2 interaction.
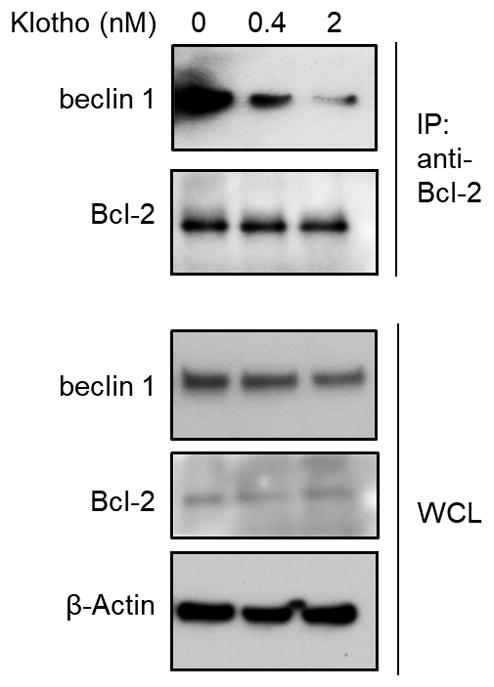
Co-immunoprecipitation of beclin 1 and Bcl-2 in HeLa cells treated with PBS or indicated concentrations of recombinant full-length mouse Klotho for 24 h. Result shown is representative of 2 independent experiments. For uncropped gels, see Supplementary Fig. 1.
Extended Data Table 1.
Increased median lifespan and maximal lifespan in beclin 1 F121A knock-in mice.
| Sex | Becn1 genotype | Median lifespan | Maximum lifespan | |
|---|---|---|---|---|
| Months (95% C.I.) | Months | Boschloo’s test | ||
| All | WT | 26 (25.0 ~ 26.0) | 36 | P = 0.0341 |
| KI | 29 (28.0 ~ 29.0) | 39 | ||
| Females | WT | 27 (26.0 ~ 28.0) | 34 | P = 0.0605 |
| KI | 30 (28.0 ~ 30.0) | 39 | ||
| Males | WT | 25 (24.0 ~ 25.0) | 36 | P = 0.0881 |
| KI | 28 (26.0 ~ 29.0) | 39 | ||
Supplementary Material
Acknowledgments
The authors thank S. Sciarretta for helpful discussions; L. Nguyen for technical assistance and H. Smith for assistance with manuscript preparation. This work was supported by NIH grants RO1-CA109618 (B.L.), U19-AI199725 (B.L.), RO1-DK091392 and RO1-DK092461 (M.C.H and O.W.M.), P30-DK07938 (O.W.M.), K99R00-DK094980 (C.H.), Cancer Prevention Research Institute of Texas grant RP120718 (B.L.) and a Fondation Leducq grant 15CBD04 (B.L., A.F.F., S.S.).
Footnotes
Author Contributions
Á.F.F., S.S., Y.W., C.H., T.T, Y.L., M.C.H. and B.L. designed the study. Á.F.F., S.S., Y.W., Z.Z., M.S., K.L.M, and W-C.C. performed biochemical analyses. Á.F.F., S.S., and Z.Z. performed autophagy microscopic analyses. Á.F.F. and S.S. performed renal and cardiac histopathological analyses. G.B. characterized malignancies. Á.F.F., S.S., D.K.M., G.G.S, G.B. O.W.M., M.C.H. and B.L. discussed and analyzed data. Á.F.F., S.S. M.C.H. and B.L. wrote the manuscript.
Competing interests
The authors declare no competing interests.
References
- 1.Madeo F, Zimmermann A, Maiuri MC, Kroemer G. Essential role for autophagy in life span extension. J Clin Invest. 2015;125:85–93. doi: 10.1172/JCI73946. [DOI] [PMC free article] [PubMed] [Google Scholar]
- 2.Rubinsztein DC, Marino G, Kroemer G. Autophagy and aging. Cell. 2011;146:682–695. doi: 10.1016/j.cell.2011.07.030. [DOI] [PubMed] [Google Scholar]
- 3.Kuro-o M, et al. Mutation of the mouse klotho gene leads to a syndrome resembling ageing. Nature. 1997;390:45–51. doi: 10.1038/36285. [DOI] [PubMed] [Google Scholar]
- 4.Levine B, Kroemer G. Autophagy in the pathogenesis of disease. Cell. 2008;132:27–42. doi: 10.1016/j.cell.2007.12.018. [DOI] [PMC free article] [PubMed] [Google Scholar]
- 5.Melendez A, et al. Autophagy genes are essential for dauer development and life-span extension in C. elegans. Science. 2003;301:1387–1391. doi: 10.1126/science.1087782. [DOI] [PubMed] [Google Scholar]
- 6.Yamamoto T, et al. Time-dependent dysregulation of autophagy: Implications in aging and mitochondrial homeostasis in the kidney proximal tubule. Autophagy. 2016;12:801–813. doi: 10.1080/15548627.2016.1159376. [DOI] [PMC free article] [PubMed] [Google Scholar]
- 7.Eisenberg T, et al. Cardioprotection and lifespan extension by the natural polyamine spermidine. Nat Med. 2016;22:1428–1438. doi: 10.1038/nm.4222. [DOI] [PMC free article] [PubMed] [Google Scholar]
- 8.Eisenberg T, et al. Induction of autophagy by spermidine promotes longevity. Nat Cell Biol. 2009;11:1305–1314. doi: 10.1038/ncb1975. [DOI] [PubMed] [Google Scholar]
- 9.Mercken EM, et al. SIRT1 but not its increased expression is essential for lifespan extension in caloric-restricted mice. Aging Cell. 2014;13:193–196. doi: 10.1111/acel.12151. [DOI] [PMC free article] [PubMed] [Google Scholar]
- 10.Pyo JO, et al. Overexpression of Atg5 in mice activates autophagy and extends lifespan. Nat Commun. 2013;4:2300. doi: 10.1038/ncomms3300. [DOI] [PMC free article] [PubMed] [Google Scholar]
- 11.Kimmey JM, et al. Unique role for ATG5 in neutrophil-mediated immunopathology during M. tuberculosis infection. Nature. 2015;528:565–569. doi: 10.1038/nature16451. [DOI] [PMC free article] [PubMed] [Google Scholar]
- 12.Liang XH, et al. Induction of autophagy and inhibition of tumorigenesis by beclin 1. Nature. 1999;402:672–676. doi: 10.1038/45257. [DOI] [PubMed] [Google Scholar]
- 13.Kihara A, Kabeya Y, Ohsumi Y, Yoshimori T. Beclin-phosphatidylinositol 3-kinase complex functions at the trans-Golgi network. EMBO Rep. 2001;2:330–335. doi: 10.1093/embo-reports/kve061. [DOI] [PMC free article] [PubMed] [Google Scholar]
- 14.Levine B, Liu R, Dong X, Zhong Q. Beclin orthologs: integrative hubs of cell signaling, membrane trafficking, and physiology. Trends Cell Biol. 2015 doi: 10.1016/j.tcb.2015.05.004. [DOI] [PMC free article] [PubMed] [Google Scholar]
- 15.Rocchi A, et al. A Becn1 mutation mediates hyperactive autophagic sequestration of amyloid oligomers and improved cognition in Alzheimer’s disease. PLoS Genet. 2017;13:e1006962. doi: 10.1371/journal.pgen.1006962. [DOI] [PMC free article] [PubMed] [Google Scholar]
- 16.Pattingre S, et al. Bcl-2 antiapoptotic proteins inhibit Beclin 1-dependent autophagy. Cell. 2005;122:927–939. doi: 10.1016/j.cell.2005.07.002. [DOI] [PubMed] [Google Scholar]
- 17.Sinha S, Colbert CL, Becker N, Wei Y, Levine B. Molecular basis of the regulation of Beclin 1-dependent autophagy by the gamma-herpesvirus 68 Bcl-2 homolog M11. Autophagy. 2008;4:989–997. doi: 10.4161/auto.6803. [DOI] [PMC free article] [PubMed] [Google Scholar]
- 18.Mizushima N, Yamamoto A, Matsui M, Yoshimori T, Ohsumi Y. In vivo analysis of autophagy in response to nutrient starvation using transgenic mice expressing a fluorescent autophagosome marker. Mol Biol Cell. 2004;15:1101–1111. doi: 10.1091/mbc.E03-09-0704. [DOI] [PMC free article] [PubMed] [Google Scholar]
- 19.Mizushima N, Yoshimori T, Levine B. Methods in mammalian autophagy research. Cell. 2010;140:313–326. doi: 10.1016/j.cell.2010.01.028. [DOI] [PMC free article] [PubMed] [Google Scholar]
- 20.McKnight NC, et al. Beclin 1 is required for neuron viability and regulates endosome pathways via the UVRAG-VPS34 complex. PLoS Genet. 2014;10:e1004626. doi: 10.1371/journal.pgen.1004626. [DOI] [PMC free article] [PubMed] [Google Scholar]
- 21.Lim JH, et al. Age-associated molecular changes in the kidney in aged mice. Oxid Med Cell Longev. 2012;2012:171383. doi: 10.1155/2012/171383. [DOI] [PMC free article] [PubMed] [Google Scholar]
- 22.Lapierre LR, Kumsta C, Sandri M, Ballabio A, Hansen M. Transcriptional and epigenetic regulation of autophagy in aging. Autophagy. 2015;11:867–880. doi: 10.1080/15548627.2015.1034410. [DOI] [PMC free article] [PubMed] [Google Scholar]
- 23.Brayton C. The Mouse in Biomedical Research. Vol. 2. Elsevier Inc; 2007. Spontaneous diseases in commonly used mouse strains; pp. 623–717. [Google Scholar]
- 24.Kuro-o M. Klotho and aging. Biochim Biophys Acta. 2009;1790:1049–1058. doi: 10.1016/j.bbagen.2009.02.005. [DOI] [PMC free article] [PubMed] [Google Scholar]
- 25.Tsujikawa H, Kurotaki Y, Fujimori T, Fukuda K, Nabeshima Y. Klotho, a gene related to a syndrome resembling human premature aging, functions in a negative regulatory circuit of vitamin D endocrine system. Mol Endocrinol. 2003;17:2393–2403. doi: 10.1210/me.2003-0048. [DOI] [PubMed] [Google Scholar]
- 26.Kurosu H, et al. Suppression of aging in mice by the hormone Klotho. Science. 2005;309:1829–1833. doi: 10.1126/science.1112766. [DOI] [PMC free article] [PubMed] [Google Scholar]
- 27.Chen TH, et al. The secreted Klotho protein restores phosphate retention and suppresses accelerated aging in Klotho mutant mice. Eur J Pharmacol. 2013;698:67–73. doi: 10.1016/j.ejphar.2012.09.032. [DOI] [PubMed] [Google Scholar]
- 28.Shi M, et al. alphaKlotho Mitigates Progression of AKI to CKD through Activation of Autophagy. J Am Soc Nephrol. 2016;27:2331–2345. doi: 10.1681/ASN.2015060613. [DOI] [PMC free article] [PubMed] [Google Scholar]
- 29.Su T, et al. Deletion of histidine triad nucleotide-binding protein 1/PKC-interacting protein in mice enhances cell growth and carcinogenesis. Proc Natl Acad Sci U S A. 2003;100:7824–7829. doi: 10.1073/pnas.1332160100. [DOI] [PMC free article] [PubMed] [Google Scholar]
- 30.Sebti S, et al. BAT3 modulates p300-dependent acetylation of p53 and autophagy-related protein 7 (ATG7) during autophagy. Proc Natl Acad Sci U S A. 2014;111:4115–4120. doi: 10.1073/pnas.1313618111. [DOI] [PMC free article] [PubMed] [Google Scholar]
- 31.Fielding AB, Willox AK, Okeke E, Royle SJ. Clathrin-mediated endocytosis is inhibited during mitosis. Proc Natl Acad Sci U S A. 2012;109:6572–6577. doi: 10.1073/pnas.1117401109. [DOI] [PMC free article] [PubMed] [Google Scholar]
- 32.Tacheva-Grigorova SK, Santos AJ, Boucrot E, Kirchhausen T. Clathrin-mediated endocytosis persists during unperturbed mitosis. Cell Rep. 2013;4:659–668. doi: 10.1016/j.celrep.2013.07.017. [DOI] [PMC free article] [PubMed] [Google Scholar]
- 33.Wang C, Li Q, Redden DT, Weindruch R, Allison DB. Statistical methods for testing effects on “maximum lifespan”. Mech Ageing Dev. 2004;125:629–632. doi: 10.1016/j.mad.2004.07.003. [DOI] [PubMed] [Google Scholar]
- 34.Motulsky HJ, Brown RE. Detecting outliers when fitting data with nonlinear regression - a new method based on robust nonlinear regression and the false discovery rate. BMC Bioinformatics. 2006;7:123. doi: 10.1186/1471-2105-7-123. [DOI] [PMC free article] [PubMed] [Google Scholar]
Associated Data
This section collects any data citations, data availability statements, or supplementary materials included in this article.
Supplementary Materials
Data Availability Statement
Full scans for all western blots are provided in Supplementary Fig. 1. Source data for all graphs in this manuscript have been provided. All other data are available from the corresponding authors on reasonable request.


