Abstract
Metastasis is the ultimate cause of death among the vast majority of cancer patients. This process is comprised of multiple steps, including the migration of circulating cancer cells across microvasculature. This trans-endothelial migration involves the adhesion and eventual penetration of cancer cells to the vasculature of the target organ. Many of these mechanisms remain poorly understood due to poor control of pathophysiological conditions in tumor models. In this work, a microfluidic device was developed to support the culture and observation of engineered microvasculature with systematic control of the environmental characteristics. This device was then used to study the adhesion of circulating cancer cells to an endothelium under varying conditions to delineate the effects of hemodynamics and inflammations. The resulting understanding will help to establish a quantitative and biophysical mechanism of interactions between cancer cells and endothelium.
INTRODUCTION
Metastasis is the ultimate cause of death among the vast majority of cancer patients. One of the major modes of cancer metastasis is through the circulatory system, also known as haematogenous metastasis. Haematogenous metastasis is a highly inefficient process, with less than 0.01% of circulating tumor cells forming metastases.1 This low rate is largely due to the rapid destruction of cancer cells in the circulation by immune cells2 or hemodynamic forces on immobilized cells.3 This suggests that the adhesion and subsequent trans-endothelial migration (TEM) of circulating cancer cells is one of the critical steps in the metastatic cascade. This extravasation process in haematogenous metastatic cascade has been actively studied but is still not fully understood.
Previous studies have attempted to clarify the underlying mechanisms of circulating cell adhesion and TEM. In particular, the roles of diverse ligands and receptors on cancer and endothelial cells have been explored including selectins, integrins, cadherins, and the CD44 antigen, as reviewed previously.4 Various tumor vasculature models have been used in these studies. Animal models offer the closest physiological conditions to those seen in human patients in vivo. Consequently, several imaging techniques have been developed to observe cancer cell dissemination in these models.5–7 However, animal models are expensive and provide limited control of the microvascular environment, including adhesion molecule expression and vascular shear stress. These conditions are more easily regulated in vitro, where precise maintenance of the participating cells is possible. Often, in vitro experiments exploring the adhesion and TEM of different cell types are performed under static conditions.8 This is not a proper vascular adhesion model as it is well known that blood flow alters endothelial cell phenotypes9 and plays a key role in cell adhesion.10–12 Biofunctionalized microchannels have been used to study the adhesion of circulating tumor cells.11–13 The advantage of this technique is that it allows for precise concentrations and homogeneous distribution of adhesion molecules, as well as direct control of the flow conditions. This makes studying the contributions of individual adhesion molecules quite convenient. These functionalized microchannels, however, do not accurately mimic the heterotypic molecule expression and spatial distribution of concentrations seen in endothelium in vivo. In addition, they do not allow for the observation of TEM of cells after adhesion has occurred due to the lack of endotheluim.
Recently, various microfluidic cell culture models mimicking the 3D tumor microenvironment and associated vasculature have been developed.14–18 Many of these models provide more realistic environment to study cancer cell biology and trans-endothelial transport of drugs and nanoparticles. Bersini et al.14 reported a microfluidic model to mimic bone metastasis including adhesion and TEM of cancer cells to elucidate molecular mechanisms. However, due to the complexity of culturing and maintaining multiple cell types in 3D microfluidic environment, it is still challenging even in these innovative microfluidic models to obtain and analyze quantitative information regarding adhesion kinetics during TEM.
In this work, a microfluidic device was developed to support the culture and observation of engineered microvasculature with systematic control of the environmental characteristics. This device was then used to study the adhesion of flowing breast cancer cells (MCF-7), which are intended to model circulating cancer cells, to an endothelium under varying conditions to delineate the effects of hemodynamics and inflammation. In addition, the effect of increasing fluid flow rates on tumor cell adhesion was investigated. Endothelial monolayers were either left unstimulated or treated with the pro-inflammatory cytokine TNF-α prior to experiments to gauge the effect of inflammatory conditions on the likelihood of cancer cell adhesion. After flow experiments, adhered cells were observed for an extended period in an attempt to discern any penetration across the endothelial monolayer. Data from the experiments were then used to develop a kinetic model that considers the aggregate contributions of all participating adhesion molecules. Previous studies have used similar microfluidic platforms to mimic and observe metastatic behavior,8,14 but lack the integrated quantitative analysis presented in this work. This model was used to investigate the mechanisms of flowing cancer cell adhesion and determine theoretic rate constants based on the localized microvascular environment. The resulting understanding will help to establish a quantitative and biophysical mechanism of interactions between cancer cells and endothelium.
MATERIALS AND METHODS
Cells and reagents
Human dermal microvascular cells (hMVEC, Lonza) were grown in Endothelial Basal Medium-2 (Lonza) supplemented with 0.1% human Epidermal Growth Factor, 0.1% Vascular Growth Factor R3-Insuin-like Growth Factor-1, 0.1% Ascorbic Acid, 0.04% Hydrocortisone, 0.04% human Fibroblast Growth Factor-Beta, 5% Fetal Bovine Serum (FBS), and 0.1% Gentamicin Amphotericin-B. hMVEC were cultured at 37 °C in 5% CO2 in 75 cm2 T-flasks containing 14 ml of supplemented culture medium. These cells were harvested when confluence reached 80%–85% utilizing 0.025% trypsin and EDTA (Lonza). After trypsinization, the enzymatic activity of the trypsin was neutralized using Trypsin Neutralizing Solution (Lonza). Cells of passage 7 to 11 were used in adhesion experiments.
A human breast cancer cell line (MCF-7) was grown in Advanced DMEM/F12 basal medium (Invitrogen) supplemented with 5% FBS, L-glutamine, and Pen/Strep. MCF-7 cells were harvested when confluence reached 80%–90%. To reduce the likelihood of enzymatic cleavage of potential membrane binding proteins during harvesting, a non-enzymatic chelator, Versene (Invitrogen), was used to gently detach cells from the culture flask prior to experiments.
Endothelium-on-chip
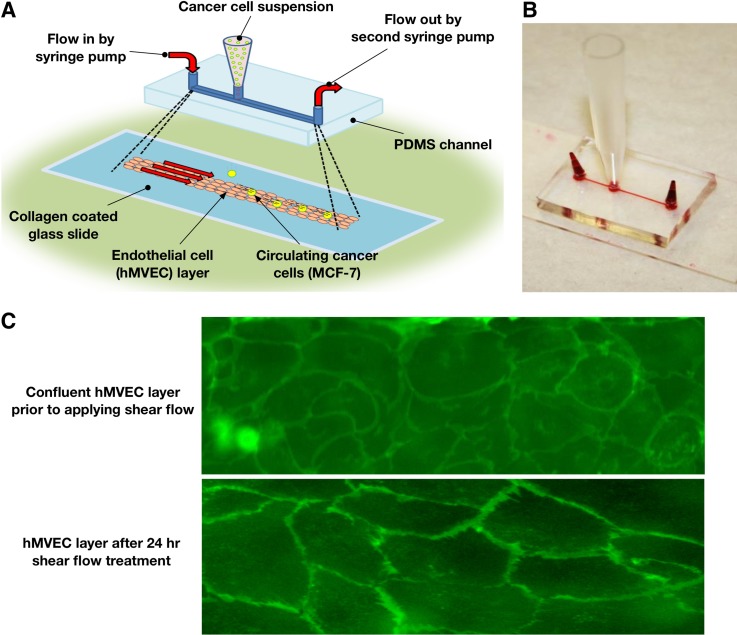
A microfluidic device, illustrated in Fig. 1, was fabricated using the standard photolithographic technique. Molds for the devices were created via soft lithography utilizing SU-8 negative photoresist. Channels measuring 75 μm in height, 300 μm in width, and about 2 cm in length were cast in polydimethylsiloxane (PDMS) to form stamps from the molds. Three ports were then drilled using a 2 mm biopsy punch, one at each end of the channel and one about 2.5 mm off-center. The PDMS stamps were then attached to glass slides using a corona discharge treatment to form enclosed microchannels. Microfluidic channels were treated with 1 mg/ml type I rat tail collagen (BD Sciences) dissolved in 0.02 M acetic acid. The microchannels were perfused with the collagen solution and then incubated at 37 °C for 30 min to allow for the polymerization of collagen on the channel surfaces. The devices were then rinsed with Dulbecco's Phosphate-Buffered Saline solution (DPBS, Invitrogen) to remove the acetic acid and any unpolymerized collagen.
FIG. 1.
Schematic of the experimental setup. (a) Schematics of the endothelium-on-chip and flow configuration during experiment. (b) Photograph of the fabricated microfluidic device. (c) Confirmation of endothelium formation by membrane staining.
Harvested hMVECs were centrifuged and resuspended in medium to a concentration of 1 × 10⁷ cells/ml. The cell suspension was added to a reservoir placed at the off-center port and then slowly drawn through the channels to the far port utilizing a syringe pump (New Era, NE-4000×). Once cells occupied the area of interest of the channel (from the reservoir to the far port), the device was moved to an incubator where cells were allowed to adhere to the channel surfaces for 45 min. Once hMVEC reached confluence in the channel (about 48 h), the hMVEC were subjected to a 0.30 dyne/cm2 shear stress for additional 24 h utilizing a syringe pump. Exposure to this low shear stress maintains a cobble-stone morphology in which the hMVEC have no apparent alignment. This is consistent with venule morphology in vivo.19 The confluence of the grown endothelial monolayers can clearly be seen in Fig. 1(c). When studying the effect of inflammatory cytokine stimulation, hMVEC monolayers were treated with 50 ng/ml TNF-α for 5 h prior to experiments, as previously reported.8
Dynamic adhesion assay of cancer cells
The prepared microfluidic device was placed in a stage-top incubator (Okolab) on an inverted microscope (IX71, Olympus). Both end ports of the microchannel were connected to separate syringe pumps to perfuse hMVEC medium at physiologically relevant velocities. It has been reported that the mean blood velocity at human capillary beds and post-capillary venules ranges from approximately 250 to about 1400 μm/s.20 To match these physiological conditions, and study the effect of blood velocity on the adherence of circulating cancer cells, medium was perfused through the microchannel at rates providing mean fluid velocities () of 300, 600, and 900 μm/s. These velocity conditions are corresponding to the wall shear stress of 0.36, 0.72, and 1.1 dyne/cm2. For convenience, the mean velocity was used to refer each experimental group. Harvested MCF-7 cells were suspended in hMVEC culture medium at a concentration of 1.5 × 10⁵ cells/ml, and then 50 μl of this suspension was then added to the center reservoir. Cancer cells from the reservoir then sedimented into the channel, allowing for a relatively constant stream of flowing cells in the observation area, which was located approximately midpoint between the reservoir and the channel outlet. Instead of using more adhesive cancer cells, we selected MCF-7 cells with relative low metastatic potential since the cells would still interact with endothelium in the flow but not significantly block the channel due to excessive adhesion, which might alter the flow condition and shear rates. The channel was imaged for cellular motion of MCF-7 cancer cells with a CCD camera (EXI Aqua, Q Imaging). The images were further analyzed to characterize cancer cell interaction with endothelium. Circulating cells were tracked using the ImageJ (NIH) plugin software TrackMate, allowing for cellular velocity to be extracted from the images. The resulting information was then imported into MATLAB for analysis of adhesion kinetics. Typically 80 ∼130 cells were observed throughout a single image sequence of at least 1000 images.
Analysis of cancer cell adhesion characteristics
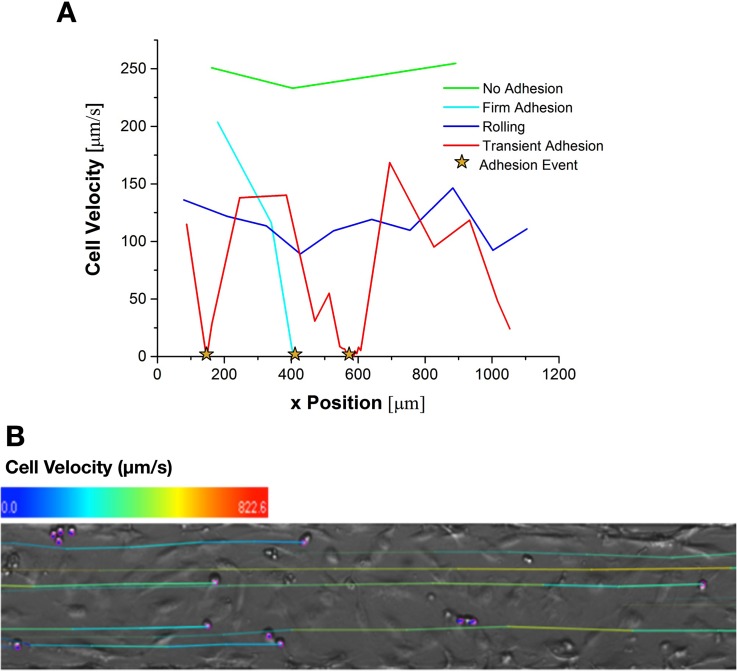
The cancer cell behavior was quantified by categorization into different states of dynamic adhesion, which has been previously used in adhesion assays under flow with various cell types.12,21–23 These dynamic states of adhesion are defined using cell velocity as follows: (i) “no adhesion” describes a state where cells are moving at a velocity greater than 0.5 ; (ii) “rolling” describes a state where cells move slower than 0.5 , but without notable periods of immobilization; (iii) “transient adhesion” describes cells moving slower than 0.5 with notable periods of immobilization; and (iv) “firm adhesion” describes cells which have moved less than 0.2 μm in 0.5 s. From direct observation of cells that were clearly in the firm adhesion state, the criterion for the final state was amended to be cells for which cellular velocity is less than 2 μm/s. This amendment was made because of spatial and temporal resolutions of the present imaging and analysis setup. In addition, cells had to remain firmly adhered for the duration of the experiment in order to be classified under “firm adhesion.” Cells which attached within 30 s of the end of the experiment were observed for an additional 30 s to determine their final classification.21 Figure 2 summarizes the cellular velocity characteristics of each adhesion state. Only cells, which had a chance of interacting with the endothelial monolayer, were analyzed.
FIG. 2.
Illustration of states of dynamic adhesion using velocity versus position profiles for the four states of adhesion. (a) The data shown were gathered from individual cells clearly exhibiting each behavior during adhesion assays with a mean velocity of 300 μm/s. Adhesion events are defined as periods where the cell becomes immobilized for at least one frame sequence. (b) A representative image after cell tracking analysis. The color of the track indicates the cell's velocity history.
In order to exclude cell which were not likely to interact with the monolayer, a threshold velocity was determined. To determine this threshold velocity, an endothelial cell free microchannel was coated with Pluronic F68 (Sigma) to prevent any interaction between circulating MCF-7 and the glass substrate at the bottom of the channel. MCF-7 cells were slowly perfused into the channel and then allowed to settle. This ensured that cells were in contact with the bottom of the microchannel. After a 2 min settling period, an identical flow rate to that of the corresponding adhesion assays was applied to the cancer cells. The microchannel was imaged near the exit port for 30 s, enough time to gather velocity data from about 50 cells. Tracking analysis was performed to determine mean velocity values for non-interacting MCF-7 traveling near the bottom surface of the microchannel.
In adhesion experiments, cancer cells that traveled at or below the determined the mean velocity of non-interacting cells plus one standard deviation were considered to be capable of interacting with the endothelium, and all others were excluded from analysis. Since cells excluded by the threshold velocity are typically flowing far way from the endothelium without interaction, the analysis results were not significantly affected by this exclusion practice.
Theoretical model of adhesion kinetics
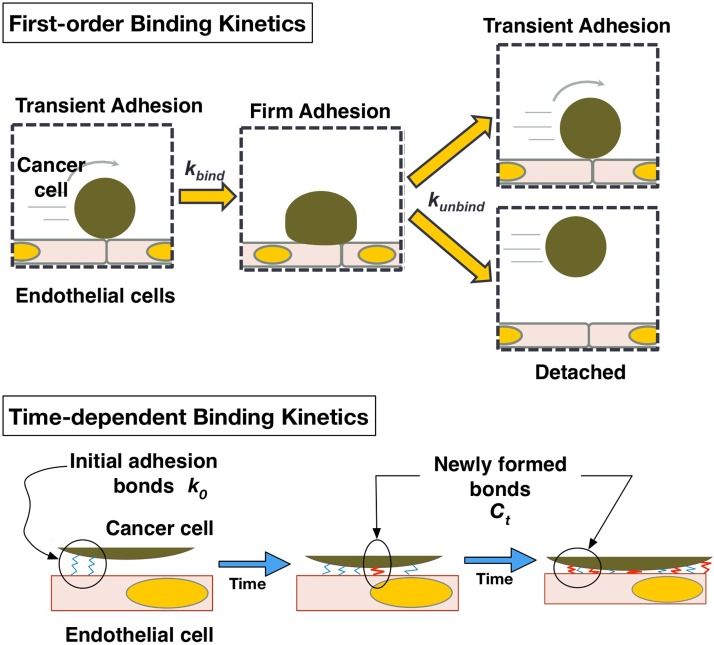
Data obtained from adhesion experiments were used to characterize adhesion kinetics mediated by receptor-ligand binding mechanisms as illustrated in Fig. 3. The rate of MCF-7 cell adhesion to the hMVEC monolayer can be modeled using the first-order kinetic process below24,25
| (1) |
where and are the forward and reverse rate constants of adhesion, respectively, is the number of free cells available for binding, and (t) is the number of bound cells at time t. Due to the constant influx cells into the observation window, the quantity can be approximated as constant. This value can be estimated by the following relationship of experimental parameters:
| (2) |
where is the flux of cancer cells into the channel, L is the length of the channel in the field of view, and is the average non-attached cell velocity. The quotient of L by , which represents the average time that a cell will be in the field of view, when multiplied with , gives an estimate of the number of cells available for binding in the observation window. This enables the first term on the right hand side of Eq. (1) to be written as
| (3) |
where is the total number of cells which are immobilized for any amount of time including both firmly and transiently adhered cells. Using Eq. (3), was determined by numerically integrating . The value for can be determined similarly based on the time rate of change in the total number of detached cells, , as follows:
| (4) |
While the generic rate constants above are useful in predicting the total accumulation of adherent cancer cells, they are not telling of the receptor-ligand interactions occurring at the molecular level. In order to study receptor-ligand based interactions, the values of were further analyzed. When a cell remains immobilized, as illustrated in Fig. 3, new receptor-ligand complexes can be formed between the adhered cell and the endothelium, strengthening the adhesion, and reducing the likelihood of detachment.24 Therefore, the duration of immobilization for adhesion events was analyzed to see how the probability of detachment changes with the binding time. It can be ascertained that is inversely proportional to the number of receptor-ligand complexes between the cancer cell and the endothelial substrate.13,26,27 Not only are more bonds tethering the adherent cell to the substrate, but also the reverse rate constant of bond formation is reduced as the amount of force acting on each receptor-ligand complex is decreased.13,26 Therefore, a relationship is proposed for kunbind as follows:
| (5) |
where is the initial rate of unbinding, and is a bond formation rate constant. Although bond formation is a nonlinear process and is governed by a first order kinetic relationship,25,27 it was assumed that the number of receptor-ligand complexes is much less than the number of receptors and ligands available for binding, allowing this relationship to be approximated as linear.
FIG. 3.
Schematic of proposed theoretical model of first-order adhesion kinetics and time-dependent binding.
Statistical analysis
All experiments were done in at least triplicate (n ≧ 3) and data are presented in the form: mean ± standard deviation. Statistical significance between experimental groups were determined using an unpaired two-tailed t-test.
RESULTS
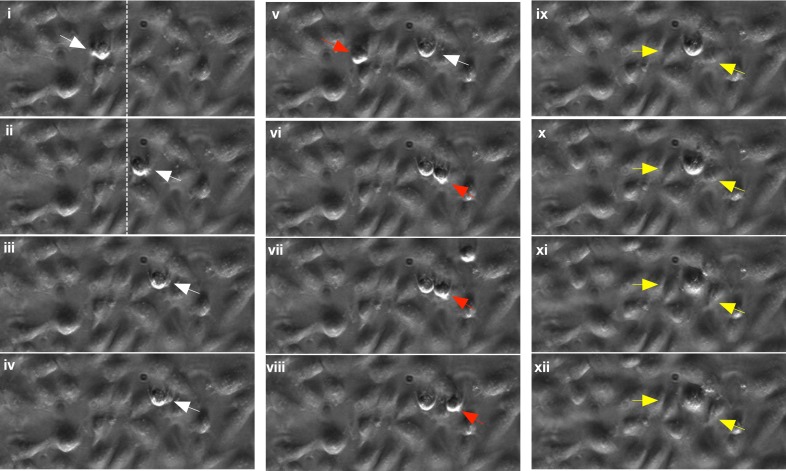
A representative interaction between circulating MCF-7 cells and the hMEVC endothelium-on-chip is shown in Fig. 4 (Multimedia view). The time-lapse microscopy images illustrate adhesion and ensuing interactions of a single cell in detail. This particular MCF-7 cell showed signs of rolling before becoming firmly adhered and subsequently migrating across the endothelial monolayer. The MCF-7 (noted with a white arrow) cell becomes adherent (i) and rolls on hMVEC layer (ii). Dotted lines are drawn to note the reference location. The cell eventually becomes firmly adherent as shown in images (ii) and (iv). Once cells became firmly adhered, membrane blebbing was often observed. Since the cell spread out and maintained adhesion during the membrane blebbing, this is not thought to be associated with cellular apoptosis. This blebbing is thought to be a mechanism of cell locomotion through the endothelium as suggested previously.28–30 In addition to interactions with the hMVEC endothelium, flowing tumor cells also showed homotypic interactions with MCF-7 cells which were already firmly adhered. This behavior can be seen in images (v)–(viii); a freely flowing MCF-7 cell (noted with a red arrow) becomes adherent near the blebbing of the previously firmly adhered cell (white arrow). Since this was mainly observed at the blebbing site, which is the downstream of the firmly adhered cell, it may not be due to its physical presence. Beginning of extravasation of firmly adhered tumor cells was further observed. In images (ix)–(xii), the firmly adhered MCF-7 cell appears to displace two adjoining hMVECs (noted with yellow arrows), which may indicate creation of gap through which the cell may cross the endothelium. A video clip of all time-lapse microscopy images is provided to support the observation (Multimedia view).
FIG. 4.
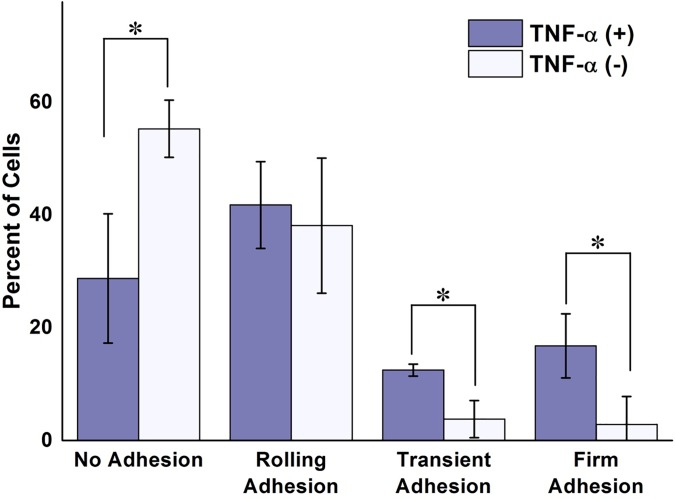
Figure 5 depicts the percentage of MCF-7 cells that exhibited each of the four previously defined adhesion behaviors on unstimulated and TNF-α stimulated hMVEC. As expected, TNF-α stimulation significantly increased the amount of observable interaction occurring between circulating cancer cells and the endothelial monolayer. The majority MCF-7 cells on the unstimulated endothelium displayed no observable adhesion behavior, with virtually none becoming immobilized for any discernable amount of time. In addition, cells considered to be rolling traveled, on average, 20% faster on unstimulated endothelium than on the TNF-α stimulated hMVEC. These results are not surprising due to the lack of adhesion molecules in resting type endothelial cells. Once stimulated, however, interaction between the circulating cells and the endothelium became more prevalent, with the vast majority of cells exhibiting some form of adhesion. Nearly 30% of adhering cells became immobilized at some point with more than half of these becoming firmly adhered.
FIG. 5.
Effects of TNF-alpha on cancer cell-endothelium interactions. Percent of cells undergoing each defined state of adhesion for unstimulated and TNF- α stimulated hMVEC subjected to an average fluid velocity of 300 μm/s. A significant difference in the number of interacting cancer cells is apparent between the two experimental conditions, with more cells becoming transiently and firmly adherent in the TNF-α treated group. The results are presented in the form: mean± standard deviation. The percentage of cell adhesion states was obtained from 3 devices per each treatment group (n = 3, *: p < 0.05).
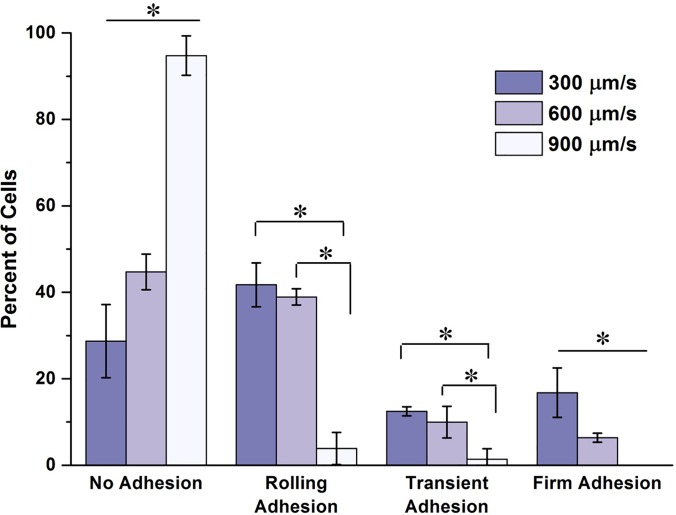
Figure 6 shows the differences in the states of adhesion for adhesion assays performed at mean fluid velocities of 300, 600, and 900 μm/s. A clear and significant difference can be seen in the number of firmly adherent circulating MCF-7 cells between the experimental groups. There is a clear jump in the percent of non-interacting tumor cells as the fluid velocity increased. As the velocity increased to 900 μm/s, the vast majority flowing tumor cells failed to show any discernable interaction with the underlying endothelium. An interesting observation was the number of slowly rolling cells present in the 600 μm/s experimental group. This slow rolling was not observed in either the low or the high velocity groups. This may suggest that the rate of receptor-ligand complex formation and destruction were near equilibrium at this flow rate.
FIG. 6.
Effects of flow velocity on cancer cell-endothelium interactions. Percent of cells undergoing each defined state of adhesion for each flow condition on TNF-α stimulated endothelium. A trend can be seen in the data as the mean flow velocity increased. The number of non-interacting cells increased significantly with increasing flow rate, while the number of firmly adherent cells decreased significantly. At the high mean velocity, there was a large jump in the number of non-interacting cells. At this high velocity, there was virtually no cancer cell immobilization, and very little rolling behavior observed. The results are presented in the form: mean ± standard deviation. The percentage of cell adhesion states was obtained from 3 devices per each flow velocity group (n = 3, *: p < 0.05).
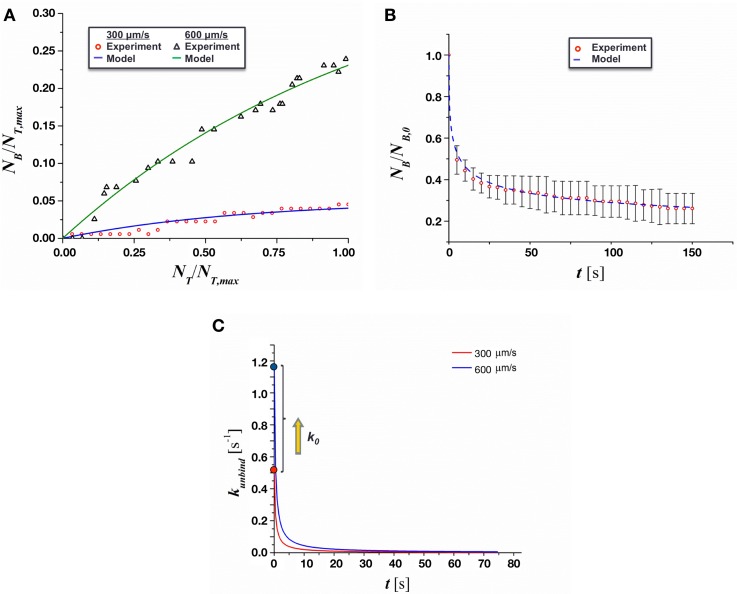
The results of adhesion kinetics analysis are presented in Fig. 7. The kinetics rates of adhesion, kbind and kunbind, were extracted by non-linear curve-fitting of the first order kinetic model in Eqs. (3) and (4) to the experimental data of the number of bounded MCF-7 cells during the duration of observations. The values for kbind and kunbind are summarized in Table I. As shown in Fig. 7(a) and the standard deviation values of kbind and kunbind in Table I, the fit of the theoretical model to the experimental data predicts the rate constants within approximately 20% of the mean value. As expected, no statistical difference was shown between the kbind values at 300 μm/s and 600 μm/s. The reduction in adhesion with increasing flow rate was instead driven by a significant increase in the value of kunbind.
FIG. 7.
Analysis of the adhesion kinetics of MCF-7 cells on TNF-α stimulated endothelium. (a) Curve-fitting of the proposed first-order kinetic model to experimental binding results. (b) Curve-fitting of the proposed time-dependent unbinding model for a mean flow of 300 μm/s. (c) Time dependent value of kunbind.
TABLE I.
Estimated values of kbind and kunbind for the proposed first order kinetic model. Values with “*” symbol are statistically significantly different. For the case of 900 μm/s, kbind and kunbind could not be estimated since no cells were adhered to the endothelium.
| Mean flow velocity (μm/s) | kbind (s−1) | kunbind (s−1) |
|---|---|---|
| 300 | 25.7 ± 5 | 4.01 ± 1.06* |
| 600 | 21.8 ± 5 | 10.95 ± 2.30* |
| 900 | N/A | N/A |
The duration of adhesion events observed during experiments was also used to determine the time-dependent unbinding rates, as shown in Fig. 7(b). After nonlinear curve-fitting of Eq. (5) to these data, the values of Ct and k0 were estimated and are presented in Table II. The value of k0 increased by a factor of about 2, while the binding rate remained relatively constant between the experimental groups. The value of k0 is very close to that of E-selectin, which suggests a significant role of E-selectin in the initial interaction between the MCF-7 and hMVECs. Furthermore, it was found that kunbind did, in fact, decrease significantly with time, as shown in Fig. 7(c). The decrease was quite significant immediately after adhesion events and diminished asymptotically as time increased, suggesting that additional adhesion molecules may have been recruited to facilitate adhesion as MCF-7 cells became immobilized.
TABLE II.
Resulting values of k0 and Ct for the proposed time dependent model for kunbind. Values with “*” symbol are statistically significantly different. For the case of 900 μm/s, Ct and k0 could not be estimated since no cells became adhered to the endothelium.
| Mean flow velocity (μm/s) | Ct (s−1) | k0 (s−1) | Reported k0 of E-selectin31 |
|---|---|---|---|
| 300 | 2.49 ± 0.39 | 0.52 ± 0.07* | 0.67 |
| 600 | 2.59 ± 0.07 | 1.18 ± 0.05* | 1.14 |
| 900 | N/A | N/A |
DISCUSSION
It has been previously reported that treatment of endothelial monolayers with TNF-α has a considerable impact on the number of tumor cells interacting with the endothelium.8 Cancer cells flowing through microchannels laden with unstimulated endothelial cells exhibited no periods of immobilization, likely due to the absence of adhesion molecule expression on the endothelial luminal wall. In contrast, the number of each rolling, transiently adhering, and firmly adherent cancer cells on TNF-α stimulated endothelial wall was substantial. This suggests an upregulation of adhesion molecules expressed by the endothelial cells consistent with previous reports.32 The increased number of interacting cancer cells, along with the observed decrease in average rolling velocity, suggests an increase in the expression of selectins, which are often implicated in the rolling and adhesion of circulating tumor cells.33,34 Among the selectins, E-selectin has been identified as a key molecule for initial adhesion of cancer cells to endothelium in both in vitro and in vivo models.35–37 E-selectin has been shown to be upregulated by inflammatory cytokines such as TNF-α.38 The calculated value of k0 was similar to previously reported reverse rate constants for E-selectin under similar hydrodynamic shear conditions, lending further support to the contribution of selectins to the cell adhesion seen in the in vitro experiments.31 This result, along with the prevalence of firmly adherent MCF-7, suggests that immobilization may have been initially supported by a small number of selectin bonds before being reinforced by other adhesion molecules. There have been conflicting reports on the ability for E-selectin to solely mediate firm adhesion.31,39
The rates from the first order kinetic model outlined in this work may be useful in predicting the location and under what conditions freely flowing tumor cells will attach and extravasate. In addition, further analysis of the kinetic unbinding rate as shown in Eq. (5) suggested that initial cancer cell adhesion may be mediated by only a few E-selectin bonds since kunbound is very close to k0 of E-selectin when t = 0. Then, these bindings are thought to be stabilized by the formation of stronger receptor-ligand complexes, which is explained by decreased kunbound value as time increases. This analysis also lent support to the previous observations of an increase in the forward kinetic rate constant for the formation of selectin bonds up to a certain threshold fluid shear stress. Additional experiments incorporating different concentrations and types of cytokines would be useful to further investigate the role of adhesion molecule expression in tumor cell adhesion. Experiments utilizing an E-selectin blocker are also necessary to validate the hypothesis that initial cell adhesion is mediated by E-selectin. Histochemical staining for adhesion molecules in TNF-α stimulated endothelial cells would be useful in validating the assumed upregulation of said molecules. In addition, different tumor cell types should be analyzed to compare with the data presented in this study. Further works may also look to expand the time dependent model for kunbind to estimate molecular parameters such as ligand concentration, and molecular forward and reverse kinetic bind formation rates. This would be an incredibly useful tool in the analysis of adhesion mechanisms.
Increasing the mean fluid velocity along the channel resulted in a decrease in the number of firmly adherent cells and an overall decrease in the number of interacting cells due to the increased forces on existing bonds. The higher shear rates corresponding with the higher flow rates result in significantly higher forces of the adhered tumor cells, in turn, the individual receptor-ligand complexes experienced greater force application. The increase in force contributes to a higher effective reverse kinetic rate of bond formation as described previously.22 This phenomenon can be seen in the calculated values of kunbind as it more than doubles with a doubling of the mean fluid velocity. The increased unbinding rate was likely also the reason for the observed decrease in the number of interacting cells (rolling, transient, and firmly adherent). Many of the bonds being formed between the circulating cancer cells and the underlying endothelium were broken so rapidly that the effect of the bonds on the cells' overall velocity was much less than at lower flow rates. Also consistent with previous models40,41 is the relatively small, non-significant, decrease in the forward reaction rate with increase flow velocity. This suggests that the rate of bond formation is not impacted significantly by the increase in force on the cell, and that the decreased cancer cell adhesion is mostly due to an increase in the breakage of receptor-ligand complexes.
The decrease in the unbinding rate with an increase in binding time is consistent with previous theoretical models.22,25 The longer an immobilized cancer cell remains adhered, the higher the probability of additional receptor-ligand complexes forming, reducing the likelihood that the cell will detach from the adherent surface. The nonlinear decrease in cell detachment shown agrees well with the probabilistic detachment model first developed in 1990.24 This model shows an asymptotic relationship between the probability of an adherent cell detaching and the time of adhesion. Not only are the number of receptor-ligand complexes increasing, but there begins to be contributions of stronger binding complexes, including integrins. If high affinity integrin binding occurs, there will be rapid stabilization of the adhered tumor cell, greatly reducing the chances of detachment and recirculation.42 In the presence of higher flow speeds, k0 showed an expected increase, and demonstrated values very similar to those reported previously for E-selectin, as seen in Table II. Interestingly, the rate of bond formation, Ct, showed no statistical change between the different shear groups. With an increase in the amount of force on the receptor-ligand complexes, one would expect that the rate of bond formation would decrease and, in turn, that kunbind would decrease at a slower rate. The reason for this unexpected result may be the enhancement of selectin binding by the increased shear stress. It has been previously proposed that the forward kinetic rate for the formation of bonds between selectins and their ligands is modulated by shear stress.42,43 The interplay between the increase in both the forward and reverse kinetic rates of bond formation is likely the cause of the relatively stable binding constant observed in the experimental data.
Multiple adhesion ligand-receptor complexes are involved in the extravasation of circulating cancer cells. The ability to run systematic studies to delineate the role of these ligands-receptor pairs is important to improve our understanding of these complex processes. The presented model provides a biochemically and biophysically diverse environment to further study the role of other adhesion molecules. After initial adhesion, we observed firm adhesion, which is thought to be mediated by integrin and CD44-selectin interactions.44,45 Based on our observation presented in Fig. 4, a firmly adherent cell in the present endothelium model seems to mimic the initial signs of TEM. Although further research is warranted to quantify and confirm endothelial cell dislocations and subsequent TEM of cancer cells, integrins are thought to stabilize firmly adherent cells and initiate cell spreading, crawling, and extravasation.42 These molecules are known to be expressed on the surface of the adhered cancer cell and to be activated by cytokines released by the underlying endothelial cells.33 Among two known TEM mechanisms, i.e., paracellular and transcellular TEM,46,47 the present results are thought to be mimicry of paracellular TEM. Further research is warranted to confirm TEM and determine the relative significance of these two TEM mechanisms.
The hMEVC endothelium-on-chip developed can be further improved and validated by confirmation of molecular markers such as VE-cadherin (vascular endothelial cadherin) and selective permeability, although we confirmed the confluency of endothelial cells using membrane staining. Incorporation of soft substrates such as PDMS48 and collagen matrices14 will provide hMVEC with more in vivo-like environment than rigid glass slide. Moreover, collagen matrices will also allow full observation of TEM of cancer cells.
ACKNOWLEDGMENTS
This work was partially supported by NCI Contract No. HHSN261201400021C, a CTR Award from Indiana CTSI funded in part by UL1 TR000006 from NIH, and a grant from Walther Cancer Foundation. The authors also acknowledge the support from the Purdue University Center for Cancer Research, NIH Grant No. P30 CA023168.
References
- 1. Chambers A. F., Groom A. C., and MacDonald I. C., Nat. Rev. Cancer 2(8), 563–572 (2002). 10.1038/nrc865 [DOI] [PubMed] [Google Scholar]
- 2. Hanna N., Cancer Metastasis Rev. 1(1), 45–64 (1982). 10.1007/BF00049480 [DOI] [PubMed] [Google Scholar]
- 3. Weiss L., Cancer Metastasis Rev. 11(3-4), 227–235 (1992). 10.1007/BF01307179 [DOI] [PubMed] [Google Scholar]
- 4. Reymond N., d'Água B. B., and Ridley A. J., Nat. Rev. Cancer 13(12), 858–870 (2013). 10.1038/nrc3628 [DOI] [PubMed] [Google Scholar]
- 5. Luzzi K. J., MacDonald I. C., Schmidt E. E., Kerkvliet N., Morris V. L., Chambers A. F., and Groom A. C., Am. J. Pathol. 153(3), 865–873 (1998). 10.1016/S0002-9440(10)65628-3 [DOI] [PMC free article] [PubMed] [Google Scholar]
- 6. Martinez-Corral I., Olmeda D., Dieguez-Hurtado R., Tammela T., Alitalo K., and Ortega S., Proc. Natl. Acad. Sci. 109(16), 6223–6228 (2012). 10.1073/pnas.1115542109 [DOI] [PMC free article] [PubMed] [Google Scholar]
- 7. Tanaka K., Toiyama Y., Okugawa Y., Okigami M., Inoue Y., Uchida K., Araki T., Mohri Y., Mizoguchi A., and Kusunoki M., Am. J. Transl. Res. 6(3), 179–187 (2014). [PMC free article] [PubMed] [Google Scholar]
- 8. Song J. W., Cavnar S. P., Walker A. C., Luker K. E., Gupta M., Tung Y.-C., Luker G. D., and Takayama S., PLoS ONE 4(6), e5756 (2009). 10.1371/journal.pone.0005756 [DOI] [PMC free article] [PubMed] [Google Scholar]
- 9. Fenyves A. M., Behrens J., and Spanel-Borowski K., J. Cell. Sci. 106, 879–890 (1993). [DOI] [PubMed] [Google Scholar]
- 10. Cinamon G., Shinder V., and Alon R., Nat. Immunol. 2(6), 515–522 (2001). 10.1038/88710 [DOI] [PubMed] [Google Scholar]
- 11. Hong S., Lee D., Zhang H., Zhang J. Q., Resvick J. N., Khademhosseini A., King M. R., Langer R., and Karp J. M., Langmuir 23(24), 12261–12268 (2007). 10.1021/la7014397 [DOI] [PMC free article] [PubMed] [Google Scholar]
- 12. Zheng X., Cheung L. S.-L., Schroeder J. A., Jiang L., and Zohar Y., Lab Chip 11(20), 3431–3439 (2011). 10.1039/c1lc20455f [DOI] [PMC free article] [PubMed] [Google Scholar]
- 13. Cheung L. S. L., Zheng X., Wang L., Guzman R., Schroeder J. A., Heimark R. L., Baygents J. C., and Zohar Y., J. Microelectromech. Syst. 19(4), 752–763 (2010). 10.1109/JMEMS.2010.2052021 [DOI] [Google Scholar]
- 14. Bersini S., Jeon J. S., Dubini G., Arrigoni C., Chung S., Charest J. L., Moretti M., and Kamm R. D., Biomaterials 35(8), 2454–2461 (2014). 10.1016/j.biomaterials.2013.11.050 [DOI] [PMC free article] [PubMed] [Google Scholar]
- 15. Ozcelikkale A., Moon H-r, Linnes M., and Han B., WIREs Nanomed. Nanobiotechnol. 9, e1460 (2017). 10.1002/wnan.1460 [DOI] [PMC free article] [PubMed] [Google Scholar]
- 16. Ozcelikkale A., Shin K., Noe-Kim V., Elzey B. D., Dong Z., Zhang J.-T., Kim K., Kwon I. C., Park K., and Han B., J. Controlled Release 266, 129–139 (2017). 10.1016/j.jconrel.2017.09.024 [DOI] [PMC free article] [PubMed] [Google Scholar]
- 17. Sung K. E., Yang N., Pehlke C., Keely P. J., Eliceiri K. W., Friedl A., and Beebe D. J., Integr. Biol. 3(4), 439–450 (2011). 10.1039/C0IB00063A [DOI] [PMC free article] [PubMed] [Google Scholar]
- 18. Kwak B., Ozcelikkale A., Shin C. S., Park K., and Han B., J. Controlled Release 194, 157–167 (2014). 10.1016/j.jconrel.2014.08.027 [DOI] [PMC free article] [PubMed] [Google Scholar]
- 19. Wong K. H. K., Chan J. M., Kamm R. D., and Tien J., Annu. Rev. Biomed. Eng. 14(1), 205–230 (2012). 10.1146/annurev-bioeng-071811-150052 [DOI] [PubMed] [Google Scholar]
- 20. Koutsiaris A. G., Tachmitzi S. V., Batis N., Kotoula M. G., Karabatsas C. H., Tsironi E., and Chatzoulis D. Z., Biorheology 44(5-6), 375–386 (2007). [PubMed] [Google Scholar]
- 21. Chang K. C., Tees D. F., and Hammer D. A., Proc. Natl. Acad. Sci. U. S. A. 97(21), 11262–11267 (2000). 10.1073/pnas.200240897 [DOI] [PMC free article] [PubMed] [Google Scholar]
- 22. Hammer D. A. and Apte S. M., Biophys. J. 63(1), 35–57 (1992). 10.1016/S0006-3495(92)81577-1 [DOI] [PMC free article] [PubMed] [Google Scholar]
- 23. Korn C. B. and Schwarz U. S., Phys. Rev. E 77(4 Pt 1), 041904 (2008). 10.1103/PhysRevE.77.041904 [DOI] [PubMed] [Google Scholar]
- 24. Cozens-Roberts C., Lauffenburger D. A., and Quinn J. A., Biophys. J. 58(4), 841–856 (1990). 10.1016/S0006-3495(90)82430-9 [DOI] [PMC free article] [PubMed] [Google Scholar]
- 25. Goldman A. J., Cox R. G., and Brenner H., Chem. Eng. Sci. 22(4), 653–660 (1967). 10.1016/0009-2509(67)80048-4 [DOI] [Google Scholar]
- 26. Dembo M., Torney D. C., Saxman K., and Hammer D., Proc. R. Soc. London, B 234(1274), 55–83 (1988). 10.1098/rspb.1988.0038 [DOI] [PubMed] [Google Scholar]
- 27. Swift D. G., Posner R. G., and Hammer D. A., Biophys. J. 75(5), 2597–2611 (1998). 10.1016/S0006-3495(98)77705-7 [DOI] [PMC free article] [PubMed] [Google Scholar]
- 28. Fackler O. T. and Grosse R., J. Cell Biol. 181(6), 879–884 (2008). 10.1083/jcb.200802081 [DOI] [PMC free article] [PubMed] [Google Scholar]
- 29. Norman L. L., Brugues J., Sengupta K., Sens P., and Aranda-Espinoza H., Biophys. J. 99(6), 1726–1733 (2010). 10.1016/j.bpj.2010.07.031 [DOI] [PMC free article] [PubMed] [Google Scholar]
- 30. Ghosh S., Xiong G., Fisher T. S., and Han B., Mater. Lett. 184, 211–215 (2016). 10.1016/j.matlet.2016.08.077 [DOI] [Google Scholar]
- 31. Alon R., Chen S., Puri K. D., Finger E. B., and Springer T. A., J. Cell Biol. 138(5), 1169–1180 (1997). 10.1083/jcb.138.5.1169 [DOI] [PMC free article] [PubMed] [Google Scholar]
- 32. Haraldsen G., Kvale D., Lien B., Farstad I. N., and Brandtzaeg P., J. Immunol. 156(7), 2558–2565 (1996). [PubMed] [Google Scholar]
- 33. Kannagi R., Glycoconjugate J. 14(5), 577–584 (1997). 10.1023/A:1018532409041 [DOI] [PubMed] [Google Scholar]
- 34. Tözeren A., Kleinman H. K., Grant D. S., Morales D., Mercurio A. M., and Byers S. W., Int. J. Cancer 60(3), 426–431 (1995). 10.1002/ijc.2910600326 [DOI] [PubMed] [Google Scholar]
- 35. Barthel S. R., Hays D. L., Yazawa E. M., Opperman M., Walley K. C., Nimrichter L., Burdick M. M., Gillard B. M., Moser M. T., Pantel K., Foster B. A., Pienta K. J., and Dimitroff C. J., Cancer Res. 73(2), 942–952 (2013). 10.1158/0008-5472.CAN-12-3264 [DOI] [PMC free article] [PubMed] [Google Scholar]
- 36. Läubli H. and Borsig L., Semin. Cancer Biol. 20(3), 169–177 (2010). 10.1016/j.semcancer.2010.04.005 [DOI] [PubMed] [Google Scholar]
- 37. St Hill C. A., Front. Biosci. 16, 3233–3251 (2011). 10.2741/3909 [DOI] [PubMed] [Google Scholar]
- 38. Eichbaum C., Meyer A.-S., Wang N., Bischofs E., Steinborn A., Bruckner T., Brodt P., Sohn C., and Eichbaum M. H. R., Anticancer Res. 31(10), 3219–3227 (2011). [PubMed] [Google Scholar]
- 39. Song K. H., Kwon K. W., Song S., Suh K.-Y., and Doh J., Biomaterials 33(7), 2007–2015 (2012). 10.1016/j.biomaterials.2011.12.002 [DOI] [PubMed] [Google Scholar]
- 40. Bell G. I., Science 200(4342), 618–627 (1978). 10.1126/science.347575 [DOI] [PubMed] [Google Scholar]
- 41. Bell G. I., Dembo M., and Bongrand P., Biophys. J. 45(6), 1051–1064 (1984). 10.1016/S0006-3495(84)84252-6 [DOI] [PMC free article] [PubMed] [Google Scholar]
- 42. Haier J. and Nicolson G. L., APMIS 109(4), 241–262 (2001). 10.1034/j.1600-0463.2001.d01-118.x [DOI] [PubMed] [Google Scholar]
- 43. Moss M. S., Sisken B., Zimmer S., and Anderson K. W., Biorheology 36(5-6), 359–371 (1999). [PubMed] [Google Scholar]
- 44. Draffin J. E., McFarlane S., Hill A., Johnston P. G., and Waugh D. J. J., Cancer Res. 64(16), 5702–5711 (2004). 10.1158/0008-5472.CAN-04-0389 [DOI] [PubMed] [Google Scholar]
- 45. Zen K., Liu D.-Q., Guo Y.-L., Wang C., Shan J., Fang M., Zhang C.-Y., and Liu Y., PLoS ONE 3(3), e1826 (2008). 10.1371/journal.pone.0001826 [DOI] [PMC free article] [PubMed] [Google Scholar]
- 46. Heyder C., Gloria-Maercker E., Entschladen F., Hatzmann W., Niggemann B., Zänker K. S., and Dittmar T., J. Cancer Res. Clin. Oncol. 128(10), 533–538 (2002). 10.1007/s00432-002-0377-7 [DOI] [PMC free article] [PubMed] [Google Scholar]
- 47. Reymond N., Im J. H., Garg R., Vega F. M., Borda d'Agua B., Riou P., Cox S., Valderrama F., Muschel R. J., and Ridley A. J., J. Cell Biol. 199(4), 653–668 (2012). 10.1083/jcb.201205169 [DOI] [PMC free article] [PubMed] [Google Scholar]
- 48. Sivarapatna A., Ghaedi M., Xiao Y., Han E., Aryal B., Zhou J., Fernandez-Hernando C., Qyang Y., Hirschi K. K., and Niklason L. E., Cell Transplant 26(8), 1365–1379 (2017). 10.1177/0963689717720282 [DOI] [PMC free article] [PubMed] [Google Scholar]


