

SUMMARY
Thymic epithelial tumors (TETs) are one of the rarest adult malignancies. Among TETs, thymoma is the most predominant, characterized by a unique association with autoimmune diseases, followed by thymic carcinoma which is less common but more clinically aggressive. Using multi-platform omics analyses on 117 TETs, we define four subtypes of these tumors defined by genomic hallmarks and an association with survival and WHO histological subtype. We further demonstrate a marked prevalence of a thymoma-specific mutated oncogene GTF2I, and explore its biological effects on multi-platform analysis. We further observe enrichment of mutations in HRAS, NRAS, and TP53. Lastly, we identify a molecular link between thymoma and the auto-immune disease myasthenia gravis, characterized by tumoral over-expression of muscle auto-antigens, and increased aneuploidy.
Keywords: Thymoma, Thymic Carcinoma, Thymic Epithelial Tumors, TCGA, Genomics, Transcriptomics, Proteomics, Autoimmunity, Myasthenia Gravis
Radovich et al. perform multi-platform analyses of thymic epithelial tumors. They identify high prevalence of GTF2I mutations and enrichment of mutations in HRAS, NRAS, and TP53 and link over-expression of muscle auto-antigens and increased aneuploidy in thymoma and patients’ risk of having myasthenia gravis.

INTRODUCTION
Thymic epithelial tumors (TETs) represent the most common neoplasms of the anterior mediastinum, but are among the rarest of all cancers with an incidence of 0.15 cases per 100,000 person-years (Engels, 2010; Engels and Pfeiffer, 2003). TETs exhibit a wide spectrum of clinical behaviors with 30-40% of patients with thymoma exhibiting co-existent autoimmune disorders, in particular thymoma-associated myasthenia gravis (TAMG). In advanced disease, 5-year median survival is 69% in thymoma and only 36% in thymic carcinoma (Scorsetti et al., 2016). The most commonly used histological classification and clinical staging system are the World Health Organization (WHO) and the Masaoka-Koga, respectively (Koga et al., 1994; Travis et al., 2015). Surgery is the cornerstone of treatment for early-stage TETs. Completeness of surgical resection represents the most important clinical factor influencing recurrence rates and prognosis. Other risk factors associated with recurrence include: histology, clinical stage, and molecular signatures (Detterbeck et al., 2011a; Gokmen-Polar et al., 2013). Although various systemic treatment options exist for patients with locally advanced or metastatic disease, none are curative.
The etiology of TETs is unknown with limited knowledge of the genomic underpinnings of thymoma and thymic carcinoma. Immunohistochemical analyses have revealed overexpression of EGFR, HER2, KIT, IGF-1R, and neurotrophin receptors (Scorsetti et al., 2016). However, mutations in EGFR and KIT are uncommon (Scorsetti et al., 2016). A number of previous studies have performed molecular analyses of TETs using different platforms (Badve et al., 2012; Girard et al., 2009; Lee et al., 2007; Sasaki et al., 2002). Girard et al. documented that histological subtypes of thymoma exhibited differential molecular profiles with thymic carcinomas displaying more chromosomal gains and losses and occasionally harboring somatic mutations in KIT (Girard et al., 2009). Badve et al. also reported the association of distinct molecular clusters with different histological subtypes (Badve et al., 2012) that ultimately lead to the development of a nine gene expression signature (DecisionDX® Thymoma) that predicts the likelihood of metastasis (Gokmen-Polar et al., 2013). Exome sequencing has revealed a high frequency of recurrent mutations in the GTF2I gene in type A and AB thymomas (Petrini et al., 2014). More recent data have demonstrated overexpression of a large microRNA cluster on chromosome 19 in type A and AB thymomas, which is associated with PI3K/AKT activation (Radovich et al., 2016). There have been few attempts at more comprehensive molecular analyses of TETs and these studies have utilized a limited number of molecular platforms (Ganci et al., 2014; Huang et al., 2013; Lopez-Chavez et al., 2015; Petrini et al., 2013; Wang et al., 2014). Nevertheless, these efforts have helped identify unique molecular changes in TETs such as an anti-apoptotic gene signature and mutations in genes involved in histone modification, DNA methylation and chromatin remodeling in thymic carcinomas (Bellissimo et al., 2017; Huang et al., 2013; Petrini et al., 2013; Wang et al., 2014). Despite these discoveries, attempts to use molecular-targeted agents for treatment of TETs have met with limited success thus far (Chen et al., 2014). Herein, we present a multi-platform, comprehensive analysis of TETs as part of The Cancer Genome Atlas (TCGA) Project to uncover the integrated genomic landscape of these rare tumors.
RESULTS
Clinical outcomes and demographics
The clinical and pathological characteristics of patients and the 117 samples included in this study are shown in Table 1 and Table S1. Histologic subtypes for each sample were evaluated by WHO criteria. These include the A & AB subtypes defined by spindle/oval epithelial cell morphology (AB includes dense lymphocytic foci); B1, B2, and B3, which have epithelial cells with an epithelioid shape with a gradation of lymphocyte infiltration (B1=lymphocyte-rich to B3=lymphocyte-poor); micronodular thymoma (MN-T); and TC, which is defined as thymic carcinoma with histological features common of epithelial cancers (Dadmanesh et al., 2001; Travis et al., 2004). Myasthenia gravis (MG) was reported in 32 patients (27%) and 7 patients (6%) had other autoimmune diseases. Younger patients were more likely to have been diagnosed with an autoimmune disease, including MG (p=0.031, median ages for patients with and without an autoimmune disease are 52 and 62, respectively). Consolidated histologic subtypes were associated with diagnosis of MG (p=0.00015), and lymphocyte component pattern (p=0.027). MG was associated with each of the histologic thymoma categories A and B but not with TC (p=0.0015).
Table 1.
Demographics and clinical parameters of our patient population. See also Table S1 and Figure S1.
| Parameter | Total (%) |
|---|---|
|
| |
| Total number | 117 |
|
| |
| Median age (range), years | 60 (17 – 84) |
|
| |
| Gender | |
| Male | 61 (52) |
| Female | 56 (48) |
|
| |
| Race | |
| Caucasian | 97 (83) |
| Black | 6 (5) |
| Asian | 12 (10) |
| Data missing | 2 (2) |
|
| |
| Ethnicity | |
| Hispanic | 9 (8) |
| Non-Hispanic | 94 (80) |
| Data missing | 14 (12) |
|
| |
| Masaoka stage | |
| I | 36 (31) |
| IIA | 39 (33) |
| IIB | 19 (16) |
| III | 15 (13) |
| IVA | 1 (1) |
| IVB | 5 (4) |
| Data missing | 2 (2) |
|
| |
| Histologic subgroup: | |
| Thymoma (total 105) | |
| Type A | 10 (9) |
| Type AB | 48 (41) |
| Type B1 | 12 (10) |
| Type B2 | 25 (21) |
| Type B3 | 10 (9) |
| Thymic carcinoma (TC) (total 10) | 4 (3) |
| Squamous cell carcinoma | 4 (3) |
| Undifferentiated carcinoma | 1 (1) |
| Large-cell neuroendocrine carcinoma | 1 (1) |
| Thymic carcinoma, NOS | |
| Micronodular Thymoma (MNT) | 2(2) |
|
| |
| Underwent surgery | |
| Median sternotomy | 72 (61) |
| Clamshell sternotomy | 1 (1) |
| Lateral thoracotomy | 22 (19) |
| Video-assisted thoracoscopic surgery (VATS) | 14 (12) |
| Type of surgery not-specified | 8 (7) |
|
| |
| Extent of surgical resection | |
| R0 (no residual tumor) | 97 (83) |
| R1 (microscopic residual tumor) | 9 (8) |
| R2 (macroscopic residual tumor) | 4 (3) |
| RX (presence of residual tumor cannot be assessed) | 2 (2) |
| Data missing | 5 (4) |
|
| |
| Adjuvant radiation therapy | 39 (33) |
|
| |
| Adjuvant systemic therapy (total 14) | |
| Platinum- and/or anthracycline-containing combination | 6 (43) |
| Other systemic therapy | 4 (29) |
| Targeted therapy | 2 (14) |
| Data missing | 2 (14) |
|
| |
| Recurrence of thymic tumor (total 10) | |
| Locoregional recurrence | 5 (50) |
| Locoregional recurrence and distant metastasis | 3 (30) |
| Distant metastasis | 2 (202) |
|
| |
| Autoimmune disease (total 39)* | |
| Myasthenia gravis only | 32 (82) |
| Non-myasthenia gravis autoimmune disease only | 7 (18) |
| Data missing** | 6 (5) |
|
| |
| Onset of myasthenia gravis (total 32) | |
| Myasthenia gravis diagnosed prior to thymoma | 20 (62.5) |
| Myasthenia gravis and thymoma diagnosed simultaneously | 7 (22) |
| Myasthenia gravis diagnosed after thymoma | 4 (12.5) |
| Data not available | 1 (3) |
|
| |
| Secondary malignancy (total 22) | |
| Diagnosed after thymic tumor | 10 (45) |
| Diagnosed prior to thymic tumor | 9 (41) |
| Diagnosed synchronously | 3 (14) |
One patient with type AB thymoma had acetylcholine receptor antibodies in serum but no clinical evidence for myasthenia gravis. This case has not been included among patients with autoimmune disease.
Data on both MG and other autoimmune disease is not available in 1 case and data on non-MG autoimmune disease alone is not available in 5 cases; these represent 5% of 117 cases.
After a median follow-up period of 38.3 months, there were 10 recurrences and 8 deaths; in half of these recurrent cases, local-regional recurrences were observed and presented primarily as pleural involvement (80%). Improved progression-free survival (PFS) was associated with earlier Masaoka stage (p=0.000058), lower T-stage (p=0.0018), and non-Hispanic ethnicity (p=0.000375). Improved OS was associated with higher tumor lymphocyte component (p=0.018, lower quantile has worse OS), histology subtypes A and B1-2 (p=0.008), and younger age at diagnosis (p=0.017) (Figure S1). The presence of MG or other autoimmune disease was not significantly associated with survival.
The mutational landscape of TETs
Whole exome sequencing was performed on 117 tumor-normal pairs. After filtering one hyper mutated sample and 16 samples with few mutations, 100 pairs were used to identify significantly recurrent somatic mutations. MutSig2CV (Lawrence et al., 2013) identified four significantly mutated genes with q<0.1 (Figure 1). GTF2I was the most significant gene and had a high mutation frequency (39%), particularly in type A & AB thymomas. HRAS, TP53, and NRAS were recurrently mutated at lower frequencies. The vast majority of mutations in HRAS and NRAS occurred at known gain-of-function codons (HRAS: codon 12, 13, 117; NRAS: codon 61). In TP53, all mutations were known pathogenic loss of function mutations. Clonality analysis using PyClone revealed that all four of the significantly mutated genes were predominately clonal (Figure S2A, S2B). This suggests that mutations in GTF2I, HRAS, NRAS, and TP53 are most likely founder mutations occurring at the onset or very early in tumor development. To further assess the potential mutational causes of thymoma, a non-negative matrix factorization (NMF) analysis was used to find enrichment of mutational signatures. As seen in Figure S2C, we observed an enrichment of C>T mutations that occurred within CpG di-nucleotides. This mutational signature is known to be associated with aging, and is congruent with the late-onset (median age= 60) demographic of this disease. A further survey of the data revealed a relatively low mutational burden in the vast majority of samples. When compared to 21 other cancers profiled by the TCGA, TETs have the lowest average tumor mutation burden (TMB) among adult cancers (average of 0.48 mutations per megabase), with only two pediatric cancers having a lower average TMB (rhabdomyosarcoma and medulloblastoma) (Figure 2).
Figure 1.
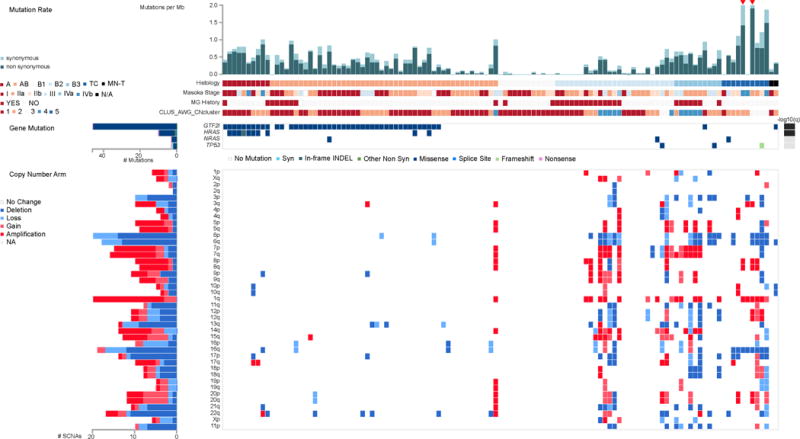
The landscape of DNA mutation in TETs. The matrix in the center of the figure represents individual mutations in TET patients, color-coded by type of mutation, for the significantly mutated genes which include: GTF2I, HRAS, NRAS, and TP53. The rate of synonymous and non-synonymous mutations for each sample is displayed at the top of the matrix. The barplot on the left of the center matrix shows the number of mutations in each gene. The barplot to the right of the matrix displays the q-values for the most significantly mutated genes. The bottom half of the figure depicts the arm level sCNAs for each sample color-coded by the type of CNA. The barplot on the left depicts the number of total sCNAs for each sample. See also Figure S2 and S3.
Figure 2.

Tumor mutation burden (TMB) in TETs (THYM) compared to 21 other cancers profiled by the TCGA. The proportional presence of mutational transitions and transversions by cancer lineage are depicted in the histograms at the bottom of the figure.
Given the low mutational burden seen in TET, we analyzed the data to determine the prevalence of somatic copy number alterations (sCNA). We observed that the majority of patients had none or few sCNAs, whereas samples that harbored events had predominantly large-scale, whole- and arm-level sCNA that occurred predominantly in tumors without recurrently mutated genes (Figure 1, Figure S3A). The burden of arm-level sCNA is enriched in histological type B2 and B3 thymomas, and TC (Wilcoxon rank sum test, p=1.8×10⁻⁹) (Figure S3B-D). Lastly, analyses of RNA-seq data revealed no recurrent fusion events or viral/bacterial components associated with TETs.
Integrated clustering to identify molecular subtypes
Traditionally, histological subtyping of TETs has been challenging because of histologic complexity, inter-observer inconsistency, and lack of prognostic consistency. Integrating the multiple TCGA platforms clustering results, we identified distinct molecular subtypes of TETs by a modification of the cluster-of-clusters-assignments (COCA) approach (Cancer Genome Atlas, 2012b). We utilized the centroids of platform-specific cluster assignments from the sCNV, mRNA, miRNA, DNA methylation, and reverse phase protein array (RPPA) data (Figures S3, S4, and S5) to develop a fuzzy assignment weighted matrix for each sample to each platform subtype centroid (Figure 3A). This matrix was then used as the input to consensus clustering of all samples allowing us to identify integrated molecular subtypes. We identify four molecular subtypes by this approach (Figure 3A) with high relatedness to a blinded pathologic review of WHO histopathologic subtypes (p < 0.0005). Subtype 1 is primarily represented by type B, subtype 2 by type TC, subtype 3 is primarily type AB, and subtype 4 is a mix of types A and AB (Figure 3B). As expected, subtype 1 (mostly type B) was heavily enriched for cases that were associated with MG. We also tested relationships between survival and molecular subtype and demonstrate an inferior overall survival for patients in subtype 2, which is predominantly comprised of thymic carcinoma cases (p <0.01) (Figure 3C). We observed that cases in subtypes 1 and 3 are associated with higher lymphocyte content (p < 0.01), GTF2I mutation is predominantly seen in subtypes 3 and 4, and HRAS mutation is predominantly observed in subtype 4.
Figure 3.
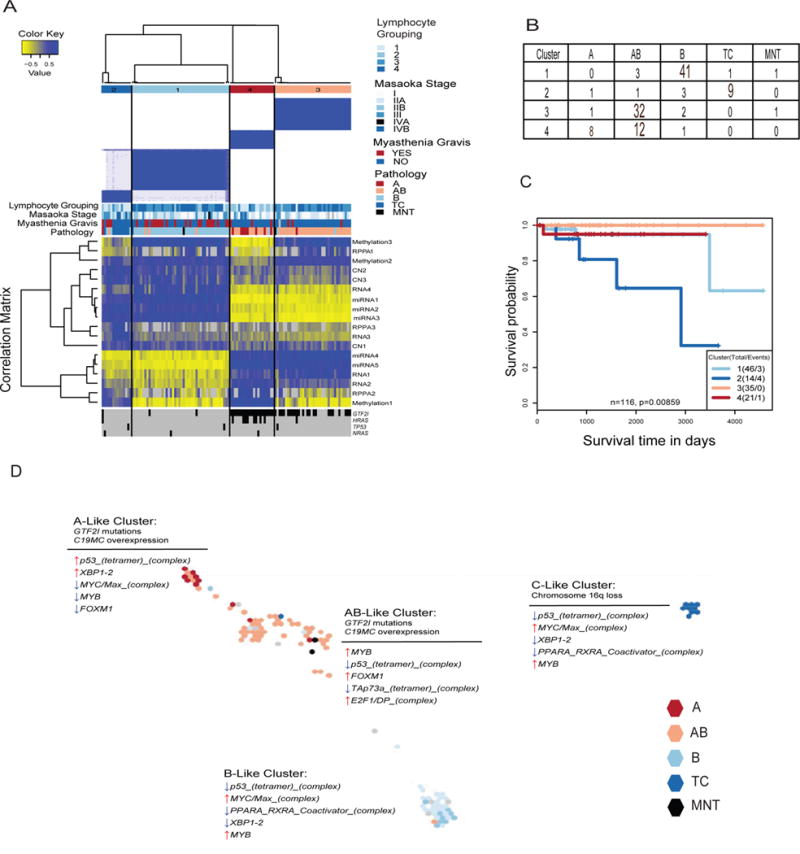
Integrative unsupervised clustering of subtypes from five data platforms. (A) Consensus clustering separated TET samples into four molecular subtypes (n=117). The blue and white heatmap at the top shows sample consensus. The blue and yellow heatmap in the center shows the correlation to each individual data type cluster membership centroid. The bottom displays the presence (black) or absence (gray) of a mutation in one of the four significantly mutated genes. (B) Summary of samples in each cluster by WHO histological subtype. (C) Survival differences across molecular subtypes. Survival data was missing for a sample in cluster 3. (D) Map of samples generated from TumorMap colored by pathology status. Samples are placed according to similarities in their genomic profiles integrating all the platforms. For each cluster, single-platform hallmarks are listed above the thin line, whereas PARADIGM results are listed below the thin line. See also Figures S3, S4, and S5.
We also employed a complementary approach known as TumorMap, which generates a map of samples for interactive exploration, statistical analysis, and data visualization using the Google Maps API. Samples are arranged on a hexagonal grid based on similarity: samples with similar genomic profiles are placed near each other in the map, whereas dissimilar samples are placed further away. Clusters of samples that appear as “islands” in the map indicate groups of samples that share genomic features. This analysis, similar to COCA, revealed 4 distinct molecular clusters that were highly correlated with WHO histological subtype and COCA classifications (Figure 3D). We performed single-platform analyses as well as multi-platform PARADIGM analysis (copy-number + RNA-expression) to identify unique pathways and genomic hallmarks overlayed onto the TumorMap to differentiate the clusters (Figure 3D). Single-platform analyses demonstrated that type A & AB tumors are characterized by GTF2I mutations and overexpression of a large microRNA cluster on chromosome 19q13.42 (Figure 3D, Figure S4B). Type C tumors are characterized by loss of chromosome 16q (Figure 3D). Examination of the PARADIGM findings revealed up-regulation of tumor suppression (p53) and down-regulation of oncogenes (MYC/Max, MYB, and FOXM1) in the A-like cluster (Figure 3D). The opposite is seen in the AB-, B-, and C-like clusters where tumor suppression is down-regulated (p53, and TAp73a), and oncogenes are up-regulated (MYC/Max, MYB, FOXM1, and E2F1) (Figure 3D). These results are in line with the known increased clinical aggressiveness observed in Type B and TC TETs.
GTF2I, a thymoma specific oncogene
Given the predominance of GTF2I mutations in type A & AB thymomas, we utilized our multi-platform data to further characterize GTF2I-mutated tumors. All of the mutations occur at a single codon (L424H), a behavior potentially consistent with an oncogenic mutation (Figure 4A). GTF2I mutations are very rare in cancer with no observed L424H mutations in any other of the ~10,000 tumor samples profiled by the TCGA (Figure 4B). There are occasional (<1%) GTF2I mutations in other cancers and these are exclusively at sites other than L424H. We examined the transcriptional response associated with GTF2I mutations using RNA-seq data analysis (Figure 4C). We identified a set of genes that could predict wildtype and mutant status with 100% specificity and 77% sensitivity. Ten GTF2I mutant samples were misclassified by our predictor as wild type and all had a low variant allele frequency, concordant low tumor purity, and high lymphocyte grade (Figure S2B). The GTF2I mutants had higher expression of genes involved in cell morphogenesis, receptor tyrosine kinase signaling, retinoic acid receptors, neuronal processes, as well as the WNT and SHH signaling pathways. DNA methylation changes that associated with GTF2I mutations were indistinguishable from changes associated with histological type and lymphocyte grade (Figure 4D). RPPA data was available for 42 thymoma samples of types A or AB, of which 32 exhibited GTF2I mutations. After correcting for multiple hypothesis testing, we found 91 proteins to be significantly downregulated in the GTF2I mutant tumors. Pathway analysis demonstrated lower expression of the apoptosis, cell cycle, DNA damage response, hormone receptor signaling, breast hormone signaling, RAS/MAPK, RTK and TSC/mTOR pathways in GTF2I mutant tumors (Figure 4E). Transcript gene expression data for the same proteins used in the RPPA pathway analysis were in good concordance (Figure S5C).
Figure 4.

Multi-platform analysis of the thymoma specific oncogene GTF2I. (A) Lollipop plot of GTF2I demonstrating all the mutations observed in GTF2I. Green boxes mark the GTF2I-like repeat regions. (B) The frequency of somatic mutations in GTF2I in other cancer lineages as compared to TETs. (C) GTF2I mutational gene expression signature in thymoma type A and AB. (D) GTF2I methylation signature in type A and AB. Ten misclassified samples are also reported, based on the RNAseq data. (E) Box plots of pathway scores of GTF2I mutant (red) and wild type (blue) tumors. Box plot display the median value, upper and lower quartiles, the whiskers represent the interquartile range, and outliers are marked with dots. P values are based on the ANOVA test.
Autoimmunity
In agreement with previous observations (Cufi et al., 2014; Travis et al., 2015), thymoma-associated myasthenia gravis (TAMG) was more common in type B than type A and AB thymomas and absent in thymic carcinomas (TC) and micronodular thymomas (MNT). Excluding TC and MNT from further MG-related analyses, an observation was the higher prevalence of aneuploidy among MG+ thymomas (Figure 5A&B, Figure S6A-F). The MG association of aneuploidy among type B thymomas suggests that aneuploidy might not just be a surrogate marker of the more often aneuploid and MG prone type B thymomas (Zettl et al., 2000) but be of pathogenetic relevance for TAMG. The association of aneuploidy with MG was irrespective of whether MG was detected before, at the time, or after thymoma detection (Figure S6G-H). However, which gains and losses are functionally important could not be assessed as none of the observed arm-level and gene-level somatic copy number alterations at 6p, 7, 9, 12, 14 and 21 was significantly enriched in MG+ thymomas (Figure 5C). Furthermore, MG status was neither associated with mutations in any single gene (including GTF2I) nor with any methylation signature or microRNA profile (data not shown).
Figure 5.

Patterns of sCNA and gene expression associated with autoimmunity. (A-B) The prevalence of altered chromosome arms were compared between the positive (MG+) and negative (MG−) status of myasthenia gravis for all samples across histology types (A) and only the subset of samples in B1, B2, B3 histology types (B). For the boxplots: line in the box indicates the median; lower and upper hinges correspond to the first and third quartiles; upper and lower whiskers extend to 1.5 × interquartile range; outlier data are shown as points. (C) Gene-level sCNA frequency landscape for samples with B1, B2, B3 histology, comparing between the history of myasthenia gravis status. The χ2 test of independence was applied to arm-level sCNA for each chromosome arm to determine significantly enriched events between MG+ and MG- status. False discovery rate (q) less than 0.05 (−log q value = 3) are shown for gains (red) and deletions (blue). (D) Log2 normalized gene expression of selected differentially expressed genes. See also Figure S6.
Supervised clustering of all expressed genes revealed no MG-associated gene expression signature in type A/AB/B thymomas. Similarly, genes with a role in immunity and tolerance induction were not differentially expressed, including: MHC class I and II genes; proteases with a role in T cell selection; co-receptors, signaling and checkpoint molecules; apoptosis-related genes; nor expression levels of surrogate genes of T cell subsets. We further could not confirm overexpression of type I interferons and TLR3 in MG+ thymomas as previously reported (Cufi et al., 2014).
Abnormally low expression levels of self-antigens in the thymus underlie autoimmunization against them in many autoimmune diseases (Pugliese et al., 1997; Vafiadis et al., 1997). This prompted analysis of intratumoral transcript levels of the major autoantigens proposed in TAMG: the acetylcholine receptor (AChR) a-subunit (Masuda et al., 2012; Wilisch et al., 1999); striational muscle antigens, titin and ryanodine receptors type I and II (RYR1, RYR2) (Huemer et al., 1992; Mygland et al., 1994); and cytokines (type I interferons, IL17, IL22) (Wolff et al., 2014). Expression levels of the AChR a-subunit gene (CHRNA1) were 3.0-fold higher (FDR=0) in the 32 MG+ than 72 MG- cases, while levels of the other subunit genes were largely unchanged. By contrast, genes with sequence similarities with the CHRNA1, TTN and RYR1/RYR2 were overexpressed in TAMG. Expression levels of the medium size neurofilament, NEFM, that exhibits immunogenic similarities with the AChR a-subunit (Schultz et al., 1999) and titin (Marx et al., 1996; Mencarelli et al., 1991) were 23.8-fold higher in MG+ compared to MG- thymomas and even higher (30-fold) in MG+ type A/AB subset (FDR=0) (Figure 5D). Furthermore, the mainly neuronal RYR3 that shares homology with muscular RYR1 and cardiac RYR2 was upregulated in MG+ thymomas (5.5-fold, FDR=0), with the highest upregulation in the B1/B2/B3 subset (Figure 5D). Taken together, MG in thymoma patients was associated with intratumoral overexpression of genes that show limited (NEFM) or extensive (RYR3) sequence similarity with major autoimmune targets.
Thymic carcinomas
Thymic carcinomas (TC) are a less common subset of TETs that entail a more aggressive clinical course. These tumors histologically resemble common epithelial tumors. To better understand this subset, we performed a focused analysis on the TC samples within our dataset (n=10). Mutational analysis did not identify any recurrently mutated genes in this subset (Figure 6A). When looking at arm-level sCNAs however, we did observe 8 of 10 samples having a loss of Chromosome 16q. This observation has been previously reported in TC (Zettl et al., 2000). Evaluation of the Sanger Gene Census revealed several tumor suppressors in this region, including: CYLD, CBFB, CDH1, CDH11, CTCF, ZFHX3. When comparing the tumor mutation burden (TMB) between TC vs all other thymoma histologies, we observed a significant increase in TMB in TC samples (p=5.7e-05) (Figure 6B). Of distinct interest, a single TC sample exhibited an exceptionally high TMB (21.29 mutations per megabase), and was excluded from the analysis in Figure 6B to avoid skewing the results. However, a further analysis of this sample revealed a characteristic mutation pattern of SNVs most similar to COSMIC signature 6 (cosine similarity = 0.91, http://cancer.sanger.ac.uk/cosmic/signatures) and a significant enrichment of 1-base indels (19% vs 5% in remaining samples), which is associated with microsatellite unstable tumors with defective DNA mismatch repair (Figure 6C). Interestingly, this sample has a pathogenic nonsense mutation (E37*) in MLH1 (https://www.ncbi.nlm.nih.gov/clinvar/variation/89641/) with a concomitant loss of MLH1 mRNA expression (2.6-fold down-regulation against the median). To our knowledge, this is the first report of a microsatellite unstable Thymic Carcinoma.
Figure 6.

Genomic analysis of thymic carcinomas. (A) The landscape of DNA mutation in Type TC tumors. The matrix at the top of the panel depicts clinical information. The center of the panel depicts individual mutations in Type TC tumors, color-coded by type of mutation, for the previously identified significantly mutated genes and focal copy number changes. The bottom half of the panel depicts the arm level sCNAs for each sample color-coded by the type of CNA. The barplot on the left depicts the number of total sCNAs for each sample. (B) A box plot demonstrating the TMB of samples by histology. Lines in the boxes indicate the median; lower and upper hinges correspond to the first and third quartiles; upper and lower whiskers extend to 1.5 × interquartile range; outlier data are shown as points. In order to avoid skewing the results, one hypermutated TC sample and one TC sample with a TMB=0 were excluded. (C) The normalized profile of COSMIC signature 6 (microsatellite unstable tumors) and the SNV mutation spectra of the hyper-mutated TC sample (TCGA-ZB-A966) along 96 base substitution types in tri-nucleotide sequence motifs (top) and the heatmap of cosine similarity between the mutation spectra in TCGA-ZB-A966 and thirty curated COSMIC signatures.
DISCUSSION
The traditional classification of TETs has been based on the histologic appearance of the neoplastic epithelial cells and the relative abundance and type of lymphocytes. The WHO histologic classification has been shown to correlate with clinical outcomes such as tumor stage, clinical behavior and prognosis. However, with the exception of the differential expression of several epithelial and lymphocyte markers, the molecular basis of this classification system has not been completely explored (Travis et al., 2015). Our analyses demonstrate that broad histological subtypes (A, AB, B and TC) strongly associate with multiple classes of aberrations occurring at different levels. Importantly, this demonstrates that A/AB-type, B-type, and C-type tumors are very distinct biological entities and do not represent a histological continuum of diseases. A recent publication by Lee et al. using the publically available TCGA TET dataset also demonstrated separation of TETs into four clusters defined by: GTF2I mutations, T-cell signaling, chromosomal stability, and chromosomal instability (Lee et al., 2017).
GTF2I L424H mutations are unique to TETs and is the most common mutation in this tumor type. This mutation was observed in 100% of the type A and 70% of type AB thymomas. Mutations in GTF2I have been described rarely in other tumor types and are present at different codons. RNA-seq identified higher expression of genes involved in cell morphogenesis, receptor tyrosine kinases, retinoic acid receptors, neuronal processes, as well as the WNT and SHH signaling pathways in the GTF2I mutant tumors. These results are similar to those observed when Gtf2ird1 was knocked out in a mouse model (Corley et al., 2016). GTF2IRD1 is a GTF2I family member, located near GTF2I, which was also upregulated in our dataset in GTF2I mutants. From this study, we also observe clonal, recurrent drivers in HRAS and NRAS. These potent oncogenes may play a role in determining prognosis, to be assessed in future studies with longitudinal follow-up. Also of note, we do not observe any viral etiology as reported before.
Autoimmunity is a hallmark of thymomas, with TAMG occurring in close to 30% of cases (Zekeridou et al., 2016). Thymoma represents the only TCGA tumor type to be analyzed that has a strong association with an autoimmune disease. This analysis demonstrates a significant association of aneuploidy with a cancer-associated autoimmune disease. However, still unknown is why TAMG patients have a limited spectrum of autoantibodies to the AChR, titin, and ryanodine receptors (RYR1, RYR2) (Gilhus et al., 2016; Klein et al., 2013; Zekeridou et al., 2016). In non-thymic cancers, paraneoplastic autoimmune diseases typically emerge from immune processes directed to autoantigens that are common to the cancer and the target organ (Dalmau et al., 1992). By contrast, thymomas do not express bona fide complete AChR, titin and RYR proteins (Marx et al., 1992; Mygland et al., 1995; Siara et al., 1991) but rather proteins with cross-reacting AChR, titin and RYR epitopes (Marx et al., 1996; Mygland et al., 1995; Romi et al., 2002; Schultz et al., 1999). In this study, we confirm the TAMG-associated overexpression of the mid-size neurofilament gene, NEF, that harbors sequences coding for AChR and titin epitopes (Marx et al., 1996; Schultz et al., 1999). We also find that CHRNA1 and RYR3 are over-expressed in MG+ thymomas. With the observed overexpression of autoantigens in neoplastic thymic epithelial cells, defective negative T cell selection as the sole autoimmunizing mechanism is unlikely. In the absence of enrichment of any immunological signature nor evidence of lymphocyte activation in MG+ thymomas, it appears more likely that “false-positive selection” driven by MHC-bound, autoantigen-derived peptides is operative or prevailing in MG+ thymomas to explain the focused anti-muscle autoimmunity in TAMG (Willcox, 1993).
As mentioned previously, the mutational burden in TETs is low, except for some TC samples. This low frequency of actionable mutations may in part explain the paucity of effective molecularly targeted therapies in these tumors (Loehrer et al., 2004; Palmieri et al., 2002; Thomas et al., 2015). Whereas sunitinib (in thymic carcinoma), somatostatin receptor inhibitors (in TET patients expressing somatostatin receptors), everolimus (in thymomas and thymic carcinomas), and anti-IGF1R (in thymomas) have shown some activity, other agents including small-molecule inhibitors of EGFR, KIT, SRC, and cyclin-dependent kinase, histone deacetylase inhibitors, and anti-angiogenic drugs, have had little to no clinical activity (Chen et al., 2014; Scorsetti et al., 2016; Zucali et al., 2017). Even when present, the significantly mutated genes in TETs (GTF2I, HRAS, NRAS, and TP53) are not targetable at this time. An exception is the finding of a microsatellite unstable thymic carcinoma, which may suggest the use of immune checkpoint therapy for these very rare cases (Le et al., 2015). Given the proportion of patients that we observed with no driver mutations or copy number alterations, future use of whole-genome sequencing may reveal structural variation or noncoding drivers of this disease.
In summary, TETs are a rare, histologically and molecularly heterogeneous group of tumors driven by a limited number of genomic events. A hallmark of these tumors is their association with autoimmunity linked through over-expression of muscle epitopes. Incorporation of molecularly defined subtypes for histological diagnosis, as well as drug development based on these genomic data, particularly targeting mutant GTF2I, may have significant clinical implications for patients with TETs.
STAR METHODS
Contact for Reagent and Resource Sharing
Further information and requests for resources and reagents should be directed to and will be facilitated by the Lead Contact, Patrick J. Loehrer (ploehrer@iu.edu).
Experimental Models and Subject Details
Sample Acquisition
The TCGA THYM study accepted samples from patients diagnosed with thymic epithelial tumors. Samples were submitted to the TCGA Biospecimen Core Resource (BCR) from the following: Analytical Biological Services, Inc.; Barretos Cancer Hospital, Brazil; Baylor College of Medicine; Cleveland Clinic; Emory University; Greenville Health System; Hospital Louis Pradel; Indiana University School of Medicine; International Genomics Consortium; MD Anderson Cancer Center; Memorial Sloan-Kettering Cancer Center; Princess Margaret Hospital; Regina Elena National Cancer Institute; Roswell Park Cancer Institute; St. Joseph’s Hospital and Medical Center (Phoenix, AZ); Thoraxklinik Universitätsklinikum Heidelberg; University of Mannheim; University of New Mexico; Valley Hospital; and Yale University. Primary tumor samples and matched germline control DNA (blood or blood components, including DNA extracted at the submitting site; non-neoplastic solid tissue) were obtained from patients who had received no prior treatment for their disease (chemotherapy or radiotherapy). Specimens were shipped overnight to the Biospecimen Core Resource using a cryoport that maintained an average temperature of less than −180°C.
TCGA Project Management has collected necessary human subjects documentation to ensure the project complies with 45-CFR-46 (the “Common Rule”). The program has obtained documentation from every contributing clinical site to verify that IRB approval has been obtained to participate in TCGA. Such documented approval may include one or more of the following:
An IRB-approved protocol with Informed Consent specific to TCGA or a substantially similar program. In the latter case, if the protocol was not TCGA-specific, the clinical site PI provided a further finding from the IRB that the already-approved protocol is sufficient to participate in TCGA.
A TCGA-specific IRB waiver has been granted.
A TCGA-specific letter that the IRB considers one of the exemptions in 45-CFR-46 applicable. The two most common exemptions cited were are that the research fall under 46.102(f)(2) or 46.101(b)(4). Both exempt requirements for informed consent because the received data and material do not contain directly identifiable private information.
A TCGA-specific letter that the IRB does not consider the use of these data and materials to be human subjects research. The was most common for collections in which the donors were deceased.
Cases were classified by the submitting institution in accordance with the World Health Organization (WHO 2004) categories of type A, AB, B1, B2, B3, or TC. Pathology quality control was performed on each tumor specimen from a frozen section slide prepared by the BCR. Hematoxylin and eosin (H&E) stained sections from each sample were subjected to independent pathology review to confirm that the tumor specimen was histologically consistent with the reported thymic epithelial tumor type. The percent tumor nuclei, percent necrosis, and other pathology annotations were also assessed. Tumor samples with ≥60% tumor nuclei (with exception for WHO Type B1 tumors which have high lymphocytic infiltration obviating the ability to have ≥60% tumor nuclei) and ≤20% necrosis were submitted for nucleic acid extraction.
Sample Processing
DNA and RNA were extracted and quality was assessed at the central BCR. RNA and DNA were extracted from tumor using a modification of the DNA/RNA AllPrep kit (Qiagen). The flow-through from the Qiagen DNA column was processed using a mirVana miRNA Isolation Kit (Ambion). This latter step generated RNA preparations that included RNA <200 nt suitable for miRNA analysis. DNA was extracted from blood using the QiaAmp DNA Blood Midi kit (Qiagen).
RNA samples were quantified by measuring Abs260 with a UV spectrophotometer and DNA quantified by PicoGreen assay. DNA specimens were resolved by 1% agarose gel electrophoresis to confirm high molecular weight fragments. A custom Sequenom SNP panel or the AmpFISTR Identifiler (Applied Biosystems) was utilized to verify that tumor DNA and germline DNA representing a case were derived from the same patient. Five hundred nanograms of each tumor and germline DNA were sent to Qiagen (Hilden, Germany) for REPLI-g whole genome amplification using a 100 μg reaction scale. RNA was analyzed via the RNA6000 Nano assay (Agilent) for determination of an RNA Integrity Number (RIN), and only analytes with a RIN≥7.0 were included in this study. Only cases yielding a minimum of 6.9 μg of tumor DNA, 5.15 μg RNA, and 4.9 μg of germline DNA were included in this study.
Sample Qualification
The BCR received tumor samples with germline controls from a total of 200 cases, of which 124 cases qualified and were sent for further genomic analysis. Of the 76 that disqualified, 29 were disqualified during prescreening at the BCR for either prior treatment (22 cases) or a tissue sample that did not meet entry requirements (7 cases). The remaining cases did not pass quality control checks at the BCR, including 18 cases for insufficient tumor nuclei (<60%), 3 for insufficient tumor nuclei and excessive necrosis (>20%), 1 for unacceptable diagnosis during pathology review. Molecular quality control checks of the extracted nucleic acids resulted in the disqualification of 19 cases for insufficient germline DNA yield, 3 for RNA integrity scores of <7.0, 2 for insufficient germline DNA yields and low RIN score, and 1 did not have genotypically matched tumor and germline samples.
Ninety cases had sufficient residual tumor tissue following extraction of nucleic acids for proteomics assays. A 10 to 20 mg portion of snap-frozen tissue adjacent to the tissue used for molecular sequencing and characterization was submitted to MD Anderson for reverse phase protein array (RPPA) analysis.
Clinical Data
The clinical data collected included patient age, sex, race, ethnicity, height, weight, tumor anatomic location, World Health Organization (WHO 2004) histologic classification, Masaoka staging, history of myasthenia gravis, history of prior cancers, synchronous cancers and subsequent cancers including distant metastasis or second primary cancers, date and kind of treatments, vital status, date of death, and date of last contact.
Methods Details
Expert Pathology Committee Histologic Evaluation
A panel of 8 histopathologists with expertise in thymic pathology evaluated digital slides of the 127 thymic epithelial tumors that qualified for this study. These images were made available by Biospecimen Core Resource’s Virtual Imaging for Pathology, Education & Research application (VIPER). Slides consisted of H&E stained frozen sections of the cryomaterial that was used for the molecular studies, and H&E stained sections from the formalin-fixed paraffin embedded tumours scanned at 400× magnification. Histomorphologic features evaluated included the histotype according to the 2015 version of the WHO classification of thymic tumors (Travis et al., 2015); the estimated tumour content per area and proportion of lymphocytes per all cells in a given section (in 10% increments); the quality of tissue preservation, and the identity or (rarely) discrepancy between the paraffin and frozen section in each case. If available, immunohistochemical findings were retrieved from pathology reports and used to refine tumor classification. Tumor stage according to the Masaoka-Koga system (Detterbeck et al., 2011b) and the provisional TNM system proposed by ITMIG (Detterbeck et al., 2014) were checked on the basis of the pathology reports. Further group discussion and reviews allowed for consensus determination on the above histological and staging features.
DNA Methylation
Sample Preparation and Hybridization
The Illumina Infinium HM450 array (Bibikova et al., 2011) was used to assay 117 TCGA TET samples using standard protocols. Briefly, genomic DNA (1000 ng) for each sample was treated with sodium bisulfite, recovered using the Zymo EZ DNA methylation kit (Zymo Research, Irvine, CA) according to the manufacturer’s specifications and eluted in 18 ul volume. After passing quality control, bisulfite-converted DNA samples were whole genome amplified followed by enzymatic fragmentation and hybridized overnight to BeadChips followed by a locus-specific base extension with labeled nucleotides (cy3 and cy5). BeadArrays were scanned and the raw data were imported into custom programs in R computing language for pre-processing and calculation of DNA methylation beta value for each probe and sample. Quality control and probe exclusions were done using standard protocols as previously described in (Cancer Genome Atlas Research, 2014a).
Clustering Analysis
We carried out an unsupervised consensus clustering as implemented in the Bioconductor package ConsensusClusterPlus (Wilkerson and Hayes, 2010), with Euclidean distance and partitioning around medoids (PAM). Consensus clustering was applied to the DNA methylation data from the entire cohort, using the most variable 1% of CpG probes.
Epigenetically Silenced Genes
To identify epigenetically silenced genes we applied method previously described in (Cancer Genome Atlas Research, 2014b). Specifically, we first identify promotor CpG sites that meet several criteria: (a) at least 90% of normal samples should be clearly unmethylated (β <= 0.1) at that site, (b) at least 5% of tumor samples should clearly methylated (β >= 0.3) and (c) a t-test comparing expression levels in methylated (β >= 0.3) and unmethylated tumor samples (β < 0.1) should be significant at an FDR < 0.01. A gene is defined as epigenetically silenced if at least 25% of the promotor CpG sites meet all of these criteria. A total of 120 normal samples were used for this analysis including 10 each drawn at random from the 12 TCGA projects that include normal samples, such lung adenocarcinoma (Cancer Genome Atlas Research, 2014a), breast invasive carcinoma (Cancer Genome Atlas, 2012b), colon adenocarcinoma (Cancer Genome Atlas, 2012a), and others.
Estimation of Leukocyte Fraction
We estimated leukocyte fraction using an approach described in Carter et al (Carter et al., 2012). As a source of leukocyte DNA methylation level, we used DNA methylation data of peripheral blood mononuclear cells (PBMC) from six healthy donors (Reinius et al., 2012) (GSE35069).
Additional Analyses
Fisher’s exact test was used to test for associations of DNA methylation clusters with mRNA expression clusters and significantly mutated genes. Analyses described above as well as plots including heat maps and scatterplots were carried out in R using standard methods and customized routines.
miRNA
microRNA Libraries and Sequencing
We generated microRNA sequence (miRNA-seq) data for 117 tumor samples using methods described previously except that 1ug of total RNA (at 250ng/uL) was used as input instead of messenger RNA-depleted RNA (Chu et al., 2016). Briefly, reads were aligned to the GRCh37/hg19 reference human genome, and read count abundance was annotated with miRBase v16 stemloops and mature strands. While the read counts included only exact-match read alignments,.bam files at CGHub (cghub.ucsc.edu) (Wilks et al., 2014) include all sequence reads. We used miRBase v20 to assign 5p and 3p mature strand (miR) names to MIMAT accession IDs.
Unsupervised Clustering of miRNA Mature Strands
To identify subtypes within the THYM cohort we used hierarchical clustering with pheatmap v1.0.2 in R. The input was a reads-per-million (RPM) data matrix for the 303 (top 25%) miRBase v16 5p or 3p mature strands that had the largest variances across the cohort. We transformed each row of the matrix by log10(RPM + 1), then used pheatmap to scale the rows. We used Ward.D2 for the clustering method with Pearson correlation and Euclidean as the distance measures for clustering the columns and rows respectively.
Differentially Abundant microRNAs
We identified miRs that were differentially abundant using unpaired two-class SAM analyses (samr v2.0) with an RPM input matrix and an FDR threshold of 0.05 (Li and Tibshirani, 2013).
miR Targeting
We assessed potential miRNA-gene targeting for all tumor samples by calculating miR-mRNA Spearman correlations with MatrixEQTL v2.1.1 (Shabalin, 2012), using gene-level normalized abundance RNA-seq (RSEM) data. We calculated correlations with a P value threshold of 0.05, then filtered the anticorrelations at FDR<0.05. We extracted miR-gene pairs that corresponded to functional validation publications (luciferase reporter, qPCR, Western blot) reported by miRTarBase V6.0 (Hsu et al., 2014). We used TargetScan 7.0 for predicted targeting (Agarwal et al., 2015).
RNAseq
RNA Library Construction, Sequencing, and Analysis
One μg of total RNA was converted to mRNA libraries using the lllumina mRNA TruSeq kit (RS-122-2001 or RS-122-2002) following the manufacturer’s directions. Libraries were sequenced 48×7×48bp on the Illumina HiSeq 2000 as previously described (Cancer Genome Atlas Research, 2012). FASTQ files were generated by CASAVA. RNA reads were aligned to the hg19 genome assembly using MapSplice 0.7.4 (Wang et al., 2010b). Gene expression was quantified for the transcript models corresponding to the TCGA GAF2.1 (http://tcga-data.nci.nih.gov/docs/GAF/GAF.hg19.June2011.bundle/outputs/TCGA.hg19.June2011.gaf), using RSEM (Li and Dewey, 2011) and normalized within-sample to a fixed upper quartile. For further details on this processing, refer to Description file at the DCC data portal under the V2_MapSpliceRSEM workflow (https://tcga-data.nci.nih.gov/tcgafiles/ftp_auth/distro_ftpusers/anonymous/tumor/thym/cgcc/unc.edu/illumina hiseq_rnaseqv2/rnaseqv2/unc.edu_THYM.IlluminaHiSeq_RNASeqV2.mage-tab.1.0.0/DESCRIPTION.txt) or our alignment pipeline summary at CGHUB (https://cghub.ucsc.edu/docs/tcga/UNC_mRNAseq_summary.pdf).
Quantification of genes, transcripts, exons and junctions can be found at the TCGA Data Portal (https://tcga-data.nci.nih.gov/tcga/).
Unsupervised Clustering
A set of genes that were both highly expressed and variably expressed was identified and used for clustering. After restricting to genes with at least 75% non-zero RSEM values, the genes with the 1000 highest median absolute deviation (MAD) values were chosen. RSEM values identically equal to zero were replaced into smallest non-zero value. Then a log2 transformation was applied and the values were median centered by gene and divided by MAD expression of each gene. Consensus clustering was applied using the ConsensusClusterPlus R package (Wilkerson and Hayes, 2010). Output from ConsensusClusterPlus along with gene expression heatmaps, principal components analysis, and silhouette plots suggested the presence of four expression subtypes: class one (n = 48), class two (n = 18), class three (n = 12), and class four (n = 46). The statistical significance of differences in overall survival times between the expression subtypes was assessed using the log rank test, as implemented in the survival R package. R 3.0.1 (R Core Team) was used to perform all statistical analyses and create all figures.
Differential Expression Analysis
The SAMR R package (Tusher et al., 2001) was used to identify differentially expressed genes between different expression subtypes and groups of patients defined by clinical characteristics using 1000 permutations. We then used the DAVID annotation database (Huang et al., 2007a; Huang et al., 2007b) to identify enriched pathways.
Supervised Clustering
The ClaNC R package (Dabney, 2006) was used to identify genes whose expression patterns characterize the RNA subtypes.
Gene Fusion Detection
In addition to quantifying gene expression, RNA sequencing can detect structural variants, including alternate splicing, intra-chromosomal fusions, and inter-chromosomal fusions. Two algorithms were used to identify gene fusions: AccuFusion (In-house tool), MapSplice (Wang et al., 2010b).
Virus Detection
In addition to quantifying gene expression, RNA sequencing can detect viral transcripts using virus database including HPyV 6, 7, 9, 10, 12 and MCPyV. An algorithm was used to identify viral transcripts: VirusSeq (Chen et al., 2013).
RPPA
RPPA Experiments and Data Processing
Protein was extracted using RPPA lysis buffer (1% Triton X-100, 50 mmol/L Hepes (pH 7.4), 150 mmol/L NaCl, 1.5 mmol/L MgCl2, 1 mmol/L EGTA, 100 mmol/L NaF, 10 mmol/L NaPPi, 10% glycerol, 1 mmol/L phenylmethylsulfonyl fluoride, 1 mmol/L Na3VO4, and aprotinin 10 ug/mL) from human tumors and RPPA was performed as described previously (Hennessy et al., 2007; Hu et al., 2007; Liang et al., 2007; Tibes et al., 2006). Lysis buffer was used to lyse frozen tumors by Precellys homogenization. Tumor lysates were adjusted to 1 μg/μL concentration as assessed by bicinchoninic acid assay (BCA) and boiled with 1% SDS. Tumor lysates were manually serial diluted in two-fold of 5 dilutions with lysis buffer. An Aushon Biosystems 2470 arrayer (Burlington, MA) printed 1,056 samples on nitrocellulose-coated slides (Grace Bio-Labs). Slides were probed with 218 validated primary antibodies followed by corresponding secondary antibodies (Goat anti-Rabbit IgG, Goat anti-Mouse IgG or Rabbit anti-Goat IgG). Signal was captured using a DakoCytomation-catalyzed system and DAB colorimetric reaction. Slides were scanned in a CanoScan 9000F. Spot intensities were analyzed and quantified using Array-Pro Analyzer (Media Cybernetics Washington DC) to generate spot signal intensities (Level 1 data). The software SuperCurveGUI (Hu et al., 2007), available at http://bioinformatics.mdanderson.org/Software/supercurve/, was used to estimate the EC50 values of the proteins in each dilution series (in log2 scale). Briefly, a fitted curve ("supercurve") was plotted with the signal intensities on the Y-axis and the relative log2 concentration of each protein on the X-axis using the non-parametric, monotone increasing B-spline model (Tibes et al., 2006). During the process, the raw spot intensity data were adjusted to correct spatial bias before model fitting. A QC metric was returned for each slide to help determine the quality of the slide: if the score was less than 0.8 on a 0-1 scale, the slide was dropped. In most cases, the staining was repeated to obtain a high quality score. If more than one slide was stained for an antibody, the slide with the highest QC score was used for analysis (Level 2 data). Protein measurements were corrected for loading as described (Gonzalez-Angulo et al., 2011; Hu et al., 2007) using median centering across antibodies (level 3 data). In total, 218 antibodies and 85 TET (THYM) samples were used for the analysis. Final selection of antibodies was also driven by the availability of high quality antibodies that consistently pass a strict validation process as previously described (Hennessy et al., 2010). These antibodies are assessed for specificity, quantification and sensitivity (dynamic range) in their application for protein extracts from cultured cells or tumor tissue. Antibodies are labeled as validated and used with caution based on degree of validation by criteria previously described (Hennessy et al., 2010).
RPPA arrays were quantitated and processed (including normalization and load controlling) as described previously, using MicroVigene (VigeneTech, Inc., Carlisle, MA) and the R package SuperCurve (version-1.3), available at http://bioinformatics.mdanderson.org/OOMPA (Hu et al., 2007; Tibes et al., 2006). Raw data (level 1), SuperCurve nonparameteric model fitting on a single array (level 2), and loading corrected data (level 3) were deposited at the DCC.
Data Normalization
We performed median centering across all the antibodies for each sample to correct for sample loading differences. Those differences arise because protein concentrations are not uniformly distributed per unit volume. That may be due to several factors, such as differences in protein concentrations of large and small cells, differences in the amount of proteins per cell, or heterogeneity of the cells comprising the samples. By observing the expression levels across many different proteins in a sample, we can estimate differences in the total amount of protein in that sample vs. other samples. Subtracting the median protein expression level forces the median value to become zero, allowing us to compare protein expressions across samples. Those data were used for the analysis of THYM samples.
Consensus Clustering
We used consensus clustering to cluster the THYM samples (Fig. 7A). Pearson correlation was used as distance metric and Ward was used as a linkage algorithm for the clustering. A total of 85 samples and 218 antibodies were used in the analysis. We identified four robust sample clusters, with most of the “AB” pathology subtype samples clustering together in cluster 4. The RPPA clusters showed statistically significant association with pathology subtype and lymphocyte grade, with most of the grade 4 samples falling in cluster 3. To illustrate the role of cell signaling and other pathways in THYM, we calculated ten pathway scores based on a previously described method and grouped them by the RPPA clusters (Fig. 7B) (Akbani et al., 2014). The analysis showed that cluster 2 had significantly low cell cycle, apoptosis, TSC/mTOR and core reactive pathway activity. On the other hand, cluster 1 had high EMT activity, whereas clusters 3 and 4 showed significantly high cell cycle, hormone signaling and TSC/mTOR pathway activity, along with low RAS/MAPK and breast reactive activity.
Cluster of Cluster Analysis
Cluster of Cluster Analysis (CoCA) was performed using data from methylation, miRNA, mRNA, copy number and RPPA platforms using a fuzzy clustering approach. Data matrix that was used to do platform specific subtype clustering and platform specific cluster assignments were used to generate centroids for each cluster. Membership of each sample to each cluster was then obtained by correlation of each sample values to centroid of cluster. This correlation matrix was used for consensus clustering. Consensus clustering was performed using R package ConsensusClusterPlus_1.24.01, with 90% resampling for 1000 iterations of hierarchical clustering based on pearson correlation distance (Monti et al., 2003; Wilkerson and Hayes, 2010). Kaplan Meier survival estimates for CoCA clusters were estimated using R package survival_2.38-3. Fisher exact test was used for examining association of CoCA cluster to clinical variables.
Microbiome
Our microbial detection pipeline is based on BioBloomTools (BBT, v1.2.4.b1), which is a Bloom filter-based method for rapidly classifying RNA-seq or DNA-seq read sequences (Chu et al., 2014). We generated 43 filters from ’complete’ NCBI genome reference sequences of bacteria, viruses, fungi and protozoa, using 25-bp k-mers and a false positive rate of 0.02. We ran BBT in paired-end mode with a sliding window to screen FASTQ files from 117 RNA-seq libraries (49-bp PE reads), and 117 matched tumor/normal whole exome libraries (49-bp PE reads). In a single-pass scan for each library, BBT categorized each read pair as matching the human filter, matching a unique microbial filter, matching more than one filter (multi-match), or matching neither human nor microbe (no-match). For each filter, we then calculated a reads-per-million (RPM) abundance metric as:
To detect genomic integration of specific viruses we performed de novo assembly of RNA-seq and DNA-seq sequence data with ABySS v1.3.4 (Simpson et al., 2009), using for each library the reads classified by BBT as human, the virus, multi-match and no match. We then merged the k-mer assemblies for each library with Trans-ABySS v1.4.8 (Robertson et al., 2010) to generate the working contig set. We re-ran BBT on these contigs, applying only human and specific virus filters, identifying contigs that matched to both filters. We identified any integration breakpoints in such multi-matched contigs by using BLAT v34 (Kent, 2002) to align each contig to the human GRCh37/hg19 reference sequence, and to virus reference sequences. We retained contig alignments in which: a) the aligned human and viral sequences summed to at least 90% of the contig length, and b) the human and viral aligned overlapped by less than 50%. Human breakpoint coordinates were annotated against RefSeq and UCSC (Kuhn et al., 2013) gene annotations (downloaded from the UCSC genome browser on 30-Jun-2013). Breakpoints that had at least 3 spanning mate-pair reads or 5 flanking mate-pair reads were considered potential integration sites.
PARADIGM
PARADIGM is a computational model that identifies significantly altered pathways from an integrated analysis of copy number and gene expression of a patient or sample (Vaske et al., 2010). This integrated analysis is performed in the context of pathway entities. These entities comprise biological molecules, small molecules, complexes, or abstract concepts that represent cellular processes such as apoptosis or endothelial cell migration (Schaefer et al., 2009). The PARADIGM graphical model represents such entities as nodes and generates an integrated pathway activity (IPA) for each entity of a patient. A gene IPA score, for example, refers to the final active protein inferred from copy number, expression, and signaling from other genes in the pathway. Here we use PARADIGM to generate IPA scores for each of the 117 TET patients.
We clustered PARADIGM IPAs using the UCSC consensus clustering RData script v.1.0.0 available though medbook.ucsc.edu. These PARADIGM inputs were merged real IPAs to be clustered by samples (patients). The clustering conditions used a k-means algorithm, average final linkage, and 500 repetitions with a k-max of 10. Clustered heatmaps of patient IPAs were graphed with attribute color assignments. As a quality check, we computed a silhouette score for each k to measure goodness of fit for each patient in a cluster. The silhouette score used Euclidian distance to compute both similarity of a patient with other patients in a clusters, and separation of patients in different clusters (Rousseeuw, 1987). To perform significance testing on cluster attribute enrichment, we applied Benjamini-Hochberg p value correction (BH FDR) on Fisher Exact p values to compute False Discovery Rate (FDR). This produced a ranked list of clinical attributes based on p value per cluster, annotated with FDR.
TumorMap
TumorMap is a tool that generates a map of cancer samples for interactive exploration, statistical analysis, and data overlay visualization. These visualizations, which employ the Google Maps API, arrange samples on a hexagonal 2-dimensional grid based on a sample-by-sample similarity matrix. Samples can be annotated according to different attributes to allow the user to explore new associations in clinical data. Maps can be from a single platform or multiple merged platforms. This later approach uses Bivariate Standardization similarity space Transformation (BST), adapted from Faith et al’s CLR, to integrate multiple similarity matrices into a single matrix of sample-sample associations (Faith et al., 2007). Here we use an integrative approach to reveal the relationship between the molecular and clinical attributes of TET patients based on a multi-platform co-cluster analysis.
We first created a sparse sample-by-sample similarity matrix from each of the platform clusters. This similarity matrix comprises the top 10 highest ranked Spearman correlations per sample as implemented by the sklearn.metrics.pairwise submodule (Pedregosa et al., 2011). We performed this rank on each of the platform clusters, and combined them with the BST pipeline. The BST pipeline averages Z scores of each sample-sample similarity between platform matrices, resulting in a single similarity matrix. This single matrix was inputted to the physics-based layout engine DrL, an open source version of VxOrd created by Sandia National Labs (Martin et al., 2011). DrL treats sample similarities as spring constants and searches for a spatial configuration among samples that minimizes system tension. This ultimate spatial configuration was mapped in 2D using TumorMap v0.5, available on medbook.ucsc.edu, and colored samples by clinical attribute.
Multi-Center Mutation Calling
UCSC
Single nucleotide somatic mutations were identified by RADIA (RNA AND DNA Integrated Analysis), a method that combines the patient matched normal and tumor DNA whole exome sequencing (DNA-WES) with the tumor RNA sequencing (RNA-Seq) for somatic mutation detection (Radenbaugh et al., 2014) (software available at: https://github.com/aradenbaugh/radia/). The inclusion of the RNA-Seq data in RADIA increases the power to detect somatic mutations, especially at low DNA allelic frequencies. By integrating the DNA and RNA, mutations that would be missed by traditional mutation calling algorithms that only examine the DNA can be rescued back. RADIA classifies somatic mutations into 3 categories depending on the read support from the DNA and RNA: 1) DNA calls – mutations that had high support in the DNA, 2) RNA Confirmation calls – mutations that had high support in both the DNA and RNA, 3) RNA Rescue calls – mutations that had high support in the RNA and weak support in the DNA. Here RADIA identified 7,363 DNA mutations, 718 RNA Confirmation mutations, and 369 RNA Rescue mutations.
Washington University − Exomes and Validation
Exome Capture
Illumina libraries were constructed as described previously. Unique, 6bp molecular barcodes were used to identify individual samples. Prior to exome capture, individual libraries were pooled. Pools were captured using Nimblegen SeqCap EZ Human Exome Library v3.0 combined with additional 120-mer IDT custom probes, targeting cancer-related viruses. Pools were sequenced in multiple lanes of Illumina HiSeq 2000 flowcells to achieve a minimum coverage of 20× across 80% of coding target exons.
Custom Capture Validation of Somatic Mutations
A second, independent set of Tumor and Normal Illumina libraries were generated from the original aliquots. These were enriched by performing hybrid capture using Roche Nimblegen SeqCap EZ custom capture oligos. When available, genomic DNA was utilized for library construction starting material, alternatively Qiagen WGA amplified DNA was used when insufficient material was available. Each sample library received unique, dual molecular barcodes prior to pooling. The target regions for somatic indels and point mutations were defined as a 100bp region surrounding the mutation site. Probes designed with >5 mismatches were discarded. Additional 120-mer IDT probes targeting cancer-related viruses were combined with SeqCap custom probes prior to capture. Target and probe bed files are available at http://genome.wustl.edu/pub/custom_capture/
Read Alignment for Exome and Custom Capture
Validation Each lane or sub-lane of data was aligned with bwa v0.5.9 (Li and Durbin, 2009). to GRCh37-lite + accessioned target viruses (ftp://genome.wustl.edu/pub/reference/GRCh37-lite_WUGSC_variant_2/) Defaults are used in both bwa aln and bwa sampe (or bwa samse if appropriate) with the exception that for bwa aln four threads are utilized (−t 4) and bwa’s built in quality-based read trimming (-q 5). ReadGroup entries are added to resulting SAM files using gmt sam add-read-group-tag. This SAM file is then converted to a BAM file using Samtools v0.1.16, name sorted (samtools sort -n), mate pairings assigned (samtools fixmate), resorted by position (samtools sort), and indexed using gmt sam index-bam. Read Duplication Marking and Merging
Reads from multiple lanes, but the same sequencing library are merged, if necessary, using Picard v1.46 MergeSamFiles and duplicates are then marked per library using Picard MarkDuplicates v1.46. Lastly, each per-library BAM with duplicates marked is merged together to generate a single BAM file for the sample. For MergeSamFiles we run with SORT_ORDER=coordinate and MERGE_SEQUENCE_DICTIONARIES=true. For both tools, ASSUME_SORTED=true and VALIDATION_STRINGENCY=SILENT are specified. All other parameters are set to defaults. Samtools flagstat is run on each BAM file generated (per-lane, per-library, and final merged).
SNV Callers
We detected somatic SNVs using Samtools (Li et al., 2009) v0.1.16 (samtools pileup –cv -A -B), SomaticSniper (Larson et al., 2012) v1.0.4 (bam-somaticsniper -F vcf -G -L -q 1 -Q 15), Strelka (Saunders et al., 2012) v0.4.6.2 (with default parameters except for setting isSkipDepthFilters = 1), and VarScan (Koboldt et al., 2012) v2.2.6 (–min-coverage 3 –min-var-freq 0.08 –p value 0.10 –somatic-p value 0.05 –strand-filter 1).
SNV Caller combination and filtering
First, Samtools calls were retained if they met all of the following rules inspired by MAQ:
Site is greater than 10bp from a predicted indel of quality 50 or greater.
The maximum mapping quality at the site is ≥ 40.
Fewer than 3 SNV calls in a 10 bp window around the site.
Site is covered by at least 3 reads and less than 1,000,000,000 reads.
Consensus quality ≥ 20.
SNP quality ≥ 20.
After these filters were applied, Samtools and SomaticSniper calls were unioned using joinx v1.9 (https://github.com/genome/joinx; joinx sort –stable –unique). The resulting merged set of variants were additionally filtered to remove likely false positives2,4. We used bam-readcount v0.4 (https://github.com/genome/bam-readcount) with a minimum base quality of 15 (-b 15) to generate metrics and retained sites based on the following requirements:
Minimum variant base frequency at the site of 5%.
Percent of reads supporting the variant on the plus strand ≥ 1% and ≤ 99% (variants failing these criteria are filtered only if the reads supporting the reference do not show a similar bias).
Minimum variant base count of 4.
Variant falls within the middle 90% of the aligned portion of the read.
Maximum difference between the quality sum of mismatching bases in reads supporting the variant and reads supporting the reference of 50.
Maximum mapping quality difference between reads supporting the variant and reads supporting the reference of 30.
Maximum difference in aligned read length between reads supporting the variant base and reads supporting the reference base of 25.
Minimum average distance to the effective 3’ end§ of the read for variant supporting reads of 20% of the sequenced read length.
Maximum length of a flanking homopolymer run of the variant base of 5.
After this filtering, the SomaticSniper/Samtools calls were additionally filtered to high confidence variants by retaining only those sites where:
The average mapping quality of reads supporting the variant allele was ≥ 40
The SomaticScore of the call was ≥ 40.
VarScan calls were retained if they met the following criteria:
VarScan reported a somatic p value ≤ 0.07.
VarScan reported a normal frequency ≤ 5%.
VarScan reported a tumor frequency ≥ 10%.
VarScan reported ≥ 2 reads supporting the variant.
VarScan variants passing these criteria were then filtered for likely false positives using bam-readcount v0.4 and identical criteria as described above for SomaticSniper. Fully filtered calls as described above for SomaticSniper and VarScan were then merged with calls from Strelka using joinx v1.9 (joinx sort –stable –unique) to generate the final callset.
Indel Callers
We detected indels using the GATK (McKenna et al., 2010) 1.0.5336 (-T IndelGenotyperV2 –somatic –window_size 300 -et NO_ET), retaining only those which were called as Somatic, Pindel (Ye et al., 2009) v0.2.2 (-w 10; with a config file generated to pass both tumor and normal BAM files set to an insert size of 400), Strelka (Saunders et al., 2012) v0.4.6.2 (with default parameters except for setting isSkipDepthFilters = 1), and VarScan (Koboldt et al., 2012) v2.2.6 (–min-coverage 3 –min-var-freq 0.08 –p value 0.10 –somatic-p value 0.05 –strand-filter 1). Indel Caller Filtering and Combination
Pindel calls were retained if they had:
No support in the normal data.
Had more reads reported by Pindel than reported by Samtools at the indel position or if the number of supporting reads from Pindel was ≥ 8% of the total depth at the position reported by Samtools.
Samtools reported a depth less than 10 at the region and Pindel reported more indel supporting reads than reads mapped with gaps at the site of the call.
A Fisher’s exact test p value ≤ 0.15 was returned when comparing the number of reads with gapped alignments versus reads without in the normal to the tumor.
VarScan indel calls were retained if they met the following criteria:
VarScan reported a somatic p value ≤ 0.07.
VarScan reported a normal frequency ≤ 5%.
VarScan reported a tumor frequency ≥ 10%.
VarScan reported ≥ 2 reads supporting the variant.
Broad Institute
Identification of Somatic Mutations
Alignments were first subjected to quality control to avoid mix-ups between tumor and normal samples, as well as cross-contamination between tumor samples using ContEst (Cibulskis et al., 2011). We used the MuTect algorithm version 1.1.62 to generate somatic mutation calls, which were subsequently filtered to remove any spurious calls due to shearing-induced generation of 8-oxoguanine (Costello et al., 2013). Indels were identified using the IndelLocator algorithm as previously described (Costello et al., 2013). Details and tools are available at www.broadinstitute.org/cancer/cga.
Mutation Annotation
Functional annotation of mutations was performed with Oncotator (Ramos et al., 2015) (http://www.broadinstitute.org/cancer/cga/oncotator) using Gencode V18.
BC Cancer Agency
Strelka Variant Caller
Strelka (Saunders et al., 2012) (v1.0.6) was used to identify somatic single nucleotide variants, and short insertions and deletions from the TCGA THYM exome dataset. All parameters were set to defaults, with the exception of “isSkipDepthFilters”, which was set to 1 in order to skip depth filtration given the higher coverage in exome datasets. 123 pairs of libraries were analyzed. When a blood sample was available, it served as the matched normal specimen; otherwise, the matched normal tissue was used. The variants were subsequently annotated using SnpEff (Cingolani et al., 2012), and the COSMIC (v61) (Forbes et al., 2010) and dbSNP (v137) (Smigielski et al., 2000) databases.
Baylor College of Medicine
Multicenter Mutation Calling
At BCM, mutations in BAM files were detected as follows: Atlas-SNP (Bang et al., 2010) of the Atlas2 Suite (Challis et al., 2012) was run to list all variants found in multiple reads at a single locus; and variants were annotated with dbSNP by ANNOVAR (Wang et al., 2010a) and COSMIC (Catalogue Of Somatic Mutations In Cancer). The variants were further filtered to remove all those observed fewer than 4 times or were present in less than 0.04 of the reads. Normal variant ratio must be less than 1% of tumor variant ratio. At least one variant had to be mapping quality of Q20 or better, and the variant had to lie in the central portion of the read. In addition, at least one variant must appear in both forward and reverse orientations. COSMIC variants were exempted from above filters. Insertion or deletion variants (“indels”) were discovered by similar processing except that the initial processing was with Atlas-Indel of the Atlas2 Suite, and indels must have been observed in 10 of the reads with ratio of 0.15. All the variants were compared to a population of normal genomes and any matching variant was removed; then the file were further filtered by removing variants with normal sample coverage less than 2 or tumor variant coverage less than 0.05 or genes with greater than 2 variants for the same sample.
Copy number analysis
SNP-based Copy Number Analysis
DNA from each tumour or germline sample was hybridized to Affymetrix SNP 6.0 arrays using protocols at the Genome Analysis Platform of the Broad Institute as previously described (McCarroll et al., 2008). Briefly, from raw. CEL files, Birdseed was used to infer a preliminary copy-number at each probe locus (Korn et al., 2008). For each tumour, genome-wide copy number estimates were refined using tangent normalization, in which tumour signal intensities are divided by signal intensities from the linear combination of all normal samples that are most similar to the tumour (Cancer Genome Atlas Research, 2011). This linear combination of normal samples tends to match the noise profile of the tumour better than any set of individual normal samples, thereby reducing the contribution of noise to the final copy-number profile. Circular Binary Segmentation (CBS) (Olshen et al., 2004) was used to segment patient-level normalized copy-number estimates. As part of this process of copy-number assessment and segmentation, regions corresponding to germline copy-number alterations were removed by applying filters generated from either the TCGA germline samples from the previous TCGA studies or from samples in this cohort.
ABSOLUTE
Allelic copy number, whole genome doubling, and purity (tumour cellularity) and ploidy estimates were calculated using the ABSOLUTE algorithm (Carter et al., 2012). ABSOLUTE integrates somatic SNV (SSNV) mutations in its analysis; the input mutations were analyzed using MuTect (Cibulskis et al., 2013) and can be obtained from gdac.broadinstitute.org. Because many TET samples contained few or no somatic copy number alterations (SCNA), the purity prediction may be less reliable due to estimation from only mutations.
PyClone and TITAN
We used PyClone (Roth et al., 2014) v0.12.9 to assess the clonality of validated mutations with deeper coverage of SSNV loci; only 88/117 samples that had at least 2 mutations with > 50 read depth were analyzed. For these 88 samples, PyClone used input SCNA events analyzed by TITAN (Ha et al., 2014) v1.5.8 (from whole exome sequencing). All parameters for both PyClone and TITAN were initialized to the defaults. The tumor content was initialized to 1.0, such that the clonally dominant cluster (SSNVs observed to be present in the highest fraction of tumour cells) will be the new, estimated purity. To do this, we identified the cluster having the largest average cellular prevalence across the mean of the posterior distribution for each mutation within the cluster. For samples that had less than 5% of the genome altered by SCNA, we reassigned the purity to the PyClone average cellular prevalence as the new purity; otherwise, the ABSOLUTE purity was used.
Next, we corrected the CBS segments for each patient using the estimated purity. This correction allows the amplitude of the SCNA segments to be comparable on the same scale and extenuates the signals for samples with lower purities. Therefore, application of a uniform threshold (e.g. +/−0.3 log2 copy ratio) to determine deletions and gains (as is done by GISTIC) is now more appropriate. To do this, we applied the following correction to adjust the log2 copy ratio l for segment t to obtain the purity-ploidy-corrected log2 copy ratio,
GISTIC
Using these purity-ploidy-corrected copy ratios of the segmented copy number profiles for tumour and matched control DNAs, we applied Ziggurat Deconstruction, an algorithm that parsimoniously assigns a length and amplitude to the set of inferred copy-number changes underlying each segmented copy number profile (Mermel et al., 2011). Then, we determined statistically significant focal copy number alterations using GISTIC 2.09.
Data and Software Availability
All raw genomic and clinical data has been made available at the NCI Genomic Data Commons: https://gdc.cancer.gov/
KEY RESOURCES TABLE
Supplementary Material
Table S1 (related to Table 1). Clinical, pathological, and associated sample information of the 117 TETs studied in this analysis.
SIGNIFICANCE.
Neoplasms of the thymus are among the rarest of malignancies, but the most common cancer of the anterior mediastinum. These tumors have a unique biology including a strong association with autoimmune disorders (such as myasthenia gravis, pure red cell aplasia and hypogammaglobulinemia), and a lack of specific therapeutic targets for metastatic disease. Using a multi-omic platform approach as part of The Cancer Genome Atlas (TCGA), we define the mutational landscape of thymic epithelial tumors. These results provide a comprehensive resource to understand the biology of TETs and inform subsequent drug development studies. Taken together, this effort represents the largest and most comprehensive molecular analysis of thymic epithelial tumors to date.
HIGHLIGHTS.
Multi-omics definition of four robust molecular TET subtypes associated with survival
Thymomas have the lowest mutational burden among adult cancers
Enrichment of HRAS, NRAS, TP53, and recurrent GTF2I mutations are observed
Expression of autoimmune targets and aneuploidy links thymoma to myasthenia gravis
Acknowledgments
This work was supported by National Institutes of Health (NIH) grants to The Cancer Genome Atlas (TCGA) project as follows: U54 HG003273 (Gibbs, Richard A.); U54 HG003067 (Gabriel, Stacey; Lander, Eric S.); U54 HG003079 (Wilson, Richard K.); U24 CA143799 (Speed, Terence Paul; Spellman, Paul T); U24 CA143835 (Shmulevich, I); U24 CA143840 (Landanyi, Marc; Sander, Chris); U24 CA143843 (Gibbs, Richard A.; Wheeler, David Andrew); U24 CA143845 (Chin, Lynda; Getz, Gad); U24 CA143848 (Hayes, David N; Perou, Charles M.); U24 CA143858 (Stuart, Joshua; Benz Christopher; Haussler, David H.); U24 CA143866 (Marra, Marco Antonio); U24 CA143867 (Gabriel, Stacey; Meyerson, Matthew L.); U24 CA143882 (Baylin, Stephen B.; Laird, Peter W.); U24 CA143883 (Mills, Gordon B.; Weinstein, John N.; Yung, W. K. Alfred); U24 CA144025 (Kucherlapati, Raju S.); P30 CA016672 (Mills, Gordon B.). A.N. Cherniack and M. Meyerson disclose research funding from Bayer AG. No other conflicts of interests were disclosed by the authors.
Footnotes
Publisher's Disclaimer: This is a PDF file of an unedited manuscript that has been accepted for publication. As a service to our customers we are providing this early version of the manuscript. The manuscript will undergo copyediting, typesetting, and review of the resulting proof before it is published in its final citable form. Please note that during the production process errors may be discovered which could affect the content, and all legal disclaimers that apply to the journal pertain.
SUPPLEMENTAL INFORMATION
Supplemental information includes supplemental experimental procedures, 1 table, and 6 figures which can be found with this article online.
AUTHOR CONTRIBUTIONS
Analysis Working Group Co-Chairs: A.S.T., P.J.L; Data Analysis and Manuscript Coordinator: M.R.; Data Coordinator: C.R.P.; TCGA Coordinators: I.F., J.C.Z.; Analysis Working Group members: M.R., C.R.P., I.F., G.H., H.Z., H.J., K.A.H., P.A., J.Z., R.B., T.M., L.D., A.M.H., M.L., G.S., A.D.K., G.R., J.N.W., T.L., K.L., J.C.Z., C. S-N., A.L.M., D.H., J.H., M.M., R.K., G.G., Y. G- P., S.B., A.R., P.S., N.G., M.T., A.M., A.S.T., P.J.L.; Informatics & Statistical Analysis: G.H., H.Z., H.J., K.A.H., P.A., J.Z., M.M., R.B., T.M., L.D., A.M.H., M.L., G.S., C.L., M.R., Z.S., A.D.C., G.R., R.A., P.S., J.N.W., D.N.H., B.R.; Tissue and clinical data acquisition: T.L., K.L.; Pathology Analysis: M.S.T., A.M., S.B., J.F., C.S-N., M.M., P.S., A.L.M.; Manuscript Writing: M.R., C.R.P., G.H., H.Z., H.J., K.A.H., P.A., J.Z., R.B., T.M., L.D., A.M.H., G.S., J.M.W., J.F., C.S-N, A.L.M., D.H., J.H., M.M., R.K., G.G., Y.G-P., S.B., A.R., P.S., N.G., M.T., A.M., A.S.T., P.J.L.. TCGA Research Network Authors contributions are listed on the title page.
CONSORTIA
Adrian Ally, Elizabeth L. Appelbaum, J. Todd Auman, Miruna Balasundaram, Saianand Balu, Madhusmita Behera, Rameen Beroukhim, Mario Berrios, Giovanni Blandino, Tom Bodenheimer, Moiz S. Bootwalla, Jay Bowen, Denise Brooks, Flavio M. Carcano, Rebecca Carlsen, Andre L. Carvalho, Patricia Castro, Lara Chalabreysse, Lynda Chin, Juok Cho, Gina Choe, Eric Chuah, Sudha Chudamani, Carrie Cibulskis, Leslie Cope, Matthew G. Cordes, Daniel Crain, Erin Curley, Timothy Defreitas, John A. Demchok, Frank Detterbeck, Noreen Dhalla, Hendrik Dienemann, W. Jeff Edenfield, Francesco Facciolo, Martin L. Ferguson, Scott Frazer, Catrina C. Fronick, Lucinda A. Fulton, Robert S. Fulton, Stacey B. Gabriel, Johanna Gardner, Julie M. Gastier-Foster, Nils Gehlenborg, Mark Gerken, Gad Getz, David I. Heiman, Shital Hobensack, Andrea Holbrook, Robert A. Holt, Alan P. Hoyle, Carolyn M. Hutter, Michael Ittmann, Stuart R. Jefferys, Corbin D. Jones, Steven J.M. Jones, Katayoon Kasaian, Jaegil Kim, Patrick K. Kimes, Phillip H. Lai, Peter W. Laird, Michael S. Lawrence, Pei Lin, Jia Liu, Laxmi Lolla, Yiling Lu, Yussanne Ma, Dennis T. Maglinte, David Mallery, Elaine R. Mardis, Marco A. Marra, Julie Martin, Michael Mayo, Sam Meier, Michael Meister, Shaowu Meng, Matthew Meyerson, Piotr A. Mieczkowski, Christopher A. Miller, Gordon B. Mills, Richard A. Moore, Scott Morris, Lisle E. Mose, Thomas Muley, Andrew J. Mungall, Karen Mungall, Rashi Naresh, Yulia Newton, Michael S. Noble, Taofeek Owonikoko, Joel S. Parker, Joseph Paulaskis, Robert Penny, Charles M. Perou, Corinne Perrin, Todd Pihl, Amie Radenbaugh, Suresh Ramalingam, Nilsa Ramirez, Ralf Rieker, Jeffrey Roach, Sara Sadeghi, Gordon Saksena, Jacqueline E. Schein, Heather K. Schmidt, Steven E. Schumacher, Candace Shelton, Troy Shelton, Yan Shi, Juliann Shih, Gabriel Sica, Henrique C. S. Silveira, Janae V. Simons, Payal Sipahimalani, Tara Skelly, Heidi J. Sofia, Matthew G. Soloway, Joshua Stuart, Qiang Sun, Angela Tam, Donghui Tan, Roy Tarnuzzer, Nina Thiessen, David J. Van Den Berg, Mohammad A. Vasef, Umadevi Veluvolu, Doug Voet, Vonn Walter, Yunhu Wan, Zhining Wang, Arne Warth, Cleo-Aron Weis, Daniel J. Weisenberger, Matthew D. Wilkerson, Lisa Wise, Tina Wong, Hsin-Ta Wu, Ye Wu, Liming Yang, Jiashan Zhang, Erik Zmuda
References
- Agarwal V, Bell GW, Nam JW, Bartel DP. Predicting effective microRNA target sites in mammalian mRNAs. Elife. 2015;4 doi: 10.7554/eLife.05005. [DOI] [PMC free article] [PubMed] [Google Scholar]
- Akbani R, Ng PK, Werner HM, Shahmoradgoli M, Zhang F, Ju Z, Liu W, Yang JY, Yoshihara K, Li J, et al. A pan-cancer proteomic perspective on The Cancer Genome Atlas. Nature communications. 2014;5:3887. doi: 10.1038/ncomms4887. [DOI] [PMC free article] [PubMed] [Google Scholar]
- Badve S, Goswami C, Gokmen-Polar Y, Nelson RP, Jr, Henley J, Miller N, Zaheer NA, Sledge GW, Jr, Li L, Kesler KA, Loehrer PJ., Sr Molecular analysis of thymoma. PLoS One. 2012;7:e42669. doi: 10.1371/journal.pone.0042669. [DOI] [PMC free article] [PubMed] [Google Scholar]
- Bang YJ, Van Cutsem E, Feyereislova A, Chung HC, Shen L, Sawaki A, Lordick F, Ohtsu A, Omuro Y, Satoh T, et al. Trastuzumab in combination with chemotherapy versus chemotherapy alone for treatment of HER2-positive advanced gastric or gastro-oesophageal junction cancer (ToGA): a phase 3, open-label, randomised controlled trial. Lancet. 2010;376:687–697. doi: 10.1016/S0140-6736(10)61121-X. [DOI] [PubMed] [Google Scholar]
- Bellissimo T, Ganci F, Gallo E, Sacconi A, Tito C, De Angelis L, Pulito C, Masciarelli S, Diso D, Anile M, et al. Thymic Epithelial Tumors phenotype relies on miR-145-5p epigenetic regulation. Molecular cancer. 2017;16:88. doi: 10.1186/s12943-017-0655-2. [DOI] [PMC free article] [PubMed] [Google Scholar]
- Bibikova M, Barnes B, Tsan C, Ho V, Klotzle B, Le JM, Delano D, Zhang L, Schroth GP, Gunderson KL, et al. High density DNA methylation array with single CpG site resolution. Genomics. 2011;98:288–295. doi: 10.1016/j.ygeno.2011.07.007. [DOI] [PubMed] [Google Scholar]
- Cancer Genome Atlas N. Comprehensive molecular characterization of human colon and rectal cancer. Nature. 2012a;487:330–337. doi: 10.1038/nature11252. [DOI] [PMC free article] [PubMed] [Google Scholar]
- Cancer Genome Atlas N. Comprehensive molecular portraits of human breast tumours. Nature. 2012b;490:61–70. doi: 10.1038/nature11412. [DOI] [PMC free article] [PubMed] [Google Scholar]
- Cancer Genome Atlas Research, N. Integrated genomic analyses of ovarian carcinoma. Nature. 2011;474:609–615. doi: 10.1038/nature10166. [DOI] [PMC free article] [PubMed] [Google Scholar]
- Cancer Genome Atlas Research, N. Comprehensive genomic characterization of squamous cell lung cancers. Nature. 2012;489:519–525. doi: 10.1038/nature11404. [DOI] [PMC free article] [PubMed] [Google Scholar]
- Cancer Genome Atlas Research, N. Comprehensive molecular profiling of lung adenocarcinoma. Nature. 2014a;511:543–550. doi: 10.1038/nature13385. [DOI] [PMC free article] [PubMed] [Google Scholar]
- Cancer Genome Atlas Research, N. Integrated genomic characterization of papillary thyroid carcinoma. Cell. 2014b;159:676–690. doi: 10.1016/j.cell.2014.09.050. [DOI] [PMC free article] [PubMed] [Google Scholar]
- Carter SL, Cibulskis K, Helman E, McKenna A, Shen H, Zack T, Laird PW, Onofrio RC, Winckler W, Weir BA, et al. Absolute quantification of somatic DNA alterations in human cancer. Nat Biotechnol. 2012;30:413–421. doi: 10.1038/nbt.2203. [DOI] [PMC free article] [PubMed] [Google Scholar]
- Challis D, Yu J, Evani US, Jackson AR, Paithankar S, Coarfa C, Milosavljevic A, Gibbs RA, Yu F. An integrative variant analysis suite for whole exome next-generation sequencing data. BMC Bioinformatics. 2012;13:8. doi: 10.1186/1471-2105-13-8. [DOI] [PMC free article] [PubMed] [Google Scholar]
- Chen Y, Gharwan H, Thomas A. Novel biologic therapies for thymic epithelial tumors. Frontiers in oncology. 2014;4:103. doi: 10.3389/fonc.2014.00103. [DOI] [PMC free article] [PubMed] [Google Scholar]
- Chen Y, Yao H, Thompson EJ, Tannir NM, Weinstein JN, Su X. VirusSeq: software to identify viruses and their integration sites using next-generation sequencing of human cancer tissue. Bioinformatics. 2013;29:266–267. doi: 10.1093/bioinformatics/bts665. [DOI] [PMC free article] [PubMed] [Google Scholar]
- Chu A, Robertson G, Brooks D, Mungall AJ, Birol I, Coope R, Ma Y, Jones S, Marra MA. Large-scale profiling of microRNAs for The Cancer Genome Atlas. Nucleic Acids Res. 2016;44:e3. doi: 10.1093/nar/gkv808. [DOI] [PMC free article] [PubMed] [Google Scholar]
- Chu J, Sadeghi S, Raymond A, Jackman SD, Nip KM, Mar R, Mohamadi H, Butterfield YS, Robertson AG, Birol I. BioBloom tools: fast, accurate and memory-efficient host species sequence screening using bloom filters. Bioinformatics. 2014;30:3402–3404. doi: 10.1093/bioinformatics/btu558. [DOI] [PMC free article] [PubMed] [Google Scholar]
- Cibulskis K, Lawrence MS, Carter SL, Sivachenko A, Jaffe D, Sougnez C, Gabriel S, Meyerson M, Lander ES, Getz G. Sensitive detection of somatic point mutations in impure and heterogeneous cancer samples. Nat Biotechnol. 2013;31:213–219. doi: 10.1038/nbt.2514. [DOI] [PMC free article] [PubMed] [Google Scholar]
- Cibulskis K, McKenna A, Fennell T, Banks E, DePristo M, Getz G. ContEst: estimating cross-contamination of human samples in next-generation sequencing data. Bioinformatics. 2011;27:2601–2602. doi: 10.1093/bioinformatics/btr446. [DOI] [PMC free article] [PubMed] [Google Scholar]
- Cingolani P, Platts A, Wang le L, Coon M, Nguyen T, Wang L, Land SJ, Lu X, Ruden DM. A program for annotating and predicting the effects of single nucleotide polymorphisms, SnpEff: SNPs in the genome of Drosophila melanogaster strain w1118; iso-2; iso-3. Fly (Austin) 2012;6:80–92. doi: 10.4161/fly.19695. [DOI] [PMC free article] [PubMed] [Google Scholar]
- Corley SM, Canales CP, Carmona-Mora P, Mendoza-Reinosa V, Beverdam A, Hardeman EC, Wilkins MR, Palmer SJ. RNA-Seq analysis of Gtf2ird1 knockout epidermal tissue provides potential insights into molecular mechanisms underpinning Williams-Beuren syndrome. BMC Genomics. 2016;17:450. doi: 10.1186/s12864-016-2801-4. [DOI] [PMC free article] [PubMed] [Google Scholar]
- Costello M, Pugh TJ, Fennell TJ, Stewart C, Lichtenstein L, Meldrim JC, Fostel JL, Friedrich DC, Perrin D, Dionne D, et al. Discovery and characterization of artifactual mutations in deep coverage targeted capture sequencing data due to oxidative DNA damage during sample preparation. Nucleic Acids Res. 2013;41:e67. doi: 10.1093/nar/gks1443. [DOI] [PMC free article] [PubMed] [Google Scholar]
- Cufi P, Soussan P, Truffault F, Fetouchi R, Robinet M, Fadel E, Berrih-Aknin S, Le Panse R. Thymoma-associated myasthenia gravis: On the search for a pathogen signature. J Autoimmun. 2014;52:29–35. doi: 10.1016/j.jaut.2013.12.018. [DOI] [PubMed] [Google Scholar]
- Dabney AR. ClaNC: point-and-click software for classifying microarrays to nearest centroids. Bioinformatics. 2006;22:122–123. doi: 10.1093/bioinformatics/bti756. [DOI] [PubMed] [Google Scholar]
- Dadmanesh F, Sekihara T, Rosai J. Histologic typing of thymoma according to the new World Health Organization classification. Chest surgery clinics of North America. 2001;11:407–420. [PubMed] [Google Scholar]
- Dalmau J, Furneaux HM, Cordon-Cardo C, Posner JB. The expression of the Hu (paraneoplastic encephalomyelitis/sensory neuronopathy) antigen in human normal and tumor tissues. Am J Pathol. 1992;141:881–886. [PMC free article] [PubMed] [Google Scholar]
- Detterbeck F, Youssef S, Ruffini E, Okumura M. A review of prognostic factors in thymic malignancies. Journal of thoracic oncology : official publication of the International Association for the Study of Lung Cancer. 2011a;6:S1698–1704. doi: 10.1097/JTO.0b013e31821e7b12. [DOI] [PubMed] [Google Scholar]
- Detterbeck FC, Nicholson AG, Kondo K, Van Schil P, Moran C. The Masaoka-Koga stage classification for thymic malignancies: clarification and definition of terms. J Thorac Oncol. 2011b;6:S1710–1716. doi: 10.1097/JTO.0b013e31821e8cff. [DOI] [PubMed] [Google Scholar]
- Detterbeck FC, Stratton K, Giroux D, Asamura H, Crowley J, Falkson C, Filosso PL, Frazier AA, Giaccone G, Huang J, et al. The IASLC/ITMIG Thymic Epithelial Tumors Staging Project: proposal for an evidence-based stage classification system for the forthcoming (8th) edition of the TNM classification of malignant tumors. J Thorac Oncol. 2014;9:S65–72. doi: 10.1097/JTO.0000000000000290. [DOI] [PubMed] [Google Scholar]
- Engels EA. Epidemiology of thymoma and associated malignancies. Journal of thoracic oncology : official publication of the International Association for the Study of Lung Cancer. 2010;5:S260–265. doi: 10.1097/JTO.0b013e3181f1f62d. [DOI] [PMC free article] [PubMed] [Google Scholar]
- Engels EA, Pfeiffer RM. Malignant thymoma in the United States: demographic patterns in incidence and associations with subsequent malignancies. Int J Cancer. 2003;105:546–551. doi: 10.1002/ijc.11099. [DOI] [PubMed] [Google Scholar]
- Faith JJ, Hayete B, Thaden JT, Mogno I, Wierzbowski J, Cottarel G, Kasif S, Collins JJ, Gardner TS. Large-scale mapping and validation of Escherichia coli transcriptional regulation from a compendium of expression profiles. PLoS Biol. 2007;5:e8. doi: 10.1371/journal.pbio.0050008. [DOI] [PMC free article] [PubMed] [Google Scholar]
- Forbes SA, Tang G, Bindal N, Bamford S, Dawson E, Cole C, Kok CY, Jia M, Ewing R, Menzies A, et al. COSMIC (the Catalogue of Somatic Mutations in Cancer): a resource to investigate acquired mutations in human cancer. Nucleic Acids Res. 2010;38:D652–657. doi: 10.1093/nar/gkp995. [DOI] [PMC free article] [PubMed] [Google Scholar]
- Ganci F, Vico C, Korita E, Sacconi A, Gallo E, Mori F, Cambria A, Russo E, Anile M, Vitolo D, et al. MicroRNA expression profiling of thymic epithelial tumors. Lung Cancer. 2014;85:197–204. doi: 10.1016/j.lungcan.2014.04.008. [DOI] [PubMed] [Google Scholar]
- Gilhus NE, Skeie GO, Romi F, Lazaridis K, Zisimopoulou P, Tzartos S. Myasthenia gravis - autoantibody characteristics and their implications for therapy. Nat Rev Neurol. 2016;12:259–268. doi: 10.1038/nrneurol.2016.44. [DOI] [PubMed] [Google Scholar]
- Girard N, Shen R, Guo T, Zakowski MF, Heguy A, Riely GJ, Huang J, Lau C, Lash AE, Ladanyi M, et al. Comprehensive genomic analysis reveals clinically relevant molecular distinctions between thymic carcinomas and thymomas. Clin Cancer Res. 2009;15:6790–6799. doi: 10.1158/1078-0432.CCR-09-0644. [DOI] [PMC free article] [PubMed] [Google Scholar]
- Gokmen-Polar Y, Cook RW, Goswami CP, Wilkinson J, Maetzold D, Stone JF, Oelschlager KM, Vladislav IT, Shirar KL, Kesler KA, et al. A gene signature to determine metastatic behavior in thymomas. PLoS One. 2013;8:e66047. doi: 10.1371/journal.pone.0066047. [DOI] [PMC free article] [PubMed] [Google Scholar]
- Gonzalez-Angulo AM, Hennessy BT, Meric-Bernstam F, Sahin A, Liu W, Ju Z, Carey MS, Myhre S, Speers C, Deng L, et al. Functional proteomics can define prognosis and predict pathologic complete response in patients with breast cancer. Clin Proteomics. 2011;8:11. doi: 10.1186/1559-0275-8-11. [DOI] [PMC free article] [PubMed] [Google Scholar]
- Ha G, Roth A, Khattra J, Ho J, Yap D, Prentice LM, Melnyk N, McPherson A, Bashashati A, Laks E, et al. TITAN: inference of copy number architectures in clonal cell populations from tumor whole-genome sequence data. Genome Res. 2014;24:1881–1893. doi: 10.1101/gr.180281.114. [DOI] [PMC free article] [PubMed] [Google Scholar]
- Hennessy BT, Lu Y, Gonzalez-Angulo AM, Carey MS, Myhre S, Ju Z, Davies MA, Liu W, Coombes K, Meric-Bernstam F, et al. A Technical Assessment of the Utility of Reverse Phase Protein Arrays for the Study of the Functional Proteome in Non-microdissected Human Breast Cancers. Clin Proteomics. 2010;6:129–151. doi: 10.1007/s12014-010-9055-y. [DOI] [PMC free article] [PubMed] [Google Scholar]
- Hennessy BT, Lu Y, Poradosu E, Yu Q, Yu S, Hall H, Carey MS, Ravoori M, Gonzalez-Angulo AM, Birch R, et al. Pharmacodynamic markers of perifosine efficacy. Clin Cancer Res. 2007;13:7421–7431. doi: 10.1158/1078-0432.CCR-07-0760. [DOI] [PubMed] [Google Scholar]
- Hsu SD, Tseng YT, Shrestha S, Lin YL, Khaleel A, Chou CH, Chu CF, Huang HY, Lin CM, Ho SY, et al. miRTarBase update 2014: an information resource for experimentally validated miRNA-target interactions. Nucleic Acids Res. 2014;42:D78–85. doi: 10.1093/nar/gkt1266. [DOI] [PMC free article] [PubMed] [Google Scholar]
- Hu J, He X, Baggerly KA, Coombes KR, Hennessy BT, Mills GB. Nonparametric quantification of protein lysate arrays. Bioinformatics. 2007;23:1986–1994. doi: 10.1093/bioinformatics/btm283. [DOI] [PubMed] [Google Scholar]
- Huang B, Belharazem D, Li L, Kneitz S, Schnabel PA, Rieker RJ, Korner D, Nix W, Schalke B, Muller-Hermelink HK, et al. Anti-Apoptotic Signature in Thymic Squamous Cell Carcinomas - Functional Relevance of Anti-Apoptotic BIRC3 Expression in the Thymic Carcinoma Cell Line 1889c. Frontiers in oncology. 2013;3:316. doi: 10.3389/fonc.2013.00316. [DOI] [PMC free article] [PubMed] [Google Scholar]
- Huang DW, Sherman BT, Tan Q, Collins JR, Alvord WG, Roayaei J, Stephens R, Baseler MW, Lane HC, Lempicki RA. The DAVID Gene Functional Classification Tool: a novel biological module-centric algorithm to functionally analyze large gene lists. Genome Biol. 2007a;8:R183. doi: 10.1186/gb-2007-8-9-r183. [DOI] [PMC free article] [PubMed] [Google Scholar]
- Huang DW, Sherman BT, Tan Q, Kir J, Liu D, Bryant D, Guo Y, Stephens R, Baseler MW, Lane HC, Lempicki RA. DAVID Bioinformatics Resources: expanded annotation database and novel algorithms to better extract biology from large gene lists. Nucleic Acids Res. 2007b;35:W169–175. doi: 10.1093/nar/gkm415. [DOI] [PMC free article] [PubMed] [Google Scholar]
- Huemer HP, Larcher C, Dierich MP, Falke D. Factors influencing the interaction of herpes simplex virus glycoprotein C with the third component of complement. Arch Virol. 1992;127:291–303. doi: 10.1007/BF01309591. [DOI] [PubMed] [Google Scholar]
- Kent WJ. BLAT–the BLAST-like alignment tool. Genome Res. 2002;12:656–664. doi: 10.1101/gr.229202. [DOI] [PMC free article] [PubMed] [Google Scholar]
- Klein R, Marx A, Strobel P, Schalke B, Nix W, Willcox N. Autoimmune associations and autoantibody screening show focused recognition in patient subgroups with generalized myasthenia gravis. Hum Immunol. 2013;74:1184–1193. doi: 10.1016/j.humimm.2013.06.020. [DOI] [PubMed] [Google Scholar]
- Koboldt DC, Zhang Q, Larson DE, Shen D, McLellan MD, Lin L, Miller CA, Mardis ER, Ding L, Wilson RK. VarScan 2: somatic mutation and copy number alteration discovery in cancer by exome sequencing. Genome Res. 2012;22:568–576. doi: 10.1101/gr.129684.111. [DOI] [PMC free article] [PubMed] [Google Scholar]
- Koga K, Matsuno Y, Noguchi M, Mukai K, Asamura H, Goya T, Shimosato Y. A review of 79 thymomas: modification of staging system and reappraisal of conventional division into invasive and non-invasive thymoma. Pathology international. 1994;44:359–367. doi: 10.1111/j.1440-1827.1994.tb02936.x. [DOI] [PubMed] [Google Scholar]
- Korn JM, Kuruvilla FG, McCarroll SA, Wysoker A, Nemesh J, Cawley S, Hubbell E, Veitch J, Collins PJ, Darvishi K, et al. Integrated genotype calling and association analysis of SNPs, common copy number polymorphisms and rare CNVs. Nat Genet. 2008;40:1253–1260. doi: 10.1038/ng.237. [DOI] [PMC free article] [PubMed] [Google Scholar]
- Kuhn RM, Haussler D, Kent WJ. The UCSC genome browser and associated tools. Brief Bioinform. 2013;14:144–161. doi: 10.1093/bib/bbs038. [DOI] [PMC free article] [PubMed] [Google Scholar]
- Larson DE, Harris CC, Chen K, Koboldt DC, Abbott TE, Dooling DJ, Ley TJ, Mardis ER, Wilson RK, Ding L. SomaticSniper: identification of somatic point mutations in whole genome sequencing data. Bioinformatics. 2012;28:311–317. doi: 10.1093/bioinformatics/btr665. [DOI] [PMC free article] [PubMed] [Google Scholar]
- Lawrence MS, Stojanov P, Polak P, Kryukov GV, Cibulskis K, Sivachenko A, Carter SL, Stewart C, Mermel CH, Roberts SA, et al. Mutational heterogeneity in cancer and the search for new cancer-associated genes. Nature. 2013;499:214–218. doi: 10.1038/nature12213. [DOI] [PMC free article] [PubMed] [Google Scholar]
- Le DT, Uram JN, Wang H, Bartlett BR, Kemberling H, Eyring AD, Skora AD, Luber BS, Azad NS, Laheru D, et al. PD-1 Blockade in Tumors with Mismatch-Repair Deficiency. N Engl J Med. 2015;372:2509–2520. doi: 10.1056/NEJMoa1500596. [DOI] [PMC free article] [PubMed] [Google Scholar]
- Lee GY, Yang WI, Jeung HC, Kim SC, Seo MY, Park CH, Chung HC, Rha SY. Genome-wide genetic aberrations of thymoma using cDNA microarray based comparative genomic hybridization. BMC Genomics. 2007;8:305. doi: 10.1186/1471-2164-8-305. [DOI] [PMC free article] [PubMed] [Google Scholar]
- Lee HS, Jang HJ, Shah R, Yoon D, Hamaji M, Wald O, Lee JS, Sugarbaker DJ, Burt BM. Genomic Analysis of Thymic Epithelial Tumors Identifies Novel Subtypes Associated with Distinct Clinical Features. Clin Cancer Res. 2017;23:4855–4864. doi: 10.1158/1078-0432.CCR-17-0066. [DOI] [PMC free article] [PubMed] [Google Scholar]
- Li B, Dewey CN. RSEM: accurate transcript quantification from RNA-Seq data with or without a reference genome. BMC Bioinformatics. 2011;12:323. doi: 10.1186/1471-2105-12-323. [DOI] [PMC free article] [PubMed] [Google Scholar]
- Li H, Durbin R. Fast and accurate short read alignment with Burrows-Wheeler transform. Bioinformatics. 2009;25:1754–1760. doi: 10.1093/bioinformatics/btp324. [DOI] [PMC free article] [PubMed] [Google Scholar]
- Li H, Handsaker B, Wysoker A, Fennell T, Ruan J, Homer N, Marth G, Abecasis G, Durbin R, Genome Project Data Processing, S. The Sequence Alignment/Map format and SAMtools. Bioinformatics. 2009;25:2078–2079. doi: 10.1093/bioinformatics/btp352. [DOI] [PMC free article] [PubMed] [Google Scholar]
- Li J, Tibshirani R. Finding consistent patterns: a nonparametric approach for identifying differential expression in RNA-Seq data. Stat Methods Med Res. 2013;22:519–536. doi: 10.1177/0962280211428386. [DOI] [PMC free article] [PubMed] [Google Scholar]
- Liang J, Shao SH, Xu ZX, Hennessy B, Ding Z, Larrea M, Kondo S, Dumont DJ, Gutterman JU, Walker CL, et al. The energy sensing LKB1-AMPK pathway regulates p27(kip1) phosphorylation mediating the decision to enter autophagy or apoptosis. Nat Cell Biol. 2007;9:218–224. doi: 10.1038/ncb1537. [DOI] [PubMed] [Google Scholar]
- Loehrer PJ, Sr, Wang W, Johnson DH, Aisner SC, Ettinger DS. Octreotide alone or with prednisone in patients with advanced thymoma and thymic carcinoma: an Eastern Cooperative Oncology Group Phase II Trial. J Clin Oncol. 2004;22:293–299. doi: 10.1200/JCO.2004.02.047. [DOI] [PubMed] [Google Scholar]
- Lopez-Chavez A, Thomas A, Rajan A, Raffeld M, Morrow B, Kelly R, Carter CA, Guha U, Killian K, Lau CC, et al. Molecular profiling and targeted therapy for advanced thoracic malignancies: a biomarker-derived, multiarm, multihistology phase II basket trial. Journal of clinical oncology : official journal of the American Society of Clinical Oncology. 2015;33:1000–1007. doi: 10.1200/JCO.2014.58.2007. [DOI] [PMC free article] [PubMed] [Google Scholar]
- Martin S, Brown WM, Klavans R, Boyack KW. OpenOrd: An Open-Source Toolbox for Large Graph Layout. Proc Spie. 2011;7868 [Google Scholar]
- Marx A, Osborn M, Tzartos S, Geuder KI, Schalke B, Nix W, Kirchner T, Muller-Hermelink HK. A striational muscle antigen and myasthenia gravis-associated thymomas share an acetylcholine-receptor epitope. Dev Immunol. 1992;2:77–84. doi: 10.1155/1992/86853. [DOI] [PMC free article] [PubMed] [Google Scholar]
- Marx A, Wilisch A, Schultz A, Greiner A, Magi B, Pallini V, Schalke B, Toyka K, Nix W, Kirchner T, Muller-Hermelink HK. Expression of neurofilaments and of a titin epitope in thymic epithelial tumors. Implications for the pathogenesis of myasthenia gravis. Am J Pathol. 1996;148:1839–1850. [PMC free article] [PubMed] [Google Scholar]
- Masuda T, Motomura M, Utsugisawa K, Nagane Y, Nakata R, Tokuda M, Fukuda T, Yoshimura T, Tsujihata M, Kawakami A. Antibodies against the main immunogenic region of the acetylcholine receptor correlate with disease severity in myasthenia gravis. J Neurol Neurosurg Psychiatry. 2012;83:935–940. doi: 10.1136/jnnp-2012-302705. [DOI] [PubMed] [Google Scholar]
- McCarroll SA, Kuruvilla FG, Korn JM, Cawley S, Nemesh J, Wysoker A, Shapero MH, de Bakker PI, Maller JB, Kirby A, et al. Integrated detection and population-genetic analysis of SNPs and copy number variation. Nat Genet. 2008;40:1166–1174. doi: 10.1038/ng.238. [DOI] [PubMed] [Google Scholar]
- McKenna A, Hanna M, Banks E, Sivachenko A, Cibulskis K, Kernytsky A, Garimella K, Altshuler D, Gabriel S, Daly M, DePristo MA. The Genome Analysis Toolkit: a MapReduce framework for analyzing next-generation DNA sequencing data. Genome Res. 2010;20:1297–1303. doi: 10.1101/gr.107524.110. [DOI] [PMC free article] [PubMed] [Google Scholar]
- Mencarelli C, Magi B, Marzocchi B, Armellini D, Pallini V. Evolution of the “titin epitope” in neurofilament proteins. Comp Biochem Physiol B. 1991;100:741–744. doi: 10.1016/0305-0491(91)90283-j. [DOI] [PubMed] [Google Scholar]
- Mermel CH, Schumacher SE, Hill B, Meyerson ML, Beroukhim R, Getz G. GISTIC2.0 facilitates sensitive and confident localization of the targets of focal somatic copy-number alteration in human cancers. Genome Biol. 2011;12:R41. doi: 10.1186/gb-2011-12-4-r41. [DOI] [PMC free article] [PubMed] [Google Scholar]
- Monti S, Tamayo P, Mesirov J, Golub T. Consensus clustering: A resampling-based method for class discovery and visualization of gene expression microarray data. Mach Learn. 2003;52:91–118. [Google Scholar]
- Mygland A, Kuwajima G, Mikoshiba K, Tysnes OB, Aarli JA, Gilhus NE. Thymomas express epitopes shared by the ryanodine receptor. J Neuroimmunol. 1995;62:79–83. doi: 10.1016/0165-5728(95)00106-c. [DOI] [PubMed] [Google Scholar]
- Mygland A, Tysnes OB, Matre R, Aarli JA, Gilhus NE. Anti-cardiac ryanodine receptor antibodies in thymoma-associated myasthenia gravis. Autoimmunity. 1994;17:327–331. doi: 10.3109/08916939409010673. [DOI] [PubMed] [Google Scholar]
- Olshen AB, Venkatraman ES, Lucito R, Wigler M. Circular binary segmentation for the analysis of array-based DNA copy number data. Biostatistics. 2004;5:557–572. doi: 10.1093/biostatistics/kxh008. [DOI] [PubMed] [Google Scholar]
- Palmieri G, Montella L, Martignetti A, Muto P, Di Vizio D, De Chiara A, Lastoria S. Somatostatin analogs and prednisone in advanced refractory thymic tumors. Cancer. 2002;94:1414–1420. doi: 10.1002/cncr.10374. [DOI] [PubMed] [Google Scholar]
- Pedregosa F, Varoquaux G, Gramfort A, Michel V, Thirion B, Grisel O, Blondel M, Prettenhofer P, Weiss R, Dubourg V, et al. Scikit-learn: Machine Learning in Python. J Mach Learn Res. 2011;12:2825–2830. [Google Scholar]
- Petrini I, Meltzer PS, Kim IK, Lucchi M, Park KS, Fontanini G, Gao J, Zucali PA, Calabrese F, Favaretto A, et al. A specific missense mutation in GTF2I occurs at high frequency in thymic epithelial tumors. Nat Genet. 2014;46:844–849. doi: 10.1038/ng.3016. [DOI] [PMC free article] [PubMed] [Google Scholar]
- Petrini I, Rajan A, Pham T, Voeller D, Davis S, Gao J, Wang Y, Giaccone G. Whole genome and transcriptome sequencing of a B3 thymoma. PloS one. 2013;8:e60572. doi: 10.1371/journal.pone.0060572. [DOI] [PMC free article] [PubMed] [Google Scholar]
- Pugliese A, Zeller M, Fernandez A, Jr, Zalcberg LJ, Bartlett RJ, Ricordi C, Pietropaolo M, Eisenbarth GS, Bennett ST, Patel DD. The insulin gene is transcribed in the human thymus and transcription levels correlated with allelic variation at the INS VNTR-IDDM2 susceptibility locus for type 1 diabetes. Nat Genet. 1997;15:293–297. doi: 10.1038/ng0397-293. [DOI] [PubMed] [Google Scholar]
- Radenbaugh AJ, Ma S, Ewing A, Stuart JM, Collisson EA, Zhu J, Haussler D. RADIA: RNA and DNA integrated analysis for somatic mutation detection. PLoS One. 2014;9:e111516. doi: 10.1371/journal.pone.0111516. [DOI] [PMC free article] [PubMed] [Google Scholar]
- Radovich M, Solzak JP, Hancock BA, Conces ML, Atale R, Porter RF, Zhu J, Glasscock J, Kesler KA, Badve SS, et al. A large microRNA cluster on chromosome 19 is a transcriptional hallmark of WHO type A and AB thymomas. Br J Cancer. 2016;114:477–484. doi: 10.1038/bjc.2015.425. [DOI] [PMC free article] [PubMed] [Google Scholar]
- Ramos AH, Lichtenstein L, Gupta M, Lawrence MS, Pugh TJ, Saksena G, Meyerson M, Getz G. Oncotator: cancer variant annotation tool. Hum Mutat. 2015;36:E2423–2429. doi: 10.1002/humu.22771. [DOI] [PMC free article] [PubMed] [Google Scholar]
- Reinius LE, Acevedo N, Joerink M, Pershagen G, Dahlen SE, Greco D, Soderhall C, Scheynius A, Kere J. Differential DNA methylation in purified human blood cells: implications for cell lineage and studies on disease susceptibility. PLoS One. 2012;7:e41361. doi: 10.1371/journal.pone.0041361. [DOI] [PMC free article] [PubMed] [Google Scholar]
- Robertson G, Schein J, Chiu R, Corbett R, Field M, Jackman SD, Mungall K, Lee S, Okada HM, Qian JQ, et al. De novo assembly and analysis of RNA-seq data. Nat Methods. 2010;7:909–912. doi: 10.1038/nmeth.1517. [DOI] [PubMed] [Google Scholar]
- Romi F, Bo L, Skeie GO, Myking A, Aarli JA, Gilhus NE. Titin and ryanodine receptor epitopes are expressed in cortical thymoma along with costimulatory molecules. J Neuroimmunol. 2002;128:82–89. doi: 10.1016/s0165-5728(02)00145-5. [DOI] [PubMed] [Google Scholar]
- Roth A, Khattra J, Yap D, Wan A, Laks E, Biele J, Ha G, Aparicio S, Bouchard-Cote A, Shah SP. PyClone: statistical inference of clonal population structure in cancer. Nat Methods. 2014;11:396–398. doi: 10.1038/nmeth.2883. [DOI] [PMC free article] [PubMed] [Google Scholar]
- Rousseeuw PJ. Silhouettes - a Graphical Aid to the Interpretation and Validation of Cluster-Analysis. J Comput Appl Math. 1987;20:53–65. [Google Scholar]
- Sasaki H, Ide N, Fukai I, Kiriyama M, Yamakawa Y, Fujii Y. Gene expression analysis of human thymoma correlates with tumor stage. Int J Cancer. 2002;101:342–347. doi: 10.1002/ijc.10624. [DOI] [PubMed] [Google Scholar]
- Saunders CT, Wong WS, Swamy S, Becq J, Murray LJ, Cheetham RK. Strelka: accurate somatic small-variant calling from sequenced tumor-normal sample pairs. Bioinformatics. 2012;28:1811–1817. doi: 10.1093/bioinformatics/bts271. [DOI] [PubMed] [Google Scholar]
- Schaefer CF, Anthony K, Krupa S, Buchoff J, Day M, Hannay T, Buetow KH. PID: the Pathway Interaction Database. Nucleic Acids Res. 2009;37:D674–679. doi: 10.1093/nar/gkn653. [DOI] [PMC free article] [PubMed] [Google Scholar]
- Schultz A, Hoffacker V, Wilisch A, Nix W, Gold R, Schalke B, Tzartos S, Muller-Hermelink HK, Marx A. Neurofilament is an autoantigenic determinant in myasthenia gravis. Ann Neurol. 1999;46:167–175. doi: 10.1002/1531-8249(199908)46:2<167::aid-ana5>3.0.co;2-3. [DOI] [PubMed] [Google Scholar]
- Scorsetti M, Leo F, Trama A, D’Angelillo R, Serpico D, Macerelli M, Zucali P, Gatta G, Garassino MC. Thymoma and thymic carcinomas. Critical reviews in oncology/hematology. 2016;99:332–350. doi: 10.1016/j.critrevonc.2016.01.012. [DOI] [PubMed] [Google Scholar]
- Shabalin AA. Matrix eQTL: ultra fast eQTL analysis via large matrix operations. Bioinformatics. 2012;28:1353–1358. doi: 10.1093/bioinformatics/bts163. [DOI] [PMC free article] [PubMed] [Google Scholar]
- Siara J, Rudel R, Marx A. Absence of acetylcholine-induced current in epithelial cells from thymus glands and thymomas of myasthenia gravis patients. Neurology. 1991;41:128–131. doi: 10.1212/wnl.41.1.128. [DOI] [PubMed] [Google Scholar]
- Simpson JT, Wong K, Jackman SD, Schein JE, Jones SJ, Birol I. ABySS: a parallel assembler for short read sequence data. Genome Res. 2009;19:1117–1123. doi: 10.1101/gr.089532.108. [DOI] [PMC free article] [PubMed] [Google Scholar]
- Smigielski EM, Sirotkin K, Ward M, Sherry ST. dbSNP: a database of single nucleotide polymorphisms. Nucleic Acids Res. 2000;28:352–355. doi: 10.1093/nar/28.1.352. [DOI] [PMC free article] [PubMed] [Google Scholar]
- Thomas A, Rajan A, Berman A, Tomita Y, Brzezniak C, Lee MJ, Lee S, Ling A, Spittler AJ, Carter CA, et al. Sunitinib in patients with chemotherapy-refractory thymoma and thymic carcinoma: an open-label phase 2 trial. Lancet Oncol. 2015;16:177–186. doi: 10.1016/S1470-2045(14)71181-7. [DOI] [PMC free article] [PubMed] [Google Scholar]
- Tibes R, Qiu Y, Lu Y, Hennessy B, Andreeff M, Mills GB, Kornblau SM. Reverse phase protein array: validation of a novel proteomic technology and utility for analysis of primary leukemia specimens and hematopoietic stem cells. Mol Cancer Ther. 2006;5:2512–2521. doi: 10.1158/1535-7163.MCT-06-0334. [DOI] [PubMed] [Google Scholar]
- Travis WD, Brambilla E, Burke AP, Marx A, Nicholson AG. Introduction to The 2015 World Health Organization Classification of Tumors of the Lung, Pleura, Thymus, and Heart. J Thorac Oncol. 2015;10:1240–1242. doi: 10.1097/JTO.0000000000000663. [DOI] [PubMed] [Google Scholar]
- Travis WD, Brambilla E, Muller-Hermelink HK, Harris CC. World Health Organization Classification of Tumours. IARCPress; Lyon, France: 2004. Pathology and Genetics of Tumours of the Lung, Pleura, Thymus and Heart. [Google Scholar]
- Tusher VG, Tibshirani R, Chu G. Significance analysis of microarrays applied to the ionizing radiation response. Proc Natl Acad Sci U S A. 2001;98:5116–5121. doi: 10.1073/pnas.091062498. [DOI] [PMC free article] [PubMed] [Google Scholar]
- Vafiadis P, Bennett ST, Todd JA, Nadeau J, Grabs R, Goodyer CG, Wickramasinghe S, Colle E, Polychronakos C. Insulin expression in human thymus is modulated by INS VNTR alleles at the IDDM2 locus. Nat Genet. 1997;15:289–292. doi: 10.1038/ng0397-289. [DOI] [PubMed] [Google Scholar]
- Vaske CJ, Benz SC, Sanborn JZ, Earl D, Szeto C, Zhu J, Haussler D, Stuart JM. Inference of patient-specific pathway activities from multi-dimensional cancer genomics data using PARADIGM. Bioinformatics. 2010;26:i237–245. doi: 10.1093/bioinformatics/btq182. [DOI] [PMC free article] [PubMed] [Google Scholar]
- Wang K, Li M, Hakonarson H. ANNOVAR: functional annotation of genetic variants from high-throughput sequencing data. Nucleic Acids Res. 2010a;38:e164. doi: 10.1093/nar/gkq603. [DOI] [PMC free article] [PubMed] [Google Scholar]
- Wang K, Singh D, Zeng Z, Coleman SJ, Huang Y, Savich GL, He X, Mieczkowski P, Grimm SA, Perou CM, et al. MapSplice: accurate mapping of RNA-seq reads for splice junction discovery. Nucleic Acids Res. 2010b;38:e178. doi: 10.1093/nar/gkq622. [DOI] [PMC free article] [PubMed] [Google Scholar]
- Wang Y, Thomas A, Lau C, Rajan A, Zhu Y, Killian JK, Petrini I, Pham T, Morrow B, Zhong X, et al. Mutations of epigenetic regulatory genes are common in thymic carcinomas. Scientific reports. 2014;4:7336. doi: 10.1038/srep07336. [DOI] [PMC free article] [PubMed] [Google Scholar]
- Wilisch A, Gutsche S, Hoffacker V, Schultz A, Tzartos S, Nix W, Schalke B, Schneider C, Muller-Hermelink HK, Marx A. Association of acetylcholine receptor alpha-subunit gene expression in mixed thymoma with myasthenia gravis. Neurology. 1999;52:1460–1466. doi: 10.1212/wnl.52.7.1460. [DOI] [PubMed] [Google Scholar]
- Wilkerson MD, Hayes DN. ConsensusClusterPlus: a class discovery tool with confidence assessments and item tracking. Bioinformatics. 2010;26:1572–1573. doi: 10.1093/bioinformatics/btq170. [DOI] [PMC free article] [PubMed] [Google Scholar]
- Wilks C, Cline MS, Weiler E, Diehkans M, Craft B, Martin C, Murphy D, Pierce H, Black J, Nelson D, et al. Database (Oxford) 2014. The Cancer Genomics Hub (CGHub): overcoming cancer through the power of torrential data; p. 2014. [DOI] [PMC free article] [PubMed] [Google Scholar]
- Willcox N. Myasthenia gravis. Curr Opin Immunol. 1993;5:910–917. doi: 10.1016/0952-7915(93)90105-2. [DOI] [PubMed] [Google Scholar]
- Wolff AS, Karner J, Owe JF, Oftedal BE, Gilhus NE, Erichsen MM, Kampe O, Meager A, Peterson P, Kisand K, et al. Clinical and serologic parallels to APS-I in patients with thymomas and autoantigen transcripts in their tumors. J Immunol. 2014;193:3880–3890. doi: 10.4049/jimmunol.1401068. [DOI] [PMC free article] [PubMed] [Google Scholar]
- Ye K, Schulz MH, Long Q, Apweiler R, Ning Z. Pindel: a pattern growth approach to detect break points of large deletions and medium sized insertions from paired-end short reads. Bioinformatics. 2009;25:2865–2871. doi: 10.1093/bioinformatics/btp394. [DOI] [PMC free article] [PubMed] [Google Scholar]
- Zekeridou A, McKeon A, Lennon VA. Frequency of Synaptic Autoantibody Accompaniments and Neurological Manifestations of Thymoma. JAMA Neurol. 2016;73:853–859. doi: 10.1001/jamaneurol.2016.0603. [DOI] [PubMed] [Google Scholar]
- Zettl A, Strobel P, Wagner K, Katzenberger T, Ott G, Rosenwald A, Peters K, Krein A, Semik M, Muller-Hermelink HK, Marx A. Recurrent genetic aberrations in thymoma and thymic carcinoma. Am J Pathol. 2000;157:257–266. doi: 10.1016/S0002-9440(10)64536-1. [DOI] [PMC free article] [PubMed] [Google Scholar]
- Zucali PA, De Pas T, Palmieri G, Favaretto A, Chella A, Tiseo M, Caruso M, Simonelli M, Perrino M, De Vincenzo F, et al. Phase II Study of Everolimus in Patients With Thymoma and Thymic Carcinoma Previously Treated With Cisplatin-Based Chemotherapy. J Clin Oncol. 2017:JCO2017744078. doi: 10.1200/JCO.2017.74.4078. [DOI] [PubMed] [Google Scholar]
Associated Data
This section collects any data citations, data availability statements, or supplementary materials included in this article.
Supplementary Materials
Table S1 (related to Table 1). Clinical, pathological, and associated sample information of the 117 TETs studied in this analysis.