Abstract
The seasonal changes in brain size of some shrews represent the most drastic reversible transformation in the mammalian central nervous system known to date. Brain mass decreases 10–26% from summer to winter and regrows 9–16% in spring, but the underlying structural changes at the cellular level are not yet understood. Here, we describe the volumetric differences in brain structures between seasons and sexes of the common shrew (Sorex araneus) in detail, confirming that changes in different brain regions vary in the magnitude of change. Notably, shrews show a decrease in hypothalamus, thalamus, and hippocampal volume and later regrowth in spring, whereas neocortex and striatum volumes decrease in winter and do not recover in size. For some regions, males and females showed different patterns of seasonal change from each other. We also analyzed the underlying changes in neuron morphology. We observed a general decrease in soma size and total dendrite volume in the caudoputamen and anterior cingulate cortex. This neuronal retraction may partially explain the overall tissue shrinkage in winter. While not sufficient to explain the entire seasonal process, it represents a first step toward understanding the mechanisms beneath this remarkable phenomenon.
Electronic supplementary material
The online version of this article (10.1007/s00429-018-1666-5) contains supplementary material, which is available to authorized users.
Keywords: Brain mass, Tissue regeneration, Neuron atrophy, Dendritic plasticity, Brain anatomy, Dehnel’s phenomenon
Introduction
An animal’s brain structure and size arise from developmental mechanisms that are shaped by socioecological adaptations and life history (Striedter 2005). The brain functions related to behavior and cognitive processes, in particular, provide individuals with the capacity to adapt to environmental changes over the life span. But maintenance and function of brain tissue require large amounts of energy, using up a substantial proportion of individuals’ metabolic budget (Aiello and Wheeler 1995; Laughlin et al. 1998; Niven and Laughlin 2008). Therefore, the actual size of an animal’s brain and each of its constituent parts is likely the result of a trade-off between the advantages of higher computational capacity and the costs of energetic demands. However, the physiological and cellular mechanisms that lead to an optimal neural structure remain unclear (Bullmore and Sporns 2012).
Of particular interest for understanding these adaptive and energetic trade-offs are species exhibiting large variation of brain size between individuals or over the life span. Habitat seasonality provides predictable fluctuations in the environment and resource availability, which impact energy budget allocation. Consequently, seasonal changes in physiology and behavior of animals are often observed (but see Bolhuis and Macphail 2001). The best known examples of seasonal brain plasticity are found in some songbirds, where the size of song control nuclei changes in anticipation to the breeding season (Nottebohm 1981; Brenowitz et al. 1991; Smith et al. 1997; Tramontin et al. 1998). For example, in canaries the volume of the HVC increases by 50% from fall to spring, and the robust nucleus of the arcopallium (RA) increases by 43%, leading to a change in overall brain mass of 13% (Nottebohm 1981). In food hoarding black-capped chickadees, the hippocampus decreases by 17% during the non-hoarding season, when the spatial cognitive demands of food caching are reduced (Krebs et al. 1989; Barnea and Nottebohm 1994, 1996; Smulders et al. 1995; Bartkowska et al. 2008). The volumetric changes in the avian HVC and hippocampus have been associated with changes in cell numbers (Tramontin et al. 1998; Smulders et al. 2000); but changes in the RA are based on neuron size and spacing, as well as an increase in dendritic trees (Smith et al. 1997; Tramontin and Brenowitz 2000). Similar processes can also be found in food-hoarding mammals. The males of Richardson’s ground squirrel store food before hibernation, and hippocampal size increases by 15% during that period (Burger et al. 2013). Similarly, hippocampus volume increases during the caching period in gray squirrels (Lavenex et al. 2000b) and chipmunks (Barker et al. 2003). In contrast, fluctuations in hippocampal volume of mammals do not appear to be correlated with changes in total cell numbers (Lavenex et al. 2000a; Barker et al. 2003, 2005). Notably, during hibernation ground squirrels exhibit a reversible decrease in hippocampal dendrite arbors, as well as in the number and size of dendritic spines (Popov and Bocharova 1992; Popov et al. 1992), suggesting that dendritic and synaptic plasticity are important mechanisms underlying the volumetric reorganization. Seasonal brain changes in other mammals, including humans (Hofman and Swaab 1992), are restricted to the microstructure and biochemistry of hypothalamic (Hofman and Swaab 2002) and hippocampal regions (Magariños et al. 2006; Workman et al. 2009).
To learn more about the structural basis of adaptive brain size variability, we investigated the most extreme known case of individual seasonal variation in mammalian brain size and architecture. The brains of some species of red-toothed shrews (Sorex spp.) decrease in mass from summer to winter by 20% or more, followed by regrowth of ca. 15% (i.e., Dehnel’s Phenomenon; Bielak and Pucek 1960; Pucek 1965a; Yaskin 1994; Bartkowska et al. 2008). These changes are accompanied by correlated variation in braincase size (Dehnel 1949; Serafinski 1955; Caboń 1956; Bielak and Pucek 1960; Taylor et al. 2013; Lázaro et al. 2017), as well as the size of internal organs including the spleen and liver (Pucek 1965b), and the length of the spine (Hyvarinen 1969). The change in overall brain size dramatically affects brain architecture across seasons; in a Russian population of shrews, neocortex and hippocampus show the most profound winter decrease compared to other brain regions, while other regions remain stable in size or grow in the spring (Yaskin 1994). In parallel, cognitive skills also exhibit seasonal variability, with small-brained winter shrews showing lower spatial learning skills than both large-brained summer juveniles and spring adults (Lázaro et al. 2018). This result is congruent with winter decrease in the hippocampus and neocortex, as these regions process information on spatial cognition, cue sensitivity and memory. Similar to food-storing birds and ground squirrels, the changes in shrew brain and behavior have been attributed to different space use across the seasons (Lázaro et al. 2018). Individual territories are smaller during winter, but then expand during the breeding season in spring and summer (Stockley and Searle 1998; Yaskin 2005).
In this study we examined neuroanatomical reorganization underlying seasonal changes in brain size of a red-toothed shrew species, the common shrew (Sorex araneus). We first confirmed that overall brain size changes at our study site in southern Germany and measured the volumes of brain regions over the 1-year life span from individuals collected at this location. This was important as seasonal changes may vary in their extent based on the severity of local conditions and previous studies were carried out at higher latitudes (Pucek 1970). We therefore predicted a less pronounced seasonal change in our study population than in the northern populations. In addition, we analyzed the magnitude of change in each brain region. Since these differences might be driven by the changes in cognitive demands along the seasons, we expected to find a more intense winter decrease in regions with diminished functions during that period such as hippocampal and cortical areas. Furthermore, we expected that if overall brain size regrowth in spring is driven by territory expansion in preparation for reproduction, then sex differences would be evident, especially in the hippocampus as the expansion of territories in spring is more intense in males than in females (Stockley et al. 1994; Rychlik 1998; Stockley and Searle 1998; Yaskin 2005). Also, an important determinant for the differences between regional changes might be their differential flexibility. Ontogenetic timing can be a predictor of evolvability and plasticity (Finlay and Darlington 1995; Clancy et al. 2001); thus, we expected latter developed regions such as neo-, rhinal and piriform cortices to undergo more drastic changes. However, if the seasonal change is driven by a purely energetic constraint in winter, we then predict observing the least drastic winter decline in the least costly regions, i.e., thalamic regions, minimizing energy demands during the period of resource scarcity.
We assessed further whether the mechanisms of size variation were identifiable at the cellular level. A previous study found no evidence for changes in cell numbers in the hippocampus of shrews over the life span (Bartkowska et al. 2008). Thus, we predicted that size changes would be driven by differences in neuron morphology. To test this, we traced Golgi-impregnated neurons in several selected brain regions. At the cellular level, we expected to observe changes in the soma and/or dendritic morphology of seasonally changing regions that correlate with the magnitude of the change in the specific brain region.
This study makes an important contribution to understanding the link between brain size and the underlying anatomical structures in this unique mammalian species where such pronounced brain size variability occurs predictably within individuals over their life span.
Methods
Trapping and processing of specimens
Trapping took place monthly between August 2013 and October 2015 in Möggingen, Germany (longitude 8.994, latitude 47.766). Shrews were trapped with wooden live traps (PPUH A. Marcinkiewicz, Rajgród, Poland) baited with mealworms and checked at 2-h intervals. Once caught, we brought the shrews to the laboratory, where we perfused them transcardially with phosphate-buffered saline (PBS) followed by freshly prepared 4% formaldehyde in PBS under deep isoflurane anesthesia. We immediately extracted the brains from the skull, separated the hemispheres, and weighed them to the nearest 0.001 g before postfixation for 2 weeks in 4% buffered paraformaldehyde. We then transferred the tissue to PBS/0.1% sodium azide at 4 °C for long-term storage. The right hemisphere was used to reconstruct brain region volumes; the left hemisphere was used for Golgi staining and neuron morphology analyses.
Age and sex determination
Based on the time of the year and the degree of gonadal development (Churchfield 1990), we classified individuals into three age groups: summer juvenile (sexually immature, from June–September); winter subadult (sexually immature, from December–March); and spring–summer adult (sexually mature, from May–August). Because S. araneus has a maximum life span of ~ 18 months, there is no generation overlap of mature adults. During the very brief period of overlap between summer juveniles and adults, they can be easily distinguished by the degree of development of the gonads (Churchfield 1990).
To determine the sex of immature individuals (all individuals until the spring following the year of birth), we used a PCR-based gonosomal sexing method (Roos, DPZ Göttingen, unpublished). DNA was extracted from tail tip samples using standard DNeasy kits (Qiagen, GmbH, Hilden).
Calculation of brain region volumes
We quantified the volume of brain structure from ten individuals (five males and five females) of each age group (N = 30). Before sectioning, the left hemisphere was immersed in a series of 10, 20 and 30% sucrose in PBS for cryoprotection. We cut the tissue on a freezing sliding microtome (Reichert-Jung Hn-40) to obtain 30 µm-thick coronal sections. We mounted every fifth section on slides and stained them with 0.5% cresyl violet (Figs. 1, 2). We examined the following brain regions: olfactory bulb, neocortex, rhinal and piriform cortices, caudoputamen, amygdala, nucleus accumbens, thalamus, hypothalamus, hippocampus, dentate gyrus, CA1, CA2, CA3, subiculum and cerebellum and the total hemisphere. We located and defined these brain regions based on cytoarchitectural descriptions from insectivores (Catania et al. 1999; Catania 2000; Naumann et al. 2012). As a reference, we also used a mouse brain atlas (Paxinos and Franklin 2013). We used an Olympus BX51 microscope under an Olympus UIS2 Plan N 2× (NA = 0.02) dry objective interfaced with a Neurolucida software system (MBF Bioscience, Williston, VT, USA) to outline each brain region (Fig. 2). The system utilized a MicroFire Digital CCD 2 Megapixel camera (Optronics, Goleta, CA, USA) and an HP Z27i monitor with 2560 × 1440 resolution. The Cavalieri principle was used to calculate the volume of each region from the sum of brain region areas measured in each section multiplied by the interval distance and section thickness. Volumes were automatically calculated in the software extension Neurolucida Explorer.
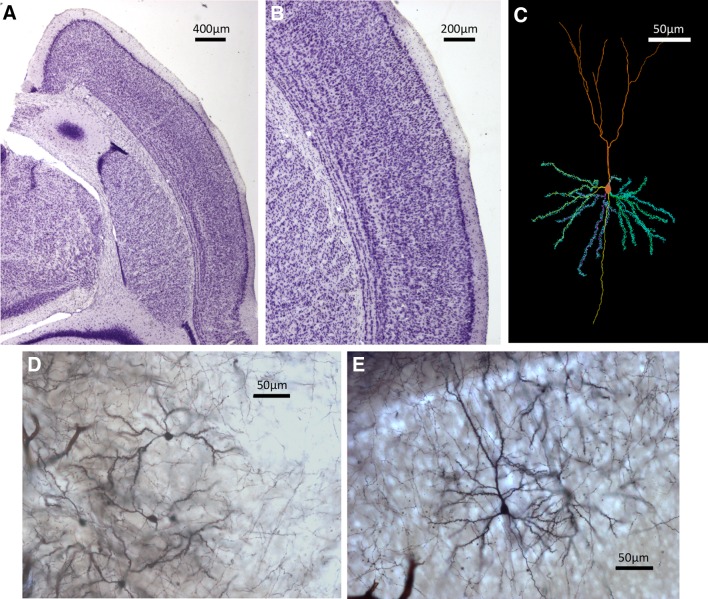
Fig. 1.
Examples of histological sections and neuron tracings. a Nissl-stained section of a shrew brain hemisphere showing a dorsal medial area. b Details of a Nissl-stained section depicting a portion of the neocortex. c Neuron tracing as depicted by Neurolucida. d Medium spiny neurons in the caudoputamen stained with the Golgi technique. e Pyramidal neurons in the neocortex
Fig. 2.
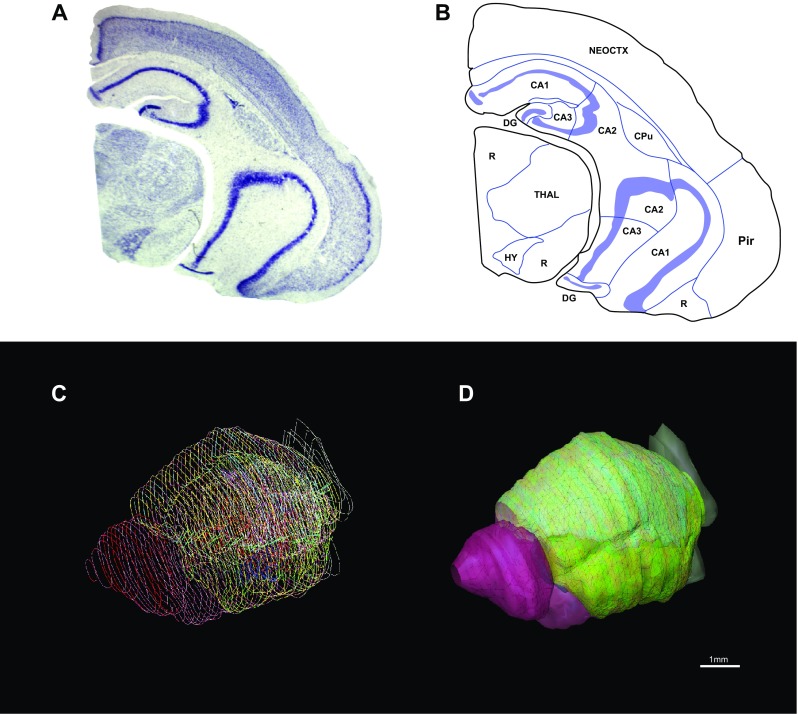
a Coronal section of a hemisphere stained with Nissl. b Outlines of the brain regions traced on a Nissl-stained section using Neurolucida software. NEOCTX neocortex, Pir piriform cortex, CPu caudoputamen, DG dentate gyrus, THAL thalamus, HY hypothalamus, R rest of brain. c Stack of all section outlines of a hemisphere. d 3D reconstruction of an hemisphere based on section outlines
A correction factor was used for each individual to account for the shrinkage occurring during the histological processing of the tissue (de Sousa et al. 2010). The correction factor for each brain was calculated as the quotient between the freshly extracted hemisphere volume and the final volume of that whole hemisphere derived from the measurement of outlined slides. The fresh hemisphere volume was calculated by dividing the fresh hemisphere mass by the specific gravity of brain tissue (1.036 g/cm3; Stephan 1960). Each brain-specific correction factor was then applied to the brain region volumes for that specimen.
The final volumes obtained for each brain region as well as whole hemispheres were size corrected dividing by the upper tooth row, a metric which is stable across seasons (Lázaro et al. 2017). All tracings were done blind by a single observer (MM).
Neuron tracing and quantification
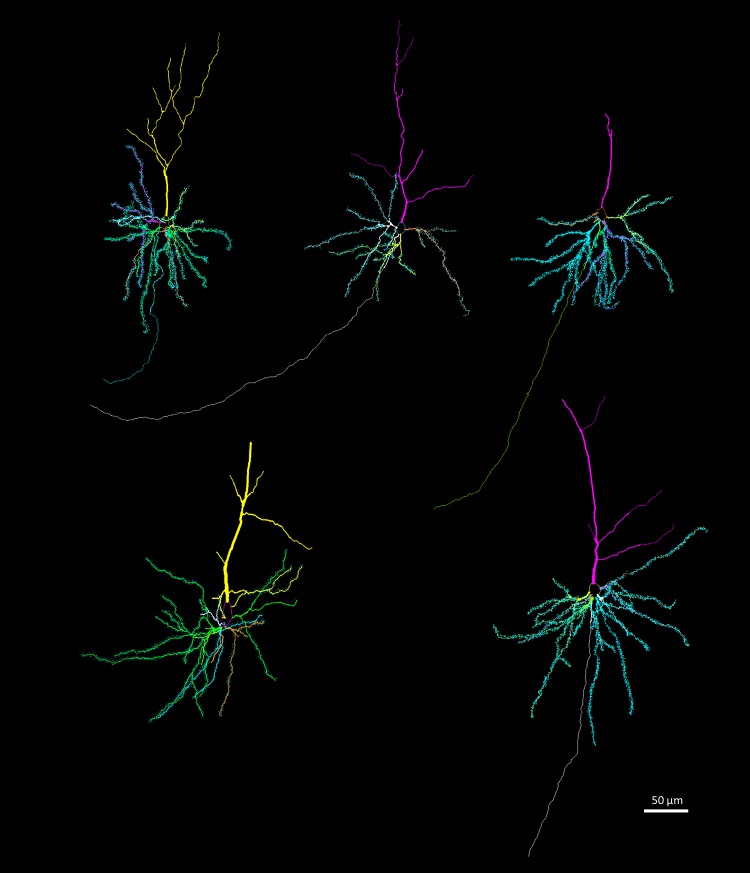
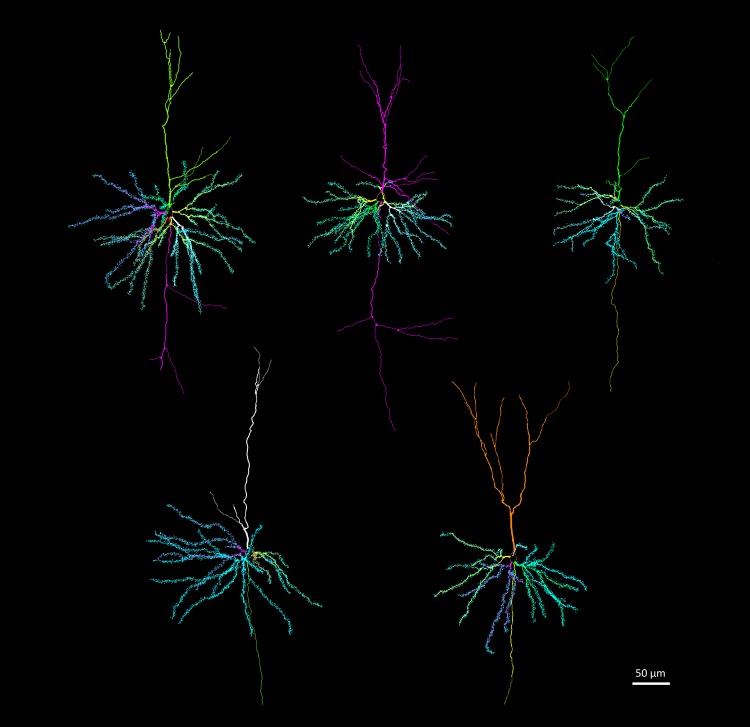
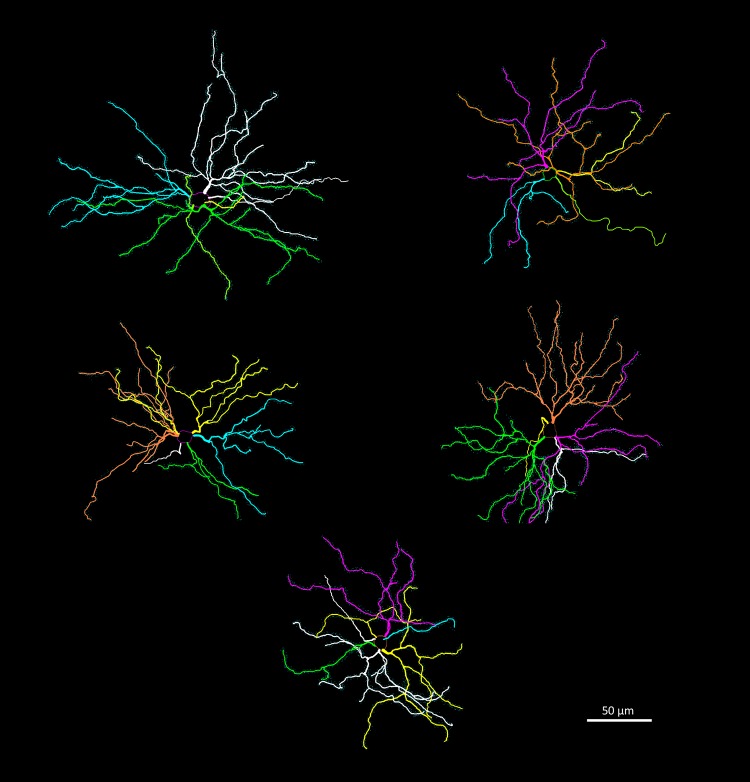
We used brains from five males of each of the three age groups (N = 15) to study neuron architecture. Right hemispheres were processed by a modified rapid Golgi technique (Scheibel and Scheibel 1978) (Fig. 1). After processing, they were cut coronally in two halves, and both tissue blocks were serially sectioned at 100 µm with a Vibratome. We focused on three types of neurons: pyramidal neurons of layer III–IV in the anterior cingulate cortex (Fig. 3) and in the somatosensory cortex (Fig. 4); and medium spiny neurons of the caudoputamen (Fig. 5). The brain regions were identified based on cytoarchitectural criteria and using the Nissl-stained sections as reference. The Golgi technique only stains a limited number of neurons randomly, which allows visualizing separated cells and their processes (Scheibel and Scheibel 1978). We selected neurons that appeared fully impregnated, isolated from other stained neurons, with their soma centered within the section thickness and which had as complete dendritic trees as possible (Fig. 1).
Fig. 3.
Examples of reconstructions of pyramidal neurons in the anterior cingulate cortex. Dendritic spines are indicated in the basal dendrites. Reconstructions were done in Neurolucida
Fig. 4.
Examples of reconstructions of pyramidal neurons in the somatosensory cortex. Dendritic spines are indicated in the basal dendrites. Reconstructions were done in Neurolucida
Fig. 5.
Examples of reconstructions of spiny neurons in the caudoputamen. Reconstructions were done in Neurolucida
We traced 25 neurons from each brain region per age group, randomly chosen—within the above criteria—among the five individuals in each age group (total = 225 neurons, 75 neurons of each neuron type). To avoid any possible bias, all neuron tracings were obtained by a single observer (JL) and performed blind to the individual and age group. Neurons were quantified along x-, y-, and z-coordinates using the Neurolucida system (see above) under an Olympus UIS2 Plan N 100× (NA = 1.25) oil objective. For each neuron, the soma was traced in the widest two-dimensional point to obtain its cross-sectional area and the dendritic tree was traced accounting for dendritic diameter, marking all bifurcations and quantifying all visible spines, without determining spine type. Incomplete dendrites that were cut in the section edge were not followed into the adjacent section and were marked as incomplete endings. We quantified the following metrics: soma size (area), total dendritic length and volume, spine number and density. All metrics were automatically extracted in Neurolucida Explorer. For the cortical neurons, only the basal dendrites were examined because often the apical dendrites were incomplete.
Data analyses
We analyzed the volumes of entire hemispheres using ANCOVA with age group, sex, and their interaction as explanatory variables. We used a linear mixed effects model to analyze the volumes of all brain regions, with age group, brain region and sex and their interactions as factors, and individual as random effect. To analyze the data from the neuron tracings, we used a linear mixed-effects model for all metrics (soma size, dendritic length, dendritic volume, number of spines and spine density), which were used as dependent variables, age group as factor, and individual was included as random effect. We analyzed each region (anterior cingulate cortex, somatosensory cortex and caudoputamen) separately.
To quantify the differences between age groups, and between age groups and sexes, we estimated probabilities of the differences (P) and 95% Bayesian credible intervals (CrI). We used Monte Carlo simulations to obtain 20,000 random values from the joint posterior distribution of the model parameters assuming flat prior distributions. We calculated 95% CrI as the 2.5 and 97.5% quantiles of the marginal posterior distributions of the parameters.
For the linear mixed models, we used the function lmer from the R package lme4 (Bates et al. 2014). For Monte Carlo simulations we used the function sim from the R package arm (Gelman and Su 2015). All analyses were performed in R 3.3.1. (R Core Team 2016).
Results
Brain region volumes
Total hemisphere volumes decreased on average by 16.1% from summer juveniles to winter subadults, and increased again by 9.8% from winter subadults to spring–summer adults (Fig. 6a, see absolute values in Online Resource Table S1 and a comparative example in Fig. 7). The winter decrease was more pronounced in females than males, which led to females with smaller brains during winter. The spring regrowth was similar for both sexes and thus adult females’ brains remained smaller than males among adults (Fig. 2a; Table 1).
Fig. 6.
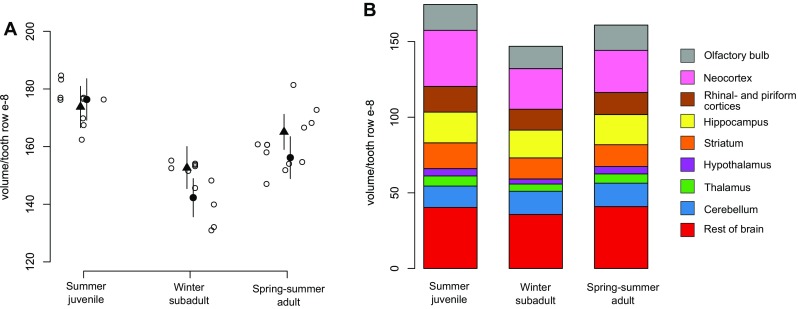
Seasonal changes in volume of brain and brain regions. a Volume of the entire brain hemisphere during the three age stages of the cycle, corrected by tooth row. Open circles represent individuals, triangles (males) and closed circles (females) are the means of each cycle stage, and bars are credible intervals. b Corrected volume for the entire brain and each brain region in the three stages. The area of each colored section represents the mean. See Table 1 for detailed results
Fig. 7.
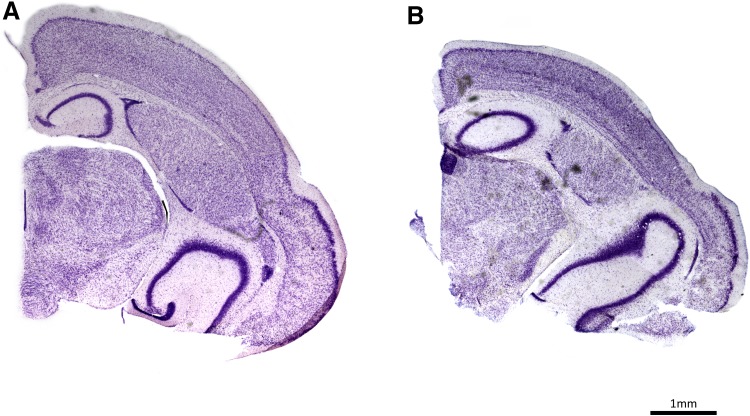
Exemplary brain coronal sections cut at a similar level in a summer juvenile (a) and a winter subadult (b) and depicted at the same scale
Table 1.
Corrected volumes for all brain regions during the three age stages, mean differences between stages and probabilities (P) of the difference from summer juveniles to winter subadults (s–w) and from winter subadults to spring–summer adults (w–a) as calculated from the posterior distributions
| Summer juvenile | Winter subadult | Spring–summer adult | Difference summer–winter | P(s–w) | Difference winter–adult | P(w–a) | ||||
|---|---|---|---|---|---|---|---|---|---|---|
| Mean ± SD | 95% CrI | Mean ± SD | 95% CrI | Mean ± SD | 95% CrI | |||||
| Brain hemisphere | 175.1 ± 6.8 | 169.6/180.6 | 147.0 ± 8.9 | 141.7/152.3 | 161.3 ± 9.6 | 156.4/166.4 | − 28.1 (− 16.1%) | > 0.99 | 14.3 (9.8%) | > 0.99 |
| Males | 173.8 ± 6.4 | 166.6/181.1 | 152.6 ± 2.7 | 145.3/159.8 | 165.1 ± 9.5 | 158.9/171.3 | − 21.2 (− 12.8%) | > 0.99 | 12.5 (8.2%) | > 0.99 |
| Females | 176.4 ± 7.7 | 169.1/183.6 | 142.3 ± 9.7 | 135.7/148.9 | 156.2 ± 7.7 | 149.0/163.3 | − 34.1 (− 19.3%) | > 0.99 | 13.9 (9.8%) | > 0.99 |
| Rest of brain | 40.3 ± 3.7 | 38.8/41.9 | 35.7 ± 5.3 | 34.3/37.2 | 40.9 ± 3.6 | 39.5/42.3 | − 4.6 (− 11.5%) | 0.99 | 5.2 (14.5%) | > 0.99 |
| Males | 41.1 ± 3.2 | 38.9/43.1 | 36.1 ± 1.7 | 34.0/38.2 | 43.1 ± 2.1 | 41.3/44.9 | − 5.0 (− 12.1%) | 0.97 | 7.0 (19.4%) | > 0.99 |
| Females | 39.6 ± 4.5 | 37.5/41.8 | 35.4 ± 7.4 | 33.5/37.3 | 37.8 ± 3.0 | 35.7/39.9 | − 4.2 (− 10.6%) | 0.95 | 2.4 (6.8%) | 0.83 |
| Cerebellum | 14.2 ± 3.5 | 12.7/15.8 | 15.3 ± 3.7 | 13.9/16.8 | 15.5 ± 3.0 | 14.1/16.9 | 1.1 (8.0%) | 0.22 | 0.2 (1.1%) | 0.55 |
| Males | 15.6 ± 1.6 | 13.5/17.7 | 18.6 ± 2.3 | 16.5/20.7 | 14.7 ± 3.3 | 12.9/16.4 | 3.0 (19.0%) | 0.05 | − 3.9 (− 21.0%) | 0.01 |
| Females | 12.7 ± 4.4 | 10.7/14.8 | 12.6 ± 1.7 | 10.7/14.5 | 16.6 ± 2.3 | 14.5/18.7 | − 0.2 (− 1.2%) | 0.54 | 4.0 (31.9%) | 0.99 |
| Thalamus | 6.7 ± 1.5 | 5.1/8.2 | 4.8 ± 0.7 | 3.3/6.3 | 6.1 ± 1.0 | 4.7/7.5 | − 1.9 (− 27.9%) | > 0.99 | 1.3 (27.5%) | > 0.99 |
| Hypothalamus | 4.9 ± 1.8 | 3.3/6.4 | 3.3 ± 2.3 | 1.8 /4.8 | 4.9 ± 2.0 | 3.5/6.3 | − 1.5 (− 31.6%) | > 0.99 | 1.6 (47.8%) | > 0.99 |
| Striatum | 17.0 ± 2.3 | 15.5/18.6 | 13.9 ± 1.2 | 12.5/15.4 | 14.4 ± 1.8 | 13.0/15.8 | − 3.1 (− 18.2%) | > 0.99 | 0.5 (3.5%) | 0.74 |
| Hippocampus | 20.3 ± 1.8 | 18.8/21.9 | 18.4 ± 2.3 | 16.9/19.9 | 20.0 ± 2.0 | 18.5/21.4 | − 1.9 (− 9.5%) | 0.98 | 1.5 (8.4%) | 0.96 |
| Rhinal and piriform c | 17.0 ± 1.8 | 15.4/18.5 | 13.8 ± 0.9 | 12.3/15.3 | 14.5 ± 1.7 | 13.1/16.0 | − 3.2 (− 18.7%) | > 0.99 | 0.8 (5.4%) | 0.88 |
| Neocortex | 37.1 ± 3.0 | 35.6/38.7 | 26.9 ± 1.8 | 25.4/28.3 | 27.9 ± 3.9 | 26.5/29.3 | − 10.3 (− 27.7%) | > 0.99 | 1.0 (3.7%) | 0.78 |
| Olfactory b | 17.1 ± 3.0 | 15.6/18.6 | 14.8 ± 1.4 | 13.3/16.2 | 16.8 ± 2.2 | 15.3/18.2 | − 2.3 (− 13.7%) | 0.99 | 2.0 (13.6%) | 0.98 |
| Males | 15.8 ± 2.4 | 13.7/17.9 | 15.9 ± 0.8 | 13.4/18.1 | 17.9 ± 2.1 | 16.1/19.6 | 0.1 (0.7%) | 0.47 | 1.9 (12.1%) | 0.95 |
| Females | 18.4 ± 3.3 | 16.3/20.5 | 13.8 ± 1.1 | 11.9/15.7 | 15.2 ± 1.1 | 13.1/17.3 | − 4.6 (− 25.1%) | > 0.99 | 1.4 (10.4%) | 0.88 |
The values of each sex are depicted only for the regions where differences were found. The values are volumes divided by tooth row (µm3/ mm)
When comparing brain region volumes among the age classes with Bayesian statistics, there was significant variation, with some regions undergoing more intense changes than others (Figs. 6b, 8; Table 1). The region showing the most intense changes in both directions was the hypothalamus (− 31.6%/+47.8%, respectively), followed by the thalamus (− 27.9%/+27.5%). Striatum volume decreased strongly from summer to winter by 18.2%, but did not regrow in spring. This decrease was mainly explained by a decrease in the caudoputamen by 20.7%, but no statistically obvious changes in nucleus accumbens and amygdala (Fig. 9, Online Resource Table S2). The hippocampus contributed to both winter decrease and spring regrowth in volume (− 9.5%/+8.4%), although we found different patterns between hippocampal subregions (Fig. 10, Online Resource Table S3): CA2 (− 15.8%/+24.2%) and dentate gyrus (− 15.2%/+15.6%) displayed marked changes in volume, while the change in CA1 was less pronounced (− 12.6%/+13.5%) and CA3 and subiculum did not change. Both sexes underwent a pronounced decline in CA1 from summer to winter, but only the CA1 of males regrew in spring by 18.4%, leading to sexual dimorphism in adult CA1. The large neocortex showed one of the most intense proportional decreases (− 27.7%) and thus the highest absolute change from summer to winter, although it did not regrow in spring. The rhinal and piriform cortices exhibited a profound winter decline (18.7%) and a clear but less intense spring regrowth (5.4%). We also found a seasonal, reversible (− 13.7%/+13.6%), but sexually dimorphic, pattern in the olfactory bulb, with winter and spring females showing 13.7 and 14.9% lower volumes, respectively. The cerebellum followed a different and more complex pattern. Cerebellar volume was sexually dimorphic in winter animals. Winter females had a 32.2% smaller cerebellum than males, but in spring the females’ cerebellum increased and reached a similar size to males again (Fig. 8; Table 1). The volume of the remaining brain areas measured altogether (“Rest of brain” in Figs. 6, 8; Table 1) followed the pattern of summer-to-winter decrease and the winter-to-spring regrowth. The regrowth was more intense in males than in females, leading to sexual dimorphism in adults.
Fig. 8.
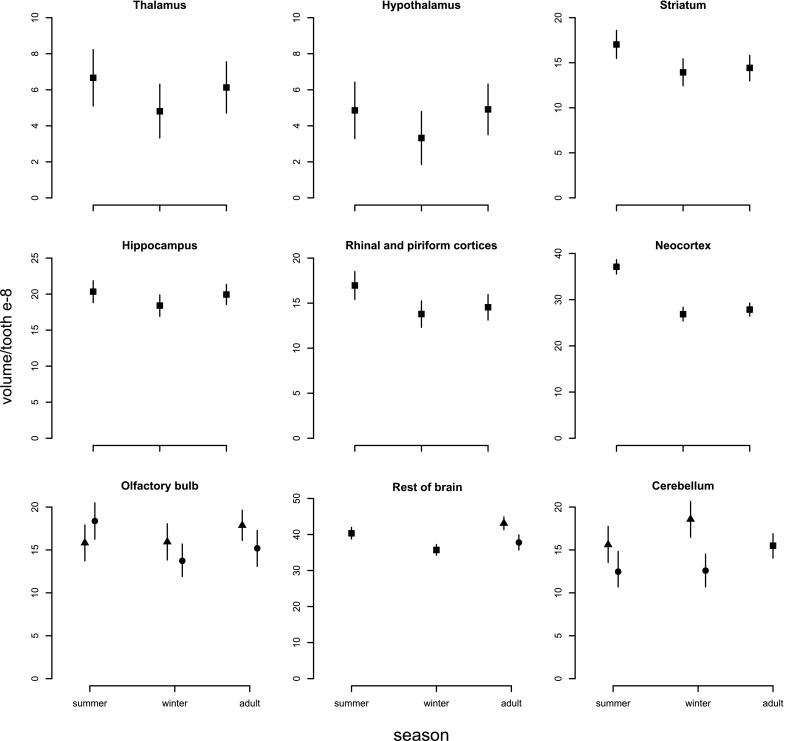
Seasonal changes in the volume of brain regions. Means at each stage and, whenever different, sex are represented by triangles (males) and closed circles (females). The mean of both sexes is depicted (squares) at the stages with no difference between sexes. Bars are credible intervals
Fig. 9.
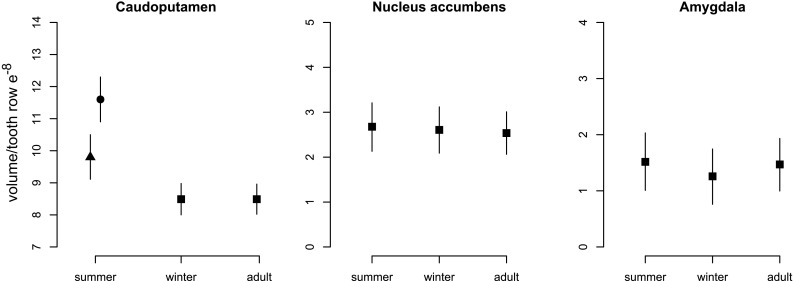
Seasonal changes in the volume of striatal subregions. Means at each stage and sex are represented by triangles (males) and closed circles (females). The mean of both sexes is depicted (squares) at the stages with no difference between sexes. Bars are credible intervals
Fig. 10.
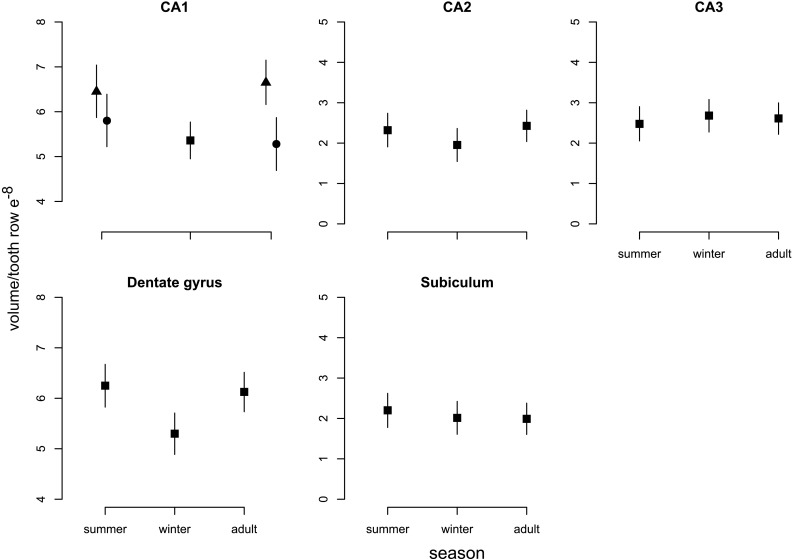
Seasonal changes in the volume of hippocampal subregions. Means at each stage and sex are represented by triangles (males) and closed circles (females). The mean of both sexes is depicted (squares) at the stages with no difference between sexes. Bars are credible intervals
Neuron tracing
Our results from the neuron tracings reveal patterns of variation between age groups in the three brain regions we examined (Fig. 11; Table 2). In the caudoputamen, we found a steady decline in all dendritic (21.8% in length and 32.9% in volume), soma (28.1%) and spine (37.1% in spine number and 18.4% in density) measures. This decline was more pronounced in the first phase (summer juvenile to winter subadult) than in the second phase (winter subadult to spring–summer adult) (Table 2). In contrast, the somatosensory cortex only showed a marked decline from summer to winter in soma size (17.7%) and in spine density (15.2%) from winter to adult. We also found a substantial decrease in soma size in the anterior cingulate cortex by 19.9%. In addition, in the anterior cingulate cortex there was a decrease from summer to winter in dendrite volume by 25.0%.
Fig. 11.
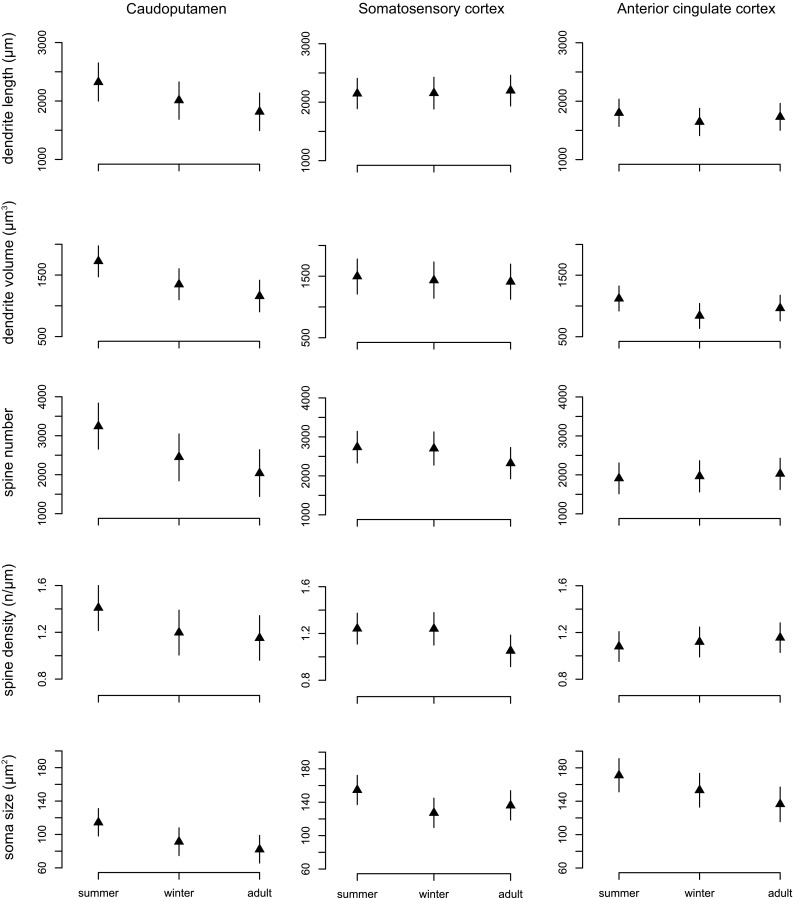
Seasonal changes in dendrite morphology and spine numbers. Graphs depict the results on the median spiny neurons of the caudoputamen (right column) and pyramidal neurons of the somatosensory (central column) and anterior cingulate cortices (right column). Triangles represent the means at each stage (all males) and bars are credible intervals
Table 2.
Mean values derived from neuron morphology during the three age stages, and mean differences between stages and probabilities (P) of the difference from summer juveniles to winter subadults (s–w) and from winter subadults to spring–summer adults (w–a) as calculated from the posterior distributions
| Summer juvenile | Winter subadult | Spring–summer adult | Difference summer–winter | P(s–w) | Difference winter–adult | P(w–a) | ||||
|---|---|---|---|---|---|---|---|---|---|---|
| Mean ± SD | 95% CrI | Mean ± SD | 95% CrI | Mean ± SD | 95% CrI | |||||
| Somatosensory cortex | ||||||||||
| Dendrite length (µm) | 2148 ± 418 | 1882/2409 | 2155 ± 660 | 1884/2425 | 2199 ± 595 | 1934/2463 | 7 (0.3%) | 0.38 | 44 (2.0%) | 0.46 |
| Dendr. volume (µm3) | 1498 ± 477 | 1214/1782 | 1433 ± 554 | 1145/1732 | 1410 ± 483 | 1127/1700 | − 65 (− 4.3%) | 0.62 | − 23 (− 1.6%) | 0.54 |
| Soma size (µm2) | 155 ± 36 | 137/172 | 127 ± 29 | 109/146 | 136 ± 32 | 119/153 | − 28 (− 17.7%) | 0.99 | 9 (7.0%) | 0.75 |
| Spine number | 2736 ± 1057 | 2332/3134 | 2703 ± 964 | 2283/3132 | 2324 ± 926 | 1918/2727 | − 33 (− 1.2%) | 0.46 | − 379 (− 14.0%) | 0.10 |
| Spine density (n/µm) | 1.2 ± 0.3 | 1.1/1.4 | 1.2 ± 0.3 | 1.1/1.4 | 1.1 ± 0.3 | 0.9/1.2 | < 0.1 (− 0.1%) | 0.51 | − 0.2 (− 15.2%) | 0.97 |
| Cingulate cortex | ||||||||||
| Dendrite length (µm) | 1799 ± 521 | 1568/2035 | 1645 ± 720 | 1415/1874 | 1731 ± 470 | 1498/1959 | − 154 (− 8.6%) | 0.83 | 86 (5.2%) | 0.70 |
| Dendr. volume (µm3) | 1120 ± 456 | 916/1320 | 841 ± 357 | 637/1041 | 965 ± 282 | 756/1174 | − 279 (− 25.0%) | 0.97 | 124 (14.8%) | 0.80 |
| Soma size (µm2) | 171 ± 42 | 151/191 | 153 ± 32 | 133/173 | 137 ± 23 | 116/158 | − 18 (− 10.4%) | 0.89 | − 17 (− 10.9%) | 0.87 |
| Spine number | 1912 ± 689 | 1519/2307 | 1965 ± 1365 | 1562/2366 | 2028 ± 821 | 1623/2435 | 53 (2.8%) | 0.57 | 63 (3.2%) | 0.58 |
| Spine density (n/µm) | 1.1 ± 0.3 | 1.0/1.2 | 1.1 ± 0.4 | 1.0/1.3 | 1.2 ± 0.3 | 1.0/1.3 | < 0.1 (3.6%) | 0.34 | < 0.1 (3.3%) | 0.34 |
| Caudoputamen | ||||||||||
| Dendrite length (µm) | 2324 ± 672 | 2003/2645 | 2013 ± 453 | 1688/2342 | 1817 ± 549 | 1494/2137 | − 311 (− 13.4%) | 0.91 | − 196 (− 9.7%) | 0.80 |
| Dendr. volume (µm3) | 1725 ± 543 | 1472/1978 | 1348 ± 405 | 1093/1604 | 1157 ± 309 | 899/1412 | − 377 (− 21.9%) | 0.98 | − 191 (− 14.2%) | 0.98 |
| Soma size (µm2) | 114 ± 37 | 98/131 | 91 ± 21 | 74/108 | 82 ± 9 | 65/99 | − 23 (− 20.2%) | 0.97 | − 9 (− 10.1%) | 0.78 |
| Spine number | 3243 ± 1105 | 2644/3842 | 2453 ± 930 | 1859/3060 | 2038 ± 503 | 1444/2637 | − 790 (− 24.4%) | 0.97 | − 415 (− 16.9%) | 0.83 |
| Spine density (n/µm) | 1.4 ± 0.3 | 1.2/1.6 | 1.2 ± 0.3 | 1.0/1.4 | 1.2 ± 0.2 | 1.0/1.3 | − 0.2 (− 15.0%) | 0.94 | − 0.05 (− 3.9%) | 0.64 |
Discussion
Changes in volume of brain regions
Our results confirm the seasonal pattern of change in the volume of overall brain hemispheres of red-toothed shrews in Southern Germany that was previously reported from Russia and Poland (Bielak and Pucek 1960; Yaskin 1994). However, as expected, the pattern was expressed less strongly: the winter decline was 5.1% less pronounced than in north Poland (Pucek 1965b) and 10.2% less than in the Moscow region (Yaskin 1994). We found a decrease of 16.1% from summer juveniles to winter subadults and a subsequent increase by 9.8% in spring-summer adults. The decline in volume from juveniles to subadults happens in anticipation of winter and hence cannot be seen as an immediate reaction to temperature or food availability, but is more likely genetically encoded. When we analyzed the volume of each brain region separately, we observed that the different brain structures varied in the magnitude of change. Also, in some brain regions, seasonal changes varied between the sexes.
In the mammalian brain, we expect to find positive allometric correlations between overall brain size and each region caused by functional and/or developmental constraints (Finlay and Darlington 1995; Yopak et al. 2010; Charvet et al. 2011). In our results, as the brains varied in size seasonally, each region’s size changed—or remained unchanged—independently of others. This variation might correspond to a mosaic adaptive development, which results in brain structure volumes that dynamically adjust to match the current cognitive demands and energetic constraints of the individuals. For example, summer juveniles would need to meet different cognitive requirements regarding territorial and reproductive behavior as they disperse and compete for territories (Moraleva and Telitzina 1994) than winter subadults, which minimize movement and social interactions to conserve energy. Cognitive demands would be different again in spring adults when shrews expand their home ranges for mate searching (Yaskin 2005; Gonda et al. 2013). This is consistent with our finding that in the winter, shrews underwent a decrease in hippocampal volume followed by regrowth in spring (Fig. 8). In other polygamous species where males show a greater expansion of home range than females, this has been linked to higher performance of males in spatial tests (Gaulin and Fitzgerald 1989; Galea et al. 1996). This is also congruent with the sexual dimorphism we found in the CA1 of adults (Fig. 10), as male common shrews enlarge their ranges more than females do (Stockley et al. 1994; Rychlik 1998; Stockley and Searle 1998). Furthermore, such a functional adaptive explanation is at least partially consistent with the observed decline in cortical regions in the winter. However, the lack of spring regrowth of the neocortex and the fairly extreme seasonal changes in other parts of the brain that are not associated with foraging and social functions, such as the thalamic regions, remain difficult to account for.
Differences in the potential for plasticity between brain structures may also play an important role in constraining the pattern of seasonal variation in regional volumes that can occur. In a mammal with the usual curve of unidirectional brain growth (Dobbing and Sands 1973, 1979), the late developed regions—those where neurogenesis peaks occur later in ontogeny—tend to develop larger since they undergo more rounds of neurogenesis (Finlay and Darlington 1995; Clancy et al. 2001). This could translate into different capacities between regions to undergo plastic changes across seasons. Based on this, we expected the most plastic (latest developed) brain region to reveal the most drastic changes between seasons. However, ontogenetic timing does not seem to determine the intensity of change in our shrews’ brain regions either, as both early (e.g., thalamus) and late developing regions (e.g., neocortex) (Clancy et al. 2001) showed high seasonal variation. Attention should also be drawn to the changes in the cerebellum, which is one of the regions to develop latest in the mammalian brain: the sexual dimorphism in winter, which disappears later in adulthood, seems to be the result of differential timing in development between males and females. Consequently, male shrews reach adult cerebellar size earlier than females in ontogeny (Suárez et al. 1992; Fan et al. 2010; Tiemeier et al. 2011).
Regardless of the pattern of change, energetic limitations are likely to be a primary driver of variability in overall brain size across seasons. Energetic costs of brain computation function and tissue maintenance are extraordinarily high when compared to other physiological processes in different tissues (McNab and Eisenberg 1989; Aiello and Wheeler 1995; Laughlin et al. 1998). This energetic demand is considered an important constraint for development and evolution of brain size (Niven and Laughlin 2008; Bullmore and Sporns 2012). For this reason, the winter decrease in overall brain size of shrews has most commonly been proposed to be a strategy to reduce metabolic consumption during that period (Mezhzherin 1964; Pucek 1970), when food quality is lower (Churchfield et al. 2012) and therefore energy supply becomes a more limiting factor. Consequently, given that different brain structures have different metabolic demands due to their cellular architecture and activity level, we expected those brain regions with the highest metabolic costs to show the most pronounced winter shrinkage. However, such a scenario is unlikely to be the only explanation, based on our results: the magnitude of change of the different regions does not correlate to their metabolic scaling slope (Kaufman 2004; Karbowski 2007). For example, the thalamus which undergoes the strongest seasonal change shows one of the lowest mass-specific metabolic rates among brain regions (Kaufman 2004). Also, it does not explain why some regions do not regrow in the second spring/summer, when food availability is the same for adults and juveniles. Therefore, although energy limitation is probably an important factor to determine the changes in overall brain size, it fails to completely explain the patterns in the different regions.
Although the overall seasonal variation in brain size may be caused by energetic limitation in winter, the variation in the different brain structures appears to be due to a combination of functional adaptations, as well as developmental constraints on plasticity. The size of each brain region is influenced by these factors to different degrees, and these influences may be different in the decrease and regrowth phases of the cycle.
Variation in neuron size and morphology
Our results on neuron morphology partially supported our expectations in the caudoputamen, but not in the cortical areas. The decline in caudoputamen volume from summer to winter (Fig. 9) was paralleled by a decrease in medium spiny neuron dendrite length and volume, spine number and soma size (Fig. 6; Table 2). These morphological changes resulted in neuronal retraction, which may have contributed to the observed decrease in the volume of the caudoputamen. We found a decrease in dendritic arbor length only in the anterior cingulate cortex. However, together with the decline in soma size in both the anterior cingulate and somatosensory cortices (Fig. 6; Table 2), this is unlikely to explain the − 27.7% volume reduction in the neocortex, of which the somatosensory area makes up a large portion (Catania 2000). One possibility is that greater changes in dendritic trees might be located in other cortical areas, cell layers and/or neuron types. For pyramidal neurons where we assessed the morphology of basal dendrites, part of the seasonal variation in volume could be hidden in the apical dendrites. Also, we must consider alternative mechanisms that affect tissue volume. Because of methodological limitations, we did not quantify axon size and density in this study. In addition, seasonal variation in cell numbers through cell death during autumn and cell recruitment in spring in the olfactory bulbs and dentate gyrus do not substantially contribute to the overall chance in hippocampus mass (Bartkowska et al. 2008). Adult neurogenesis in certain brain regions is a common process in mammals, but the rate of cell proliferation varies between species (Amrein 2015). Sorex shrews are an exceptional case with no adult neurogenesis in the dentate gyrus, in contrast with most of mammals (Bartkowska et al. 2008). Other brain regions have not yet been investigated for adult neurogenesis in shrews. But based on previous knowledge, the presence of adult neuron recruitment in other regions except potentially the olfactory bulb is unlikely (Amrein 2015). Volumetric changes are more likely to occur in the neuropil, which makes up the space between cells (Spocter et al. 2012). Finally, mammalian brains show high variation in white matter over the lifetime (Marner et al. 2003). Therefore, future research should assess the seasonal variation in axonal innervation and the energetically costly myelin. If Dehnel’s phenomenon is an energy saving process, myelin would be expected to decrease in winter. Nonexclusively, in a less energetically demanding tissue, we would predict a decrease in the circulatory system to transports nutrients. Thus, we might observe a decrease in the density of microvessels, which may also impact tissue volume (Farkas and Luiten 2001).
Natural processes of neuron shrinkage are not uncommon over the course of ontogeny. During early development of most regions in the vertebrate nervous system, there is a phase of initial overproduction of dendrites and synapses, followed by a period of elimination of surplus connections in an activity-dependent manner (Cowan et al. 1984; Clarke 1990). But this refinement phase often takes place at a perinatal stage in mammals, shortly after birth. In shrews, brain shrinkage is postnatal and lasts seven months, which constitutes half of their life span (Pucek 1970; Churchfield 1990). Dendritic and synaptic elimination do not seem to contribute significantly to the overt volumetric changes that are observed within brain regions in these shrews. There are also abundant instances of brain tissue deterioration in senescent mammals, including humans (Raz et al. 2005). This aging decrease in tissue volume correlates with neuron atrophy, which is caused by a decrease in soma size and in dendritic arbors and spine numbers, both in the neocortex and hippocampus (Geinisman et al. 1978; Anderson and Rutledge 1996; Smith et al. 1999; Dickstein et al. 2007). Such changes in neuron morphology have been linked to a non-pathological decrease in cognitive performance during aging in mammals (Duan et al. 2003; Burke and Barnes 2006). These cellular and cognitive changes might be comparable to the seasonal differences that we found between summer juveniles and winter subadults in brain morphology and cognition (Lázaro et al. 2018). Winter subadults performed more poorly than summer juveniles and adults in a learning test (Lázaro et al. 2018).
The seasonal brain shrinkage and regrowth that we describe result in a dramatic change in size and reorganization of neuroanatomy. Future research on these seasonal brain changes in shrews may lead toward biological and medical applications. The reversibility and rapid remodeling of brain tissue architecture make the common shrew an optimal model for studying possible mechanisms to invert degenerative processes in the nervous system. Furthermore, the connection of brain structure with environmental fluctuations can provide insights into the ecological pressures that shape the development and evolution of the mammalian brain.
Electronic supplementary material
Below is the link to the electronic supplementary material.
Acknowledgements
Open access funding provided by Max Planck Society. We thank Irmgard Amrein and Jan Taylor for their valuable input to the design of the study; and Alexander Bruttel, Sebastian Rikker, Lara Keicher, Cheryl Stimpson, Sebastian Stockmaier and Julian Wanner for their help in the field and laboratory.
Author contributions
JL, MH, CCS and DKND designed the study and wrote the paper; JL performed the neuron tracings and analyzed the data; MM performed the 3D brain reconstructions; DKND and MH conceived the project; all authors contributed to the final draft of the manuscript.
Funding
This study was funded by the Max Planck-Poland Biodiversity Initiative.
Compliance with ethical standards
Conflict of interest
The authors declare that they have no conflict of interest.
Ethical approval
All applicable international, national, and/or institutional guidelines for the care and use of animals were followed. All handling and sampling methods were approved by the Regierungspräsidium Freiburg, Baden-Württemberg (35-9185.81/G-11/21). This article does not contain any studies with human participants performed by any of the authors.
Footnotes
Electronic supplementary material
The online version of this article (10.1007/s00429-018-1666-5) contains supplementary material, which is available to authorized users.
References
- Aiello LC, Wheeler P. The expensive-tissue hypothesis. Curr Anthropol. 1995;36:199–221. doi: 10.1086/204350. [DOI] [Google Scholar]
- Amrein I. Adult hippocampal neurogenesis in natural populations of mammals. Cold Srping Harb Perspect Biol. 2015;7:a021295. doi: 10.1101/cshperspect.a021295. [DOI] [PMC free article] [PubMed] [Google Scholar]
- Anderson B, Rutledge V. Age and hemisphere effects on dendritic structure. Brain. 1996;119:1983–1990. doi: 10.1093/brain/119.6.1983. [DOI] [PubMed] [Google Scholar]
- Barker JM, Boonstra R, Schulte-Hostedde AI. Age determination in yellow-pine chipmunks (Tamias amoenus): a comparison of eye lens masses and bone sections. Can J Zool. 2003;81:1774–1779. doi: 10.1139/z03-173. [DOI] [Google Scholar]
- Barker JM, Wojtowicz JM, Boonstra R. Where’s my dinner? Adult neurogenesis in free-living food-storing rodents. Genes Brain Behav. 2005;4:89–98. doi: 10.1111/j.1601-183X.2004.00097.x. [DOI] [PubMed] [Google Scholar]
- Barnea A, Nottebohm F. Seasonal recruitment of hippocampal neurons in adult free-ranging black-capped chickadees. Proc Natl Acad Sci USA. 1994;91:11217–11221. doi: 10.1073/pnas.91.23.11217. [DOI] [PMC free article] [PubMed] [Google Scholar]
- Barnea A, Nottebohm F. Recruitment and replacement of hippocampal neurons in young and adult chickadees: an addition to the theory of hippocampal learning. Proc Natl Acad Sci USA. 1996;93:714–718. doi: 10.1073/pnas.93.2.714. [DOI] [PMC free article] [PubMed] [Google Scholar]
- Bartkowska K, Djavadian RL, Taylor JRE, Turlejski K. Generation recruitment and death of brain cells throughout the life cycle of Sorex shrews (Lipotyphla) Eur J Neurosci. 2008;27:1710–1721. doi: 10.1111/j.1460-9568.2008.06133.x. [DOI] [PubMed] [Google Scholar]
- Bates D, Mächler M, Bolker BM, Walker SC. Fitting linear mixed-effects models using lme4. J Stat Softw. 2014;67:1–48. [Google Scholar]
- Bielak T, Pucek Z. Seasonal changes in the brain weight of the common shrew (Sorex araneus Linnaeus: 1758) Acta Theriol. 1960;13:297–300. [Google Scholar]
- Bolhuis JJ, Macphail EM. A critique of the neuroecology of learning and memory. Trends Cogn Sci. 2001;5:426–433. doi: 10.1016/S1364-6613(00)01753-8. [DOI] [PubMed] [Google Scholar]
- Brenowitz E, Nalls B, Wingfield JC, Kroodsma DE. Seasonal changes in avian song nuclei without seasonal changes in song repertoire. J Neurosci. 1991;11:1367–1374. doi: 10.1523/JNEUROSCI.11-05-01367.1991. [DOI] [PMC free article] [PubMed] [Google Scholar]
- Bullmore E, Sporns O. The economy of brain network organization. Nat Rev Neurosci. 2012;13:336–349. doi: 10.1038/nrn3214. [DOI] [PubMed] [Google Scholar]
- Burger DK, Saucier JM, Iwaniuk AN, Saucier DM. Seasonal and sex differences in the hippocampus of a wild rodent. Behav Brain Res. 2013;236:131–138. doi: 10.1016/j.bbr.2012.08.044. [DOI] [PubMed] [Google Scholar]
- Burke SN, Barnes CA. Neural plasticity in the ageing brain. Nat Rev Neurosci. 2006;7:30–40. doi: 10.1038/nrn1809. [DOI] [PubMed] [Google Scholar]
- Caboń K. Untersuchungen über die saisonale Veränderlichkeit der Gehirnes bei der kleinen Spitsmaus (Sorex minutus minutus L.) Ann Univ Marie Curie Sklodowska Sect C. 1956;10:93–105. [Google Scholar]
- Catania KC. Cortical organization in insectivora: the parallel evolution of the sensory periphery and the brain. Brain Behav Evol. 2000;55:311–321. doi: 10.1159/000006666. [DOI] [PubMed] [Google Scholar]
- Catania KC, Lyon DC, Mock OB, Kaas JH. Cortical organization in shrews: evidence from five species. J Comp Neurol. 1999;410:55–72. doi: 10.1002/(SICI)1096-9861(19990719)410:1<55::AID-CNE6>3.0.CO;2-2. [DOI] [PubMed] [Google Scholar]
- Charvet CJ, Striedter GF, Finlay BL. Evo-devo and brain scaling: candidate developmental mechanisms for variation and constancy in vertebrate brain evolution. Brain Behav Evol. 2011;78:248–257. doi: 10.1159/000329851. [DOI] [PMC free article] [PubMed] [Google Scholar]
- Churchfield S. The natural history of shrews. Bromley: Christopher Helm; 1990. [Google Scholar]
- Churchfield S, Rychlik L, Taylor JRE. Food resources and foraging habits of the common shrew, Sorex araneus: does winter food shortage explain Dehnel’s phenomenon? Oikos. 2012;121:1593–1602. doi: 10.1111/j.1600-0706.2011.20462.x. [DOI] [Google Scholar]
- Clancy B, Darlington RB, Finlay BL. Translating developmental time across species. Neuroscience. 2001;105:7–17. doi: 10.1016/S0306-4522(01)00171-3. [DOI] [PubMed] [Google Scholar]
- Clarke PG. Developmental cell death: morphological diversity and multiple mechanisms. Anat Embryol. 1990;181:195–213. doi: 10.1007/BF00174615. [DOI] [PubMed] [Google Scholar]
- Cowan WM, Fawcett JW, O’Leary DD, Stanfield BB. Regressive events in neurogenesis. Science. 1984;225:1258–1265. doi: 10.1126/science.6474175. [DOI] [PubMed] [Google Scholar]
- de Sousa AA, Sherwood CC, Mohlberg H, et al. Hominoid visual brain structure volumes and the position of the lunate sulcus. J Hum Evol. 2010;58:281–292. doi: 10.1016/j.jhevol.2009.11.011. [DOI] [PubMed] [Google Scholar]
- Dehnel A. Studies on the genus Sorex L. Ann Univ Marie Curie Sklodowska Sect C. 1949;4:17–102. [Google Scholar]
- Dickstein DL, Kabaso D, Rocher AB, et al. Changes in the structural complexity of the aged brain. Aging Cell. 2007;6:275–284. doi: 10.1111/j.1474-9726.2007.00289.x. [DOI] [PMC free article] [PubMed] [Google Scholar]
- Dobbing J, Sands J. Quantitative growth and development of human brain. Arch Dis Child. 1973;48:757–767. doi: 10.1136/adc.48.10.757. [DOI] [PMC free article] [PubMed] [Google Scholar]
- Dobbing J, Sands J. Comparative aspects of the brain growth spurt. Early Hum Dev. 1979;311:79–83. doi: 10.1016/0378-3782(79)90022-7. [DOI] [PubMed] [Google Scholar]
- Duan H, Wearne SL, Rocher AB, et al. Age-related dendritic and spine changes in corticocortically projecting neurons in macaque monkeys. Cereb Cortex. 2003;13:950–961. doi: 10.1093/cercor/13.9.950. [DOI] [PubMed] [Google Scholar]
- Fan L, Tang Y, Sun B, et al. Sexual dimorphism and asymmetry in human cerebellum: an MRI-based morphometric study. Brain Res. 2010;1353:60–73. doi: 10.1016/j.brainres.2010.07.031. [DOI] [PubMed] [Google Scholar]
- Farkas E, Luiten PGM. Cerebral microvascular pathology in aging and Alzheimer’s disease. Prog Neurobiol. 2001;64:575–611. doi: 10.1016/S0301-0082(00)00068-X. [DOI] [PubMed] [Google Scholar]
- Finlay BL, Darlington RB. Linked regularities in the development and evolution of mammalian brains. Science. 1995;284:1578–1584. doi: 10.1126/science.7777856. [DOI] [PubMed] [Google Scholar]
- Galea LAM, Kavaliers M, Ossenkopp K. Sexually dimorphic spatial learning in meadow voles Microtus pennsylvanicus and deer mice Peromyscus maniculatus. J Exp Biol. 1996;199:195–200. doi: 10.1242/jeb.199.1.195. [DOI] [PubMed] [Google Scholar]
- Gaulin SJC, Fitzgerald RW. Sexual selection for spatial-learning ability. Anim Behav. 1989;37:322–331. doi: 10.1016/0003-3472(89)90121-8. [DOI] [Google Scholar]
- Geinisman Y, Bondareff W, Dodge JT. Dendritic atrophy in the dentate gyrus of the senescent rat. Am J Anat. 1978;152:321–329. doi: 10.1002/aja.1001520305. [DOI] [PubMed] [Google Scholar]
- Gelman A, Su Y-S (2015) ARM: data analysis using regression and multilevel/hierarchical models. R package version 1.8-6
- Gonda A, Herczeg G, Merilä J. Evolutionary ecology of intraspecific brain size variation: a review. Ecol Evol. 2013;3:2751–2764. doi: 10.1002/ece3.627. [DOI] [PMC free article] [PubMed] [Google Scholar]
- Hofman M, Swaab DF. Seasonal changes in the suprachiasmatic nucleus of man. Neurosci Lett. 1992;139:257–260. doi: 10.1016/0304-3940(92)90566-P. [DOI] [PubMed] [Google Scholar]
- Hofman MA, Swaab DF, et al. A brain for all season: cellular, and molecular mechanism of photoperiodic plasticity. In: Hofman MA, Boer GJ, Holtmaat AJGD, et al., editors. Plasticity in the adult brain: from genes to neurotherapy, progress in brain research. Amsterdam: Elsevier; 2002. pp. 255–280. [DOI] [PubMed] [Google Scholar]
- Hyvarinen H. On the seasonal changes in the skeleton of the common shrew (Sorex araneus L.) and their physiological background. Aquil Ser Zool. 1969;7:2–32. [Google Scholar]
- Karbowski J. Global and regional brain metabolic scaling and its functional consequences. BMC Biol. 2007;5:18. doi: 10.1186/1741-7007-5-18. [DOI] [PMC free article] [PubMed] [Google Scholar]
- Kaufman JA. Pattern and scaling of regional cerebral glucose metabolism in mammals. Washington: Washington University; 2004. [Google Scholar]
- Krebs JR, Sherryt DF, Healy SD, et al. Hippocampal specialization of food-storing birds. Neurobiology. 1989;86:1388–1392. doi: 10.1073/pnas.86.4.1388. [DOI] [PMC free article] [PubMed] [Google Scholar]
- Laughlin SB, deVan Steveninck R, Anderson RR. The metabolic cost of neural information. Nat Neurosci. 1998;1:36–41. doi: 10.1038/236. [DOI] [PubMed] [Google Scholar]
- Lavenex P, Steele MA, Jacobs LF. The seasonal pattern of cell proliferation and neuron number in the dentate gyrus of wild adult eastern grey squirrels. Eur J Neurosci. 2000;12:643–648. doi: 10.1046/j.1460-9568.2000.00949.x. [DOI] [PubMed] [Google Scholar]
- Lavenex P, Steele MA, Jacobs LF. Sex differences, but no seasonal variations in the hippocampus of food-caching squirrels: a stereological study. J Comp Neurol. 2000;425:152–166. doi: 10.1002/1096-9861(20000911)425:1<152::AID-CNE13>3.0.CO;2-Y. [DOI] [PubMed] [Google Scholar]
- Lázaro J, Dechmann DKN, LaPoint S, et al. Profound reversible seasonal changes of individual skull size in a mammal. Curr Biol. 2017;27:R1106–R1107. doi: 10.1016/j.cub.2017.08.055. [DOI] [PubMed] [Google Scholar]
- Lázaro J, Hertel M, LaPoint S, et al. Cognitive skills of common shrews (Sorex araneus) vary with seasonal changes in skull size and brain mass. J Exp Biol. 2018;221:jeb-166595. doi: 10.1242/jeb.166595. [DOI] [PubMed] [Google Scholar]
- Magariños AM, McEwen BS, Saboureau M, Pevet P. Rapid and reversible changes in intrahippocampal connectivity during the course of hibernation in European hamsters. Proc Natl Acad Sci USA. 2006;103:18775–18780. doi: 10.1073/pnas.0608785103. [DOI] [PMC free article] [PubMed] [Google Scholar]
- Marner L, Nyengaard JR, Tang Y, Pakkenberg B. Marked loss of myelinated nerve fibers in the human brain with age. J Comp Neurol. 2003;462:144–152. doi: 10.1002/cne.10714. [DOI] [PubMed] [Google Scholar]
- Mcnab BK, Eisenberg JF. Brain size and its relation to the rate of metabolism in mammals. Am Nat. 1989;133:157–167. doi: 10.1086/284907. [DOI] [Google Scholar]
- Mezhzherin VA. Dehnel’s phenomenon and its possible explanation. Acta Theriol. 1964;8:95–114. doi: 10.4098/AT.arch.64-6. [DOI] [Google Scholar]
- Moraleva N, Telitzina A. Territoriality in juveniles of the common shrew (Sorex araneus) in prepeak and peak years of population density. Spec Publ Carnegie Museum Nat Hist. 1994;18:67–76. [Google Scholar]
- Naumann RK, Anjum F, Roth-Alpermann C, Brecht M. Cytoarchitecture, areas, and neuron numbers of the Etruscan shrew cortex. J Comp Neurol. 2012;520:2512–2530. doi: 10.1002/cne.23053. [DOI] [PubMed] [Google Scholar]
- Niven JE, Laughlin SB. Energy limitation as a selective pressure on the evolution of sensory systems. J Exp Biol. 2008;211:1792–1804. doi: 10.1242/jeb.017574. [DOI] [PubMed] [Google Scholar]
- Nottebohm F. A brain for all seasons: cyclical anatomical changes in song control nuclei of the canary brain. Science. 1981;214:1368–1370. doi: 10.1126/science.7313697. [DOI] [PubMed] [Google Scholar]
- Paxinos G, Franklin KBJ. The mouse brain in stereotaxic coordinates. 4. San Diego: Acadmic Press; 2013. [Google Scholar]
- Popov VI, Bocharova LS. Hibernation-induced structural changes in synaptic contacts between mossy fibers and hippocampal pyramidal neurons. Neuroscience. 1992;48:53–62. doi: 10.1016/0306-4522(92)90337-2. [DOI] [PubMed] [Google Scholar]
- Popov VI, Bocharova LS, Bragin a. G. Repeated changes of dendritic morphology in the hippocampus of ground squirrels in the course of hibernation. Neuroscience. 1992;48:45–51. doi: 10.1016/0306-4522(92)90336-Z. [DOI] [PubMed] [Google Scholar]
- Pucek M. Water contents and seasonal changes of the brain-weight in shrews. Acta Theriol. 1965;10:353–367. doi: 10.4098/AT.arch.65-30. [DOI] [Google Scholar]
- Pucek Z. Seasonal and age changes in the weight of internal organs of shrews. Acta Theriol. 1965;10:369–438. doi: 10.4098/AT.arch.65-31. [DOI] [Google Scholar]
- Pucek Z. Seasonal and age change in shrews as an adaptive process. Symp Zool Soc Lond. 1970;26:189–207. [Google Scholar]
- R Core Team (2016) R: a language and environment for statistical computing. R Foundation for Statistical Computing, Vienna, Austria. https://www.R-project.org/
- Raz N, Lindenberger U, Rodrigue KM, et al. Regional brain changes in aging healthy adults: General trends, individual differences and modifiers. Cereb Cortex. 2005;15:1676–1689. doi: 10.1093/cercor/bhi044. [DOI] [PubMed] [Google Scholar]
- Rychlik L. Evolution of social systems in shrews. In: Wojcik JM, Woslan M, editors. Evolution of shrews. Bialowieza: Mammal Research Institute, Polish Academy of Sciences; 1998. pp. 347–405. [Google Scholar]
- Scheibel ME, Scheibel AB. The methods of Golgi. In: Robertson RT, editor. Neuroanatomical research techniques. New York: New York Academic Press; 1978. pp. 98–144. [Google Scholar]
- Serafinski W. Morphological and ecological investigations on Polish species of the genus Sorex L. (Insectivora, Soricidae) Acta Oecol. 1955;1:27–86. [Google Scholar]
- Smith GT, Brenowitz EA, Beecher MD, Wingfield JC. Seasonal changes in testosterone, neural attributes of song control nuclei, and song structure in wild songbirds. J Neurosci. 1997;17:6001–6010. doi: 10.1523/JNEUROSCI.17-15-06001.1997. [DOI] [PMC free article] [PubMed] [Google Scholar]
- Smith DE, Roberts J, Gage FH, Tuszynski MH. Age-associated neuronal atrophy occurs in the primate brain and is reversible by growth factor gene therapy. Proc Natl Acad Sci. 1999;96:10893–10898. doi: 10.1073/pnas.96.19.10893. [DOI] [PMC free article] [PubMed] [Google Scholar]
- Smulders TV, Sasson AD, Devoogd TJ. Seasonal variation in hippocampal volume in a food-storing bird, the black-capped chickadee. J Neurobiol. 1995;27:15–25. doi: 10.1002/neu.480270103. [DOI] [PubMed] [Google Scholar]
- Smulders TV, Shiflett MW, Sperling AJ, Devoogd TJ. Seasonal changes in neuron numbers in the hippocampal formation of a food-hoarding bird: the black-capped chickadee. J Neurobiol. 2000;44:414–422. doi: 10.1002/1097-4695(20000915)44:4<414::AID-NEU4>3.0.CO;2-I. [DOI] [PubMed] [Google Scholar]
- Spocter M, Hopkins WD, Barks SK, et al. Neuropil distribution in the cerebral cortex differs between humans and chimpanzees. J Comp Neurol. 2012;520:2917–2929. doi: 10.1002/cne.23074. [DOI] [PMC free article] [PubMed] [Google Scholar]
- Stephan H. Methodische Studien über den quantitativen Vergleich architektonischer Struktureinheiten des Gehirns. Z Wiss Zool. 1960;164:143–172. [Google Scholar]
- Stockley P, Searle JB. Shrew mating systems. In: Wójcik JM, Wolsan M, editors. Evolution of shrews. Białowieża: Mammal Research Institute, Polish Academy of Sciences; 1998. pp. 407–424. [Google Scholar]
- Stockley P, Searle JB, Macdonald DW, Jones CS. Alternative reproductive tactics in male common shrews: relationships between mate-searching behaviour, sperm production, and reproductive success as revealed by DNA fingerprinting. Behav Ecol Sociobiol. 1994;34:71–78. doi: 10.1007/BF00175460. [DOI] [Google Scholar]
- Striedter GF. Principles of brain evolution. Sunderland: Sinauer; 2005. [Google Scholar]
- Suárez I, Bodega G, Rubio M, Fernández B. Sexual dimorphism in the hamster cerebellum demonstrated by glial fibrillary acidic protein (GFAP) and vimentin immunoreactivity. Glia. 1992;5:10–16. doi: 10.1002/glia.440050103. [DOI] [PubMed] [Google Scholar]
- Taylor JRE, Rychlik L, Churchfield S. Winter reduction in body mass in a very small, nonhibernating mammal: consequences for heat loss and metabolic rates. Physiol Biochem Zool. 2013;86:9–18. doi: 10.1086/668484. [DOI] [PubMed] [Google Scholar]
- Tiemeier H, Lenroot RK, Greenstein DK, et al. Cerebellum development during childhood and adolescence: a longitudinal morphometric MRI study. Neuroimage. 2011;49:63–70. doi: 10.1016/j.neuroimage.2009.08.016. [DOI] [PMC free article] [PubMed] [Google Scholar]
- Tramontin AD, Brenowitz EA. Seasonal plasticity in the adult brain. Trends Neurosci. 2000;23:251–258. doi: 10.1016/S0166-2236(00)01558-7. [DOI] [PubMed] [Google Scholar]
- Tramontin AD, Smith GT, Breuner CW, Brenowitz EA. Seasonal plasticity and sexual dimorphism in the avian song control system: Stereological measurement of neuron density and number. J Comp Neurol. 1998;396:186–192. doi: 10.1002/(SICI)1096-9861(19980629)396:2<186::AID-CNE4>3.0.CO;2-X. [DOI] [PubMed] [Google Scholar]
- Workman JL, Bowers SL, Nelson RJ. Enrichment and photoperiod interact to affect spatial learning and hippocampal dendritic morphology in white-footed mice (Peromyscus leucopus) Eur J Neurosci. 2009;29:161–170. doi: 10.1111/j.1460-9568.2008.06570.x. [DOI] [PubMed] [Google Scholar]
- Yaskin VA. Variation in brain morphology of the common shrew. In: Merrit JF, Kirkland GL, Rose RK, editors. Advances in the biology of shrews. Pittsburgh: Carnegie Museum of Natural History, Special Publication; 1994. pp. 155–161. [Google Scholar]
- Yaskin VA. The annual cycle of spatial behavior and hippocampal volume in Sorex. In: Merrit JF, Churchfield S, Hutterer R, Sheftel BI, editors. Advances in the biology of shrews II. New York: International Society of Shrew Biologists; 2005. pp. 373–385. [Google Scholar]
- Yopak KE, Lisney TJ, Darlington RB, et al. A conserved pattern of brain scaling from sharks to primates. Proc Natl Acad Sci USA. 2010;107:12946–12951. doi: 10.1073/pnas.1002195107. [DOI] [PMC free article] [PubMed] [Google Scholar]
Associated Data
This section collects any data citations, data availability statements, or supplementary materials included in this article.


