Abstract
The voltage-dependent protein SLC26a5 (prestin) underlies outer hair cell electromotility (eM), which is responsible for cochlear amplification in mammals. The electrical signature of eM is a bell-shaped nonlinear capacitance (NLC), deriving from prestin sensor-charge (Qp) movements, which peaks at the membrane voltage, Vh, where charge is distributed equally on either side of the membrane. Voltage dependencies of NLC and eM differ depending on interrogation frequency and intracellular chloride, revealing slow intermediate conformational transitions between anion binding and voltage-driven Qp movements. Consequently, NLC exhibits low-pass characteristics, substantially below prevailing estimates of eM frequency response. Here we study in guinea pig and mouse of either sex synchronous prestin electrical (NLC, Qp) and mechanical (eM) activity across frequencies under voltage clamp (whole cell and microchamber). We find that eM and Qp magnitude and phase correspond, indicating tight piezoelectric coupling. Electromechanical measures (both NLC and eM) show dual-Lorentzian, low-pass behavior, with a limiting (τ2) time constant at Vh of 32.6 and 24.8 μs, respectively. As expected for voltage-dependent kinetics, voltage excitation away from Vh has a faster, flatter frequency response, with our fastest measured τ2 for eM of 18.2 μs. Previous observations of ultrafast eM (τ ≈ 2 μs) were obtained at offsets far removed from Vh. We hypothesize that trade-offs in eM gain-bandwith arising from voltage excitation at membrane potentials offset from Vh influence the effectiveness of cochlear amplification across frequencies.
SIGNIFICANCE STATEMENT Of two types of hair cells within the organ of Corti, inner hair cells and outer hair cells, the latter evolved to boost sensitivity to sounds. Damage results in hearing loss of 40–60 dB, revealing amplification gains of 100–1000× that arise from voltage-dependent mechanical responses [electromotility (eM)]. eM, driven by the membrane protein prestin, may work beyond 70 kHz. However, this speed exceeds, by over an order of magnitude, kinetics of typical voltage-dependent membrane proteins. We find eM is actually low pass in nature, indicating that prestin bears kinetics typical of other membrane proteins. These observations highlight potential difficulties in providing sufficient amplification beyond a cutoff frequency near 20 kHz. Nevertheless, observed trade-offs in eM gain-bandwith may sustain cochlear amplification across frequency.
Keywords: capacitance, cochlear amplification, electromotility, membrane proteins, outer hair cell, sensor charge
Introduction
The voltage-dependent protein SLC26a5 (prestin) underlies outer hair cell (OHC) electromotility (eM; Zheng et al., 2000; Liberman et al., 2002), considered to be responsible for cochlear amplification in mammals (Santos-Sacchi et al., 2006; Dallos et al., 2008). This mechanism provides 40–60 dB gain in our perceptions of sound. eM has been characterized biologically as ultrafast, exhibiting no attenuation beyond 70 kHz (Frank et al., 1999), and such uniform mechanical activity across frequencies is assumed to be required for cochlear amplification by some mammalian species that have hearing capabilities well beyond the range of human frequency detection.
While cochlear amplification clearly results from the voltage-dependent mechanical activity of the OHC, it behooves us to understand frequency-response characteristics of eM, since amplification may extend to very high frequencies in some mammals. There are at least two independent influences on eM frequency response. The first is the ability of the cell to provide the drive for eM, namely, the attenuating influence of the membrane resistive–capacitive (RC) time constant on receptor potentials at high frequency; the second is the ability of the prestin motor protein to follow voltage changes at high frequencies. It is this second issue, the focus of the pioneering work of Dallos and Evans (1995) and Frank et al. (1999), that we explore here.
The electrical correlate of eM is a bell-shaped nonlinear capacitance (NLC; Ashmore, 1990; Santos-Sacchi, 1991), which peaks at the membrane voltage (Vh) where the prestin voltage-sensor charge (Qp) is equally distributed across the OHC membrane field in a way that is analogous to voltage-dependent ion channel capacitance/gating behavior (Armstrong and Bezanilla, 1974; Kilic and Lindau, 2001). We recently determined that the apparent, simultaneously evaluated, voltage dependence of NLC and eM differs depending on intracellular chloride level and interrogation frequency, revealing slow (multiexponential) intermediate conformational transitions between required anion binding and Qp movements (Song and Santos-Sacchi, 2013). Consequently, analysis of NLC across frequency has revealed significant low-frequency roll-off (Santos-Sacchi and Song, 2014, 2016) that is incompatible with the demonstration of ultrafast eM lacking any evidence of low-pass components (Frank et al., 1999). Additionally, disparities that we and others have reported between electrical and mechanical properties (Gale and Ashmore, 1997) of the OHC motor appear to challenge the concept of tight electromechanical coupling in OHCs, namely, its piezoelectric-like behavior (Iwasa, 1993; Gale and Ashmore, 1994; Mountain and Hubbard, 1994; Kakehata and Santos-Sacchi, 1995; Dong et al., 2002).
Here we study simultaneously evoked prestin electrical (both NLC and Qp) and mechanical (eM) responses, synchronously measured across frequencies to quantify electromechanical coupling in OHCs. We find that while Qp and eM are indeed tightly coupled, NLC reports not on the frequency response of eM, but only on the limiting kinetics of eM. Finally, we identify two frequency components of NLC and eM (one slow, one fast), and show that trade-offs between frequency response and gain of eM, similar to the gain–bandwidth product optimization used in operational amplifiers, may be obtained by excitation of the OHC at a resting voltage offset from Vh. We conclude that voltage-dependent eM is intrinsically low-pass, in line with behavior of most voltage-dependent proteins, relative to the highest frequencies perceivable by certain mammals. However, we hypothesize that mechanisms that provide stimulus offsets from Vh, either shifts in resting potential or prestin's voltage dependence, may actually work to enhance the bandwidth of cochlea amplification.
Materials and Methods
Whole-cell recordings were made from single isolated OHCs from the apical turns of organ of Corti of guinea pigs and mice of either sex. Since prestin's identification in 2000 (Zheng et al., 2000), there is no evidence that prestin itself or its behavior differs in long or short OHCs from different regions of the cochlea (Santos-Sacchi et al., 2017). An inverted Nikon Eclipse TI-2000 microscope with a 40× lens was used to observe cells during voltage clamp. Experiments were performed at room temperature. Blocking solutions were used to remove ionic currents, thus limiting confounding effects on NLC determination and voltage delivery under voltage clamp (Santos-Sacchi, 1991; Santos-Sacchi and Song, 2016). Extracellular solution was as follows (in mm): 100 NaCl, 20 tetraethylammonium-Cl, 20 CsCl, 2 CoCl2, 1 MgCl2, 1 CaCl2, 10 HEPES. Intracellular solution was as follows (in mm): 140 CsCl, 2 MgCl2, 10 HEPES, and 10 EGTA. Contamination of prestin NLC by ion channel gating current is negligible since channel charge movement is orders of magnitude smaller than the OHC charge due to prestin (2–4 pC; Santos-Sacchi, 1991). All chemicals were purchased from Sigma-Aldrich.
Cell capacitance, prestin charge, and mechanical response.
An Axon 200B amplifier was used for whole-cell (head stage β = 1) and microchamber (head stage β = 0.1) recording with jClamp software (www.scisoftco.com). A National Instruments 6550 AD/DA or Axon Digidata 1440 was used for digitizing. To avoid time-dependent influences on our measures, no averaging was done, except where noted. AC analysis of membrane currents (Im) and eM were made by stimulating cells with individually delivered or summed voltages at harmonic frequencies from 48.8 to 12,500 Hz (depending on recording configuration) with a 10 μs sample clock. Magnitude and phase of responses were computed by FFT in Matlab. Integration of AC currents to extract charge was performed in the frequency domain (Qp = Im/jω; ω = 2πf; j = ). Since prestin charge movement has very shallow voltage dependence (z ≈ 0.85), charge at very positive voltages where NLC is minimized (+50 or +130 mV) was subtracted following scaling to estimated values at 300 mV (×0.875–0.9), based on two-state Boltzmann fits, thereby removing charge generated by linear capacitance. Capacitance was measured using dual-sine analysis at harmonic frequencies (Santos-Sacchi et al., 1998; Santos-Sacchi, 2004). To extract Boltzmann parameters, capacitance-voltage data were fit to the first derivative of a two-state Boltzmann function as follows:
 |
Qmax is the maximum nonlinear charge moved, VpkCm or Vh is voltage at peak capacitance or equivalently, at half-maximum charge transfer, Vm is membrane potential, z is valence, Clin is linear membrane capacitance, e is electron charge, k is Boltzmann's constant, and T is absolute temperature.
NLC determination requires stray capacitance removal due to analysis constraints (viz, admittance solutions assume no stray capacitance; Santos-Sacchi et al., 1998; Santos-Sacchi and Song, 2016). NLC was not measured following changes in series resistance compensation circuitry because phase lags introduced by compensation circuitry invalidate the system calibration used to correct for the system's frequency response. The system response is required for NLC measures. Patch pipettes were coated with M-coat (Micro Measurements) to reduce stray capacitance. Remaining stray capacitance was removed by amplifier compensation circuitry before whole-cell configuration. If necessary, additional compensation was applied under whole-cell conditions (Schnee et al., 2011a,b) and/or through a software algorithm to ensure expected frequency-independent linear capacitance (Santos-Sacchi, 2018).
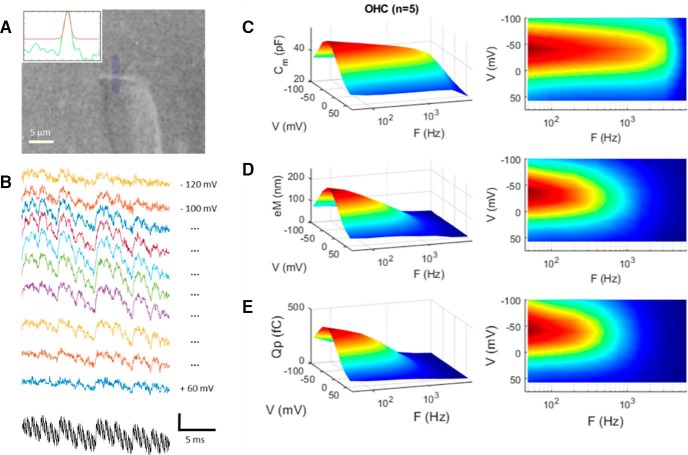
Simultaneous eM measures were made with fast video recording or a photo diode system. The photo diode measurement details have been published (Santos-Sacchi and Song, 2014). Briefly, we stimulated with 50 mV peak discrete AC bursts across harmonic frequencies (12.2–6250 Hz) to explicitly excite the OHC eM nonlinearity and generate fundamental and harmonic responses. For video analyses, a Phantom 110 camera (Vision Research) was used for video measures at frame rates of 25 kHz (whole cell) or 50 kHz (microchamber). For whole cell, stimuli were the sum of nine 15 mV peak harmonic frequencies (48.8–12,500 Hz). Additional magnification was set to provide 176 nm/pixel. The bright edge of the cuticular plate was used to track OHC length change by fitting a Gaussian to the peak of the image, providing subpixel resolution of movements (see Fig. 2A). The fitted line (five pixels wide) was drawn to encompass the cuticular plate at right angles, the number of points (pixels) depending on the image thickness of the plate, which can vary from cell to cell. Only a single peak was chosen for tracking.
Figure 2.
Low-pass electromechanical behavior of the OHC under whole-cell voltage clamp. A, Video frame of an OHC whose eM was measured by tracking the edge of its cuticular plate. Inset, Bright edge (green line) is fitted with a Gaussian (red line) and tracked across frames (25,000 fps). B, Raw eM responses (colored traces) generated by the multifrequency voltage stimulus (black trace) summed to differing holding potentials. eM responses are arbitrarily offset and colored for easy visualization. Vertical scale bar is 0.45 μm for eM and 50 mV for voltage (sum of 9 15 mV peak harmonic frequencies starting at 48.8 Hz). C, NLC, in contrast to linear capacitance, is frequency dependent, showing low-pass behavior. Rightmost panels show alternative view of surface plots to appreciate frequency response. D, eM shows lower-pass behavior compared with NLC. E, Prestin sensor charge (Qp) shows behavior similar to eM. eM and Qp frequency-response time constants at Vh are statistically indistinguishable by t test (p = 0.134). Average responses from five cells.
The patch electrode or microchamber provided a fixed point at the basal end or middle of the cell, respectively. For cells studied with video analysis under whole-cell mode, charge-movement magnitude was corrected for the magnitude roll-off of the 10 kHz Bessel filter. Series resistance (Rs) was determined from voltage step-induced whole-cell currents (Huang and Santos-Sacchi, 1993, their appendix). For the microchamber, a 30 kHz filter (external Frequency Devices 9002 filter with 200B open filter) was used to collect current data, but because of the complexity of charge movements (moving in opposite directions in each part of the partitioned cells), no analysis was performed. Resultant movements were analyzed by FFT in Matlab. The colors in surface plots were generated in the Matlab plotting routine surf with shading set to <interp>. This procedure allows contours to be readily observable. No relation to 3 dB breakpoint is intended.
For the microchamber, voltage across the membrane of the extruded length of the cell, qL, is estimated as the imposed microchamber voltage, V, factored by 1 − q, q being extent (0–1) of extrusion (Dallos et al., 1993; Frank et al., 1999). The calculated correction is 0.4539, since our average q = 0.546. Shunt resistance could also be influential (Dallos et al., 1991; Huang and Santos-Sacchi, 1993); our average was 4.97 ± 0.8 MΩ (n = 8), approximately estimated from voltage steps. With this shunt resistance, the calculated correction is quite accurate as shown by near equivalence of the Boltzmann z parameter for both eM and NLC (see Fig. 10). For the microchamber, AC stimuli were the sum of nine 30 mV peak harmonic frequencies (48.8–12,500 Hz), and given the correction factor above 0.4539, 13.62 mV was delivered to the extruded cell membrane, similar to whole-cell conditions. Microchamber eM responses were corrected for extrusion factor to equate to whole-cell measures (eM/q; Frank et al., 1999).
Figure 10.
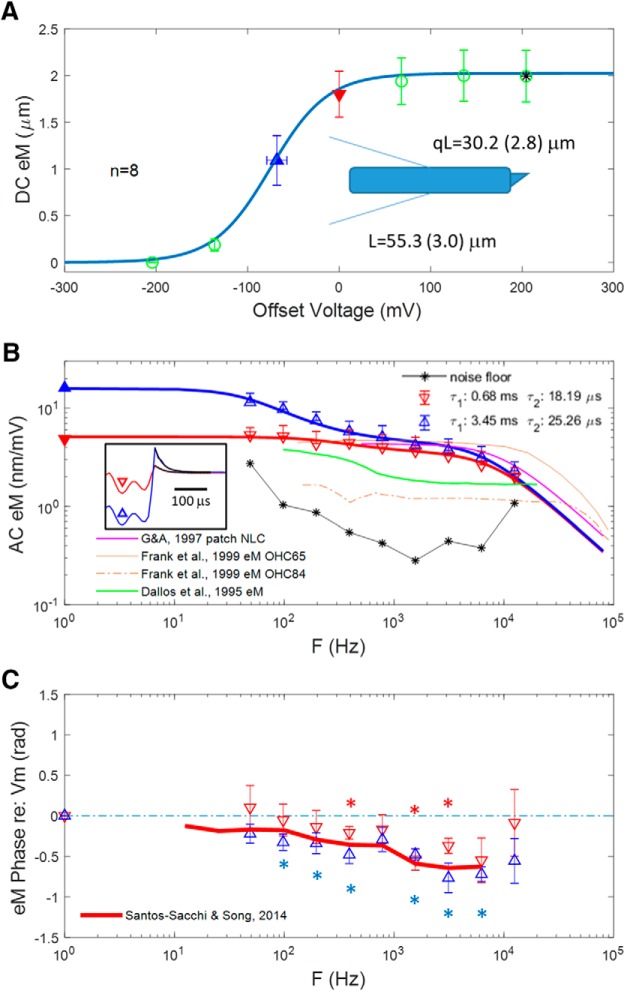
eM evoked with the microChamber wide-band stimulus delivery system and video captured at 50,000 fps. No frame averaging. Two components are evident, whose frequency response is dependent on offset from Vh. A, DC eM magnitude versus offset voltage. Cells were partitioned near midway along cell length (schematic), with average length (L) being 55.3 ± 3.0 μm, and the average portion outside the chamber (qL) being 30.2 ± 2.8 μm. The Boltzmann fit provides a z parameter of 0.83, in good agreement with our estimates from NLC and Qp. Our eM gain of 16.8 nm/mV is typical of reported whole-cell responses. In the absence of a voltage offset, stimulation is substantially removed from Vh, the location of maximal gain. B, Magnitude–frequency plot of average eM from two regions of the DC plot (denoted by solid triangles). DC average gains derived from A are replotted on left gain (nm/mV) axis. The boxed inset shows the current relaxations after return to zero voltage (red and blue), fit with a single exponential (black lines), and used to correct for voltage frequency roll-off. Clamp τ at zero offset: 25.8 μs; near Vh: 23.96 μs. Colors and symbols correspond to offsets and match those of the model of Figure 9C–E. See text for more details. Responses obtained from an offset close to Vh (upward blue triangles) show a large low-pass component, whereas responses without an offset (downward red triangles) show a reduced low-pass component. Each has faster components away from Vh. Thin, black asterisk line is noise floor estimated from +200 mV offset in A, where AC responses are saturated. For comparison, magenta lines depict patch NLC from Gale and Ashmore. Brown lines show microchamber eM gain functions for two cells from Frank et al. Green line from Dallos et al. shows microchamber eM gain derived from their reported excitation voltage of ±0.6 mV. Clearly, these eM data were collected at offset from Vh. See text for discussion. C, eM phase shows differences depending on voltage offset that may be due to differing eM gain. While a clear frequency-dependent lag relative to voltage occurs near Vh, it is less clear for responses away from Vh. Statistical significance (p < 0.05) from zero is indicated by correspondingly colored asterisks. The red line depicts the eM phase lag found by us previously under whole-cell conditions (Santos-Sacchi and Song, 2014). AC voltage stimulation at each frequency was ∼14 mV (see Materials and Methods).
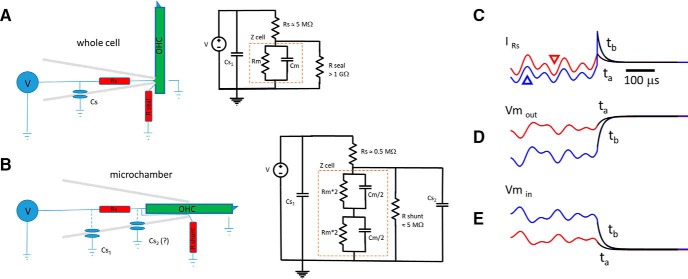
At other than DC, the frequency cutoff [fc, 3 dB down point, or time constant τ (1/2πfc)] of voltage delivery will be determined, as in whole-cell voltage clamp, by Rs and predominantly cell capacitance, since for the OHC, cell capacitance dominates any stray capacitance of the macropipette. Additional lumped stray capacitance of the amplifier, pipette holder, etc., will not influence clamp τ since it only influences the circuit as a current divider (see Fig. 9). It is typically compensated electronically (e.g., in whole-cell mode) only to limit amplifier saturation, not to extend voltage-clamp frequency response. Thus, given a voltage-clamp amplifier that can provide sufficient current to the microchamber, voltage delivery across Rs in series with cell impedance will be immune to this stray capacitance. Thus, fc will chiefly depend on q, where at q = 0.5, a balanced capacitance divider can be achieved (assuming inserted and extruded membrane τ's are equal), and provide a maximally flat frequency response for voltage delivery. The fc will increase in a U-shaped manner on either side of q = 0.5, but will depend critically on Rs (see Fig. 11). We compensated stray capacitance with our amplifier (Axon 200B) compensation circuitry before recording to limit amplifier saturation. eM was corrected for microchamber clamp time constant effects based on voltage-induced transient responses of measured currents following AC stimulation (see Figs. 9, 10). Measurement noise floor was estimated from the saturated AC eM responses at +200 mV offset. Cells displaying maximum steady-state (DC) microchamber eM responses <1.0 μm were discarded, since such small responses may be a sign of reduced turgor pressure, which can reduce eM (Santos-Sacchi, 1991). Models were implemented in Matlab Simulink and Simscape, as detailed previously (Song and Santos-Sacchi, 2013; Santos-Sacchi and Song, 2014). Data points from previous publications were extracted from plots using the application Grabit (written by Jiro Doke) in Matlab.
Figure 9.
Electrical configuration of whole-cell and microchamber voltage clamp. A, Whole-cell clamp speed is limited by τ ≈ Rs * Cm. Stray capacitance (amplifier, pipette holder, and pipette) is typically modeled in a position that does not interfere with voltage-clamp speed, but can influence measured high-frequency currents if not compensated. B, The microchamber partitions the cell partway within the orifice of the macropipette. Stray Cs1 is as with whole-cell mode. The frequency response of voltage clamp also depends on Rs and Cm, since stray Cs2, if it contributes at all, is dominated by Cm. The configuration in the figure is for a cell midway in the microchamber, membrane Cm equally divided. At high frequencies, the input capacitance will be the series combination of Cm/2 and Cm/2, giving a value of Cm/4. Thus, τ ≈ Rs * Cm/4 provides a faster clamp than whole cell, but the configuration suffers from lack of DC voltage-clamp control across the membranes. With partitioning of the cell more or less within the chamber, the series combination of the nonequal partitioned cell Cm will provide an input Cm less than the smaller of the two partitioned capacitances, regardless of its location inside or outside the microchamber. Thus, clamp τ for both inserted and extruded membranes will have the same U-shaped speed function, being slowest at the half-inserted condition, as depicted. C, Displayed are two current traces (ta and tb) generated by a Matlab Simscape microchamber model using a voltage protocol similar to our DC off-set AC voltage protocol (Fig. 10B, inset). The red trace (also marked with a downward red triangle) is at zero offset, and the blue trace (also marked with an upward blue triangle) is at an offset of −65 mV. Black lines are single exponential fits. Under voltage clamp, the time course of capacitive currents mirrors the time course of the voltage delivered to the cell membrane, as shown in D and E. See text for more details.
Figure 11.
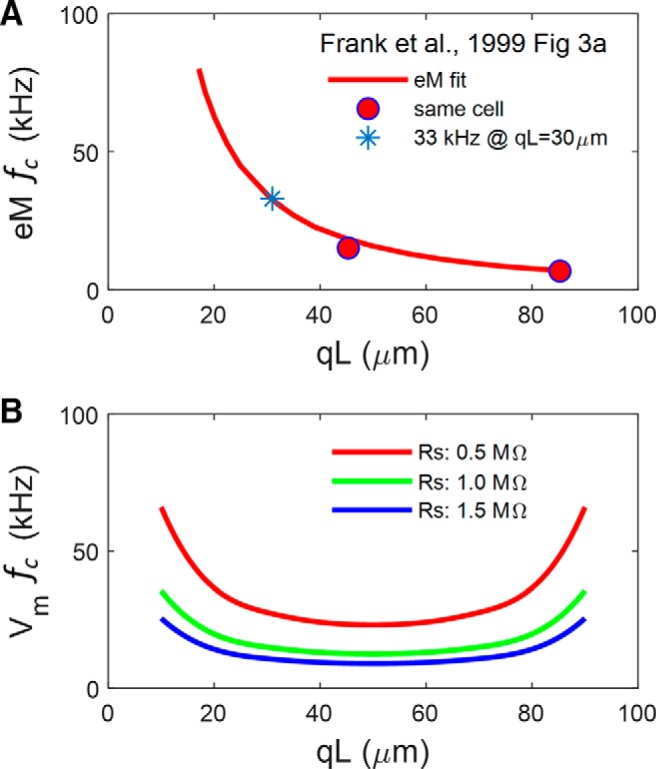
Apparent disparity between microchamber voltage and eM. A, Fit of eM fc for 57 cells from Frank et al. Figure 3A, and response of same cell with differing cell extrusion, qL. Asterisk denotes fc at a qL similar to our present average. B, Vm cutoffs for a cell model possessing NLC (capacitor with 2-state Boltzmann characteristics), indicating marked dependence of fc on Rs. Cell parameters are Clin: 22 pF; Rm: 300 MΩ; Rs: 0.5 (red), 1.0 (green), or 1.5 (blue) MΩ; Rsh: 5 MΩ; NLC parameters are z: 0.85; Qmax: 3.8 pC; Vh: 0 mV. fc is a U-shaped function of qL.
Statistics.
Rs-corrected Vm versus NLC, Qp, and eM data were fit with the first derivative of a two-state Boltzmann function to provide comparable Boltzmann parameters z and Vh for each measure (Santos-Sacchi, 1991). Data are presented as mean ± SE. Regressions were performed in Matlab. Using SAS 9.4 (SAS Institute), the mean phase data in Figure 9C were tested for significance from zero. A one-group t test was used to test the null hypothesis. The results are reported in the figure.
Results
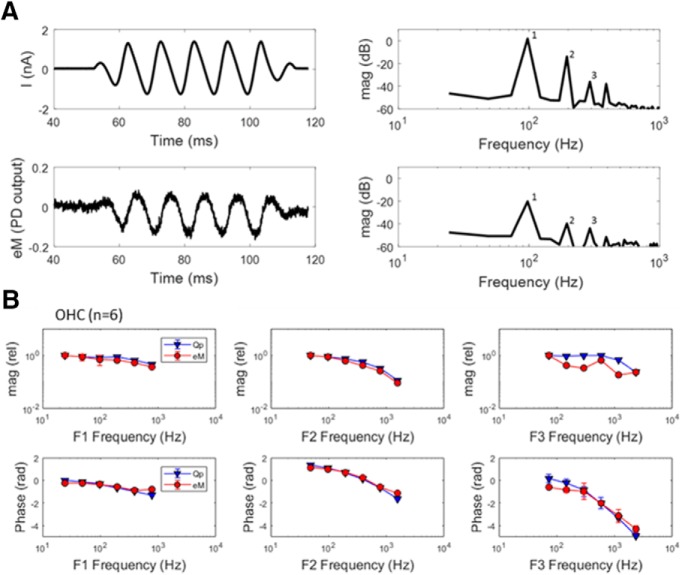
In whole-cell mode, we simultaneously measured the first (fundamental), second, and third harmonic of both eM and membrane current Im using single sinusoidal bursts of voltage (Fig. 1A). For the OHC under voltage clamp, the following equations apply:
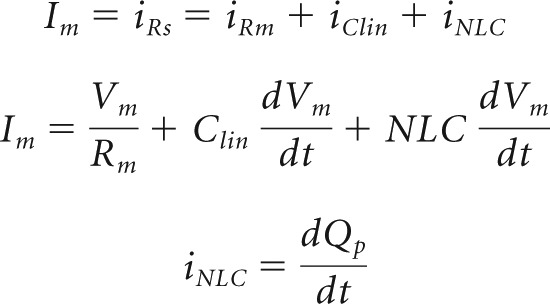 |
where Qp is prestin charge. In our experiments, NLC is the dominant nonlinearity, since nonlinear ionic membrane currents are blocked. Nonlinear harmonic currents thus predominantly represent voltage-driven displacement currents arising from prestin sensor charge movements normal to the membrane field. Prestin charge at these harmonic frequencies, Qp, is obtainable by integration of current, signifying that the phases of harmonic charge components will lag current phase by 90°.
Figure 1.
Gating charge and eM are coupled. A, Example of currents and eM at 97.7 Hz. Harmonics (1, 2, 3) are generated by nonlinearities in the process generating mechanical responses. B, Comparison of average (n = 6) relative magnitude and phase of eM and prestin sensor charge (Qp) for harmonics 1, 2, and 3, illustrating tight coupling between the two measures of prestin activity across frequencies. Responses were time averaged 8–64 times to achieve an equal signal-to-noise ratio across frequencies. Fifty millivolt peak discrete AC bursts across harmonic frequencies were delivered to explicitly excite the OHC eM nonlinearity and generate fundamental and harmonic responses.
While the nonlinear harmonic currents arise from prestin charge movements alone, those of the fundamental have additional contributions from linear components (Clin, Rm) of the cell. To remove those linear components, so we can additionally compare electrical and mechanical responses at the fundamental, we note that the relationship between second harmonic eM and second harmonic nonlinear current should hold for the fundamental responses (confirmed through modeling). Thus, the complex ratio of eM and current at the second harmonic will approximate that at the first harmonic (fundamental), expressed as follows:
 |
The linear component of Imf1, namely, Imf1 lin, was solved for and subtracted from Imf1. These manipulations only affect fundamental frequency comparisons. The underlying premise to be confirmed is that the electromechanical activity of the OHC is piezoelectric-like, and that prestin sensor charge movements (Qp) correspond to eM, despite recently identified phase differences between Vm and eM (Santos-Sacchi and Song, 2014), and previously identified timing disparities between Qp and eM (Gale and Ashmore, 1997; Santos-Sacchi and Song, 2014). In our kinetic models, we assume eM corresponds to the occupancy of the protein in the contracted state where positive sensor charge accumulates during depolarization/cell shortening. Thus, the validity of our model and of other similar (e.g., two state) models depends on tight coupling.
In Figure 1B, average (±SE; n = 6) magnitude and phase of first, second, and third harmonics of Qp and eM are shown. The eM and Qp data compare favorably, indicating that eM is tightly coupled in magnitude and time (phase) to prestin charge, as expected for a piezoelectric process. Considering the phase lag between OHC Vm and eM (Santos-Sacchi and Song, 2014), our observation of tight coupling between Qp and eM identifies the piezoelectric nature of the OHC as being one with hysteresis. Namely, there is a delay between voltage drive and charge motion, but no delay between charge motion and OHC motion. We previously observed Vm–eM hysteresis in OHC electromechanical behavior (Santos-Sacchi et al., 1998, 2001).
Recently, NLC has been shown to present low-pass frequency-dependent behavior that we attributed to a slow, multiexponential kinetic process within prestin state transitions (Santos-Sacchi and Song, 2016). How does the frequency response of OHC NLC relate to eM? To answer this question, we measured eM, NLC, and Qp simultaneously across stimulation frequency. Figure 2A,B presents an example of an OHC whose eM was measured with video analysis at 25,000 fps during multifrequency voltage stimulation. In Figure 2C–E, average responses (n = 5) are depicted for NLC, eM, and Qp, respectively. NLC shows low-pass behavior as we reported on previously (Santos-Sacchi and Song, 2016), but Qp and eM show even lower pass behaviors. The latter two measures are remarkably similar, in line with our Qp/eM data of Figure 1. The underlying mechanism for the differences between NLC and eM/Qp is explored in the next couple of figures, where the influence of the whole-cell voltage-clamp time constant is considered. In Figure 3, an example of clamp τ effects on eM is shown. As clamp speed is increased via amplifier Rs compensation circuitry, the frequency response of eM is similarly increased; eM τVh approaches this cell's NLC τVh, determined from a single exponential fit (Fig. 3C, blue asterisk), where prestin's kinetics are limiting. We had previously shown this effect for both AC and step eM responses (Santos-Sacchi, 1992), and this result derives from the voltage-dependent nature of eM (Ashmore, 1987; Santos-Sacchi and Dilger, 1988; Iwasa and Kachar, 1989).
Figure 3.
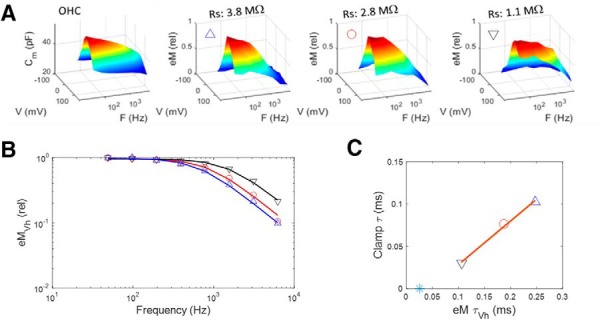
Whole-cell clamp time constant limits eM frequency response. A, Left panel shows NLC in an OHC, whose eM was measured at three different values of Rs (achieved through amplifier Rs compensation circuitry). As clamp time constant is decrementally reduced (clamp τ ≈ Rs * Cm), eM frequency response approaches that of NLC. Symbols correspond for all plots. B, Magnitude–frequency plot illustrating enhanced frequency response of eM at Vh. C, Linear relationship between eM and clamp time constants. eM τVh approaches this cell's NLC τVh, determined from a single exponential fit (blue asterisk). Stimulus was 15 mV peak at each frequency.
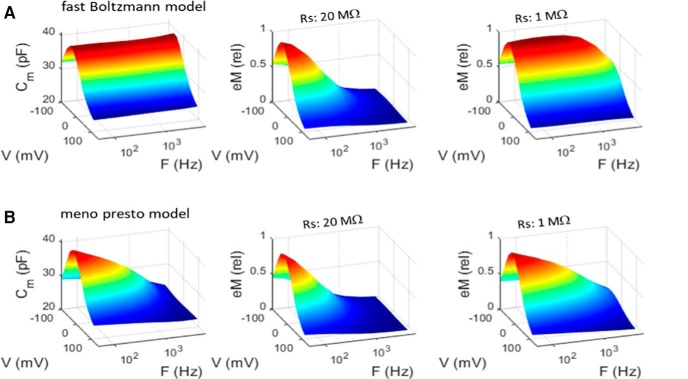
Whereas eM (and Qp; see below) measures mirror clamp speed, NLC frequency-dependent behavior is independent of clamp speed. NLC estimates derive from the solution of the cell's admittance (Santos-Sacchi et al., 1998; Santos-Sacchi, 2004), essentially providing the ratio dQp/dVm. Thus, in the face of Vm roll-off due to clamp time constant, the ratio of changes in Vm-driven Qp and the driving force Vm remains unaffected by clamp τ, and therefore reports simply on the limiting kinetics of prestin transitions. This is confirmed through modeling (Fig. 4). Here clamp τ is altered by changes in Rs (clamp τ ≈ Rs * Cm). In Figure 4A, a model of an OHC possessing an NLC with frequency-independent Boltzmann characteristics shows an unencumbered increase in eM (i.e., Qp) frequency response as Rs is lowered. However, the OHC possessing a multistate kinetic (meno presto) model of NLC (Santos-Sacchi and Song, 2016; Fig. 4B) shows that the frequency response of eM is governed by the kinetics revealed by NLC. That is, NLC specifies limits to the frequency behavior of eM or Qp.
Figure 4.
Models show that kinetics underlying NLC frequency response restrain frequency response of eM (Qp). A, NLC of a two-state Boltzmann model is frequency independent. However, eM (Qp; right) faithfully follows clamp time constant. B, NLC of meno presto model incorporating slow multiexponential kinetics is low-pass. Note that eM (Qp) frequency response is also increased by reducing clamp time constant, but is limited by kinetics that define NLC response. AC stimulus was 15 mV peak at each frequency.
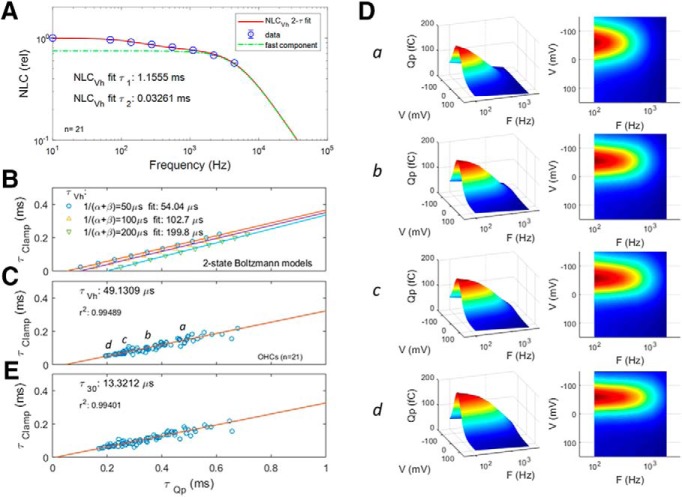
Figure 5 shows average (n = 21) guinea pig OHC NLC frequency dependence, and corresponding Qp measures. For the NLC Lorentzian fit, we use the geometric mean of the dual stimulating frequencies, as we have done previously (Santos-Sacchi and Song, 2016). Only AC NLC was estimated with dual sine, but neither eM nor Qp, so that eM and Qp data correspond to the primary frequencies directly. To estimate peak NLC at DC (33.5 pF, plotted leftmost on x-axis), measures were derived from voltage step-induced transients (Huang and Santos-Sacchi, 1993), namely, during changes in command holding potential. The mean (SE) Boltzmann characteristics of NLC at the lowest primary frequency of 48.8 Hz (geometric mean, 69.1 Hz) are NLCpk: 32.03 (0.76) pF; Vh: −52.8 (4.1) mV; z: 0.86 (.016); and Qmax: 3.875 (0.17) pC. Clin for this group of cells was 22.57 (0.46) pF. For comparison, our standard estimates of NLC at 390.6 Hz (geometric mean, 552.4 Hz) gives Vh: −53.3; z: 0.86; and Qmax: 3.24 pC. Note here that Qmax is larger at the lower frequency. At 97 Hz (near that of the NLC geometric mean of 69.1 Hz), Qp fits provide Vh: −56.3 (2.6) mV; z: 0.836 (0.021); and Qp: 127.9 (6.8) fC. AC voltage stimulation was 5 mV.
Figure 5.
NLC has two frequency components whose kinetics limits Qp frequency response. Average responses from 21 cells. A, Magnitude–frequency plot of average NLC at Vh. A dual-Lorentzian fit reveals slow and fast components (A1: 0.2453; τ1: 1.12 ms; A2: 0.7469; τ2: 32.6 μs). NLC is plotted relative to values at lowest frequency, which is NLC determined from step-induced (DC) transients (Huang and Santos-Sacchi, 1993) during changes in command holding potential. Error bars indicate SE. Dotted green line is plot of faster component. B, Relationship between clamp τ and Qp τ for three two-state models of differing rate constants, illustrating that regressions to zero clamp τ can identify each model's characteristic time constant. C, Similarly, regressions on OHC Qp provide a limiting time constant approaching the fast τ component of NLC. D, a–d, Five cell-binned averages computed and plotted, illustrating the enhanced frequency response as clamp τ decreases (a: 153.0 ± 1.75 μs; b: 100.9 ± 1.2 μs; c: 70.9 ± 1.4 μs; d: 55.7 ± 1.9 μs. Qp Lorentzian fits data and model are from 100 to 3200 Hz. E, Plot of Qp at an offset voltage of 30 mV from Vh, showing that τQp decreases at voltages away from Vh (with gain–bandwidth tradeoffs). Five millivolt peak AC stimulation. See text for Boltzmann mean (SE).
Normalized NLC (Fig. 5A) is characterized by two distinct kinetic components, one slow component (τ1 = 1.12 ms) and one fast component (τ2 = 32.6 μs). The latter component's amplitude is only a couple of decibels down from the former. Thus, the limiting frequency response of eM, dictated by the NLC frequency response, will derive from the second, faster component. The speed of Qp (determined from single Lorentzian fits above 100 Hz stimulation), in agreement with eM measures, is dictated by whole-cell clamp speed (Fig. 5C,E). Here, we increased clamp speed (reduced clamp τ) to the point just before amplifier oscillation and correlated with Qp speed, in an effort to predict prestin's cutoff τ at Vh. A linear extrapolation to zero clamp time constant (which works reasonably well for two-state kinetic models of differing kinetics; Fig. 5B) provides a limiting τ of 49 μs, compared with the fast NLC component τ of 32.6 μs. Notably, the apparent speed of Qp increases when interrogated at voltages offset from Vh. At an offset of 30 mV from Vh, τQp reduces to 13.3 μs, in a tradeoff between gain and bandwidth.
Figure 6 explores this gain–bandwidth trade-off in our eM data. We replot (Fig. 6A) the average data and Boltzmann fits from Figure 2, and construct eM–frequency plots at different offset voltages from Vh (Fig. 6B). The frequency responses further away from Vh are flatter and have faster time constants. These were single Lorentzian fits, and clearly even the fastest time constant (198 μs) is constrained by a slow whole-cell clamp τ.
Figure 6.
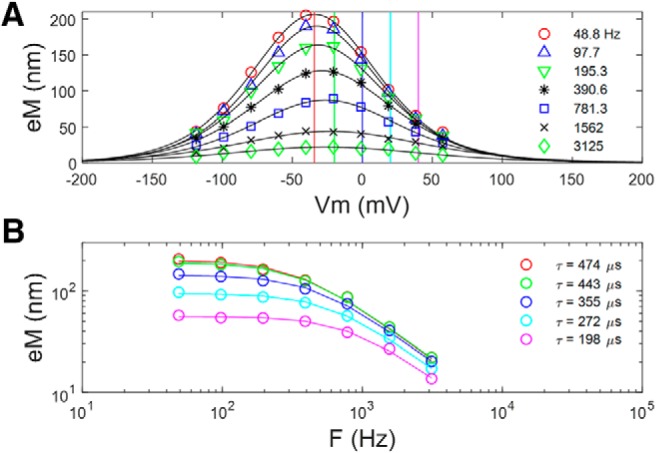
Similar to Qp results, eM τ decreases at voltages offset from Vh. A, eM and Boltzmann fits from cells depicted in Figure 2 at the various recorded frequencies. B, Frequency plots derived from data at vertical lines in A. The further away from Vh, the faster is the frequency response, with a trade-off between gain and bandwidth.
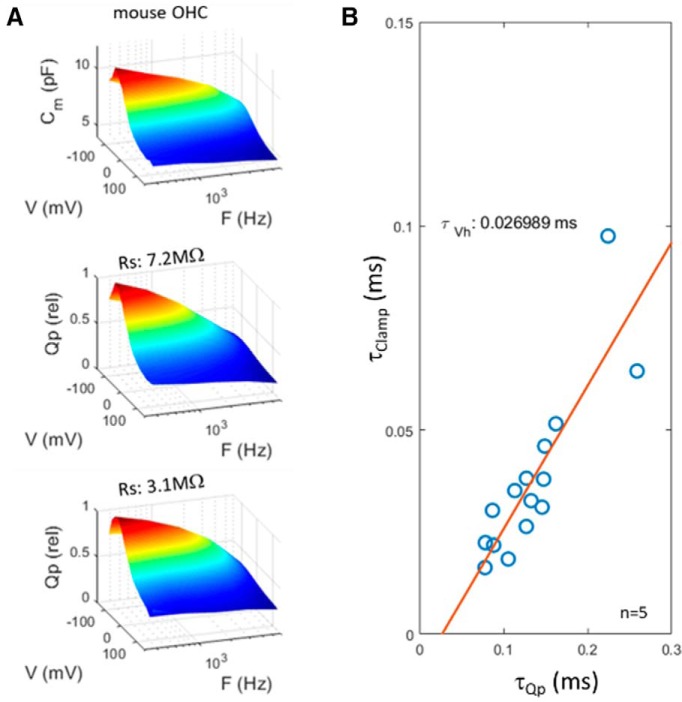
To obtain faster clamp time constants, we recorded from mouse OHCs, where the reduced magnitude of both linear and nonlinear capacitances will enhance the speed of voltage delivery under whole-cell conditions (clamp τ down to ∼15 μs). In Figure 7, we show kinetic behavior similar to that of guinea pig OHCs, with Qp frequency response being clamp-speed dependent. Linear extrapolation provides a limiting τQp of 27 μs.
Figure 7.
Mouse OHC recordings have reduced clamp time constants, but show low-pass frequency-response behavior similar to guinea pig OHCs. A, B, NLC is low pass at Vh (A) and clamp τ influences Qp frequency response (B). Extrapolation estimate of τQp is 27 μs. Five millivolt peak AC stimulation.
Clearly, despite reductions in clamp time constant, the frequency responses of eM and Qp are limited in whole-cell mode, to a limiting rate being, at best, approximate. Thus, to avoid whole-cell clamp τ effects, we measured Qp frequency response in membrane patches, where speed of voltage delivery is unquestionably fast. Figure 8 shows average responses (n = 10) of Qp from on-cell patch recordings before establishment of whole-cell configuration. Patches (Fig. 8A,B) show frequency responses that are slower than whole-cell responses. This likely arises from physical constraints on patch membrane movements, as previously suggested by Gale and Ashmore (1997). That is, because eM is mirrored in Qp, since each are tightly coupled, our measures of patch Qp will show evidence of physical constraints in patch movements. Indeed, Adachi and Iwasa (1999) have shown that NLC can be blocked by physical constraints on the membrane. On the other hand, following whole-cell establishment (Fig. 8C,D), conformational changes in prestin are freely expressible, and an increase in bandwidth is found.
Figure 8.
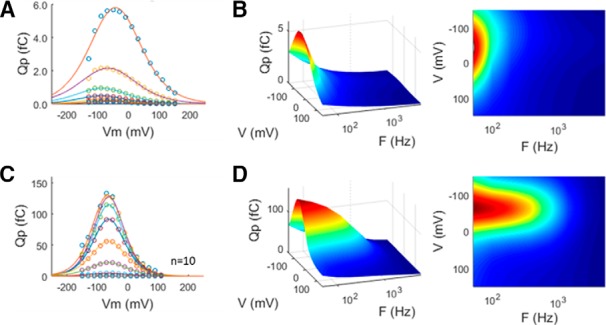
Average Qp frequency response for on-cell patches compared with subsequent whole-cell measures. A, On-cell Qp with Boltzmann fits to data from individual frequencies. B, Frequency response in patches is low pass. C, D, Following patch rupture, Qp increases (C) and frequency response extends (D). These data possibly signify that patch movements are constrained compared with whole-cell conditions, as previously suggested (Gale and Ashmore, 1997). Five millivolt peak AC stimulation. Patch responses were averaged 32 times.
Finally, we directly studied eM frequency response using the microchamber technique, which theoretically has enormous wideband voltage delivery (Dallos and Evans, 1995; Frank et al., 1999) and, similar to whole-cell configuration, allows for unencumbered conformational changes in prestin.
It is well known that the relaxation time course of measured currents induced by voltage perturbation in whole-cell voltage clamp mirrors the time course (frequency response) of the voltage imposed across the cell membrane (Sigworth, 1995). We discussed some electrical characteristics of the microchamber in Materials and Methods. In Figure 9C–E, we additionally emphasize that the frequency response of the currents measured in the microchamber configuration also characterizes the frequency response of the voltages delivered to the membranes inside and outside the chamber. In this figure, we show results from a Matlab Simscape model of the microchamber using our stimulus protocol (see Fig. 11, model parameters in legend). The time constants of current in Figure 9C (fitted black lines; τta = 19.5 μs; τtb = 16.2 μs) are the same for membrane voltage inside (Fig. 9D; τta = 19.4 μs; τtb = 15.9 μs) and outside (Fig. 9E; τta = 19.5 μs; τtb = 16.5 μs) the microchamber. A Lorentzian function A = 1/[1 + (2πfτ)2]1/2 is used to generate a normalized magnitude frequency response that can be used to correct the frequency roll-off of voltage-dependent processes driven by the clamp, which we do below for our microchamber eM data. It is important to have frequency response estimates coincident with protocol stimulation, as drifts in the resistive components of the microchamber can have dramatic effects on the speed of voltage excitation (see Fig. 11).
Figure 10 shows microchamber measures of OHC eM at DC and across frequencies. Maximum DC eM gain (peak of the Boltzmann fit derivative) is 16.8 nm/mV in excellent agreement with earlier reports (Ashmore, 1987; Santos-Sacchi, 1989; Fig. 10A). The z parameter of the microchamber eM Boltzmann fit (0.83) also compares favorably to that of NLC (0.86) and Qp (0.84), detailed above (Fig. 5). Based on our microchamber clamp τ (Fig. 10B), eM data were corrected for a cutoff frequency of 6.17–6.64 kHz. The microchamber approach reveals a second exponential component (τ2) of eM that was unseen in the whole-cell data because of clamp τ limitations. Fitted sums of two Lorentzians were made at two microchamber offset voltages. At zero microchamber offset, A1: 1.63 nm/mV; A2: 3.45 nm/mV; τ1: 0.68 ms; τ2: 18.19 μs. At −68 mV microchamber offset, near Vh, A1: 11.52 nm/mV; A2: 4.32 nm/mV; τ1: 3.45 ms; τ2: 25.26 μs. Both slow and fast exponential component magnitudes and time constants were influenced by offsets from Vh, in a similar fashion to whole-cell data (Fig. 7). This indicates that the kinetics of the second component takes on increasingly greater dominance as excitation moves away from Vh, and that prestin follows the kinetic rules governing voltage-dependent proteins.
Discussion
NLC reflects the restricted movement of sensor charge (or gating charge) in response to transmembrane voltage perturbations, and is a characteristic of membrane-bound, voltage-dependent proteins, such as ion channels and some transporter family members, including prestin. The time constant of charge movement in voltage-dependent proteins is typically within the 100–1000 μs range. For example, Lu et al. (1995), using very wideband capacitance measures, have shown that the GAT1 cotransporter and the cardiac Na, K pump present capacitance frequency responses over an order of magnitude slower than that produced by voltage-induced translocations of the small hydrophobic ion dipicrylamine across the membrane field: a rate of 9500 s−1 (τ = 105 μs, fc = 1.5 kHz). Similar time constant estimates of ion channel gating currents are also within this range, and differences in kinetics among voltage-sensitive proteins likely arise from molecular variation within the protein (even within a single residue), leading to alterations in energy barriers between conformational states (Lacroix and Bezanilla, 2012). In the case of prestin, displacement currents represent charge movements that drive conformational changes in the protein, and effect voltage-dependent mechanical responses in OHCs, so-called electromotility. Since the initial identification and characterization of NLC/gating currents in OHCs (Ashmore, 1989, 1990; Santos-Sacchi, 1990, 1991), it has been viewed as a frequency-independent, fast two-state Boltzmann process. In fact, the frequency extent of NLC and eM has been documented out to progressively higher limits over the years (Ashmore, 1987; Santos-Sacchi, 1990, 1992; Dallos and Evans, 1995; Frank et al., 1999). Indeed, electrically evoked eM presents well above the auditory frequency requirements of species that have been studied (Frank et al., 1999; Grosh et al., 2004). In the present study, we provide evidence that counters the prevailing concept of ultrafast, voltage-driven eM.
By analyzing simultaneous and synchronous measures of eM, NLC, and sensor charge (Qp) at voltage-stimulating frequencies from DC to 12.5 kHz, we show that within this bandwidth NLC displays a low-pass nature that reveals the limiting kinetics acting on eM and Qp. Both eM and NLC display slow and fast components, the eM components near Vh [τ1 = 3.45 ms (33.8 Hz); τ2 = 25.26 μs (6.25 kHz)] being similar to our current estimate of NLC cutoff frequency at Vh [τ1 = 1.16 ms (137.2 Hz); τ2 = 32.6 μs (4.88 kHz)] at room temperature. At zero microchamber offset, eM time constants are faster [τ1 = 0.68 ms (234 Hz); τ2 = 18.2 μs (8.74 kHz)]. Earlier, Gale and Ashmore (1997) found a time constant of 16 μs (9.94 kHz) for NLC. Corrections for in vivo temperatures could extend the bandwidth. Indeed, we have found significant effects of temperature on NLC (Santos-Sacchi and Huang, 1998; Meltzer and Santos-Sacchi, 2001; Santos-Sacchi et al., 2009; Okunade and Santos-Sacchi, 2013), giving approximately a Q10 of 2. A previous Q10 estimate was 1.33 (Ashmore and Holley, 1988). Assuming a Q10 of 2, Gale and Ashmore's fc for NLC is 22.8 kHz. Our fastest eM response would indicate an fc of 20 kHz at 37°C. Thus, even correcting voltage-dependent NLC kinetics to body temperature would not match the widest eM bandwidth estimate (80 kHz or 2 μs τ, fc being given by 1/2πt) of Frank et al. (1999) found at room temperature.
Our observation of low-pass electromechanical behavior within our investigated bandwidth is clearly related to offset position along the eM–Vm Boltzmann relation where measures were made (Fig. 10). Frequency response measures arising from voltage perturbations away from Vh provide enhanced Vm following fidelity, i.e., a faster and flatter frequency response. It is well known that two-state, voltage-dependent transition kinetics between conformations is slowest at Vh (where the peak energy barrier resides), and speeds up on either side of Vh (Hodgkin and Huxley, 1952; Hille, 1992; Destexhe and Huguenard, 2000). The replotted eM gain data of Frank et al. and Dallos et al. (Fig. 10) clearly show that their measures were taken at significant offsets from Vh, where we also find flatter frequency responses. This likely explains the missing slower component in their data. However, what about the high-frequency limit derived from our eM/NLC and Gale and Ashmore's NLC measures? Why would the Frank et al. eM response extend beyond the limits indicated by NLC kinetics? That is, why is there an apparent uncoupling between prestin charge movement and OHC motility, which we have demonstrated should exist (Figs. 1, 2)? Possible explanations for these kinetic disparities between charge movement and eM may be due to experimental differences among studies.
In voltage-clamp experiments, including the microchamber method, corrections for voltage delivery roll-off must be made since the fidelity of voltage clamp across frequencies suffers from the effects of electrode resistance and membrane capacitance. Accounting for these effects is simply a matter of correcting for the time course of relaxation of measured capacitive currents, as we did. This is a valid and standard approach. Only in the unattainable absence of electrode resistance would no correction be necessary. In Frank et al. (1999), voltage corrections for microchamber frequency response were based on assumed stray capacitance influences, which they explicitly identified, in the absence of compensation circuitry, as limiting their microchamber voltage delivery. However, the microchamber voltage clamp behaves exactly as that of the whole-cell voltage clamp where the bulk of stray capacitance (amplifier, pipette holder, and pipette) does not diminish clamp speed. Indeed, in simulations of models shown in Figure 9, stray capacitance Cs1 has no effect on clamp frequency response, and Cs2, which might arise at the extreme tip of the pipette, would be extremely small with negligible influence on clamp speed. Thus, correction for an assumed effect of voltage roll-off due to stray capacitance could likely have resulted in voltage overcorrections. On the other hand, we agree with Frank et al. that mechanical responses may be impeded by physical constraints, and this is potentially borne out by our very low pass Qp behavior in patches, compared with subsequent whole-cell measures (Fig. 8). Indeed, Gale and Ashmore found a time constant for patch movements ∼84 μs, compared with 16 μs for NLC. So, we might surmise for our measures, that the fast time constant of eM, even in whole-cell mode, could have been physically constrained. It is noteworthy that Frank et al. found a wide range of cutoffs depending on OHC qL, and that for our average qL of 30 μm, their roll-off was at 33 kHz, still substantially faster than our measure at 8.74 kHz.
This possibility of eM physical constraints is highlighted by Frank et al.'s Figure 3A, where eM fc continuously increases as qL decreases, showing an apparent length-dependent cutoff (Fig. 11A). In Figure 11B, we show that this behavior is not expected for an ultrafast process that relies upon and can faithfully follow voltage excitation within the microchamber (see Fig. 9B, legend). That is, the efficacy of AC voltage delivery (fc) in the microchamber should follow a U-shaped function of cell extrusion, with qL = 0.5 providing the slowest voltage-dependent frequency response. That is, the fc of microchamber voltage delivery is symmetrical on either side of qL = 0.5, since the reduced capacitance of the smaller pole, regardless of whether it is the included or excluded pole, will present to the voltage clamp a series combination of the partitioned capacitances. The observation that for qL > 0.5 mechanical fc does not follow voltage fc indicates that the response is not strictly voltage-dependent or that the movement of that excluded pole is mechanically impeded. Interestingly, Frank et al. required an additional overdamped resonance to fit their ultrafast eM data, which they attribute to an inertial contribution (∼6% of the cell's mass).
The relation between resting membrane potential and NLC Vh will determine where along the eM gain function the OHC works. Receptor potentials driving eM at a location away from Vh will provide reduced gain, but enhanced frequency response. Which characteristic is more important for cochlear amplification is difficult to assess; however, it is known that mouse mutants showing one-third of prestin expression and Qp hear normally at low and middle frequencies (Yamashita et al., 2012), indicating that full gain may not be required. Currently, we do not know Vh in vivo. Even the value of resting potential of the OHC in vivo is contested (Dallos et al., 1982; Russell and Sellick, 1983; Johnson et al., 2011). To complicate matters, there is a plethora of biophysical forces that can alter Vh, including intracellular Cl− level, membrane tension, and even membrane potential itself (Iwasa, 1993; Gale and Ashmore, 1994; Kakehata and Santos-Sacchi, 1995; Santos-Sacchi et al., 1998, 2017; Oliver et al., 2001; Rybalchenko and Santos-Sacchi, 2003, 2008). We hypothesize that feedback mechanisms that influence these biophysical forces, and efferent feedback (Brown et al., 1983) that alters resting membrane potential, contribute to a mechanism where eM gain–bandwidth trade-offs influence the effectiveness of cochlear amplification, similar to the tuning performed on operational amplifiers.
A note should be made about the implications of isolated OHC studies to the cell's role in vivo. Currently, it is impossible to monitor, across acoustic frequencies, the length changes in individual OHCs within the organ of Corti. However, tremendous strides have been made using optical coherence tomography to visualize movements within the intact living organ. Thus, unexpected observations of low-frequency mechanical behavior of supporting cells in the cochlear apex (Gao et al., 2014), and intriguing observations of motions at the OHC–Deiters cell interface deep within the organ (Cooper and van der Heijden, 2017) are changing the way we view OHC mechanical influences in the cochlea that underlie cochlear amplification. However, until more precise measures evolve, single-cell studies, which are required to determine intrinsic capabilities of the OHC that may influence cochlear mechanics, remain important for cochlear modelers.
In summary, we find that OHC eM and associated electrical correlates (NLC, Qp) are low pass in nature, presenting behavior that is not very different from other voltage-dependent proteins, including characteristic changes in kinetics with voltage. We establish that eM and sensor charge are coupled in magnitude and time (phase), and confirm, with the microchamber technique, that driving voltage and eM phase differs, as we have shown under whole-cell voltage clamp (Santos-Sacchi and Song, 2014). eM phase lags voltage, similar to a piezoelectric with hysteresis. We speculate that the identification by some ultrafast eM in vivo (Grosh et al., 2004) simply reflects the effects of eM at very low gain levels, which are sufficient to influence structures within the cochlear partition. In other words, cochlear amplification does not require the full magnitude of eM observed at very low frequencies. Finally, it should be noted that intriguing indications exist that within the organ of Corti, mechanical loads on the OHC could alter the cell's frequency response (Iwasa, 2017).
Footnotes
This work was supported by National Institutes of Health–National Institute on Deafness and Other Communication Disorders Grants R01 DC000273, R01 DC016318, and R01 DC008130 to J.S.-S. We appreciate thoughtful discussions with Fred Sigworth, and help with statistics from Fangyong Li.
References
- Adachi M, Iwasa KH (1999) Electrically driven motor in the outer hair cell: effect of a mechanical constraint. Proc Natl Acad Sci U S A 96:7244–7249. 10.1073/pnas.96.13.7244 [DOI] [PMC free article] [PubMed] [Google Scholar]
- Armstrong CM, Bezanilla F (1974) Charge movement associated with the opening and closing of the activation gates of the Na channels. J Gen Physiol 63:533–552. 10.1085/jgp.63.5.533 [DOI] [PMC free article] [PubMed] [Google Scholar]
- Ashmore JF. (1987) A fast motile response in guinea-pig outer hair cells: the cellular basis of the cochlear amplifier. J Physiol 388:323–347. 10.1113/jphysiol.1987.sp016617 [DOI] [PMC free article] [PubMed] [Google Scholar]
- Ashmore JF. (1989) Transducer motor coupling in cochlear outer hair cells. In: Mechanics of hearing (Kemp D, Wilson JP, eds), pp 107–113. New York, NY: Plenum. [Google Scholar]
- Ashmore JF. (1990) Forward and reverse transduction in the mammalian cochlea. Neurosci Res Suppl 12:S39–S50. 10.1016/0921-8696(90)90007-P [DOI] [PubMed] [Google Scholar]
- Ashmore JF, Holley MC (1988) Temperature-dependence of a fast motile response in isolated outer hair cells of the guinea-pig cochlea. Q J Exp Physiol 73:143–145. [DOI] [PubMed] [Google Scholar]
- Brown MC, Nuttall AL, Masta RI (1983) Intracellular recordings from cochlear inner hair cells: effects of stimulation of the crossed olivocochlear efferents. Science 222:69–72. 10.1126/science.6623058 [DOI] [PubMed] [Google Scholar]
- Cooper N, van der Heijden M (2017) Spatial profiles of sound-evoked vibration in the gerbil cochlea. In: Mechanics of hearing conference St. Catherines, ON, Canada, June. [Google Scholar]
- Dallos P, Evans BN (1995) High-frequency motility of outer hair cells and the cochlear amplifier. Science 267:2006–2009. 10.1126/science.7701325 [DOI] [PubMed] [Google Scholar]
- Dallos P, Santos-Sacchi J, Flock A (1982) Intracellular recordings from cochlear outer hair cells. Science 218:582–584. 10.1126/science.7123260 [DOI] [PubMed] [Google Scholar]
- Dallos P, Evans BN, Hallworth R (1991) Nature of the motor element in electrokinetic shape changes of cochlear outer hair cells. Nature 350:155–157. 10.1038/350155a0 [DOI] [PubMed] [Google Scholar]
- Dallos P, Hallworth R, Evans BN (1993) Theory of electrically driven shape changes of cochlear outer hair cells. J Neurophysiol 70:299–323. 10.1152/jn.1993.70.1.299 [DOI] [PubMed] [Google Scholar]
- Dallos P, Wu X, Cheatham MA, Gao J, Zheng J, Anderson CT, Jia S, Wang X, Cheng WH, Sengupta S, He DZ, Zuo J (2008) Prestin-based outer hair cell motility is necessary for mammalian cochlear amplification. Neuron 58:333–339. 10.1016/j.neuron.2008.02.028 [DOI] [PMC free article] [PubMed] [Google Scholar]
- Destexhe A, Huguenard JR (2000) Nonlinear thermodynamic models of voltage-dependent currents. J Comput Neurosci 9:259–270. 10.1023/A:1026535704537 [DOI] [PubMed] [Google Scholar]
- Dong XX, Ospeck M, Iwasa KH (2002) Piezoelectric reciprocal relationship of the membrane motor in the cochlear outer hair cell. Biophys J 82:1254–1259. 10.1016/S0006-3495(02)75481-7 [DOI] [PMC free article] [PubMed] [Google Scholar]
- Frank G, Hemmert W, Gummer AW (1999) Limiting dynamics of high-frequency electromechanical transduction of outer hair cells. Proc Natl Acad Sci U S A 96:4420–4425. 10.1073/pnas.96.8.4420 [DOI] [PMC free article] [PubMed] [Google Scholar]
- Gale JE, Ashmore JF (1994) Charge displacement induced by rapid stretch in the basolateral membrane of the guinea-pig outer hair cell. Proc Biol Sci 255:243–249. 10.1098/rspb.1994.0035 [DOI] [PubMed] [Google Scholar]
- Gale JE, Ashmore JF (1997) An intrinsic frequency limit to the cochlear amplifier. Nature 389:63–66. 10.1038/37968 [DOI] [PubMed] [Google Scholar]
- Gao SS, Wang R, Raphael PD, Moayedi Y, Groves AK, Zuo J, Applegate BE, Oghalai JS (2014) Vibration of the organ of Corti within the cochlear apex in mice. J Neurophysiol 112:1192–1204. 10.1152/jn.00306.2014 [DOI] [PMC free article] [PubMed] [Google Scholar]
- Grosh K, Zheng J, Zou Y, de Boer E, Nuttall AL (2004) High-frequency electromotile responses in the cochlea. J Acoust Soc Am 115:2178–2184. [DOI] [PubMed] [Google Scholar]
- Hille B. (1992) Ionic channels of excitable membranes, 2nd edition Sunderland, MA: Sinauer Associates. [Google Scholar]
- Hodgkin AL, Huxley AF (1952) A quantitative description of membrane current and its application to conduction and excitation in nerve. J Physiol 117:500–544. 10.1113/jphysiol.1952.sp004764 [DOI] [PMC free article] [PubMed] [Google Scholar]
- Huang G, Santos-Sacchi J (1993) Mapping the distribution of the outer hair cell motility voltage sensor by electrical amputation. Biophys J 65:2228–2236. 10.1016/S0006-3495(93)81248-7 [DOI] [PMC free article] [PubMed] [Google Scholar]
- Iwasa KH. (1993) Effect of stress on the membrane capacitance of the auditory outer hair cell. Biophys J 65:492–498. 10.1016/S0006-3495(93)81053-1 [DOI] [PMC free article] [PubMed] [Google Scholar]
- Iwasa KH. (2017) Negative membrane capacitance of outer hair cells: electromechanical coupling near resonance. Sci Rep 7:12118. 10.1038/s41598-017-12411-6 [DOI] [PMC free article] [PubMed] [Google Scholar]
- Iwasa KH, Kachar B (1989) Fast in vitro movement of outer hair cells in an external electric field: effect of digitonin, a membrane permeabilizing agent. Hear Res 40:247–254. 10.1016/0378-5955(89)90165-2 [DOI] [PubMed] [Google Scholar]
- Johnson SL, Beurg M, Marcotti W, Fettiplace R (2011) Prestin-driven cochlear amplification is not limited by the outer hair cell membrane time constant. Neuron 70:1143–1154. 10.1016/j.neuron.2011.04.024 [DOI] [PMC free article] [PubMed] [Google Scholar]
- Kakehata S, Santos-Sacchi J (1995) Membrane tension directly shifts voltage dependence of outer hair cell motility and associated gating charge. Biophys J 68:2190–2197. 10.1016/S0006-3495(95)80401-7 [DOI] [PMC free article] [PubMed] [Google Scholar]
- Kilic G, Lindau M (2001) Voltage-dependent membrane capacitance in rat pituitary nerve terminals due to gating currents. Biophys J 80:1220–1229. 10.1016/S0006-3495(01)76098-5 [DOI] [PMC free article] [PubMed] [Google Scholar]
- Lacroix JJ, Bezanilla F (2012) Tuning the voltage-sensor motion with a single residue. Biophys J 103:L23–25. 10.1016/j.bpj.2012.06.030 [DOI] [PMC free article] [PubMed] [Google Scholar]
- Liberman MC, Gao J, He DZ, Wu X, Jia S, Zuo J (2002) Prestin is required for electromotility of the outer hair cell and for the cochlear amplifier. Nature 419:300–304. 10.1038/nature01059 [DOI] [PubMed] [Google Scholar]
- Lu CC, Kabakov A, Markin VS, Mager S, Frazier GA, Hilgemann DW (1995) Membrane transport mechanisms probed by capacitance measurements with megahertz voltage clamp. Proc Natl Acad Sci U S A 92:11220–11224. 10.1073/pnas.92.24.11220 [DOI] [PMC free article] [PubMed] [Google Scholar]
- Meltzer J, Santos-Sacchi J (2001) Temperature dependence of non-linear capacitance in human embryonic kidney cells transfected with prestin, the outer hair cell motor protein. Neurosci Lett 313:141–144. 10.1016/S0304-3940(01)02266-2 [DOI] [PubMed] [Google Scholar]
- Mountain DC, Hubbard AE (1994) A piezoelectric model of outer hair cell function. J Acoust Soc Am 95:350–354. 10.1121/1.408273 [DOI] [PubMed] [Google Scholar]
- Okunade O, Santos-Sacchi J (2013) IR laser-induced perturbations of the voltage-dependent solute carrier protein SLC26a5. Biophys J 105:1822–1828. 10.1016/j.bpj.2013.09.008 [DOI] [PMC free article] [PubMed] [Google Scholar]
- Oliver D, He DZ, Klöcker N, Ludwig J, Schulte U, Waldegger S, Ruppersberg JP, Dallos P, Fakler B (2001) Intracellular anions as the voltage sensor of prestin, the outer hair cell motor protein. Science 292:2340–2343. 10.1126/science.1060939 [DOI] [PubMed] [Google Scholar]
- Russell IJ, Sellick PM (1983) Low-frequency characteristics of intracellularly recorded receptor potentials in guinea-pig cochlear hair cells. J Physiol 338:179–206. 10.1113/jphysiol.1983.sp014668 [DOI] [PMC free article] [PubMed] [Google Scholar]
- Rybalchenko V, Santos-Sacchi J (2003) Cl− flux through a non-selective, stretch-sensitive conductance influences the outer hair cell motor of the guinea-pig. J Physiol 547:873–891. 10.1113/jphysiol.2002.036434 [DOI] [PMC free article] [PubMed] [Google Scholar]
- Rybalchenko V, Santos-Sacchi J (2008) Anion control of voltage sensing by the motor protein prestin in outer hair cells. Biophys J 95:4439–4447. 10.1529/biophysj.108.134197 [DOI] [PMC free article] [PubMed] [Google Scholar]
- Santos-Sacchi J. (1989) Asymmetry in voltage-dependent movements of isolated outer hair cells from the organ of corti. J Neurosci 9:2954–2962. 10.1523/JNEUROSCI.09-08-02954.1989 [DOI] [PMC free article] [PubMed] [Google Scholar]
- Santos-Sacchi J. (1990) Fast outer hair cell motility: how fast is fast? In: The mechanics and biophysics of hearing (Dallos P, Geisler CD, Matthews JW, Ruggero MA, Steele CR, eds), pp 69–75. Berlin, Germany: Springer. [Google Scholar]
- Santos-Sacchi J. (1991) Reversible inhibition of voltage-dependent outer hair cell motility and capacitance. J Neurosci 11:3096–3110. 10.1523/JNEUROSCI.11-10-03096.1991 [DOI] [PMC free article] [PubMed] [Google Scholar]
- Santos-Sacchi J. (1992) On the frequency limit and phase of outer hair cell motility: effects of the membrane filter. J Neurosci 12:1906–1916. 10.1523/JNEUROSCI.12-05-01906.1992 [DOI] [PMC free article] [PubMed] [Google Scholar]
- Santos-Sacchi J. (2004) Determination of cell capacitance using the exact empirical solution of dY/dCm and its phase angle. Biophys J 87:714–727. 10.1529/biophysj.103.033993 [DOI] [PMC free article] [PubMed] [Google Scholar]
- Santos-Sacchi J. (2018) High frequency measures of OHC nonlinear capacitance (NLC) and their significance: why measures stray away from predictions. In: To Ear and Back Again-Advances in Auditory Biophysics (Proceedings of the 13th Mechanics of Hearing Workshop) (Bergevin C, Puria S, eds). Melville, NY: AIP, in press. [Google Scholar]
- Santos-Sacchi J, Dilger JP (1988) Whole cell currents and mechanical responses of isolated outer hair cells. Hear Res 35:143–150. 10.1016/0378-5955(88)90113-X [DOI] [PubMed] [Google Scholar]
- Santos-Sacchi J, Huang G (1998) Temperature dependence of outer hair cell nonlinear capacitance. Hear Res 116:99–106. 10.1016/S0378-5955(97)00204-9 [DOI] [PubMed] [Google Scholar]
- Santos-Sacchi J, Song L (2014) Chloride-driven electromechanical phase lags at acoustic frequencies are generated by SLC26a5, the outer hair cell motor protein. Biophys J 107:126–133. 10.1016/j.bpj.2014.05.018 [DOI] [PMC free article] [PubMed] [Google Scholar]
- Santos-Sacchi J, Song L (2016) Chloride anions regulate kinetics but not voltage-sensor Qmax of the solute carrier SLC26a5. Biophys J 110:2551–2561. 10.1016/j.bpj.2016.05.002 [DOI] [PMC free article] [PubMed] [Google Scholar]
- Santos-Sacchi J, Kakehata S, Takahashi S (1998) Effects of membrane potential on the voltage dependence of motility-related charge in outer hair cells of the guinea-pig. J Physiol 510:225–235. 10.1111/j.1469-7793.1998.225bz.x [DOI] [PMC free article] [PubMed] [Google Scholar]
- Santos-Sacchi J, Shen WX, Zheng J, Dallos P (2001) The outer hair cell lateral membrane motor, prestin, shows hysteresis. Biophys J 80:346A. [DOI] [PMC free article] [PubMed] [Google Scholar]
- Santos-Sacchi J, Song L, Zheng J, Nuttall AL (2006) Control of mammalian cochlear amplification by chloride anions. J Neurosci 26:3992–3998. 10.1523/JNEUROSCI.4548-05.2006 [DOI] [PMC free article] [PubMed] [Google Scholar]
- Santos-Sacchi J, Song L, Li XT (2009) Firing up the amplifier: temperature, pressure and voltage jump studies on OHC motor capacitance. In: Concepts and challenges in the biophysics of hearing. Singapore: World Scientific; 10.1142/9789812833785_0058 [DOI] [Google Scholar]
- Santos-Sacchi J, Navaratnam D, Raphael R, Oliver D (2017) The cochlea, chapter 5: prestin—molecular mechanisms underlying outer hair cell electromotility. In: Springer handbook of auditory research. New York, NY: Springer. [Google Scholar]
- Schnee ME, Santos-Sacchi J, Castellano-Muñoz M, Kong JH, Ricci AJ (2011a) Calcium-dependent synaptic vesicle trafficking underlies indefatigable release at the hair cell afferent fiber synapse. Neuron 70:326–338. 10.1016/j.neuron.2011.01.031 [DOI] [PMC free article] [PubMed] [Google Scholar]
- Schnee ME, Castellano-Muñoz M, Kong JH, Santos-Sacchi J, Ricci AJ (2011b) Tracking vesicle fusion from hair cell ribbon synapses using a high frequency, dual sine wave stimulus paradigm. Commun Integr Biol 4:785–787. 10.4161/cib.17822 [DOI] [PMC free article] [PubMed] [Google Scholar]
- Sigworth FJ. (1995) Electronic design of the patch clamp. In: Single-channel recording (Sakmann B, Neher E, eds), pp 95–127. Boston, MA: Springer US. [Google Scholar]
- Song L, Santos-Sacchi J (2013) Disparities in voltage-sensor charge and electromotility imply slow chloride-driven state transitions in the solute carrier SLC26a5. Proc Natl Acad Sci U S A 110:3883–3888. 10.1073/pnas.1218341110 [DOI] [PMC free article] [PubMed] [Google Scholar]
- Yamashita T, Fang J, Gao J, Yu Y, Lagarde MM, Zuo J (2012) Normal hearing sensitivity at low-to-middle frequencies with 34% prestin-charge density. PLoS One 7:e45453. 10.1371/journal.pone.0045453 [DOI] [PMC free article] [PubMed] [Google Scholar]
- Zheng J, Shen W, He DZ, Long KB, Madison LD, Dallos P (2000) Prestin is the motor protein of cochlear outer hair cells. Nature 405:149–155. 10.1038/35012009 [DOI] [PubMed] [Google Scholar]


