

Abstract
Key points
The actin cytoskeleton regulating GTPase, Rac1, is a novel player in insulin-stimulated glucose uptake in muscle in vivo.
High‐fat diet (HFD) exacerbates muscle insulin resistance in Rac1 muscle knockout (mKO) mice.
Muscle Rac1 KO protects against HFD‐induced insulin resistance in fat tissue indicating tissue cross‐talk.
A fatty diet markedly reduces insulin clearance in mice.
Abstract
Insulin resistance and perturbations in glucose metabolism underpin common lifestyle diseases such as type 2 diabetes and obesity. Insulin resistance in muscle is characterized by compromised activity of the GTPase, Ras‐related C3 Botulinum toxin substrate 1 (Rac1), yet the role of Rac1 in insulin‐stimulated glucose uptake in vivo and diet‐induced insulin resistance is unknown. Inducible muscle‐specific Rac1 knockout (Rac1 mKO) and wild type (WT) littermate mice were either fed a chow or a 60% high‐fat diet (HFD). Insulin‐stimulated 2‐deoxy‐glucose uptake, intracellular signalling, protein expression, substrate utilization, and glucose and insulin tolerance were assessed. In chow‐fed mice, in vivo insulin‐stimulated glucose uptake was reduced in triceps, soleus and gastrocnemius muscles from Rac1 mKO mice. HFD‐induced whole body insulin resistance was exacerbated by the lack of muscle Rac1 and glucose uptake was reduced in all muscles, except for soleus. Muscle Akt (also known as protein kinase B) signalling was unaffected by diet or genotype. In adipose tissue, Rac1 mKO mice were protected from HFD‐induced insulin resistance (with respect to both glucose uptake and phosphorylated‐Akt), rendering their whole body glucose tolerance comparable to WT mice on HFD. Our findings show that lack of Rac1 exacerbates HFD‐induced insulin resistance in skeletal muscle. Whole body glucose tolerance, however, was largely unaffected in Rac1 mKO mice, likely due to improved insulin‐stimulated glucose uptake in adipose tissue. We conclude that lack of Rac1 in the context of obesity is detrimental to insulin‐stimulated muscle glucose uptake in muscle independently of Akt signalling.
Keywords: diet‐induced obesity, Rac1, glucose uptake, muscle, adipose tissue, glucose homeostasis
Key points
The actin cytoskeleton regulating GTPase, Rac1, is a novel player in insulin-stimulated glucose uptake in muscle in vivo.
High‐fat diet (HFD) exacerbates muscle insulin resistance in Rac1 muscle knockout (mKO) mice.
Muscle Rac1 KO protects against HFD‐induced insulin resistance in fat tissue indicating tissue cross‐talk.
A fatty diet markedly reduces insulin clearance in mice.
Introduction
Obese individuals often develop insulin resistance and diminished glucose tolerance (Saltiel & Kahn, 2001; Biddinger & Kahn, 2006) and thereby have a higher risk for developing metabolic diseases, such as type 2 diabetes.
Accounting for approximately 40% of total human body mass, skeletal muscle insulin resistance can cause metabolic disease, in particular because muscles are responsible for up to 75% of insulin‐stimulated glucose uptake (Defronzo et al. 1985; Abdul‐Ghani & Defronzo, 2010). Furthermore, skeletal muscle is a major site of insulin resistance in obesity and type 2 diabetes (Bjornholm & Zierath, 2005; Biddinger & Kahn, 2006; Defronzo & Tripathy, 2009). From a clinical point of view, it is therefore critical to clarify the mechanisms regulating insulin‐stimulated glucose uptake in muscle in order to identify potential targets for anti‐diabetic and obesity therapy.
The small GTPase Rac1 regulates insulin‐stimulated actin reorganization and glucose transport in muscle cells (JeBailey et al. 2007; Sylow et al. 2013a, 2014). Interestingly, insulin‐induced Rac1 signalling is reduced in skeletal muscle of obese and type 2 diabetic subjects (Sylow et al. 2013a), making Rac1 a clinically relevant target. Insulin resistance in obesity and type 2 diabetes is not associated with reduced Rac1 protein, rather a reduced ability of Rac1 to mediate the relevant signals (Sylow et al. 2013a). Moreover, insulin‐resistant skeletal muscles display altered actin cytoskeleton morphology, a structure regulated by Rac1 activity (Tong et al. 2001; JeBailey et al. 2007; Habegger et al. 2012). Such evidence suggests that defective Rac1 signalling contributes to the impaired glucose uptake observed in insulin‐resistant muscles and that Rac1 could play a pivotal role in muscle insulin sensitivity and metabolic responses to diet. In this study we therefore examined the effects of muscle‐specific Rac1 ablation on insulin‐stimulated glucose uptake and muscle metabolism in the context of a high‐fat diet. Based on Rac1's role in GLUT4, the primary glucose transporter for insulin‐stimulated glucose uptake in skeletal muscle, we hypothesized that Rac1 gene ablation would reduce insulin‐stimulated glucose uptake in vivo, worsen insulin resistance, and alter metabolic function in muscle in response to a fatty diet.
Methods
Ethical approval
All experiments were approved by the Danish Animal Experimental Inspectorate and conform to the principles and regulations as described in Grundy (2015).
Tetracycline‐inducible muscle‐specific Rac1 knockout (mKO) mice
Inducible muscle‐specific male and female Rac1 mKO and littermate WT control mice were generated as previously described (Sylow et al. 2013b, 2016). Rac1 mKO was induced at 12–16 weeks of age by adding doxycycline (a tetracycline analogue) in the drinking water (1 g L−1; Sigma Aldrich, Copenhagen, Denmark) for 3 weeks followed by a washout period of 3 weeks. This treatment was repeated at week 10 of the intervention period. An 18 weeks diet intervention was started at 14–18 weeks of age and mice received either a standard rodent chow diet (Altromin no. 1324; Brogaarden, Horsholm, Denmark), or a 60% high‐fat diet (HFD) (no. D12492; Brogaarden, Denmark) and water ad libitum. Body weight was assessed every week.
For initial experiments to study insulin clearance, diet intervention was initiated at 14 weeks of age in female C57BL/6J (Taconic, Lille Skensved, Denmark) mice for 18 weeks. All animals were maintained on a 12 h:12 h light–dark cycle, and group housed at 20–21°C. We observed no sex difference in any of our analysis and therefore results for male and female mice were pooled. Males (16 mice) and females (50 mice) were evenly (±2) allocated to each intervention group.
In vivo 2‐deoxy‐glucose experiments
To determine 2‐deoxy‐glucose (2DG) uptake in muscle and adipose tissue, [3H]2DG (Perkin Elmer) was injected retro‐orbitally in a bolus of saline containing 66.7 μCi mL−1 [3H]2DG corresponding to ∼9 μCi/mouse (6 μL g−1 body weight) in Rac1 mKO and WT control mice. The injectate also contained insulin (Actrapid; Novo Nordisk, Bagsværd, Denmark) at 0.5 U kg−1 or 0.3 U kg−1 body weight for chow or HFD mice, respectively, or a comparable volume of saline. (Different insulin doses were used due to reduced insulin clearance in HFD rodents as shown in this study and by others (Stromblad & Bjorntorp, 1986; Kurauti et al. 2016) to obtain the same absolute plasma insulin concentration.) Prior to stimulation, mice were fasted for 3–5 h from 07:00 h and anaesthetized (intraperitoneal injection of 7.5/9.5 mg (chow/HFD) pentobarbital sodium 100 g−1 body weight) for 15 min. Blood samples were collected from the tail vein immediately prior to insulin or saline injection and after 5 and 10 min and analysed for glucose concentration using a glucometer (Bayer Contour; Bayer, Münchenbuchsee, Switzerland). At 10 min, blood plasma samples were also analysed for specific 2‐[3H]DG tracer activity and insulin. After 10 min, soleus, quadriceps, tibialis anterior, triceps, gastrocnemius muscles, epididymal adipose tissue, and the liver were excised and quickly frozen in liquid nitrogen and stored at −80°C until processing. 2DG uptake was analysed as described (Fueger et al. 2004; Sylow et al. 2016). Once tissues were removed, mice were killed by cervical dislocation.
Respiratory exchange ratio measurements
O2 uptake and CO2 production were measured at week 15 into diet intervention using a CaloSys apparatus (TSE Systems, Bad Homburg, Germany) and the data presented are the average for light and dark periods measured over three consecutive days in Rac1 mKO or WT mice. The respiratory exchange ratio (RER) was calculated as CO2 production/O2 uptake.
Body composition analysis
Fat mass and lean body mass were determined using an Echo MRI scanner at week 17 into the diet intervention.
Glucose tolerance test
Mice were fasted for 6 h from 07:00 h. Glucose (2 g kg−1 body weight) was administered intraperitoneally and blood was collected from the tail vein at time points 0, 30, 60, 90 and 120 min; blood glucose concentration was determined using a glucometer. Area under the curve was calculated using the trapezoidal rule with the baseline values for each group subtracted. For measurements of plasma insulin, a separate experiment was performed and tail vein blood was sampled at time points 0 and 20 min after intraperitoneal glucose injection (2 g kg−1 body weight) and insulin was analysed in duplicates in plasma (80‐INSTRU‐E10; ALPCO Diagnostics). The glucose tolerance test and measurements of plasma insulin were performed at week 17 into the diet intervention.
In vitro 2DG transport measurement in incubated muscle
Soleus and extensor digitorum longus (EDL) muscles were excised from anaesthetized mice (9.5 mg pentobarbital + lidocaine (lignocaine) (100 g)−1 body weight, intraperitoneally) and pre‐incubated for 30 min in incubation chambers (Multi Myograph System, Danish Myo‐Technology) containing 30°C Krebs–Ringer–Henseleit buffer supplemented with 8 mm mannitol and 2 mm pyruvate. Muscles were stimulated with 60 nm insulin for 20 min and 2DG transport was measured for the last 10 min using [3H]2DG and [14C]mannitol radioactive tracers as described in Sylow et al. (2013b).
Tissue analyses
Muscle, white adipose and liver tissue were pulverized in liquid nitrogen and homogenized 2 × 0.5 min at 30 Hz using a TissueLyser II bead mill (Qiagen, USA) in ice‐cold homogenization buffer (10% glycerol, 1% NP‐40, 20 mm sodium pyrophosphate, 150 mm NaCl, 50 mm Hepes (pH 7.5), 20 mm β‐glycerophosphate, 10 mm NaF, 2 mm phenylmethylsulfonyl fluoride (PMSF), 1 mm EDTA (pH 8.0), 1 mm EGTA (pH 8.0), 2 mm Na3VO4, 10 μg mL−1 leupeptin, 10 μg mL−1 aprotinin, 3 mm benzamidine). After rotation end‐over‐end for 30 min at 4°C, supernatants were collected by centrifugation (10,000 g) for 20 min at 4°C. Muscle tissue was submitted to centrifugation once, while adipose tissue and liver tissue were centrifuged twice.
Immunoblotting
Lysate protein concentrations were measured using the bicinchoninic acid (BCA) method with bovine serum albumin (BSA) as standard (Pierce). Total protein and phosphorylation levels of relevant proteins were determined by standard immunoblotting techniques loading equal amounts of protein. The primary antibodies used were phospho (p)‐AktThr308 (no. 9275), p‐AktSer473 (no. 4051), Akt2 total (no. 3063), p‐TBC1D4Thr642 (no. 4288), TBC1D4 total (no. 07‐741), β‐actin (no. 4973) (Cell Signaling Technology), GLUT4 (no. PA1‐1065, ThermoFisher Scientific) and Rac1 (no. ARC03, Cytoskeleton Inc.). Polyvinylidene difluoride membranes (Immobilon Transfer Membrane; Millipore) were blocked in Tris‐buffered saline (TBS)‐Tween 20 containing 2% skimmed milk or 5% BSA protein for 30–60 min at room temperature. Membranes were incubated with primary antibodies overnight at 4°C, followed by incubation with horseradish peroxidase‐conjugated secondary antibody for 30 min at room temperature. Coomassie brilliant blue staining was used as a loading control (Welinder & Ekblad, 2011). Due to uneven protein content in parts of the fat samples, we related protein data to the Coomassie blue staining as indicated. Bands were visualized using the Bio‐Rad ChemiDoc MP Imaging System and enhanced chemiluminescence (ECL+; Amersham Biosciences).
RNA isolation, reverse transcription and real time PCR
RNA was isolated from 20 mg gastrocnemius muscle and 40 mg adipose tissue, using a modified guanidinium thiocyanate–phenol–chloroform extraction method (Chomczynski & Sacchi, 1987; Pilegaard et al. 2000). The concentration of RNA in each sample was determined using the ND‐1000 spectrophotometer (Thermo Scientific). Reverse transcription was performed on 2 μg muscle RNA and 1 μg adipose tissue RNA using SuperScript II Reverse Transcriptase and Oligo(dT) (Life Technologies). Real‐time PCR was performed on the cDNA using TaqMan Universal Master Mix II (Applied Biosystems). Primers and TaqMan probes were designed using the mouse‐specific database from Ensemble (http://www.ensembl.org) and Primer Express (Applied Biosystems), except β‐actin, which was a pre‐developed assay reagent (Applied Biosystems). Samples were loaded in triplicates and quantification performed using the ABI PRISM 7900 Real‐Time PCR System (Applied Biosystems). The mRNA levels were normalized to total cDNA content determined by use of OliGreen (Invitrogen) (Lundby et al. 2005).
Statistical analyses
Results are shown as means ± standard deviation (SD). Statistical testing was performed using t tests or two‐way (repeated measures when appropriate) ANOVA as applicable. Tukey's post hoc test was performed when ANOVA revealed significant main effects and interactions. Statistical analyses were performed using GraphPad Prism, version 7 (GraphPad Software, La Jolla, CA, USA). The significance level was set at α = 0.05.
Results
High‐fat diet reduced insulin clearance in mice
Previous studies have reported decreased insulin clearance by the liver in obese rats (Stromblad & Bjorntorp, 1986; Brandimarti et al. 2013). Because of that we analysed plasma insulin in mice on a chow diet or 60% HFD to evaluate if the same insulin dose would elicit similar plasma insulin concentrations in both lean and obese C57BL/6J mice. Eighteen weeks of HFD increased body weight by an average of 9 g (Fig. 1 A) and reduced glucose tolerance (Fig. 1 B) compared with chow. The experimental design for evaluating in vivo insulin stimulation is outlined in Fig. 1 C. Saline with or without 0.5 U kg−1 insulin was injected in the retro‐orbital (r.o.) vein. Five minutes after insulin injection, blood glucose was lowered by 2 mm on average in the chow‐fed group but not in the HFD group (Fig. 1 D). Blood glucose was reduced in chow (−4 mm) and HFD (−2 mm) groups at 10 min after insulin injection. Plasma insulin concentration 10 min after injection was increased 3‐fold by r.o. injection of 0.5 U kg−1 insulin in the chow‐fed group (Fig. 1 E). In stark contrast, 0.5 U kg−1 insulin increased plasma insulin concentration by 7‐fold in the HFD groups. These findings suggest that HFD reduces insulin clearance in mice. For subsequent experiments on Rac1 mKO mice, we therefore used 0.5 U kg−1 and 0.3 U kg−1 insulin for chow‐ and HFD‐fed mice, respectively, to elicit similar plasma insulin concentrations for both diet groups.
Figure 1. HFD‐fed C57BL/6J mice have lower insulin clearance compared to chow fed mice.
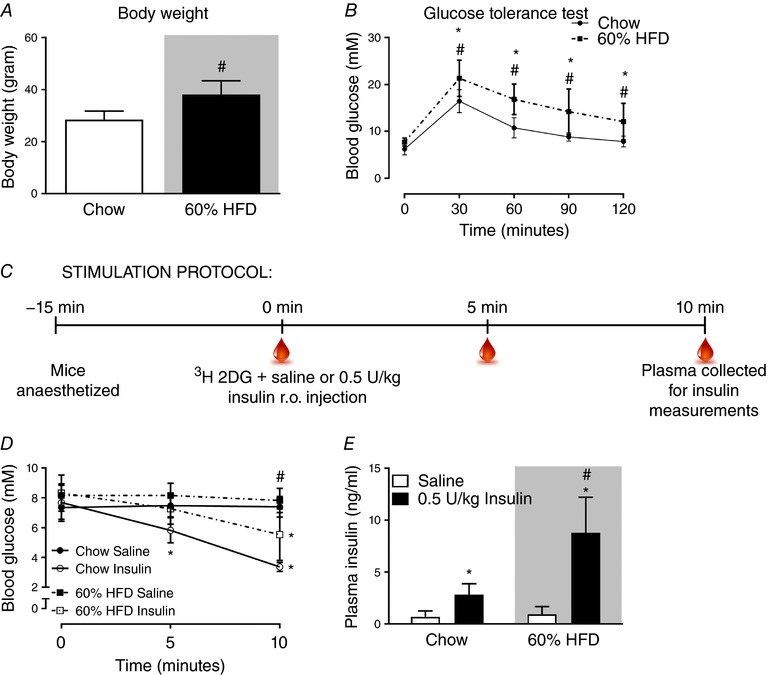
A, body weight of C57BL/6J mice fed either standard chow diet or 60% high‐fat diet (HFD) for 18 weeks. n = 15–16. B, glucose tolerance test at week 17 into the diet intervention; blood glucose following intraperitoneal injection of glucose (2 g kg−1 body weight). n = 15–16. C, stimulation protocol for in vivo analysis of plasma insulin following retro‐orbital (r.o.) insulin injection (0.5 U kg−1). D, blood glucose prior to and following 5 and 10 min r.o. saline or insulin injection. n = 7. E, plasma insulin concentration in r.o. saline‐ or insulin‐injected groups. n = 7. Shaded areas indicate HFD. Significant effect of glucose/insulin stimulation is indicated by * (P < 0.001). Significant effect of diet is indicated by # (P < 0.001). Unpaired t test (A) and 2‐way ANOVAs (repeated measurements for B and D) were performed for statistical analysis. Values are means ± SD. [Color figure can be viewed at http://wileyonlinelibrary.com]
Glucose tolerance and body composition is unaltered by Rac1 mKO
During a period of 18 weeks of HFD Rac1 mKO and WT mice gained on average 9 g (∼30% increase in body weight) and weighed significantly more than the mice on chow (Fig. 2 A). Body composition was similar in Rac1 mKO and control mice on chow diet and fat mass was increased 20% by HFD in both genotypes (Fig. 2 B and C). Lean mass was reduced 20% by HFD in both Rac1 mKO and control mice. HFD reduced glucose tolerance to a similar degree in both genotypes (Fig. 2 D). We observed no significant difference in whole body glucose tolerance between genotypes at any time point although Rac1 mKO mice after 30 min displayed higher blood glucose than control mice on chow, as has been observed previously (Sylow et al. 2013a). The relatively small effect of Rac1 mKO on glucose tolerance is likely due to compensatory increased insulin secretion, as we have previously seen in Rac1 mKO mice on a chow diet (Sylow et al. 2013a). This was also the case in mice on a HFD where blood glucose (Fig. 2 E) and plasma insulin (Fig. 2 F) were measured before and 20 min following glucose injection. Here we observed a tendency (P < 0.068) towards a 60% increased plasma insulin in response to the glucose challenge in HFD Rac1 mKO mice compared to controls.
Figure 2. Muscle‐specific deletion of Rac1 does not affect whole‐body glucose tolerance, fat gain or metabolic parameters in HFD‐fed mice.
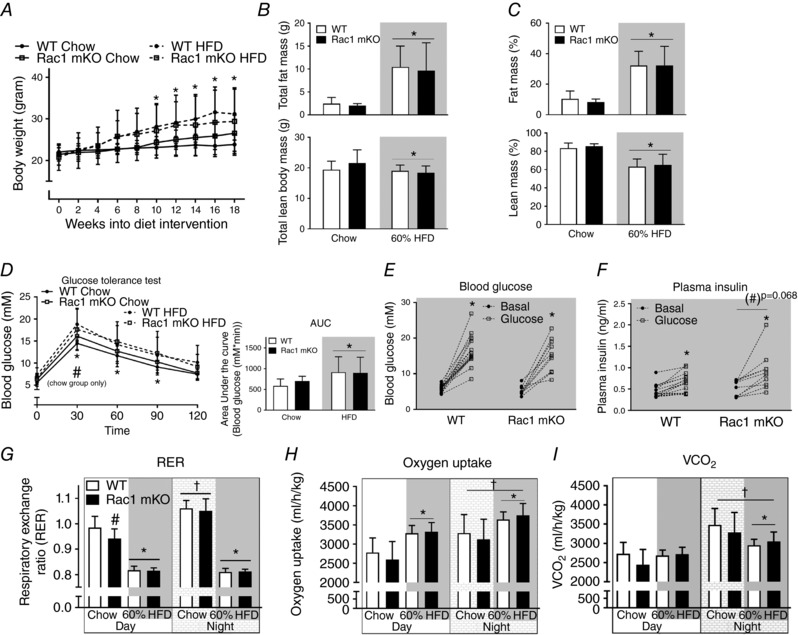
A, body weight in wild type (WT) and muscle‐specific Rac1 knockout (mKO) littermate mice on chow or 60% high‐fat diet (HFD) for 18 weeks. n = 10–15. Total (B) and relative (%) (C) fat and lean body mass in WT compared to Rac1 mKO mice on chow or HFD at week 17. n = 8–15. D, glucose tolerance test; blood glucose following intraperitoneal injection of glucose (2 g kg−1 body weight) at week 16 into the diet intervention. Area under the curve was calculated using the trapezoidal rule with the baseline values for each group subtracted. n = 10–15. E, blood glucose before and 20 min after intraperitoneal glucose (2 g kg−1 body weight) injection of WT and Rac1 mKO mice on 60% HFD. n = 10–16. F, plasma insulin concentrations before and after 20 min intraperitoneal glucose injection. n = 10–16. Respiratory exchange ratio (RER; G), oxygen uptake (H) and CO2 production (I) during day and night in WT and Rac1 mKO mice fed chow or 60% HFD at week 16 into the diet intervention. Shaded areas indicate HFD. Significant effect of diet/insulin/glucose is indicated by * (P < 0.05). Significant effect of Rac1 mKO is indicated by (#)/# (P = 0.068/P < 0.05). Significant effect of night is indicated by † (P < 0.001). Two‐way ANOVAs (repeated measurements for all but B and C) were performed for statistical analysis. Values are means ± SD.
The respiratory exchange ratio (RER) in chow fed mice was lower in Rac1 mKO during the day, suggestive of an increased fat utilization. RER was similar between genotypes during the night (Fig. 2 G). High‐fat diet reduced RER during the day by ∼30% in Rac1 mKO mice and ∼50% in WT mice. The respiratory exchange ratio during the night was reduced by ∼70% by HFD in both Rac1 mKO and WT mice (Fig. 2 G). Thus, Rac1 mKO mice exposed to a HFD displayed similar RER to WT littermate HFD mice. Oxygen consumption was increased with HFD but, like CO2 production, was not affected by genotype (Fig. 2 H and I, respectively). Activity and food intake were also similar between genotype (not shown).
Rac1 mKO mice on HFD display reduced glucose response to insulin
Insulin injection resulted in a drop in blood glucose in chow (−50%) and HFD (−35%) mice after 10 min (Fig. 3 A). Rac1 mKO mice on HFD displayed higher blood glucose 5 and 10 min after insulin injection compared to the WT mice on a HFD, and area under the curve calculations confirmed a reduced insulin response in Rac1 mKO mice (Fig. 3 B). Importantly, injection of 0.5 U kg−1 or 0.3 U kg−1 body weight of insulin for chow or HFD mice, respectively, resulted in similar plasma insulin concentrations (Fig. 3 C) and tracer disintegrations per minute (DPM) counts at time point 10 min were similar between genotypes (Fig. 3 D). We also measured plasma triacylglycerol (Fig. 3 E) and free fatty acids (Fig. 3 F) but found no significant effect of diet or genotype, although there was a tendency towards a 25% higher triacylglycerol in Rac1 mKO mice on both diets (P = 0.09). Insulin also did not alter plasma triacylglycerol and free fatty acids likely because the 10 min stimulation time was insufficient to inhibit lipolysis to a degree that is detectable by analysis of plasma free fatty acids.
Figure 3. Rac1 mKO mice on a HFD show reduced glucose response to insulin.
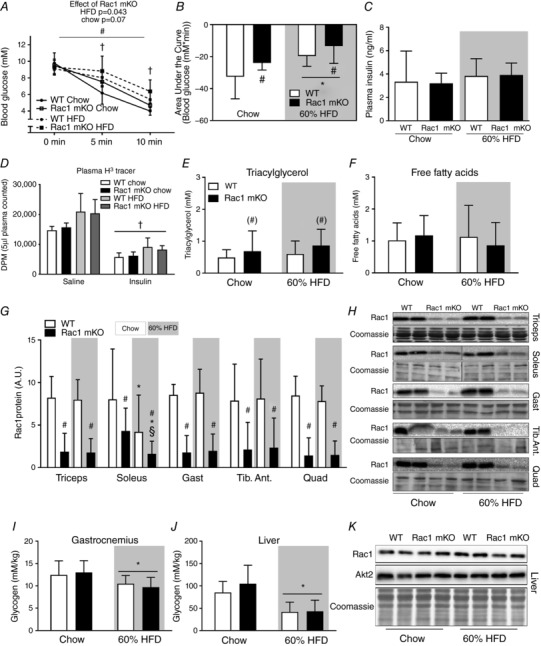
A, blood glucose before (0 min) and following 5 and 10 min retro‐orbital (r.o.) insulin injection in wild type (WT) or muscle‐specific Rac1 knockout (mKO) mice on chow or 60% high‐fat diet (HFD) (insulin dose of 0.5 U kg−1 for chow‐fed mice, 0.3 U kg−1 for high‐fat fed mice, 10 min). n = 5–8 at week 18 into the diet intervention. B, area under the curve during insulin stimulation calculated using the trapezoidal rule. C, plasma insulin concentration in insulin (insulin dose of 0.5 U kg−1 for chow‐fed mice, 0.3 U kg−1 for high‐fat fed mice)‐injected groups 10 min post‐injection. D, plasma tracer counts. E, plasma triacylglycerol concentration in chow‐ and 60% HFD‐fed WT or Rac1 mKO mice. n = 9–16. F, plasma free fatty acid concentration. n = 10–16. G, Rac1 protein expression (A.U.; arbitrary units) analysed by western blotting in triceps, soleus, gastrocnemius (Gast), tibialis anterior (Tib. Ant.) and quadriceps (Quad) muscle from WT and Rac1 mKO on chow or HFD. n = 10–16. H, representative blots. I and J, glycogen content in WT and Rac1 mKO gastrocnemius muscle and liver. K, representative blots of Rac1 and Akt2 expression in the liver of WT and Rac1 mKO mice after either chow or HFD for 18 weeks. Shaded areas indicate HFD. Significant effect of diet is indicated by * (P < 0.05). Significant effect of Rac1 mKO is indicated by (#)/# (P < 0.09/P < 0.001). Significant effect of insulin is indicated by † (P < 0.001). Interaction between Rac1 mKO and diet is indicated by § (P < 0.05). For F–K, basal and insulin‐stimulated values were pooled for each genotype (no effect of insulin was observed). Two‐way ANOVAs (repeated measurements for A) were performed for statistical analysis. For D, 2 × two‐way ANOVAs were performed analysing the effect of (i) insulin within each genotype and diet, and (ii) diet and genotype within each stimulus. For G, two‐way ANOVAs were performed for each muscle type. Values are means ± SD.
In Rac1 mKO mice, Rac1 protein content was reduced by approximately 85% in all analysed muscles and was not affected by diet, except for soleus where Rac1 expression in chow‐fed Rac1 mKO soleus muscle was only reduced by ∼50% (Fig. 3 G and representative blots in 3H). Because HFD reduced Rac1 protein content, the Rac1 expression in Rac1 mKO chow soleus was similar to the Rac1 expression levels in control HFD mice. Notably, this effect of HFD in soleus muscle occurred in both Rac1 mKO and WT control mice. Glycogen content was reduced by HFD in gastrocnemius muscle (−15%; Fig. 3 I) with no effect of genotype. Due to the importance of the liver in regulating whole body metabolism, we analysed triacylglycerol and glycogen content, as well as Rac1 and Akt2 expression in the liver. As expected, liver triacylglycerol content was markedly increased (+300%, data not shown), while glycogen content was reduced (−60%; Fig. 3 J) by HFD, and, importantly, we observed no effect of our muscle‐specific Rac1 deletion on liver glycogen content, triacylglycerol content, or Rac1 and Akt2 protein expression (Fig. 3 K). These findings suggest that livers from WT and Rac1 mKO mice respond similarly to a HFD.
HFD‐induced insulin resistance was exacerbated in Rac1 mKO muscle but improved in adipose tissue
Basal glucose uptake was unaffected by Rac1 mKO and diet in all of the muscles analysed (Fig. 4 A). Insulin‐stimulated glucose uptake in chow‐fed Rac1 mKO mice was reduced in triceps (−45%), soleus (−25%) and gastrocnemius (−15%) compared to control (Fig. 4 B). HFD impaired insulin‐stimulated glucose uptake in all analysed muscles (main effect of diet). Insulin‐stimulated glucose uptake was significantly lower in HFD Rac1 mKO muscle compared to WT in all analysed muscles, except soleus. These findings suggest that deficient Rac1 signalling and fatty diet is additive and together thus markedly compromise insulin‐stimulated glucose uptake. In soleus and triceps muscles insulin‐stimulated glucose uptake correlated with Rac1 muscle protein content and this was also the tendency in quadriceps (Fig. 4 C).
Figure 4. Loss of Rac1 in skeletal muscle exacerbates muscle insulin resistance on a high‐fat diet but improves insulin‐stimulated glucose uptake in adipose tissue.
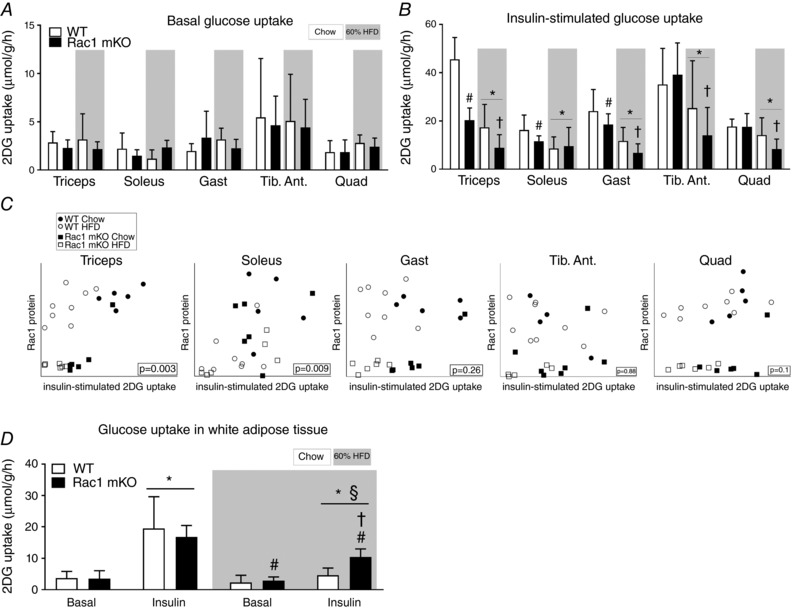
A, basal (saline‐stimulated) 2‐deoxy‐glucose (2DG) uptake in wild type (WT) and muscle‐specific Rac1 knockout (mKO) triceps, soleus, gastrocnemius (Gast), tibialis anterior (Tib. Ant.) and quadriceps (Quad) muscle on chow or 60% high‐fat diet (HFD) at week 18. n = 5–8. B, insulin‐stimulated (insulin dose of 0.5 U kg−1 for chow‐fed mice, 0.3 U kg−1 for high‐fat‐fed mice, 10 min) 2DG uptake. n = 5–8. Significant effect of diet is indicated by * (P < 0.001). Significant effect of Rac1 mKO is indicated by # (P < 0.05). Effect of Rac1 mKO within diet is indicated by † (P < 0.05). C, correlations between muscle Rac1 protein content and insulin‐stimulated glucose uptake in individual muscles. D, basal and insulin‐stimulated 2DG uptake in white adipose tissue following chow diet or HFD in WT or Rac1 mKO mice. Significant effect of insulin is indicated by * (P < 0.001). Significant effect of Rac1 mKO is indicated by # (P < 0.01). Shaded areas indicate HFD. Significant effect of diet within stimulation is indicated by § (P < 0.001). Interaction between genotype and stimulation within diet is indicated by † (P < 0.01). For A and B, several two‐way ANOVAs were performed to test for effects of (i) diet, (ii) insulin, (iii) genotype. Furthermore, two‐way repeated measures ANOVAs including all muscle types from each mouse were performed to test for main effects of diet and genotype. Values are means ± SD.
As expected in this muscle‐specific model, Rac1 mKO did not alter basal‐ or insulin‐stimulated glucose uptake in adipose tissue of chow‐fed mice (Fig. 4 D). HFD resulted in insulin resistance in adipose tissue in both genotypes as depicted by lower insulin‐stimulated glucose uptake (Fig. 4 D). However, unexpectedly, while HFD reduced insulin‐stimulated glucose uptake in adipose tissue of WT mice by 120%, glucose uptake was only reduced by 60% in Rac1 mKO HFD mice. Thus surprisingly there seems to be some adipose tissue compensation for the reduced muscle glucose uptake. Taken together, our findings show that Rac1 plays an essential role in insulin‐stimulated glucose uptake in skeletal muscle, in particular when metabolically challenged with a fatty diet. Furthermore, knockout of Rac1 in muscle to some degree protects adipose tissue from HFD‐induced insulin resistance.
Akt signalling in muscle is unaffected by Rac1 mKO but in HFD adipose tissue Rac1 mKO increased insulin‐stimulated p‐AktThr308 and Ser473
Rac1 mKO reduced insulin‐stimulated glucose uptake in gastrocnemius muscle, and this effect of Rac1 mKO was significantly augmented by HFD (Fig. 4 B). Gastrocnemius muscle was therefore further analysed to investigate potential insulin signalling defects in Rac1 mKO muscle. In gastrocnemius muscle, insulin stimulated p‐AktThr308 (Fig. 5 A) and p‐AktSer473 (Fig. 5 B) equally in WT and Rac1 mKO muscle and we observed no effect of diet, despite a reduced (−30%) Akt2 protein abundancy with HFD (Fig. 5 C). Insulin increased the phosphorylation of p‐TBC1D4Thr642 equally in both genotypes (Fig. 5 D). Despite no diet‐induced alterations in Akt signalling, HFD surprisingly augmented p‐TBC1D4Thr642 (+30%). This was likely due to an upregulation (+25%) of TBC1D4 protein in response to the HFD diet (Fig. 5 E). Representative blots are shown in Fig. 5 F.
Figure 5. Akt signaling in skeletal muscle is not affect by Rac1 mKO.
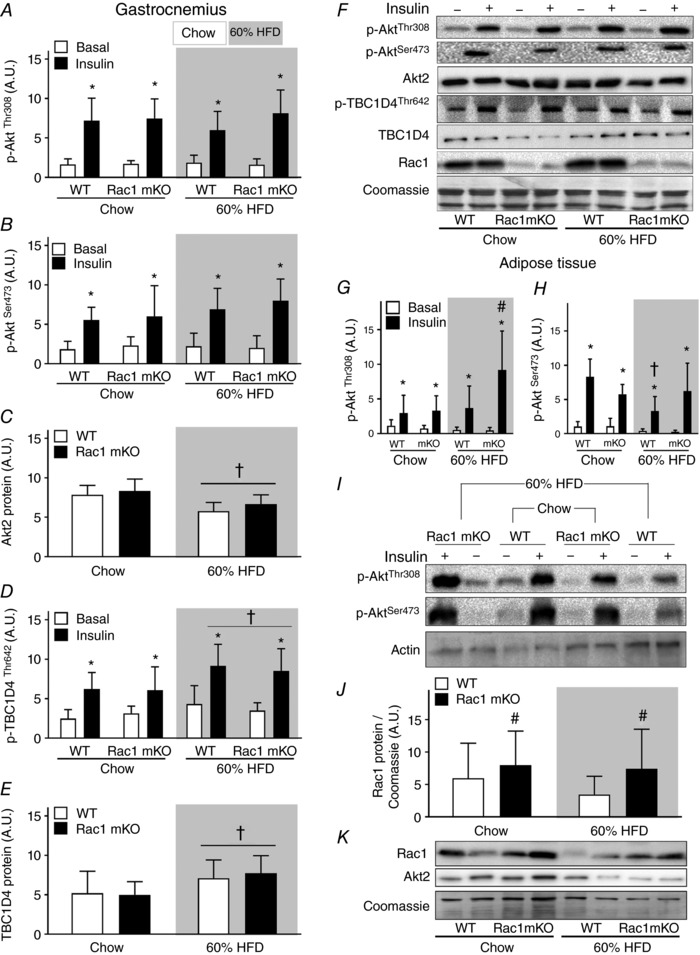
Bar graphs and representative western blots showing p‐AktThr308 (A), p‐AktSer473 (B), total Akt2 (C), p‐TBC1D4Thr642 (D), total TBC1D4 (E), representative western blots, Rac1 protein, and Coomassie staining as a loading control in wild type (WT) and muscle‐specific Rac1 knockout (mKO) in gastrocnemius muscle (F). n = 5–8. Bar graphs showing phosphorylation of Akt at sites Thr308 (G) and Ser473 (H) in adipose tissue. n = 5–8. I, representative western blots showing p‐AktThr308, p‐AktSer473, and as a loading control, actin, in adipose tissue. J, bar graph showing Rac1 content in adipose tissue. K, representative western blots of Rac1 and Akt2 content. Shaded areas indicate HFD. Significant effect of insulin stimulation is indicated by * (P < 0.001). Significant effect of diet is indicated by † (P < 0.01). Significant effect of Rac1 mKO is indicated by # (P < 0.05). 2 × two‐way ANOVAs were performed analysing the effect of (i) insulin within each genotype and diet, and (ii) diet and genotype within each stimulus. Values are means ± SD.
We also analysed signalling in adipose tissue because glucose uptake was increased in Rac1 mKO mice on a HFD compared to WT HFD mice. Surprisingly the Rac1 mKO HFD mice had twice as high insulin‐stimulated AktThr308 in adipose tissue compared to WT HFD mice (Fig. 5 G). In agreement with similar glucose uptake, adipose tissue insulin‐stimulated p‐AktSer473 was comparable between genotypes in chow‐fed mice. HFD reduced p‐AktSer473 in adipose tissue from WT (−50%), but not in Rac1 mKO mice (Fig. 5 H and representative blots in Fig. 5 I). Akt2 protein content was not affected by genotype or HFD in adipose tissue (Fig. 5 K). Unexpectedly, Rac1 protein content was increased by ∼55% on average in adipose tissue of Rac1 mKO mice with no effect of HFD (Fig. 5 J and representative blots in Fig. 5 K). These results indicate that Rac1 mKO and a fatty diet act on glucose uptake independently of Akt signalling in skeletal muscle. In contrast, in adipose tissue Rac1 mKO increased insulin‐stimulated p‐AktThr308 and preserved p‐AktSer473 in HFD mice as well as displaying increased Rac1 protein content, which could explain the increased adipose tissue glucose uptake.
The glucose transport step is impaired in HFD‐challenged Rac1 mKO muscle
Glucose uptake in vivo depends on three factors: glucose delivery, transport across the sarcolemma, and intracellular metabolism (Sylow et al. 2017), which cannot be distinguished between when measuring glucose uptake in vivo. To specifically study glucose transport across the muscle membrane (sarcolemma and transverse tubules), we therefore isolated and incubated soleus and EDL muscles (an experimental set‐up in which transport of glucose across the muscle membrane is the rate‐limiting factor; Hansen et al. 1994, 2000) to test Rac1 mKO's effect on glucose transport specifically in metabolically challenged muscles from HFD‐fed mice. Soleus and EDL muscles are thin enough to be incubated without inducing hypoxia, and represent highly oxidative and glycolytic muscle fibres, respectively. In all groups insulin increased glucose transport, and this effect was significantly reduced in soleus (−50%) and EDL (−70%) muscles from Rac1 mKO on a HFD (Fig. 6 A and B). In comparison, only a 20% reduction in Rac1 mKO mice fed a chow diet was observed in Rac1 mKO mice in previous studies (Sylow et al. 2013a, 2014). Insulin‐stimulated p‐AktSer473 (Fig. 6 C) was unaltered by Rac1 mKO, while p‐TBC1D4Thr642 was reduced (−20%) in Rac1 mKO soleus (Fig. 6 D). In soleus and EDL muscles, Rac1 protein was reduced by 80%, while, importantly, not affecting GLUT4 protein (Fig. 6 E). Representative blots are shown in Fig. 6 F. These results indicate that on a HFD Rac1 mKO significantly impairs glucose transport step across the muscle membrane.
Figure 6. The glucose transport step is impaired in Rac1 mKO after high‐fat feeding.
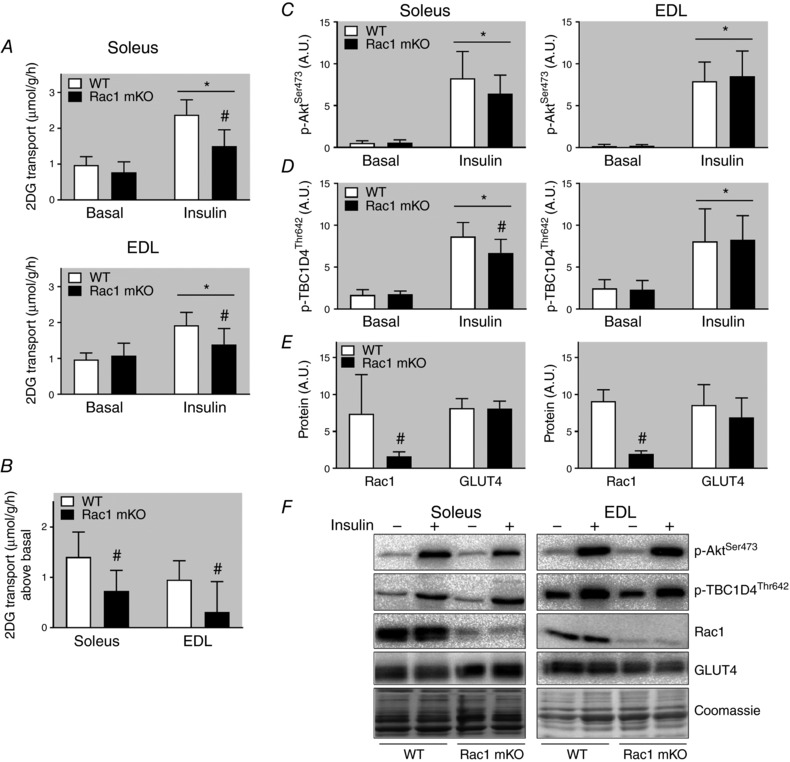
A, basal and insulin (60 nm, 20 min) 2‐deoxy‐glucose (2DG) transport in soleus and extensor digitorum longus (EDL) muscle from wild type (WT) and muscle‐specific Rac1 knockout (mKO) mice following 18 weeks 60% high‐fat diet (HFD). B, insulin‐stimulated increase above basal of 2DG transport in soleus and EDL muscle. Basal and insulin‐stimulated p‐AktSer473 (C), p‐TBC1D4Thr642 (D), and Rac1 and GLUT4 protein expression (E), and representative western blots (F). Shaded areas indicate HFD. Significant effect of insulin stimulation is indicated by * (P < 0.001). Significant effect of Rac1 mKO is indicated by # (P < 0.001). n = 7–10. Two‐way repeated measures ANOVA was performed for each muscle. Fold changes were analysed using t tests. Values are means ± SD.
Rac1 deficiency in muscle does not affect gene expression of any of the usual suspects involved in glucose handling, inflammation, and macrophage infiltration
In an attempt to further elucidate the phenotype, we investigated the effect of Rac1 mKO on the expression of genes involved in glucose uptake and intracellular metabolism (glut4, foxo1 and pparγ), inflammation (IL‐6 and TNFα), and macrophage infiltration (F4/80 and mcp‐1). We also analysed β‐actin expression, which partially constitutes the cortical muscle actin cytoskeleton and is a possible target for Rac1 to induce GLUT4 translocation (JeBailey et al. 2007; Prins et al. 2011). In gastrocnemius muscle, we observed no effect of Rac1 mKO on any of those genes, while HFD reduced F4/80 and mcp‐1 (−60%) and β‐actin (−40%) (Fig. 7 A). β‐Actin mRNA expression was increased ∼20% in Rac1 mKO adipose tissue but in contrast to muscle, β‐actin mRNA was unaltered by diet (Fig. 7 B). However, total protein expression of β‐actin analysed by western blotting did not follow mRNA expression and we observed no effect of Rac1 mKO on adipose tissue β‐actin protein expression, while HFD surprisingly increased β‐actin protein expression. Following HFD, adipose tissue expression of foxo1 and pparγ was ∼20% increased, while macrophage infiltration (F4/80 and mcp‐1) doubled. These findings suggest that Rac1 deficiency in muscle does not affect the mRNA expression of the usual suspects involved in glucose handling, inflammation, and macrophage infiltration. However, HFD caused a marked decrease in muscle β‐actin mRNA, but this was not translated into altered protein β‐actin expression.
Figure 7. High fat feeding alter β‐actin mRNA (muscle) and protein content (adipose tissue) in mice.
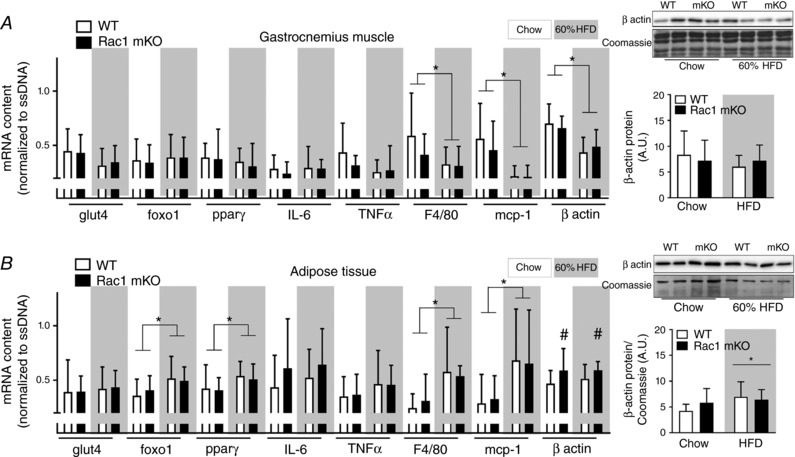
Total expression of β‐actin protein (right bars) and gene expression in gastrocnemius muscle (A) and white adipose tissue (B) from wild type (WT) and muscle‐specific Rac1 knockout (mKO) on chow or 60% high‐fat diet (HFD) of glucose transporter 4 (glut4), forkhead box protein O1 (foxo1), peroxisome proliferator‐activated receptor γ (pparγ), interleukin 6 (IL‐6), tumour necrosis factor α (TNFα), F4/80, monocyte chemoattractant protein‐1 (mcp‐1), and β actin related to OliGreen (single‐stranded (ss) DNA). n = 8–10, basal and insulin‐stimulated samples pooled for each genotype (no effect of insulin was observed). Significant effect of diet is indicated by * (P < 0.05). Significant effect of Rac1 mKO is indicated by # (P < 0.05). Two‐way ANOVAs were performed for each gene. Values are means ± SD.
Discussion
The current study provides evidence that lack of Rac1 exacerbates the detrimental effect of a high‐fat diet and reduces whole body insulin action due to a marked reduction in insulin‐stimulated glucose uptake in skeletal muscle. Essentially, Rac1 signalling is decreased in insulin‐resistant rat L6 myoblasts (JeBailey et al. 2007), type 2 diabetic subjects (Sylow et al. 2013a) and obese ob/ob mice (Sylow et al. 2014). The present findings are clinically relevant, since they suggest that decreased Rac1 signalling significantly contributes to muscle insulin resistance, in particular in diet‐induced obesity. Despite a severe decrease in insulin‐stimulated glucose uptake in skeletal muscles, it was surprising to find normal glucose tolerance and a relatively mild whole body insulin‐resistant state in the Rac1 mKO mice. This was likely due to a less impaired adipose tissue glucose uptake in the HFD Rac1 mKO than WT littermate mice, while the liver was affected similarly by HFD. Interestingly, other mouse models of muscular insulin resistance also display a concomitant increase in adipose tissue glucose uptake (Kim et al. 2000; Cettour‐Rose et al. 2005; Ikonomov et al. 2013). For example, in mice with a muscle‐specific deletion of the insulin receptor (MIRKO), severe muscular insulin resistance was partly compensated for by increases (+200%) in insulin‐stimulated glucose transport activity in adipose tissue (Kim et al. 2000). However, in those studies, the underlying mechanisms were not explored. Our results indicate that insulin hyper‐responsiveness on HFD in adipose tissue of Rac1 mKO mice could be due to increased Akt phosphorylation at both sites Ser473 and Thr308 compared to WT HFD. Another factor that may have contributed to the increased glucose uptake in adipose tissue is Rac1 protein content. Rac1 has been shown to be activated in vivo by insulin in adipose tissue (JeBailey et al. 2004; Takenaka et al. 2017), and an increase in Rac1 protein content, as observed in the Rac1 mKO mice in the current study, may therefore have a positive effect on insulin‐stimulated glucose uptake in adipose tissue when challenged on a high‐fat diet. Another explanation could be cross‐talk between insulin target tissues that has been described in the literature (Minokoshi et al. 2003) and muscle is known to secrete myokines (Whitham & Febbraio, 2016) and exosomes (Whitham et al. 2018) that can affect other tissues. It is currently unknown whether muscle Rac1 affects muscle cross‐talk with other organs or by which secondary factors Rac1 muscle KO improves insulin‐stimulated glucose uptake in adipose tissue. The interaction between reduced muscle and increased adipose tissue glucose uptake may also, at least partially, be a simple process of substrate redistribution from the muscle into the fat. Certainly, exciting discoveries regarding the roles of Rac1 and muscular insulin resistance in adipose tissue glucose uptake lie ahead.
Despite the importance of Rac1 in regulating GLUT4 trafficking in L6 muscle cells (Khayat et al. 2000; JeBailey et al. 2007) and skeletal muscle in vitro (Sylow et al. 2013a, 2014), our studies show that Rac1 was actually dispensable for glucose uptake in several mouse skeletal muscle types in chow‐fed mice in vivo. Also, Rac1 protein content correlated with insulin‐stimulated glucose uptake in only three out of the five analysed muscles. Alternative pathways therefore seem to be able to mediate glucose uptake in the absence of Rac1. An obvious candidate for alternative Rac1‐independent signalling to insulin‐mediated glucose uptake in skeletal muscle is the pathway defined by Akt. Separate inhibition of either Rac1 or Akt partially reduced insulin‐stimulated glucose transport, while simultaneous inhibition of both proteins blocked glucose transport in incubated soleus and EDL muscle (Sylow et al. 2014). These findings suggest that in the absence of one, the other signalling pathway can partially take over and mediate glucose transport. Some (Tremblay et al. 2001; Karlsson et al. 2005; Frosig et al. 2013; Liu et al. 2015), but not all (Kim et al. 1999; Timmers et al. 2010; Tonks et al. 2013), studies have reported downregulation of Akt signalling in insulin‐resistant skeletal muscle. The complexity of insulin‐stimulated phosphorylation and activation of Akt is evidenced by results obtained in adipocytes in vitro (Tan et al. 2012). These data suggest that minimal activation of Akt can lead to close to maximal activation of Akt downstream targets including GLUT4 plasma membrane translocation. Whether this relationship also exists in vivo in other tissues such as skeletal muscle, and during different conditions such as a HFD intervention, is unknown. However, in the current study Akt phosphorylation was normal during insulin stimulation in skeletal muscle following HFD, suggesting that mechanisms other than reduced Akt activity underlie the reduced insulin action by high‐fat diet in both WT and Rac1 mKO mice.
An important finding in our study is that Rac1 mKO mice have decreased insulin‐stimulated glucose uptake in skeletal muscle on both diets compared to WT mice during in vivo insulin stimulation. This phenotype is present with no change in Akt signalling demonstrating the importance of Rac1 in insulin‐stimulated glucose uptake independent of Akt. Interestingly, HFD‐induced insulin resistance in skeletal muscle was augmented in muscles lacking Rac1 protein. As investigated in this study, this was likely due to a defect in the sarcolemmal glucose transport step. Although Akt phosphorylation is not affected by the loss of Rac1, the exact intracellular mechanism(s) leading to/causing augmented loss of insulin action during HFD in skeletal muscle from Rac1 mKO cannot be definitively described in the present study. With the involvement of Rac1 in actin reorganization and translocation of GLUT4 to the plasma membrane (JeBailey et al. 2004, 2007) a lower abundance of GLUT4 at the plasma membrane during insulin stimulation seems like an appealing explanation. This needs further exploration in future studies.
β‐Actin constitutes part of the cytoskeleton in skeletal muscle (Prins et al. 2011) and the actin cytoskeleton is essential for normal regulation of insulin‐stimulated glucose uptake in vitro (Khayat et al. 2000; Tong et al. 2001; JeBailey et al. 2004, 2007; Chiu et al. 2011; Sylow et al. 2014). Rac1 is a major regulator of the actin cytoskeleton in various cell types (Ridley et al. 1992; JeBailey et al. 2004, 2007). In an insulin‐resistant ceramide‐treated L6 muscle cell culture, insulin failed to activate Rac1, and the actin cytoskeleton was not reorganized by insulin, leading to impaired GLUT4 translocation (JeBailey et al. 2007). Reduced actin cytoskeleton F‐actin staining has also been observed in fully differentiated mature insulin‐resistant skeletal muscle (Habegger et al. 2012). In accordance with those studies, we found that a high‐fat diet reduced the gene expression of β‐actin in muscle. However, this was not translated into a reduction in β‐actin protein. Thus, should the actin cytoskeleton regulate glucose uptake in vivo, it is likely that actin dynamics rather than amount is a relevant factor. However, the beta actin isoform is largely dispensable for glucose uptake in muscle (Madsen et al. 2018). Although future studies should determine the role for both of the actin cytoskeleton isoforms, β and γ, those findings suggest that Rac1 could mediate glucose uptake via other signals.
The current study has certain limitations. We describe a method to analyse glucose uptake and intracellular signalling in vivo in a simple, non‐expensive and highly efficient manner in several tissues. Although this is an excellent method to study glucose uptake in muscle and adipose tissue, the hyperinsulinaemic euglycaemic clamp is still the gold standard for such procedures, as it also provides information about glucose output from the liver and measures glucose metabolism during steady state. On the other hand, our method may be more physiologically relevant, given that during the hyperinsulinaemic euglycaemic clamp, plasma insulin concentrations are elevated for several hours during euglycaemia, which is a non‐physiological condition. We found that HFD markedly reduced insulin clearance. However, we only investigated plasma insulin following 10 min of insulin injection, and insulin appearance at earlier time points is therefore unknown. Nonetheless, plasma insulin concentrations were similar between genotypes and this limitation is therefore unlikely to affect the conclusions of this study. A third limitation to this study is that a high, but still submaximal insulin concentration was used in vivo and a maximal insulin concentration used in vitro. As such, the involvement of Rac1 in insulin action rather than insulin sensitivity was investigated in this study. Future studies should determine the role for Rac1 in insulin sensitivity at lower doses of insulin. Finally, at least two intriguing questions remain: (i) by which molecular downstream mechanism Rac1 mediates insulin‐stimulated glucose uptake, and (ii) whether activation of Rac1 can block HFD‐induced insulin resistance. This should be the topic for future investigations.
Conclusion
Insulin regulates many biological functions in skeletal muscle and stimulation of skeletal muscle glucose uptake is one of the most important (Taniguchi et al. 2006). Our findings show that lack of Rac1 is particularly harmful for maintaining insulin‐stimulated glucose uptake in muscle that is challenged by a HFD. Despite reduced muscle glucose uptake, whole body glucose tolerance was unaffected, likely due to improved glucose uptake in adipose tissue in Rac1 mKO mice. We conclude that reduced Rac1 signalling in the context of obesity is detrimental to insulin‐stimulated muscle glucose uptake independently of Akt signalling. This is depicted in Fig. 8.
Figure 8. Schematic illustration of the main findings from the current study.
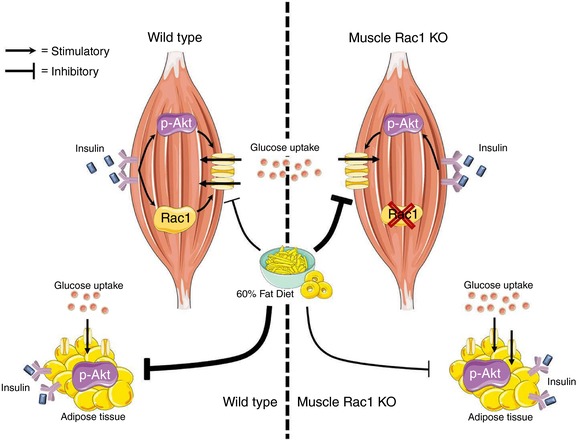
Lack of Rac1 is particularly harmful for maintaining insulin‐stimulated glucose uptake in muscle that is challenged by a HFD. Despite reduced muscle glucose uptake, whole body glucose homeostasis was unaffected by muscle Rac1 KO, likely due to increased phosphorylation of Akt and improved glucose uptake in adipose tissue in Rac1 mKO mice on a fatty diet. [Color figure can be viewed at http://wileyonlinelibrary.com]
Additional information
Competing interests
None declared.
Author contributions
L.S., T.E.J. and E.A.R. conceptualized and designed the study. S.H.R., M.A. and L.S. conducted the experiments, performed the laboratory analysis, analysed the data and wrote the manuscript. R.K., M.A.F., L.L.V.M., E.A.R. and T.E.J. took part in conducting the experiments and/or developing the methods and analysed the data. All authors contributed significantly to drafting the work or revising it critically for important intellectual content and all authors approved the final version of the manuscript. L.S. is the guarantor of this work and, as such, has full access to all the data in the study. All authors agree to be accountable for the data integrity and ensuring that questions related to the accuracy or integrity of any part of the work are appropriately investigated and resolved. All persons designated as authors qualify for authorship, and all those who qualify for authorship are listed.
Funding
This study was supported by the Danish Research Council (grant nos DFF–4004‐00233 to L.S., 1323‐00200A to T.E.J. and 10‐083584 to E.A.R.) and the Novo Nordisk Foundation (grant nos 15182 to T.E.J. and 1014664 to E.A.R.). And PhD fellowship from The Lundbeck Foundation (grant 2015‐3388 to LLVM).
Acknowledgements
We acknowledge the highly skilled technical assistance of Betina Bolmgren, Irene Bech Nielsen and Nicoline R. Andersen and we thank our colleagues at the Molecular Physiology Group, Department of Nutrition, Exercise, and Sports, Faculty of Science, University of Copenhagen for fruitful discussions on this topic. Rac1 floxed mice were a kind gift from Cord Brakebusch (Biomedical Institute, BRIC, University of Copenhagen, Denmark). Tetracycline‐activated Cre mice were a kind gift from Ashley Monks (Department of Psychology, University of Toronto Mississauga, Canada).
Biographies
Steffen Raun during my master's in Human Physiology, I started to work in a research group focusing on skeletal muscle and glucose metabolism. I quickly found my passion in this field and I am currently investigating different aspects of glucose metabolism, e.g. Rac1 signalling. My fascination lies within fundamental research and the understanding of different molecular mechanisms as well as how this can be translated into different pathological conditions, such as type 2 diabetes mellitus (T2DM). I hope this paper shows a sense of this fascination and that it will increase the knowledge of the pathology of T2DM.

Mona Ali my passion for science has always been driven by the thought of improving people's lives. Studying biochemistry was the perfect way for me to contribute to understanding the pathogenesis of any disease. During my time as a student, I have worked on interdisciplinary projects involving molecular cell biology, neurobiology and genetics. When I was first introduced to the Rac1 protein as part of my master's thesis, my passion for research became greater. Our findings in this paper show how Rac1 could be a potential therapeutic target to cure type 2 diabetes.
S. H. Raun and M. Ali contributed equally to this work.
Edited by: Kim Barrett & Bettina Mittendorfer
Linked articles This article is highlighted by a Perspective by van Vliet & Mittendorfer. To read this Perspective, visit https://doi.org/10.1113/JP276179.
This is an Editor's Choice article from the 15 June 2018 issue.
References
- Abdul‐Ghani MA & Defronzo RA (2010). Pathogenesis of insulin resistance in skeletal muscle. J Biomed Biotechnol 2010, 476279. [DOI] [PMC free article] [PubMed] [Google Scholar]
- Biddinger SB & Kahn CR (2006). From mice to men: insights into the insulin resistance syndromes. Annu Rev Physiol 68, 123–158. [DOI] [PubMed] [Google Scholar]
- Bjornholm M & Zierath JR (2005). Insulin signal transduction in human skeletal muscle: identifying the defects in Type II diabetes. Biochem Soc Trans 33, 354–357. [DOI] [PubMed] [Google Scholar]
- Brandimarti P, Costa‐Junior JM, Ferreira SM, Protzek AO, Santos GJ, Carneiro EM, Boschero AC & Rezende LF (2013). Cafeteria diet inhibits insulin clearance by reduced insulin‐degrading enzyme expression and mRNA splicing. J Endocrinol 219, 173–182. [DOI] [PubMed] [Google Scholar]
- Cettour‐Rose P, Samec S, Russell AP, Summermatter S, Mainieri D, Carrillo‐Theander C, Montani JP, Seydoux J, Rohner‐Jeanrenaud F & Dulloo AG (2005). Redistribution of glucose from skeletal muscle to adipose tissue during catch‐up fat: a link between catch‐up growth and later metabolic syndrome. Diabetes 54, 751–756. [DOI] [PubMed] [Google Scholar]
- Chiu TT, Jensen TE, Sylow L, Richter EA & Klip A (2011). Rac1 signalling towards GLUT4/glucose uptake in skeletal muscle. Cell Signal 23, 1546–1554. [DOI] [PubMed] [Google Scholar]
- Chomczynski P & Sacchi N (1987). Single‐step method of RNA isolation by acid guanidinium thiocyanate‐phenol‐chloroform extraction. Anal Biochem 162, 156–159. [DOI] [PubMed] [Google Scholar]
- Defronzo RA, Gunnarsson R, Bjorkman O, Olsson M & Wahren J (1985). Effects of insulin on peripheral and splanchnic glucose metabolism in noninsulin‐dependent (type II) diabetes mellitus. J Clin Invest 76, 149–155. [DOI] [PMC free article] [PubMed] [Google Scholar]
- Defronzo RA & Tripathy D (2009). Skeletal muscle insulin resistance is the primary defect in type 2 diabetes. Diabetes Care 32 (Suppl. 2), S157–S163. [DOI] [PMC free article] [PubMed] [Google Scholar]
- Frosig C, Jensen TE, Jeppesen J, Pehmoller C, Treebak JT, Maarbjerg SJ, Kristensen JM, Sylow L, Alsted TJ, Schjerling P, Kiens B, Wojtaszewski JF & Richter EA (2013). AMPK and insulin action – responses to ageing and high fat diet. PLoS One 8, e62338. [DOI] [PMC free article] [PubMed] [Google Scholar]
- Fueger PT, Hess HS, Posey KA, Bracy DP, Pencek RR, Charron MJ & Wasserman DH (2004). Control of exercise‐stimulated muscle glucose uptake by GLUT4 is dependent on glucose phosphorylation capacity in the conscious mouse. J Biol Chem 279, 50956–50961. [DOI] [PubMed] [Google Scholar]
- Grundy D (2015). Principles and standards for reporting animal experiments in The Journal of Physiology and Experimental Physiology . J Physiol 593, 2547–2549. [DOI] [PMC free article] [PubMed] [Google Scholar]
- Habegger KM, Penque BA, Sealls W, Tackett L, Bell LN, Blue EK, Gallagher PJ, Sturek M, Alloosh MA, Steinberg HO, Considine RV & Elmendorf JS (2012). Fat‐induced membrane cholesterol accrual provokes cortical filamentous actin destabilisation and glucose transport dysfunction in skeletal muscle. Diabetologia 55, 457–467. [DOI] [PMC free article] [PubMed] [Google Scholar]
- Hansen PA, Gulve EA & Holloszy JO (1994). Suitability of 2‐deoxyglucose for in vitro measurement of glucose transport activity in skeletal muscle. J Appl Physiol (1985) 76, 979–985. [DOI] [PubMed] [Google Scholar]
- Hansen PA, Marshall BA, Chen M, Holloszy JO & Mueckler M (2000). Transgenic overexpression of hexokinase II in skeletal muscle does not increase glucose disposal in wild‐type or Glut1‐overexpressing mice. J Biol Chem 275, 22381–22386. [DOI] [PubMed] [Google Scholar]
- Ikonomov OC, Sbrissa D, Delvecchio K, Feng HZ, Cartee GD, Jin JP & Shisheva A (2013). Muscle‐specific Pikfyve gene disruption causes glucose intolerance, insulin resistance, adiposity, and hyperinsulinemia but not muscle fiber‐type switching. Am J Physiol Endocrinol Metab 305, E119–E131. [DOI] [PMC free article] [PubMed] [Google Scholar]
- JeBailey L, Rudich A, Huang X, Di Ciano‐Oliveira C, Kapus A & Klip A (2004). Skeletal muscle cells and adipocytes differ in their reliance on TC10 and Rac for insulin‐induced actin remodeling. Mol Endocrinol 18, 359–372. [DOI] [PubMed] [Google Scholar]
- JeBailey L, Wanono O, Niu W, Roessler J, Rudich A & Klip A (2007). Ceramide‐ and oxidant‐induced insulin resistance involve loss of insulin‐dependent Rac‐activation and actin remodeling in muscle cells. Diabetes 56, 394–403. [DOI] [PubMed] [Google Scholar]
- Karlsson HK, Zierath JR, Kane S, Krook A, Lienhard GE & Wallberg‐Henriksson H (2005). Insulin‐stimulated phosphorylation of the Akt substrate AS160 is impaired in skeletal muscle of type 2 diabetic subjects. Diabetes 54, 1692–1697. [DOI] [PubMed] [Google Scholar]
- Khayat ZA, Tong P, Yaworsky K, Bloch RJ & Klip A (2000). Insulin‐induced actin filament remodeling colocalizes actin with phosphatidylinositol 3‐kinase and GLUT4 in L6 myotubes. J Cell Sci 113, 279–290. [DOI] [PubMed] [Google Scholar]
- Kim JK, Michael MD, Previs SF, Peroni OD, Mauvais‐Jarvis F, Neschen S, Kahn BB, Kahn CR & Shulman GI (2000). Redistribution of substrates to adipose tissue promotes obesity in mice with selective insulin resistance in muscle. J Clin Invest 105, 1791–1797. [DOI] [PMC free article] [PubMed] [Google Scholar]
- Kim YB, Nikoulina SE, Ciaraldi TP, Henry RR & Kahn BB (1999). Normal insulin dependent activation of Akt/protein kinase B, with diminished activation of phosphoinositide 3‐kinase, in muscle in type 2 diabetes. J Clin Invest 104, 733–741. [DOI] [PMC free article] [PubMed] [Google Scholar]
- Kurauti MA, Costa‐Junior JM, Ferreira SM, Santos GJ, Protzek AO, Nardelli TR, Rezende LF & Boschero AC (2016). Acute exercise restores insulin clearance in diet‐induced obese mice. J Endocrinol 229, 221–232. [DOI] [PubMed] [Google Scholar]
- Liu Y, Palanivel R, Rai E, Park M, Gabor TV, Scheid MP, Xu A & Sweeney G (2015). Adiponectin stimulates autophagy and reduces oxidative stress to enhance insulin sensitivity during high‐fat diet feeding in mice. Diabetes 64, 36–48. [DOI] [PubMed] [Google Scholar]
- Lundby C, Nordsborg N, Kusuhara K, Kristensen KM, Neufer PD & Pilegaard H (2005). Gene expression in human skeletal muscle: alternative normalization method and effect of repeated biopsies. Eur J Appl Physiol 95, 351–360. [DOI] [PubMed] [Google Scholar]
- Madsen AB, Knudsen JR, Henriquez‐Olguin C, Angin Y, Zaal KJ, Sylow L, Schjerling P, Ralston E & Jensen TE (2018). β‐actin shows limited mobility and is only required for supraphysiological insulin‐stimulated glucose transport in young adult soleus muscle. Am J Physiol Endocrinol Metab https://doi.org/10.1152/ajpendo.00392.2017. [DOI] [PMC free article] [PubMed] [Google Scholar]
- Minokoshi Y, Kahn CR & Kahn BB (2003). Tissue‐specific ablation of the GLUT4 glucose transporter or the insulin receptor challenges assumptions about insulin action and glucose homeostasis. J Biol Chem 278, 33609–33612. [DOI] [PubMed] [Google Scholar]
- Pilegaard H, Ordway GA, Saltin B & Neufer PD (2000). Transcriptional regulation of gene expression in human skeletal muscle during recovery from exercise. Am J Physiol Endocrinol Metab 279, E806–E814. [DOI] [PubMed] [Google Scholar]
- Prins KW, Call JA, Lowe DA & Ervasti JM (2011). Quadriceps myopathy caused by skeletal muscle‐specific ablation of βcyto‐actin. J Cell Sci 124, 951–957. [DOI] [PMC free article] [PubMed] [Google Scholar]
- Ridley AJ, Paterson HF, Johnston CL, Diekmann D & Hall A (1992). The small GTP‐binding protein rac regulates growth factor‐induced membrane ruffling. Cell 70, 401–410. [DOI] [PubMed] [Google Scholar]
- Saltiel AR & Kahn CR (2001). Insulin signalling and the regulation of glucose and lipid metabolism. Nature 414, 799–806. [DOI] [PubMed] [Google Scholar]
- Stromblad G & Bjorntorp P (1986). Reduced hepatic insulin clearance in rats with dietary‐induced obesity. Metabolism 35, 323–327. [DOI] [PubMed] [Google Scholar]
- Sylow L, Jensen TE, Kleinert M, Hojlund K, Kiens B, Wojtaszewski J, Prats C, Schjerling P & Richter EA (2013a). Rac1 signaling is required for insulin‐stimulated glucose uptake and is dysregulated in insulin‐resistant murine and human skeletal muscle. Diabetes 62, 1865–1875. [DOI] [PMC free article] [PubMed] [Google Scholar]
- Sylow L, Jensen TE, Kleinert M, Mouatt JR, Maarbjerg SJ, Jeppesen J, Prats C, Chiu TT, Boguslavsky S, Klip A, Schjerling P & Richter EA (2013b). Rac1 is a novel regulator of contraction‐stimulated glucose uptake in skeletal muscle. Diabetes 62, 1139–1151. [DOI] [PMC free article] [PubMed] [Google Scholar]
- Sylow L, Kleinert M, Pehmoller C, Prats C, Chiu TT, Klip A, Richter EA & Jensen TE (2014). Akt and Rac1 signaling are jointly required for insulin‐stimulated glucose uptake in skeletal muscle and downregulated in insulin resistance. Cell Signal 26, 323–331. [DOI] [PubMed] [Google Scholar]
- Sylow L, Kleinert M, Richter EA & Jensen TE (2017). Exercise‐stimulated glucose uptake – regulation and implications for glycaemic control. Nat Rev Endocrinol 13, 133–148. [DOI] [PubMed] [Google Scholar]
- Sylow L, Nielsen IL, Kleinert M, Moller LL, Ploug T, Schjerling P, Bilan PJ, Klip A, Jensen TE & Richter EA (2016). Rac1 governs exercise‐stimulated glucose uptake in skeletal muscle through regulation of GLUT4 translocation in mice. J Physiol 594, 4997–5008. [DOI] [PMC free article] [PubMed] [Google Scholar]
- Takenaka N, Nihata Y, Ueda S & Satoh T (2017). In situ detection of the activation of Rac1 and RalA small GTPases in mouse adipocytes by immunofluorescent microscopy following in vivo and ex vivo insulin stimulation. Cell Signal 39, 108–117. [DOI] [PubMed] [Google Scholar]
- Tan SX, Ng Y, Meoli CC, Kumar A, Khoo PS, Fazakerley DJ, Junutula JR, Vali S, James DE & Stockli J (2012). Amplification and demultiplexing in insulin‐regulated Akt protein kinase pathway in adipocytes. J Biol Chem 287, 6128–6138. [DOI] [PMC free article] [PubMed] [Google Scholar]
- Taniguchi CM, Emanuelli B & Kahn CR (2006). Critical nodes in signalling pathways: insights into insulin action. Nat Rev Mol Cell Biol 7, 85–96. [DOI] [PubMed] [Google Scholar]
- Timmers S, de Vogel‐van den Bosch J, Towler MC, Schaart G, Moonen‐Kornips E, Mensink RP, Hesselink MK, Hardie DG & Schrauwen P (2010). Prevention of high‐fat diet‐induced muscular lipid accumulation in rats by α lipoic acid is not mediated by AMPK activation. J Lipid Res 51, 352–359. [DOI] [PMC free article] [PubMed] [Google Scholar]
- Tonks KT, Ng Y, Miller S, Coster AC, Samocha‐Bonet D, Iseli TJ, Xu A, Patrick E, Yang JY, Junutula JR, et al (2013). Impaired Akt phosphorylation in insulin‐resistant human muscle is accompanied by selective and heterogeneous downstream defects. Diabetologia 56, 875–885. [DOI] [PubMed] [Google Scholar]
- Tong P, Khayat ZA, Huang C, Patel N, Ueyama A & Klip A (2001). Insulin‐induced cortical actin remodeling promotes GLUT4 insertion at muscle cell membrane ruffles. J Clin Invest 108, 371–381. [DOI] [PMC free article] [PubMed] [Google Scholar]
- Tremblay F, Lavigne C, Jacques H & Marette A (2001). Defective insulin‐induced GLUT4 translocation in skeletal muscle of high fat‐fed rats is associated with alterations in both Akt/protein kinase B and atypical protein kinase C (ζ/λ) activities. Diabetes 50, 1901–1910. [DOI] [PubMed] [Google Scholar]
- Welinder C & Ekblad L (2011). Coomassie staining as loading control in Western blot analysis. J Proteome Res 10, 1416–1419. [DOI] [PubMed] [Google Scholar]
- Whitham M & Febbraio MA (2016). The ever‐expanding myokinome: discovery challenges and therapeutic implications. Nat Rev Drug Discov 15, 719–729. [DOI] [PubMed] [Google Scholar]
- Whitham M, Parker BL, Friedrichsen M, Hingst JR, Hjorth M, Hughes WE, Egan CL, Cron L, Watt KI, Kuchel RP, Jayasooriah N, Estevez E, Petzold T, Suter CM, Gregorevic P, Kiens B, Richter EA, James DE, Wojtaszewski JFP & Febbraio MA (2018). Extracellular Vesicles Provide a Means for Tissue Crosstalk during Exercise. Cell Metab 27, 237–251.e4. [DOI] [PubMed] [Google Scholar]