

ABSTRACT
CD8+ cells play a key role in human immunodeficiency virus (HIV)/simian immunodeficiency virus (SIV) infection, but their specific mechanism(s) of action in controlling the virus is unclear. Two-long-terminal-repeat (2-LTR) circles are extrachromosomal products generated upon failed integration of HIV/SIV. To understand the specific effects of CD8+ cells on infected cells, we analyzed the dynamics of 2-LTR circles in SIVmac251-infected rhesus macaques (RMs) treated with an integrase inhibitor (INT). Twenty RMs underwent CD8+ cell depletion and received raltegravir (RAL) monotherapy or a combination of both. Blood, lymph nodes (LNs), and gut biopsy specimens were routinely sampled. Plasma viral loads (pVLs) and 2-LTR circles from peripheral blood mononuclear cells (PBMCs) and LN lymphocytes were measured with quantitative reverse transcription-PCR (qRT-PCR). In the CD8 depletion group, an ∼1-log increase in pVLs and a slow increase in PBMC 2-LTRs occurred following depletion. In the INT group, a strong decline in pVLs upon treatment initiation and no change in 2-LTR levels were observed. In the INT and CD8+ cell depletion group, an increase in pVLs following CD8 depletion similar to that in the CD8 depletion group was observed, with a modest decline following INT initiation, and 2-LTR circles significantly increased in PBMCs and LNs. Analyzing the 2-LTR data across all treatment groups with a mathematical model indicates that the data best support an effect of CD8+ cells in killing cells prior to viral integration. Sensitivity analyses of these results confirm that effect but also allow for additional effects, which the data do not discriminate well. Overall, we show that INT does not significantly increase the levels of 2-LTR circles. However, CD8+ cell depletion increases the 2-LTR levels, which are enhanced in the presence of an INT.
IMPORTANCE CD8+ T cells play an essential role in controlling HIV and SIV infection, but the specific mechanisms involved remain poorly understood. Due to failed viral infection, HIV and SIV can form 2-LTR extrachromosomal circles that can be quantified. We present novel data on the dynamics of these 2-LTR forms in a SIV-infected macaque model under three different treatment conditions: depletion of CD8+ cells, administration of the integrase inhibitor in a monotherapy, which favors the formation of 2-LTR circles, and a combination of the two treatments. We used a new mathematical model to help interpret the data, and the results suggest that CD8+ cells exert a killing effect on infected cells prior to virus integration. These results provide new insights into the mechanisms of action of CD8+ cells in SIV infection. Confirmation of our results would be an important step in understanding immune control of HIV.
KEYWORDS: simian immunodeficiency virus, 2-LTR circles, rhesus macaques, integrase inhibitor, raltegravir, CD8+ cell depletion
INTRODUCTION
Multiple lines of evidence demonstrate that CD8+ cells are important in controlling human immunodeficiency virus (HIV)/simian immunodeficiency virus (SIV) infection: (i) a strong association exists between specific host major histocompatibility complex class I (MHC-I) alleles and HIV/SIV disease progression (1); (ii) a temporal association can be established between the postpeak decline in plasma viremia and the increase in virus-specific CD8+ cytotoxic T lymphocyte (CTL) responses (2, 3); (iii) virus escape mutations consistently arise in the face of host cytotoxic responses during all stages of infection, starting from the time when cellular immune responses are generated (4–8); (iv) CD8+ cell depletion in vivo results in a rapid and sustained increase in plasma viremia, which then returns to predepletion levels following the rebound of CD8+ cells (9–21). Furthermore, CD8+ T cells suppress HIV infection in vitro (22, 23). However, the specific mechanism(s) of action these cells take to control viral replication is poorly understood. To gain some insight, we assessed the role of CD8+ cells in controlling two-long-terminal-repeat-positive (2-LTR+) cells, which we used as a surrogate for HIV-infected cells preintegration. A recent study showed that cells containing virus prior to integration can represent a sizeable fraction of the total population of infected cells (24).
Long-term administration of antiretroviral (ARV) therapy (ART) to HIV-infected individuals results in virus suppression for the duration of treatment (25). ART interruption is followed by a rapid virus rebound to virtually pretreatment levels, confirming the persistence of a latent reservoir that cannot be eradicated by ART alone (26–28). The mechanism of reservoir formation involves integration of the linear reverse-transcribed proviral DNA genome into the host genome. However, due to the poor efficiency of this process, the viral genome is not always able to integrate, leading to the production of extrachromosomal elements (29, 30). An increase in these extrachromosomal products also occurs when HIV-infected subjects receive ARV regimens containing integrase inhibitors (INT) (31–33). These viral isoforms represent viral genomes circularized by host DNA repair enzymes or by undergoing recombination with themselves and are represented by 2-LTR and 1-LTR circles, respectively. These episomes, particularly the 2-LTR circles, have been reported to be useful surrogate markers of viral replication (34). However, this aspect is still under debate, as some have suggested that 2-LTR circles have a short half-life while other studies have shown that 2-LTR circles can still be detected by quantitative PCR (qPCR) when plasma viral loads (pVLs) are undetectable (35–37). Further, 2-LTR circles have been shown to act as the substrates for integration by cleavage of the palindromic site at the LTR-LTR junction by the viral integrase protein, resulting in a linear viral cDNA genome that can be effectively integrated and produce infectious virions (38, 39).
2-LTR circles became more relevant to investigate upon the introduction of integrase inhibitors, such as raltegravir (RAL), which we study here, particularly since intensification of ongoing ART regimens with an INT induces an increase in 2-LTR circles (31–33). Levels of 2-LTRs were reported to increase immediately after RAL intensification, but these increases were transient and eventually followed by a return to pretreatment levels (31–33). The transient increases of 2-LTRs have been attributed to the prevention of new integration events by RAL, thus inducing 2-LTR formation (40).
Here, we investigated the effect of CD8 depletion with or without RAL monotherapy on 2-LTR levels in SIV-infected rhesus macaques (RMs). Monotherapy was used to allow maximal production of 2-LTR circles, since cells are still de novo infected during therapy, thus allowing better detection of the effects of CD8+ cells. We then compared our data to an extended model of viral dynamics to explore the effect of CD8+ cells on 2-LTR circle dynamics. We report that the levels of 2-LTR circles modestly increase following CD8+ cell depletion, are unchanged after RAL monotherapy, and dramatically increase following the combined CD8+ cell depletion and RAL monotherapy. Using the model of viral dynamics that includes 2-LTR circles, we found that model predictions are most similar to the observed data when CD8+ cell killing of infected cells occurs prior to viral integration.
RESULTS
CD8+ cell depletion increases the levels of plasma viral load and of the 2-LTR circles in the periphery, but it has minimal impact on 2-LTR levels in the lymph nodes (LNs).
CD8+ cells were depleted by administering 50 mg/kg of the monoclonal antibody M-T807R1 to four SIVmac251-infected RMs at 56 days postinfection (dpi) and then again after 22 days. M-T807R1 administration resulted in a rapid depletion of the CD8+ cells from the periphery for the duration of the follow-up (Fig. 1A). In the intestine, >99% of the CD8+ cells were also depleted (Fig. 1B). However, the impact of the depleting antibody was minimal on the CD8+ cells in the LNs (Fig. 1C).
FIG 1.

Effects of CD8+ cell depletion alone. The effects of CD8+ cell depletion on CD4+ (first row) and CD8+ (second row) cells in peripheral blood (absolute values) (A), in jejunal biopsy specimens (percentage of CD3+ cells) (B), in superficial LNs (percentage of CD3+ cells) (C), and the plasma viral load (pVL) (D) are shown. Error bars represent standard errors of the mean (SEM). LN data include historical reference values before CD8+ cell depletion (day −2). The vertical dashed lines indicate the times of anti-CD8+ antibody administration.
Peripheral CD4+ cells experienced a rapid but transient decrease at the time of the first CD8 depletion, with a slight recovery occurring between the two depletion points (Fig. 1A). In both the gut biopsy specimens and the LNs, CD4+ T cells were not impacted by the CD8+ cell depletion (Fig. 1B and C).
As a result of the CD8+ cell depletion, a median increase in plasma viral load (pVL) of 0.8 log10 (range, 0.4 to 1.4 log10) occurred, and it persisted throughout follow-up (Fig. 1D).
We then quantified the levels of 2-LTR circles in mononuclear cells isolated from both circulation and superficial LNs collected at specific points posttreatment. The levels of 2-LTR circles/ml increased in the whole blood after the first M-T807R1 administration (P = 0.022) (Fig. 2A). Conversely, the levels of 2-LTR circles/million CCR5+ cells did not change in the LNs of the RMs (P = 0.375) (Fig. 2A), and we were not able to quantify the 2-LTR circles in the gut, as we did not recover enough cells from the gut biopsy specimens.
FIG 2.

Effects of CD8 depletion with or without RAL monotherapy on 2-LTR circles in blood and LNs. The left column represents the number of 2-LTR circles per ml of blood, and the right column represents the number of 2-LTR circles per million CCR5+ cells in the lymph nodes. (A) CD8+ cell depletion alone, where the vertical dashed lines represent the times of anti-CD8+ antibody administration; (B) RAL monotherapy alone, where the shaded area represents the period of therapy; (C) CD8+ cell depletion and RAL monotherapy. A linear mixed-effects model was used to analyze the dynamics of 2-LTR in blood and a (paired) Wilcoxon rank sum test was performed to analyze the LN data. NS, nonsignificant.
RAL monotherapy decreases pVL but does not impact the 2-LTR circles.
To better understand the impact of CD8+ cell depletion on the fate of the virus in RMs, we performed an additional study in which eight RMs were administered RAL monotherapy for 23 days. Peripheral and LN CD4+ cells slightly recovered during RAL treatment (with a recovery of <200 CD4+ T cells/μl in blood and an average of 5% of CD4+ T cells recovered in the LNs). Conversely, the levels of CD4+ T cells remained unchanged in the gut. Peripheral CD8+ T cells were slightly boosted immediately after RAL initiation (average, 200 CD8+ T cells/μl blood), while the treatment had no impact on the CD8+ T cells from the gut and LNs (Fig. 3A to C). Upon RAL initiation, a median reduction in pVL of 1.99 log10 (range, 0.79 to 4 log10) was observed (Fig. 3D).
FIG 3.

Effects of RAL monotherapy alone. The effects of RAL monotherapy on CD4+ (first row) and CD8+ (second row) cells in peripheral blood (absolute values) (A), in jejunal biopsy specimens (percentage of CD3+ cells) (B), in superficial LNs (percentage of CD3+ cells) (C), and pVL (D). Error bars represent SEM. The shaded area indicates the period of RAL therapy.
Interestingly, the 2-LTR circles did not increase during RAL treatment either in the blood (P = 0.51) or in the LNs (P = 0.219) (Fig. 2B).
Combined RAL monotherapy and CD8+ cell depletion results in a slight decline in pVLs associated with a sustained increase in the 2-LTR circles.
Finally, to assess the role of the CD8+ cells in controlling 2-LTR circles, we performed an experiment in which RMs were administered both M-T807R1 and RAL monotherapy. CD8+ cell depletion and RAL were administered as in the first two groups, with RAL monotherapy starting 2 days after the first CD8+ cell depletion.
Peripheral and jejunal CD8+ cells were rapidly and completely depleted after the first administration of M-T807R1 and remained depleted throughout the follow-up (Fig. 4A and B). CD8+ cell depletion after administration of M-T807R1 was slower and less prominent in the LNs (Fig. 4C).
FIG 4.

Effects of CD8+ cell depletion and RAL monotherapy. The effects of CD8+ cell depletion and RAL monotherapy on CD4+ (first row) and CD8+ (second row) cells in peripheral blood (absolute values) (A), in jejunal biopsy specimens (percentage of CD3+ cells) (B), in superficial LNs (percentage of CD3+ cells) (C), and pVL (D). Error bars represent SEM. LN data include historical reference values before CD8+ cell depletion (day −2). The vertical dashed lines indicate the times of anti-CD8+ antibody administration, and the shaded area indicates the period of RAL therapy.
Peripheral CD4+ T cells experienced a sharp drop (to 260 CD4+ cells/μl blood) after the first round of M-T807R1 administration (Fig. 4A), followed by a recovery during RAL therapy (Fig. 4A). Gut and LN CD4+ T cells recovered during RAL treatment (average recoveries of 4.2% and 13.7%, respectively) (Fig. 4B and C).
Similar to the CD8+ cell-depletion-only group, we observed an immediate median increase in pVL of 0.6 log10 (range, −0.2 to 0.9 log10) following the first round of M-T807R1 administration. In these RMs, initiation of RAL therapy, 2 days after the CD8+ cell depletion, led to only a small decrease in pVL (median, 0.975 log10; range, 0.22 to 1.78 log10) (Fig. 4D).
Unlike the CD8+ cell-depletion-only and the RAL-monotherapy-only groups, the RMs subjected to both CD8+ cell depletion and RAL monotherapy experienced a fast and significant increase in both peripheral (P = 0.012) and LN (P = 0.023) 2-LTR circles (Fig. 2C).
What effector mechanism of CD8+ cells is responsible for the observed 2-LTR dynamics?
We used a model of viral and 2-LTR dynamics to help interpret the results described above (see Fig. 5 and Materials and Methods for a description of the model). We analyzed five possible assumptions for the effects of CD8+ cells (15, 16, 20, 22, 41–45), i.e., CD8+ cells could (i) increase the death rate of infected cells before integration, i.e., affect the rate δ1; (ii) increase the death rate of productively infected cells, i.e., affect the rate δ2; (iii) reduce the viral production rate through noncytolytic mechanisms, i.e., affect the rate p; (iv) reduce the viral infectivity rate through noncytolytic mechanisms, i.e., affect the rate β; or (v) reduce the integration rate through noncytolytic mechanisms, i.e., affect the rate k. In addition, we also tested the 10 possible combinations of those mechanisms two-by-two, for a total of 15 different models. We fitted the model to the three treatment groups together to see what effect of CD8+ cell depletion best explained all the data.
FIG 5.
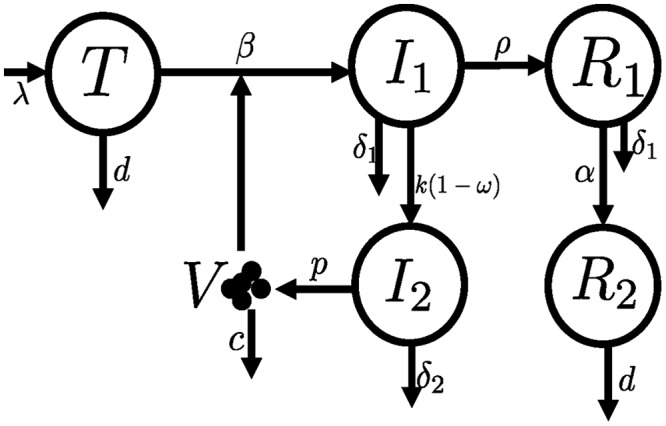
Schematic of the model for the dynamics of 2-LTR+ cells. This model is based on a previously described model to analyze integrase inhibitor therapy (53). We added two compartments to simulate the dynamics of 2-LTR+ cells: R1 represents recently produced 2-LTR+ cells, still with an elevated death rate (δ1), and R2 represents long-lived 2LTR+ cells. See Materials and Methods for a detailed description of the model and its parameters.
In Fig. 6, we show the fits of the model to the data in each CD8+ cell depletion scenario. We found that the data provided similar support for several models (that is, combination of CD8+ T cell effects). However, the two common properties of all the best models supported by the data were an estimate of a very low transition rate between short-lived and long-lived 2-LTR+ cells (the transition between R1 and R2 in Fig. 5 at rate α) and an effect of CD8+ cells in increasing the death rate of infected cells before integration (δ1). The estimated reduction in the latter rate (δ1) in the absence of CD8+ cells was between 6- and 10-fold, except in one case, where this reduction was 100-fold.
FIG 6.

Comparison of potential CD8+ cell effects on the dynamics of 2-LTR circles. A model of viral and 2-LTR dynamics was developed to analyze the observed data and potential effects of CD8+ cell: killing of infected cells prior to integration (effect in δ1) (top row), killing of productively infected cells (effect in δ2) (2nd row), noncytolytically reducing viral production (effect in p) (3rd row), noncytolytically reducing infectivity (effect in β) (4th row), and noncytolytically reducing integration (effect on k) (5th row), for each of the three treatment groups (three columns). Dashed lines represent 2-LTR+ cells/ml data normalized to the preintervention levels for each RM; solid black lines represent model projections for the fit. Parameters of the model are described in Materials and Methods; α = 0/day from the best fit.
We conducted sensitivity analyses of the results described by refitting the data with an initial assumption of a 10-fold higher production rate (p) or infectivity rate (β). Changing p had no effect on the fits (not shown), consistent with previous studies on the identifiability of this parameter (46). Using a greater infectivity (i.e., β = 10−7) confirmed the results described above with even better support (lower corrected Akaike information criteria [AICc]) than that of the original fits with a β of 10−8, and with the death rate before integration increasing in the absence of CD8+ cell by 3- to 6-fold. Finally, to confirm the robustness of the results, we also redid the fits, imposing a lower bound for the transition rate between R1 and R2 (α = 0.01/day). This degraded the fits substantially, which resulted in an increase in the AICc of more than 18. Still, the best fits all included an effect of CD8+ in increasing the death rate of infected cells before integration. The decrease in this rate in the absence of CD8+ cells was always very large, >100-fold, and an effect of CD8+ cells in one of the other parameters was also typically needed. However, the data were not able to discriminate among these other mechanisms, since the AICc were similar for models, with the additional effect in the death rate of productively infected cells (δ2), in the production of virus (p), or in the infectivity rate (β).
DISCUSSION
Experimental in vivo CD8+ cell depletion in nonhuman primates has been strategically used to analyze the role of the cytotoxic T lymphocytes (CTLs), as well as other CD8+ cells (particularly natural killer cells), in controlling viral replication in both pathogenic and nonpathogenic SIV infections (9, 14–17, 19, 20, 47). More recently, CD8+ cell depletion was utilized to support the role of the SIV-specific CD8+ cells in controlling the viral rebound after viral reactivation with latency-reversing agents (LRAs) in posttreatment controller RMs (48). In addition, CD8+ cells, in particular CD8+ T lymphocytes, critically contribute to the suppression of viremia in SIV-infected RMs on ART (14). However, the specific mechanisms by which CD8+ cells suppress viremia are poorly understood.
Overall, in this study, the observed dynamics of virus, CD4+ T cells, and CD8+ T cells were consistent with that of previous CD8+ cell depletion studies (11, 12, 15, 16, 48). However, here, our goal was to measure the changes in 2-LTR circles, as a surrogate of cells containing unintegrated virus, in SIV-infected RMs depleted of CD8+ cells in the presence or absence of RAL. Thus, we compared the data to the predictions of a mathematical model of 2-LTR dynamics. Our results suggest that CD8+ cells are able to cytolytically eliminate infected cells containing 2-LTR circles prior to integration, δ1. Indeed, the overall behavior of 2-LTR+ cells across the three animal groups is best captured by an effect of CD8+ cells on reducing early death, δ1, since all the models with the best data support (ΔAICc < 3) included a reduction in this death rate in the absence of CD8+ cells. However, sensitivity analyses of the model parameters and model structure indicated that in some instances, in addition to the effect on the early death rate (δ1), other effects of CD8+ cells were also needed to explain the data, although which specific effect was more important (in addition to δ1) was not clear. A lytic effect of CD8+ cells on infected cells prior to viral integration (δ1) is compatible with multiple experimental evidence indicating that expression of early epitopes exposes preproductive infected cells to CD8+ T-cell-mediated killing (49–52).
With hindsight, the observed effects of the three treatment strategies are clear indications of the mechanisms operating and their relative strengths (Fig. 7). In the CD8+ cell depletion group, the absence of effective anti-SIV-specific cells leads to an increase in infection events with a concomitant probability of formation of 2-LTR circles and thus originates the observed increase in the number of these cells. In the combination CD8+ cell depletion and RAL therapy group, this increase is exacerbated. Although productive infections are blocked by therapy, reverse transcription events still occur, and, as such, there is an enhanced opportunity to form 2-LTR circles, since RAL treatment leads to a preference for 2-LTR circle formation over integration. In the RAL monotherapy group, the minor changes in 2-LTR circles reveal the balance between a higher probability of forming these circles induced by INT therapy and the rapid control of pVL.
FIG 7.

Schematic representation of our findings. The effects of CD8+ depletion (A), CD8+ depletion and RAL therapy (B), and RAL therapy alone (C) are shown based on the effect of depletion of CD8+ cells in reducing the death rate of infected cells before integration.
The data presented here emphasize the controlling effects of CD8+ cells on cells containing 2-LTR circles in vivo, further documenting the contribution of the CD8+ cells to the success of ART (14). The multiple conditions tested here (presence or absence of RAL monotherapy, with and without CD8+ cells) point to how sensitive the development and persistence of 2-LTR circles are to the environment and document the validity of monitoring the 2-LTR circles as a surrogate of HIV persistence. Further, modeling results suggest that CD8+ cells exert an effect on infected cells prior to integration. Due to the potential role that 2-LTR circles have in maintaining the viral reservoir, it is important to continue exploring these viral isoforms in future research endeavors targeting cure.
MATERIALS AND METHODS
Ethics statement.
All RMs were housed and maintained at the Plum Borough Research Facility, University of Pittsburgh, according to the standards of the Association for Assessment and Accreditation of Laboratory Animal Care (AAALAC), and experiments were approved by the University of Pittsburgh Institutional Animal Care and Use Committee (IACUC). The animals were cared for according to the Guide for the Care and Use of Laboratory Animals and the Animal Welfare Act (16). These studies were approved by the IACUC (protocol 16058287). Efforts were made to minimize animal suffering; all RMs in this study were socially housed in pairs indoors in suspended stainless-steel cages, had a 12-h-light/12-h-dark cycle, and were fed twice daily with commercial primate diet, and water was provided freely at all times. A variety of environmental enrichment strategies were employed, including providing toys to manipulate and playing entertainment videos in the animal rooms. The animals were observed twice daily for any signs of disease or discomfort, which were reported to the veterinary staff for evaluation. For sample collection, animals were anesthetized with 10 mg/kg ketamine HCl (Parke-Davis, Morris Plains, NJ, USA). At the end of the study, the animals were sacrificed by intravenous administration of barbiturates.
Animals, infections, and treatments.
Twenty RMs (Macaca mulatta) of Indian origin were included. They were intravenously infected with 300 50% tissue culture infectious doses (TCID50) of SIVmac251 and closely clinically monitored throughout the follow-up.
Fifty-six days postinfection (dpi) (during early chronic infection), 12 RMs received the CD8+ cell-depleting monoclonal antibody M-T807R1 (NIH Nonhuman Primate Reagent Resource, Boston, MA) at a dose of 50 mg/kg. An additional 50-mg/kg dose of M-T807R1 was administered 19 days later. Two days following the first CD8-depleting antibody infusion, RAL monotherapy was initiated for 23 days in eight of these RMs at a dose of 20 mg/kg twice a day (b.i.d.). In addition, eight RMs without CD8 depletion were treated with RAL monotherapy under identical conditions.
Sampling and sample processing.
Blood was collected from all RMs prior to treatment (−8, −2, and 0 days posttreatment [dpt]) and during RAL treatment (every 6 h for the first 2 days, every 2 days for 2 weeks, and then every 3 days until 23 dpt was reached). Within 1 h of blood collection, plasma was harvested and peripheral blood mononuclear cells (PBMCs) were separated from the blood using lymphocyte separation medium (LSM; MPBio, Solon, OH).
Superficial lymph node (LN) biopsy specimens were taken from all RMs at the time of RAL treatment initiation and at 14 days posttreatment. Lymphocytes were separated from LNs by pressing the tissue through a nylon mesh screen, filtered through nylon bags, and washed with RPMI medium (Cellgro, Manassas, VA) containing 5% heat-inactivated newborn calf serum, 0.01% penicillin-streptomycin, 0.01% l-glutamine, and 0.01% HEPES buffer, as previously described (17, 18).
Jejunal biopsy specimens were taken at −7, 0, and 14 dpt, rinsed, and digested with EDTA and then collagenase, followed by layering a 60%-to-35% Percoll layer over the top to separate the lymphocytes.
Plasma viral load quantification.
The levels of viral replication were monitored by measuring the plasma viral loads at all time points, as previously described (48). The primer and probe sequences amplify a conserved region of Gag and are as follows: SIVmac251F, 5′-GTC TGC GTC ATC TGG TGC ATT C-3′; SIVmac251R, 5′-CAC TAG GTG TCT CTG CAC TAT CTG TTT TG-3′; SIVmac251Probe, 5′-CTT CCT CAG/ZEN/TGT GTT TCA CTT TCT CTT CTG CG/3IABkFQ/-3′ (ZEN and 3IABkFQ are from Integrated DNA Technologies, Inc., Skokie, IL).
Flow cytometry.
Whole blood taken at specific times during treatment was stained using a two-step TruCount technique to enumerate PBMCs (described as lymphocytes plus monocytes/macrophages) in the blood, as previously described (20). The number of PBMCs was quantified using 50 μl of whole blood stained with antibodies in TruCount tubes (BD Biosciences) that contained a defined number of fluorescent beads to provide internal calibration.
2-LTR circle extraction and quantification.
A total of 1 × 10⁶ to 2 × 10⁶ PBMCs and lymphocytes from LNs were pelleted, the supernatant was removed, and the cells were flash frozen at −80°C. 2-LTR circles in PBMCs were determined at days −8, 1, 12, and 17 posttreatment. Total DNA was extracted from each sample using a TRIzol-based extraction, as follows: 400 μl Tri-reagent (Molecular Research Center, Inc., Cincinnati, OH) was added to each tube, and samples were vortexed until the pellets dissolved. One hundred microliters of 1-bromo-3-chloropropane (BCP) (Molecular Research Center, Inc., Cincinnati, OH) was added to each tube, vortexed for 15 s, and centrifuged at 14,000 × g for 15 min at 4°C. The upper aqueous phase was removed, followed by the addition of 500 μl DNA back extraction buffer (GuSCN, Trizma base, sodium citrate), vortexing (15 s), and centrifugation at 14,000 × g for 15 min at 4°C. The upper aqueous DNA phase was removed, and 12 μl of 20 mg/ml glycogen was added and mixed by pipetting, followed by the addition of 400 μl isopropanol, mixing, and centrifugation at 21,000 × g for 10 min at room temperature. Isopropanol was removed, and DNA pellets were washed with 70% ethanol for 2 days at 4°C to ensure complete leaching of salts from the pellets. After 2 days, the ethanol was removed, and pellets were resuspended in 5 mM Tris, followed by denaturing at 100°C for 10 min and a quick chill on ice, to ensure the uniform distribution of samples for accurate quantitative PCR (qPCR) results.
Extracted DNA samples were tested in duplicate and quantified in a 2-LTR qPCR using the following specific primers and probe: forward primer SIVmac251 2-LTR F, 5′-CGC CTG GTC AAC TCG GTA CTC-3′, based in the 5′ U5; reverse primer SIVmac251 2-LTR R, 5′-GGT ATG ATG CCT TCT TCC TTT TCT AAG-3′, based in the 3′ U3; and SIVmac251 2-LTR probe, 5′-/56-FAM/CCC TGG TCT/ZEN/GTT AGG ACC CTT TCT GCT TTG/3IABkFQ/-3′ overlapping the junction between the two primers. The number of tested cells was assessed by quantifying RM-CCR5 expression in each sample using the following primers and probe: forward primer RM-CCR5 F, 5′-CCA GAA GAG CTG CGA CAT CC-3′; reverse primer RM-CCR5 R, 5′-GTT AAG GCT TTT ACT CAT CTC AGA AGC TAA C-3′; and probe, 5′-/56-FAM/TTC CCC TAC/ZEN/AAG AAA CTC TCC CCG GTA AGT A/3IABkFQ-3′. Real-time PCRs and data analyses were performed utilizing an ABI 7900 HT real-time machine (Applied Biosystems, Foster City, CA). All primers and probes were produced by Integrated DNA Technologies (IDT), Coralville, IA.
We present all results in blood as the number of 2-LTR circles/ml, which we calculated using the absolute count of PBMCs determined from the TruCounts. It is important to note that the number of 2-LTR circles/ml is a more faithful measure of the dynamics of 2-LTR circles than this number normalized by a million cells, because the latter also depends on the dynamics of cells without 2-LTR circles, which change with treatment. For tissue samples (such as LN biopsy specimens), we present the results as the number of 2-LTR circles/million CCR5+ cells, because it is difficult to calculate absolute numbers of 2-LTR+ cells. Due to low cell counts in the jejunal biopsy specimens, we were unable to quantify the levels of 2-LTR circles in these samples.
Statistics.
Linear mixed-effects models were performed on 2-LTR circles/ml in blood, and the paired Wilcoxon rank sum test was performed on 2-LTR circles/million CCR5+ cells in LNs. Linear mixed-effects models were performed in R (The Comprehensive R Archive Network [CRAN], Vienna, Austria); nonparametric tests were performed in GraphPad Prism software (GraphPad, La Jolla, CA).
Modeling 2-LTR dynamics.
To help interpret the observed dynamics of 2-LTR, we extended a model of viral dynamics under integrase inhibitor therapy (53–55), by including the dynamics of 2-LTR+ cells (Fig. 5). We assumed that in a fraction of infected cells, reverse transcription of HIV DNA results in 2-LTR circles, and these cells do not progress to proviral integration. In this model, target cells (T) are created at a constant rate λ, die at rate d, and are infected by the virus (V) at rate β. Infected cells (I1) are generated by infection and reverse transcription of HIV RNA. These cells are lost by death (δ1), possibly due to effector CD8+ cells, by integration of the proviral DNA at rate k, and by circularization of the HIV DNA at rate ρ. Cells in which 2-LTR circles were just produced (R1) are also lost by death at rate δ1; however, 2-LTR+ cells can also become long-lived (R2), at rate α, in which case we assume that their death rate is the same as that in uninfected cells, i.e., d. The total concentration of 2-LTR circles is then given by the sum R1 + R2. We assume that RAL reduces the integration step with efficacy ω. Cells with integrated HIV DNA (I2) are productively infected, generating virus (V) at rate p per cell and are lost at rate δ2, again possibly dependent on CD8+ cells. The model equations are as follows:
We assumed steady state before CD8+ cell depletion, with V0 given by the viral load in the monkey before any intervention. This assumption allowed us to fix λ, for each macaque, as follows:
From the steady-state level of 2-LTR circles (in the model R1 + R2), we can fix ρ, for each macaque, as a function of the other parameters. This is done by the following expression:
For most of the other parameters, we used values from previous publications (24, 53), which we kept the same for all macaques, namely, β = 10−8 ml/virions/day, p = 103 virions/cell/day c = 23/day, d = 0.01/day, k = 2.6/day, δ1 = 0.15/day, δ2 = 1.0/day, and ω = 0.95. However, we also tested the sensitivity to the choice of β and p, by repeating the fits described below with β = 10−7 ml/virions/day and/or p = 102 and p = 104 virions/cell/day. The value of p had no effect on the fits or the conclusions presented (not shown). On the other hand, β influenced the quantitative values of the parameters but did not change the overall conclusions, although the predicted profiles of 2-LTR+ cells/ml were not as good.
We then performed fits of the model to the changes in 2-LTR/ml to estimate α and the effect of CD8+ cell depletion. In these fits, we searched for the best set of parameters for all the data together, i.e., the 2-LTRs in the 20 RMs, normalized at the initial time and assuming five different effects of CD8+ cell depletion (and their combinations two by two): (i) on the death of infected cells before integration, by reducing δ1 in the model; (ii) on the death of productively infected cells by reducing δ2; (iii) on the viral production, by increasing p; (iv) on the infectivity of virus, by increasing β; and (iv) on the integration rate, by increasing k. The first three effects have been referred to in the literature of CD8+ cell depletion studies as putative targets for the action of CD8+ T cells (15, 16, 20, 42), and we include the last two for completeness. However, our interest is not in the specific values of the parameters but rather in the general behavior of the model and how it compares with our observed 2-LTR dynamics under different treatment conditions. In addition, in the current manuscript, we are studying only the 2-LTR dynamics and did not fit virus or T-cell dynamics. The model was simulated using R (https://cran.r-project.org/), and we used the DEoptim package of R for fitting. We compared models and selected the best one based on the corrected Akaike information criteria (AICc) (56).
The best fits resulted systematically in α = 0/day or very near 0, indicating that R2 = 0 cells/ml. So, we also performed analyses imposing a lower bound of α = 0.1/day. Although these fits were not as good, the model may be more physiological.
ACKNOWLEDGMENTS
We thank Taruna Joshi for her technical help.
This work was supported by the National Institutes of Health/National Center for Research Resources/National Institute of Allergy and Infectious Diseases/National Heart, Lung and Blood Institute grants AI104373 (R.M.R.), R01 HL117715 (I.P.), R01 AI119346 (C.A.), and R01 HL123096 (I.P.). B.B.P. was supported in part by the NIH training grant T32 AI065380.
The funders had no role in study design, data collection and analysis, decision to publish, or preparation of the manuscript.
REFERENCES
- 1.Brumme ZL, Harrigan PR. 2006. The impact of human genetic variation on HIV disease in the era of HAART. AIDS Rev 8:78–87. [PubMed] [Google Scholar]
- 2.Borrow P, Lewicki H, Hahn BH, Shaw GM, Oldstone MB. 1994. Virus-specific CD8+ cytotoxic T-lymphocyte activity associated with control of viremia in primary human immunodeficiency virus type 1 infection. J Virol 68:6103–6110. [DOI] [PMC free article] [PubMed] [Google Scholar]
- 3.Koup RA, Safrit JT, Cao Y, Andrews CA, McLeod G, Borkowsky W, Farthing C, Ho DD. 1994. Temporal association of cellular immune responses with the initial control of viremia in primary human immunodeficiency virus type 1 syndrome. J Virol 68:4650–4655. [DOI] [PMC free article] [PubMed] [Google Scholar]
- 4.Borrow P, Lewicki H, Wei X, Horwitz MS, Peffer N, Meyers H, Nelson JA, Gairin JE, Hahn BH, Oldstone MB, Shaw GM. 1997. Antiviral pressure exerted by HIV-1-specific cytotoxic T lymphocytes (CTLs) during primary infection demonstrated by rapid selection of CTL escape virus. Nat Med 3:205–211. doi: 10.1038/nm0297-205. [DOI] [PubMed] [Google Scholar]
- 5.Chen ZW, Craiu A, Shen L, Kuroda MJ, Iroku UC, Watkins DI, Voss G, Letvin NL. 2000. Simian immunodeficiency virus evades a dominant epitope-specific cytotoxic T lymphocyte response through a mutation resulting in the accelerated dissociation of viral peptide and MHC class I. J Immunol 164:6474–6479. doi: 10.4049/jimmunol.164.12.6474. [DOI] [PubMed] [Google Scholar]
- 6.McMichael AJ, Phillips RE. 1997. Escape of human immunodeficiency virus from immune control. Annu Rev Immunol 15:271–296. doi: 10.1146/annurev.immunol.15.1.271. [DOI] [PubMed] [Google Scholar]
- 7.Phillips RE, Rowland-Jones S, Nixon DF, Gotch FM, Edwards JP, Ogunlesi AO, Elvin JG, Rothbard JA, Bangham CRM, Rizza CR, McMichael AJ. 1991. Human immunodeficiency virus genetic variation that can escape cytotoxic T cell recognition. Nature 354:453–459. doi: 10.1038/354453a0. [DOI] [PubMed] [Google Scholar]
- 8.Goulder PJR, Phillips RE, Colbert RA, McAdam S, Ogg G, Nowak MA, Giangrande P, Luzzi G, Morgana B, Edwards A, McMichael AJ, Rowland-Jones S. 1997. Late escape from an immunodominant cytotoxic T-lymphocyte response associated with progression to AIDS. Nat Med 3:212–217. doi: 10.1038/nm0297-212. [DOI] [PubMed] [Google Scholar]
- 9.Pandrea I, Gaufin T, Gautam R, Kristoff J, Mandell D, Montefiori D, Keele BF, Ribeiro RM, Veazey RS, Apetrei C. 2011. Functional cure of SIVagm infection in rhesus macaques results in complete recovery of CD4+ T cells and is reverted by CD8+ cell depletion. PLoS Pathog 7:e1002170. doi: 10.1371/journal.ppat.1002170. [DOI] [PMC free article] [PubMed] [Google Scholar]
- 10.Policicchio BB, Pandrea I, Apetrei C. 2016. Animal models for HIV cure research. Front Immunol 7:12. doi: 10.3389/fimmu.2016.00012. [DOI] [PMC free article] [PubMed] [Google Scholar]
- 11.Gaufin T, Ribeiro RM, Gautam R, Dufour J, Mandell D, Apetrei C, Pandrea I. 2010. Experimental depletion of CD8+ cells in acutely SIVagm-infected African green monkeys results in increased viral replication. Retrovirology 7:42. doi: 10.1186/1742-4690-7-42. [DOI] [PMC free article] [PubMed] [Google Scholar]
- 12.Chowdhury A, Hayes TL, Bosinger SE, Lawson BO, Vanderford T, Schmitz JE, Paiardini M, Betts M, Chahroudi A, Estes JD, Silvestri G. 2015. Differential impact of in vivo CD8+ T lymphocyte depletion in controller versus progressor simian immunodeficiency virus-infected macaques. J Virol 89:8677–8686. doi: 10.1128/JVI.00869-15. [DOI] [PMC free article] [PubMed] [Google Scholar]
- 13.Schmitz JE, Zahn RC, Brown CR, Rett MD, Li M, Tang H, Pryputniewicz S, Byrum RA, Kaur A, Montefiori DC, Allan JS, Goldstein S, Hirsch VM. 2009. Inhibition of adaptive immune responses leads to a fatal clinical outcome in SIV-infected pigtailed macaques but not vervet African green monkeys. PLoS Pathog 5:e1000691. doi: 10.1371/journal.ppat.1000691. [DOI] [PMC free article] [PubMed] [Google Scholar]
- 14.Cartwright EK, Spicer L, Smith SA, Lee D, Fast R, Paganini S, Lawson BO, Nega M, Easley K, Schmitz JE, Bosinger SE, Paiardini M, Chahroudi A, Vanderford TH, Estes JD, Lifson JD, Derdeyn CA, Silvestri G. 2016. CD8(+) lymphocytes are required for maintaining viral suppression in SIV-infected macaques treated with short-term antiretroviral therapy. Immunity 45:656–668. doi: 10.1016/j.immuni.2016.08.018. [DOI] [PMC free article] [PubMed] [Google Scholar]
- 15.Wong JK, Strain MC, Porrata R, Reay E, Sankaran-Walters S, Ignacio CC, Russell T, Pillai SK, Looney DJ, Dandekar S. 2010. In vivo CD8+ T-cell suppression of SIV viremia is not mediated by CTL clearance of productively infected cells. PLoS Pathog 6:e1000748. doi: 10.1371/journal.ppat.1000748. [DOI] [PMC free article] [PubMed] [Google Scholar]
- 16.Klatt NR, Shudo E, Ortiz AM, Engram JC, Paiardini M, Lawson B, Miller MD, Else J, Pandrea I, Estes JD, Apetrei C, Schmitz JE, Ribeiro RM, Perelson AS, Silvestri G. 2010. CD8+ lymphocytes control viral replication in SIVmac239-infected rhesus macaques without decreasing the lifespan of productively infected cells. PLoS Pathog 6:e1000747. doi: 10.1371/journal.ppat.1000747. [DOI] [PMC free article] [PubMed] [Google Scholar]
- 17.Schmitz JE, Kuroda MJ, Santra S, Sasseville VG, Simon MA, Lifton MA, Racz P, Tenner-Racz K, Dalesandro M, Scallon BJ, Ghrayeb J, Forman MA, Montefiori DC, Rieber EP, Letvin NL, Reimann KA. 1999. Control of viremia in simian immunodeficiency virus infection by CD8+ lymphocytes. Science 283:857–860. doi: 10.1126/science.283.5403.857. [DOI] [PubMed] [Google Scholar]
- 18.Schmitz JE, Simon MA, Kuroda MJ, Lifton MA, Ollert MW, Vogel CW, Racz P, Tenner-Racz K, Scallon BJ, Dalesandro M, Ghrayeb J, Rieber EP, Sasseville VG, Reimann KA. 1999. A nonhuman primate model for the selective elimination of CD8+ lymphocytes using a mouse-human chimeric monoclonal antibody. Am J Pathol 154:1923–1932. doi: 10.1016/S0002-9440(10)65450-8. [DOI] [PMC free article] [PubMed] [Google Scholar]
- 19.Matano T, Shibata R, Siemon C, Connors M, Lane HC, Martin MA. 1998. Administration of an anti-CD8 monoclonal antibody interferes with the clearance of chimeric simian/human immunodeficiency virus during primary infections of rhesus macaques. J Virol 72:164–169. [DOI] [PMC free article] [PubMed] [Google Scholar]
- 20.Jin X, Bauer DE, Tuttleton SE, Lewin S, Gettie A, Blanchard J, Irwin CE, Safrit JT, Mittler J, Weinberger L. 1999. Dramatic rise in plasma viremia after CD8+ T cell depletion in simian immunodeficiency virus-infected macaques. J Exp Med 189:991–998. doi: 10.1084/jem.189.6.991. [DOI] [PMC free article] [PubMed] [Google Scholar]
- 21.Madden LJ, Zandonatti MA, Flynn CT, Taffe MA, Marcondes MCG, Schmitz JE, Reimann KA, Henriksen SJ, Fox HS. 2004. CD8+ cell depletion amplifies the acute retroviral syndrome. J Neurovirol 10(Suppl 1):58–66. [DOI] [PubMed] [Google Scholar]
- 22.Walker CM, Moody DJ, Stites DP, Levy JA. 1986. CD8+ lymphocytes can control HIV infection in vitro by suppressing virus replication. Science 234:1563–1566. doi: 10.1126/science.2431484. [DOI] [PubMed] [Google Scholar]
- 23.Kannagi M, Chalifoux LV, Lord CI, Letvin NL. 1988. Suppression of simian immunodeficiency virus replication in vitro by CD8+ lymphocytes. J Immunol 140:2237–2242. [PubMed] [Google Scholar]
- 24.Cardozo EF, Andrade A, Mellors JW, Kuritzkes DR, Perelson AS, Ribeiro RM. 2017. Treatment with integrase inhibitor suggests a new interpretation of HIV RNA decay curves that reveals a subset of cells with slow integration. PLoS Pathog 13:e1006478. doi: 10.1371/journal.ppat.1006478. [DOI] [PMC free article] [PubMed] [Google Scholar]
- 25.Perelson AS, Essunger P, Cao Y, Vesanen M, Hurley A, Saksela K, Markowitz M, Ho DD. 1997. Decay characteristics of HIV-1 infected compartments during combination therapy. Nature 387:188–191. doi: 10.1038/387188a0. [DOI] [PubMed] [Google Scholar]
- 26.Chun T-W, Davey RT, Ostrowski M, Shawn Justement J, Engel D, Mullins JI, Fauci AS. 2000. Relationship between pre-existing viral reservoirs and the re-emergence of plasma viremia after discontinuation of highly active anti-retroviral therapy. Nat Med 6:757–761. doi: 10.1038/77481. [DOI] [PubMed] [Google Scholar]
- 27.Chun T-W, Davey RT, Engel D, Lane HC, Fauci AS. 1999. AIDS: re-emergence of HIV after stopping therapy. Nature 401:874–875. doi: 10.1038/44755. [DOI] [PubMed] [Google Scholar]
- 28.Wong JK, Hezareh M, Günthard HF, Havlir DV, Ignacio CC, Spina CA, Richman DD. 1997. Recovery of replication-competent HIV despite prolonged suppression of plasma viremia. Science 278:1291–1295. doi: 10.1126/science.278.5341.1291. [DOI] [PubMed] [Google Scholar]
- 29.Middleton T, Lim HB, Montgomery D, Rockway T, Tang H, Cheng X, Lu L, Mo H, Kohlbrenner WE, Molla A, Kati WM. 2004. Inhibition of human immunodeficiency virus type I integrase by naphthamidines and 2-aminobenzimidazoles. Antiviral Res 64:35–45. doi: 10.1016/j.antiviral.2004.04.007. [DOI] [PubMed] [Google Scholar]
- 30.Sharkey ME, Teo I, Greenough T, Sharova N, Luzuriaga K, Sullivan JL, Bucy RP, Kostrikis LG, Haase A, Veryard C, Davaro RE, Cheeseman SH, Daly JS, Bova C, Ellison RT, Mady B, Lai KK, Moyle G, Nelson M, Gazzard B, Shaunak S, Stevenson M. 2000. Persistence of episomal HIV-1 infection intermediates in patients on highly active anti-retroviral therapy. Nat Med 6:76–81. doi: 10.1038/71569. [DOI] [PMC free article] [PubMed] [Google Scholar]
- 31.Llibre JM, Buzón MJ, Massanella M, Esteve A, Dahl V, Puertas MC, Domingo P, Gatell JM, Larrouse M, Gutierrez M, Palmer S, Stevenson M, Blanco J, Martinez-Picado J, Clotet B. 2012. Treatment intensification with raltegravir in subjects with sustained HIV-1 viraemia suppression: a randomized 48-week study. Antiviral Ther 17:355–364. doi: 10.3851/IMP1917. [DOI] [PubMed] [Google Scholar]
- 32.Buzón M, Massanella M, Llibre JM, Esteve A, Dahl V, Puertas MC, Gatell JM, Domingo P, Paredes R, Sharkey M, Palmer S, Stevenson M, Clotet B, Blanco J, Martinez-Picado J. 2010. HIV-1 replication and immune dynamics are affected by raltegravir intensification of HAART-suppressed subjects. Nat Med 16:460–465. doi: 10.1038/nm.2111. [DOI] [PubMed] [Google Scholar]
- 33.Hatano H, Strain MC, Scherzer R, Bacchetti P, Wentworth D, Hoh R, Martin JN, McCune JM, Neaton JD, Tracy RP, Hsue PY, Richman DD, Deeks SG. 2013. Increase in 2-long terminal repeat circles and decrease in D-dimer after raltegravir intensification in patients with treated HIV infection: a randomized, placebo-controlled trial. J Infect Dis 208:1436–1442. doi: 10.1093/infdis/jit453. [DOI] [PMC free article] [PubMed] [Google Scholar]
- 34.Pierson TC, Kieffer TL, Ruff CT, Buck C, Gange SJ, Siliciano RF. 2002. Intrinsic stability of episomal circles formed during human immunodeficiency virus type 1 replication. J Virol 76:4138–4144. doi: 10.1128/JVI.76.8.4138-4144.2002. [DOI] [PMC free article] [PubMed] [Google Scholar]
- 35.Morlese J, Teo IA, Choi J-w, Gazzard B, Shaunak S. 2003. Identification of two mutually exclusive groups after long-term monitoring of HIV DNA 2-LTR circle copy number in patients on HAART. AIDS 17:679–683. doi: 10.1097/00002030-200303280-00005. [DOI] [PubMed] [Google Scholar]
- 36.Pauza CD, Trivedi P, McKechnie TS, Richman DD, Graziano FM. 1994. 2-LTR circular viral DNA as a marker for human immunodeficiency virus type 1 infection in vivo. Virology 205:470–478. doi: 10.1006/viro.1994.1667. [DOI] [PubMed] [Google Scholar]
- 37.Zhu W, Jiao Y, Lei R, Hua W, Wang R, Ji Y, Liu Z, Wei F, Zhang T, Shi X, Wu H, Zhang L. 2011. Rapid turnover of 2-LTR HIV-1 DNA during early stage of highly active antiretroviral therapy. PLoS One 6:e21081. doi: 10.1371/journal.pone.0021081. [DOI] [PMC free article] [PubMed] [Google Scholar]
- 38.Thierry S, Munir S, Thierry E, Subra F, Leh H, Zamborlini A, Saenz D, Levy DN, Lesbats P, Saïb A, Parissi V, Poeschla E, Deprez E, Delelis O. 2015. Integrase inhibitor reversal dynamics indicate unintegrated HIV-1 DNA initiate de novo integration. Retrovirology 12:24. doi: 10.1186/s12977-015-0153-9. [DOI] [PMC free article] [PubMed] [Google Scholar]
- 39.Delelis O, Petit C, Leh H, Mbemba G, Mouscadet J-F, Sonigo P. 2005. A novel function for spumaretrovirus integrase: an early requirement for integrase-mediated cleavage of 2 LTR circles. Retrovirology 2:31. doi: 10.1186/1742-4690-2-31. [DOI] [PMC free article] [PubMed] [Google Scholar]
- 40.Luo R, Cardozo EF, Piovoso MJ, Wu H, Buzon MJ, Martinez-Picado J, Zurakowski R. 2013. Modelling HIV-1 2-LTR dynamics following raltegravir intensification. J R Soc Interface 10:20130186. doi: 10.1098/rsif.2013.0186. [DOI] [PMC free article] [PubMed] [Google Scholar]
- 41.Mackewicz CE, Blackbourn DJ, Levy JA. 1995. CD8+ T cells suppress human immunodeficiency virus replication by inhibiting viral transcription. Proc Natl Acad Sci U S A 92:2308–2312. [DOI] [PMC free article] [PubMed] [Google Scholar]
- 42.Althaus CL, De Boer RJ. 2011. Implications of CTL-mediated killing of HIV-infected cells during the non-productive stage of infection. PLoS One 6:e16468. doi: 10.1371/journal.pone.0016468. [DOI] [PMC free article] [PubMed] [Google Scholar]
- 43.Spits HB, Mudrikova T, Schellens IM, Wensing AM, Prins JM, Feuth T, Spierings E, Nijhuis M, van Baarle D, Borghans JA. 2016. The presence of protective cytotoxic T lymphocytes does not correlate with shorter lifespans of productively infected cells in HIV-1 infection. AIDS 30:9–17. doi: 10.1097/QAD.0000000000000914. [DOI] [PubMed] [Google Scholar]
- 44.Gadhamsetty S, Coorens T, de Boer RJ. 2016. Notwithstanding circumstantial alibis, cytotoxic T cells can be major killers of HIV-1-infected cells. J Virol 90:7066–7083. doi: 10.1128/JVI.00306-16. [DOI] [PMC free article] [PubMed] [Google Scholar]
- 45.Klenerman P, Phillips RE, Rinaldo CR, Wahl LM, Ogg G, May RM, McMichael AJ, Nowak MA. 1996. Cytotoxic T lymphocytes and viral turnover in HIV type 1 infection. Proc Natl Acad Sci U S A 93:15323–15328. [DOI] [PMC free article] [PubMed] [Google Scholar]
- 46.Stafford MA, Corey L, Cao Y, Daar ES, Ho DD, Perelson AS. 2000. Modeling plasma virus concentration during primary HIV infection. J Theor Biol 203:285–301. doi: 10.1006/jtbi.2000.1076. [DOI] [PubMed] [Google Scholar]
- 47.Lifson JD, Rossio JL, Piatak M, Parks T, Li L, Kiser R, Coalter V, Fisher B, Flynn BM, Czajak S, Hirsch VM, Reimann KA, Schmitz JE, Ghrayeb J, Bischofberger N, Nowak MA, Desrosiers RC, Wodarz D. 2001. Role of CD8+ lymphocytes in control of simian immunodeficiency virus infection and resistance to rechallenge after transient early antiretroviral treatment. J Virol 75:10187–10199. doi: 10.1128/JVI.75.21.10187-10199.2001. [DOI] [PMC free article] [PubMed] [Google Scholar]
- 48.Policicchio BB, Xu C, Brocca-Cofano E, Raehtz KD, He T, Ma D, Li H, Sivanandham R, Haret-Richter GS, Dunsmore T, Trichel A, Mellors JW, Hahn BH, Shaw GM, Ribeiro RM, Pandrea I, Apetrei C. 2016. Multi-dose romidepsin reactivates replication competent SIV in post-antiretroviral rhesus macaque controllers. PLoS Pathog 12:e1005879. doi: 10.1371/journal.ppat.1005879. [DOI] [PMC free article] [PubMed] [Google Scholar]
- 49.Sacha JB, Reynolds MR, Buechler MB, Chung C, Jonas AK, Wallace LT, Weiler AM, Lee W, Piaskowski SM, Soma T, Friedrich TC, Wilson NA, Watkins DI. 2008. Differential antigen presentation kinetics of CD8+ T-cell epitopes derived from the same viral protein. J Virol 82:9293–9298. doi: 10.1128/JVI.00749-08. [DOI] [PMC free article] [PubMed] [Google Scholar]
- 50.Sacha JB, Giraldo-Vela JP, Buechler MB, Martins MA, Maness NJ, Chung C, Wallace LT, Leon EJ, Friedrich TC, Wilson NA, Hiraoka A, Watkins DI. 2009. Gag- and Nef-specific CD4+ T cells recognize and inhibit SIV replication in infected macrophages early after infection. Proc Natl Acad Sci U S A 106:9791–9796. doi: 10.1073/pnas.0813106106. [DOI] [PMC free article] [PubMed] [Google Scholar]
- 51.Sacha JB, Chung C, Reed J, Jonas AK, Bean AT, Spencer SP, Lee W, Vojnov L, Rudersdorf R, Friedrich TC, Wilson NA, Lifson JD, Watkins DI. 2007. Pol-specific CD8+ T cells recognize simian immunodeficiency virus-infected cells prior to Nef-mediated major histocompatibility complex class I downregulation. J Virol 81:11703–11712. doi: 10.1128/JVI.00926-07. [DOI] [PMC free article] [PubMed] [Google Scholar]
- 52.Sacha JB, Buechler MB, Newman LP, Reed J, Wallace LT, Loffredo JT, Wilson NA, Watkins DI. 2010. Simian immunodeficiency virus-specific CD8+ T cells recognize Vpr- and Rev-derived epitopes early after infection. J Virol 84:10907–10912. doi: 10.1128/JVI.01357-10. [DOI] [PMC free article] [PubMed] [Google Scholar]
- 53.Andrade A, Guedj J, Rosenkranz SL, Lu D, Mellors J, Kuritzkes DR, Perelson AS, Ribeiro RM. 2015. Early HIV RNA decay during raltegravir-containing regimens exhibits two distinct subphases (1a and 1b). AIDS 29:2419–2426. doi: 10.1097/QAD.0000000000000843. [DOI] [PMC free article] [PubMed] [Google Scholar]
- 54.Gilmore JB, Kelleher AD, Cooper DA, Murray JM. 2013. Explaining the determinants of first phase HIV decay dynamics through the effects of stage-dependent drug action. PLoS Comput Biol 9:e1002971. doi: 10.1371/journal.pcbi.1002971. [DOI] [PMC free article] [PubMed] [Google Scholar]
- 55.Wang S, Hottz P, Schechter M, Rong L. 2015. Modeling the slow CD4+ T cell decline in HIV-infected individuals. PLoS Comput Biol 11:e1004665. doi: 10.1371/journal.pcbi.1004665. [DOI] [PMC free article] [PubMed] [Google Scholar]
- 56.Burnham K, Anderson D. 2004. Model selection and multimodel inference. Springer, New York, NY. [Google Scholar]