Significance
The development of intercellular cavities (lumens) is a ubiquitous mechanism to form complex tissue structures in organisms. The generation of Ciona Notochord, the formation of Zebrafish vasculature, or the formation of bile canaliculi between hepatic cells constitute a few examples. Lumen growth is governed by water intake that usually results from the creation of a salt concentration difference (osmotic gradients) between the inside and the outside of the lumen. During morphogenesis or in diseases, lumens can also leak due to improper maturation of the cell junctions that seal them. In this paper, we theoretically describe different conditions and dynamical regimes of lumen growth based on the balance of osmotic pressure, fluid intake, and paracellular leak.
Keywords: lumenogenesis, osmotic pressure, morphogenesis
Abstract
We model the dynamics of formation of intercellular secretory lumens. Using conservation laws, we quantitatively study the balance between paracellular leaks and the build-up of osmotic pressure in the lumen. Our model predicts a critical pumping threshold to expand stable lumens. Consistently with experimental observations in bile canaliculi, the model also describes a transition between a monotonous and oscillatory regime during luminogenesis as a function of ion and water transport parameters. We finally discuss the possible importance of regulation of paracellular leaks in intercellular tubulogenesis.
Epithelial lumens are ubiquitous in organs. They originate from cavities or tubes surrounded by one (seamless lumen) or multiple cells (1). Ions and other bioactive molecules are secreted into the cavities and, if the lumen is open, flow with the physiological medium. The creation of the lumens originates from several classes of morphogenetic events (1). In the case of closed lumens (such as acini, blastocytes, and canaliculi), ion secretion into the forming cavity creates an osmotic pressure. This results in the passive transport of water into the lumen (most often mediated by aquaporins), which constitutes a major driving component for lumen expansion. This osmotic pressure hypothesis was experimentally proposed in the 1960s (2–4). The expansion is mechanically restrained by periluminal tension. In the case of multicellular lumens [e.g., cysts (5–7)], tension results from the contraction of the cells surrounding the lumen. In the case of the intercellular domain, the tension arises from the cortical actin layer surrounding the cavity (8).
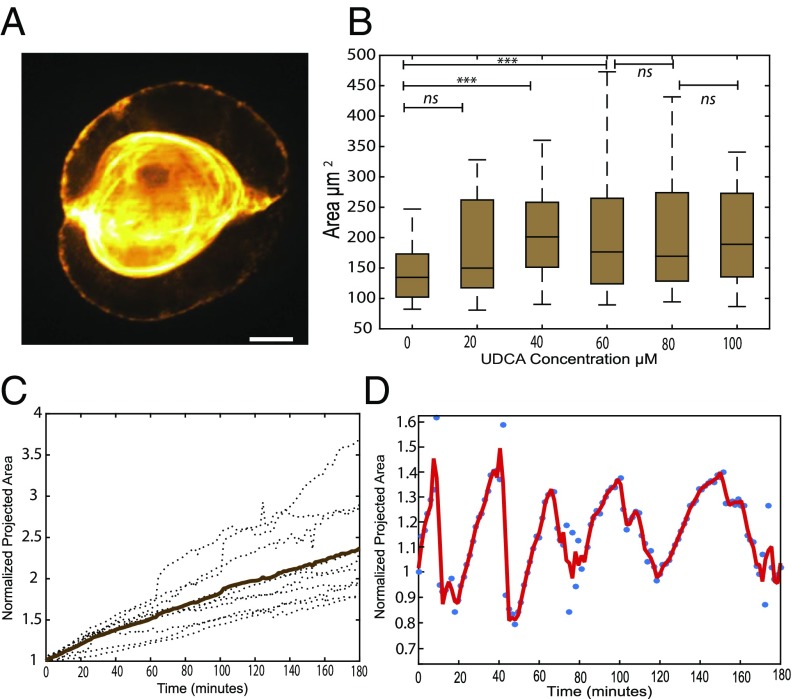
Fig. 1A illustrates a lumen separating adjacent membranes between two primary rat hepatocytes (liver cells). The contact area between both cells presents an intercellular cleft of around 30 to 50 (9) that accommodates transcellular proteins, adhesion proteins, and peptidoglycans. The development of the lumen occurs within 5 to 6 h. In vivo, closed lumens eventually merge into a network of tubules called canaliculi (2 m diameter and 500 m long). We recently showed that the shape of these lumens is controlled by the balance of osmotic pressure and anisotropic cortical tension (10). Hepatocyte doublets can be used as meaningful simplified surrogates to study lumen formation (8, 11, 12). In this instance, functional canaliculi grow as spherical caps spanning part of the intercellular space. The simple geometry of the system constitutes an appealing case for quantitative studies.
Fig. 1.
Lumen morphology and dynamics. (A) Structured illumination image of a typical bile canaliculi creating a lumen between two hepatocytes. (Scale bar, 2 m.) (B) Increase of a projected area of canaliculi at steady state upon continuous bile secretion stimulation by a different dose of UDCA (n = 20 for each dose). Student test: ***P < 0.0001; ns, nonsignificant. (C) Linear growth of the canaliculi (dotted line, individual cell; bold line, average) under reduced contractility condition (1 M blebbistatin). (D) Sustained oscillatory dynamics under native contractility conditions. Bile canaliculi in the projected area are normalized by their size at t = 0.
However, this process is rather generic for many kinds of lumen such as Ciona Notochord lumen (1, 13, 14) or kidney lumens (15). Fig. 1 B and C also shows that the steady shape of the lumen depends on the secretory activity, which is boosted by the addition of Ursodeoxycholic acid (UDCA). The growth of the lumen can either be monotonous (Fig. 1C) or pulsatile (Fig. 1D) depending on the periluminal tension and secretory activity. A steady secretion in a closed lumen implies the concomitant existence of leakage. Its nature is likely paracellular (through the nanometer cleft between cells). In the case of multicellular lumen, a few models and experimental studies have considered the role of leaks [originating either from the rupture of cell–cell contacts (7) or permeation across the endothelial layer (16)] during the growth of the lumen. For intercellular lumens, however, the morphogenetic consequences of the leak modulation by the paracellular cleft property have hardly been investigated, either experimentally or theoretically.
Here, we provide a theoretical quantitative study on the balance between secretory activity, leak, and mechanics that determines canaliculi nucleation and growth. Our minimalistic description of lumen expansion identifies the physiologically relevant range of parameters required to establish a stable intracellular cavity and dictate its dynamical properties.
Modeling Assumption
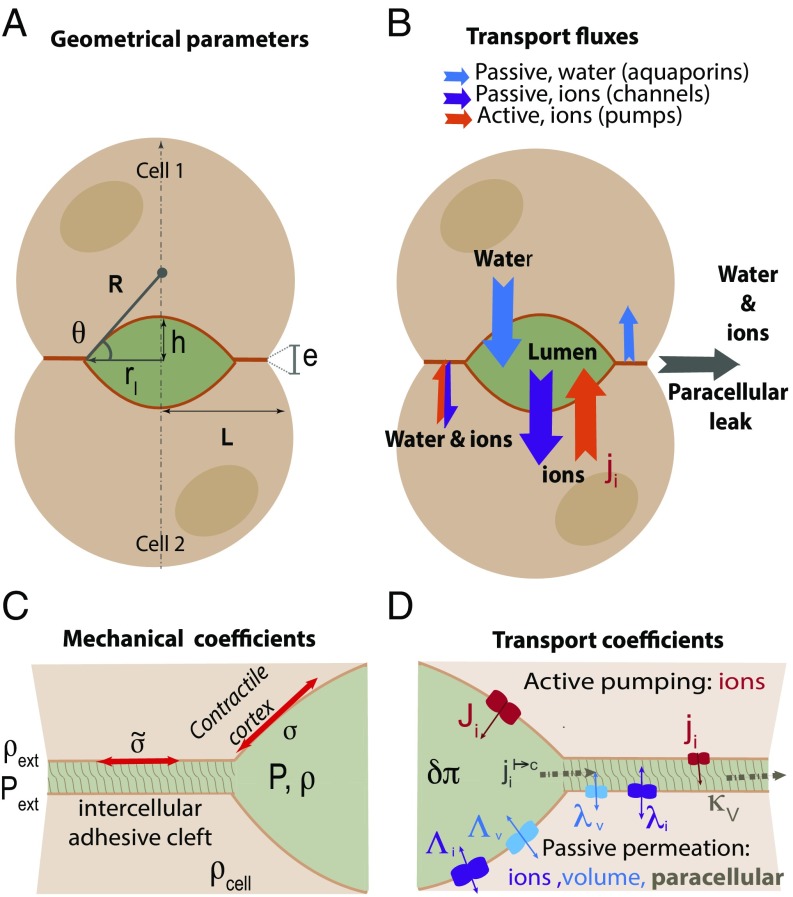
We consider the lumen as two symmetrical contractile spherical caps (Fig. 2) with a radius of curvature R and a contact angle at the lumen edge. The lumen elongates parallel to the cell–cell contact over a distance and its apex height is . The remaining paracellular adhesive cleft has a thickness e. As the lumen develops, the dimensions of the spherical caps vary, but the cell contact remains fixed with a total size L. We established the expressions of the conservation laws in the lumen and in the cleft accounting for this geometry. All results are in the scaled units of the model (see SI Appendix, Table S1) as well as in “international units” based on the estimations derived in SI Appendix, SI(2). We study the lumen growth dynamics resulting from the balance between (i) the active and passive ion transport across membranes both in the lumen and in the cleft, (ii) the passive transport of water along transmembrane osmotic and hydrostatic gradients, (iii) the paracellular leakage originating from osmotic gradients and hydrostatic gradients along the cleft, and (iv) the mechanical balance controlled by actomyosin contractility. For the sake of simplicity, we considered only one type of anion/cation pair with identical transport properties. These simplified assumptions lead us to consider only ion, water, and momentum conservations (i.e., force balance).
Fig. 2.
Schematic for lumen at the interface of two adjacent cells. (A) Definition of the geometrical parameters of the problem. (B) Definition of the active and passive fluxes of ion and water fluxes across and along the paracellular cleft. (C) Definition of the mechanical parameters of the problem. Close-up on the intercellular cleft region containing adhesive molecules, peptidoglycans, and other transmembrane proteins. (D) Definitions of the transport parameters.
Mechanical Balance.
In the lumen the hydrostatic pressure is uniform at the time scales considered here. Laplace’s law must be satisfied everywhere across the lumen surface. The force balance in the lumen then reads:
| [1] |
where is the cortical tension resulting from the sum of the plasma membrane tension and the active tension of the actin cortex. In general, the effective tension could be inhomogeneous and anisotropic (17). For example, in the late stages of Ciona Notochord lumen growth or during the tubulation of canaliculi, the departure from a hemispherical shape results in inhomogeneous curvature radii, which is indicative of heterogeneous tension distributions (1, 13, 14). However, here we only consider a homogeneous cortical tension, consistent with the assumption that the lumen shape is a spherical cap.
In the cleft, Laplace’s law must be modified to account for membrane adhesion [mediated by Cadherin, for example (18)]:
| [2] |
where is the cleft thickness in the absence of a difference in hydrostatic pressure. This is mainly controlled by the cadherin surface density as well as the repulsive interaction between the membranes. The parameter is an effective elastic modulus that accounts for any deviation of the cleft from , accounting for tension in the cadherins and deformation of the membranes. In SI Appendix, SI(2), we estimate that a few tens of a nanometer away from the interfacial region, between the lumen and the cleft, Eq. 2 results in a homogeneous cleft thickness that hardly deviates from . In the rest of the paper, Eq. 2 will be replaced by a homogeneous cleft thickness . In the first-order approximation, .
The force balance at the intersection of the lumen with the cleft is the generalized Young–Dupré equation:
| [3] |
where is the contact angle (see Fig. 2), is the adhesion energy per unit area, and corresponds to the “apparent tension” corrected for the adhesion energy. The force balance is thus given by the set of Eqs. 1 and 3.
Ion Conservation.
In the lumen, ion transport occurs by transmembrane fluxes as well as by leakage at the lumen edges.
The number of ions flowing through the membrane per unit of time and unit of area has two distinct origins. First, an “active” flux per unit area is generated by pumps and transporters. We assume that the flux has a constant value due to a constant surface density of the relevant pumps.
Ions are also passively transported across transmembrane channels. In this case, the flux is proportional to the chemical potential difference. It reads , where are the ion density in the cell cytoplasm and in the lumen, respectively. The transport coefficient is set by the surface density of the relevant channels. By convention, all fluxes are positive when ions are secreted into the lumen.
The conservation of the total number of ions, N, in the lumen then reads
| [4] |
The edge term corresponds to the ion flux from the lumen into the cleft. It is determined self-consistently by continuity conditions with the expression of the ion flux inside the cleft.
In the cleft, the ion density equilibrates within less than a few microseconds across the cleft thickness e (on the order of a few tens of nanometers). Hence, only the ion flux component along the cleft should be considered. The difference in ion concentration in the lumen, compared with the external medium, generates a diffusive flux along the ion concentration gradient. D is the diffusion coefficient of ions. We neglect all convective contributions to the flux based on the small dimensions of the cleft. Under these assumptions and after integration over the constant thickness , the local- and time-dependent conservation of ions inside the cleft reads
| [5] |
where is the passive transport coefficient for ions through the membrane into the cleft. is the active pumping of ions. The factor of 2 in the source term accounts for the presence of membranes from both cells. In SI Appendix, SI(2), we show that that the term is negligible on the time scale of lumen growth and will further be neglected. in Eq. 4 is the solution of Eq. 5 at .
Volume Conservation.
In view of the absence of an active biological transport of water, the change in volume results solely from passive fluxes. Due to water incompressibility, the rate of volume change is proportional to the flux of water. The passive contribution from transmembrane water permeation is proportional to the water chemical potential difference and reads . (respectively, ) is the difference in hydrostatic (respectively, osmotic) pressure between the lumen and the cytosol. The surface density of aquaporins determines the transport coefficient . The osmotic pressure difference is related to the ion density difference by . The factor 2 in this expression reflects the equivalent treatment of anions and cations. The conservation of volume in the lumen then reads
| [6] |
The volume leak from the lumen into the cleft is determined by continuity of the expression of the volume flux in the cleft at the lumen/cleft interface.
In the cleft, the rapid equilibration of the hydrostatic pressure across the cleft justifies the lubrication approximation to estimate the hydrodynamic contribution of volume change by . Note that due to protein crowding at the paracellular cleft, is necessarily smaller than the Poiseuille limit , where is the viscosity of the intercellular fluid. The local volume conservation in the cleft then reads
| [7] |
The permeation coefficient can, in principle, differ in the cleft compared to its value in the lumen. For the sake of simplicity, we use the same value. From here on and for similar reasons as for ion flux, the time derivative of the thickness can be neglected based on the time scale we consider for lumen expansion [see SI Appendix, SI(2)].
Strategy to Solve the Equations.
The complete set of equations that we solve is provided in SI Appendix, SI(4). To solve the equations, we assume that the parameters of the cytosol and of the external media are constant and homogeneous. We also assume that the variation in ion concentration is small compared with the concentrations themselves.
Separating the time scales between lumen dynamics (minutes to hours) and the equilibrium of fluxes in the cleft (subseconds) simplifies the problem. Cleft Eqs. 3, 5, and 7 are solved in the quasistatic regime. The ion density in the cleft readily stems from Eq. 5. We then use it as a source term in Eq. 7. The solution of Eq. 7 leads to the value of , which in turn can be used in Eqs. 4 and 6. We thus reduce the problem to three coupled equations that we formally solve using Mathematica. SI Appendix, Table S1 summarizes the various parameters of the problem, and we give their ranges in adimensional and real values in SI Appendix, SI(1).
Existence of Steady States
At steady state, the dynamical equations above simplify as follows: We name , , and the lumen dimensions at steady state.
Steady State Mechanical Balance.
The Young–Dupré relation takes the simple form
| [8] |
In this expression, is the steady state tension, and is thus a constant determined by the tension and adhesion energy at steady state. We take it equal to following experimental observations (10).
Steady State Ion Conservation.
Assuming azimuthal symmetry, the ion conservation in the cleft (Eq. 5) can be linearized at the first order in the polar coordinates as
| [9] |
with the continuity equations at the cleft edges being
acts as a source term and compares pumping activity to passive ion transport. It corresponds to the ion concentration, which would be observed in the cleft if there was a simple balance between pumps and channels. It characterizes the “pumping efficiency.” Note that since is a constant, Eq. 9 admits a simple although cumbersome solution in terms of modified Bessel functions, which we give in SI Appendix, SI(3).
is the typical length over which the ion concentration is screened from the edge effects to reach the constant value set by . When (i.e., long cleft and small lumen), the leaks at both edges of the cleft are decoupled from the central part of the cleft, the ion density of which only depends on . Additionally, if , then the ion flux corresponds to an ion source for the lumen. When the lumen is large (i.e., ), the leaks at both edges of the cleft couple to the lumen to create a paracellular concentration gradient. If , the ion flux corresponds to a sink for the lumen, which takes the simple expression in the limit :
| [10] |
In the lumen, the ion conservation (Eq. 4) then simplifies as
| [11] |
where takes the expression derived in SI Appendix, SI(3). For the sake of simplicity, we assume here that the pump activity in the cleft equals that of the lumen.
Steady State Volume Conservation.
In the cleft, Eq. 7 can be simplified in a similar way and writes
| [12] |
with the continuity of the hydrostatic pressure at both edges imposing
The solution is also tractable analytically [see SI Appendix, SI(3)]. is the source term from osmotic origin. is another screening length, comparing the efficiency of the hydrodynamic leak to aquaporin transport. When , the lumen and the external medium are decoupled. In particular, when , then the hydrostatic pressure in the cleft away from the edges is entirely imposed by the pumps and equals .
Whenever the cleft length is longer than both screening lengths, it acts as a volume source for the lumen. In the opposite case (i.e., ), provided that , the cleft contributes to a volume leak out of the lumen that simplifies to
| [13] |
when .
In the lumen, Eq. 6 simplifies as
| [14] |
The right-hand term is derived from Eq. 12 [see SI Appendix, SI(3)] and taking its value for .
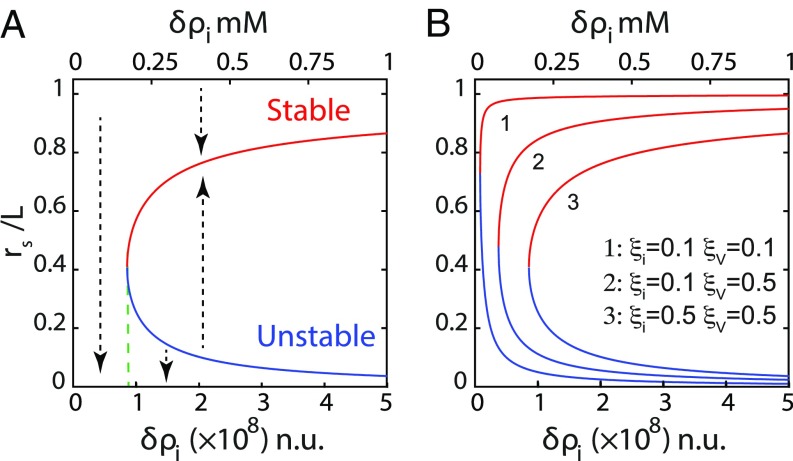
This rescaling of the equations reveals that the relevant parameters controlling the lumen are , , , and . They compare the strength of the various fluxes. They arise from a combination of the more natural parameters , ,, , , , and , introduced in the first sections to characterize the fluxes themselves. For all parameter values, the solutions for the steady state lumen radius are qualitatively similar to the one described in Fig. 3. For a given leak (characterized by the values of and ), there exists a critical value of the ion pumping activity (characterized by ), below which no lumen can exist.
Fig. 3.
Lumens at steady state. (A) The steady state size of the lumen as a function of pumping efficiency displays an unstable and a stable branch represented in blue and red, respectively (). The dashed arrows represent the direction of variation of lumen radius for any deviation from its steady state value. There is no stable state lumen at low enough pumping efficiency . Any lumen of any size would shrink off. Above a critical , any small lumen above the unstable branch will grow to finally reach a larger steady lumen size. (B) Variation of the steady lumen size as a function of lumen efficiency for different screening lengths and .
Low enough pumping activity cannot compensate the leaks. Independently of its original volume, the lumen shrinks and disappears. When the pump activity is higher, the solution displays two branches. The lower branch is unstable and theoretically corresponds to the creation of a lumen through the nucleation of a small-sized cavity inside the cleft. The instability of this solution can be checked directly on dynamical equations, but it can also be understood with the following argument.
Steady state lumens described by lower branches are small . A small increase in lumen size leads to a rise in the incoming fluxes, which is due to an increase in lumen surface. However, in this limit, the paracellular fluxes are hardly affected by the change in size due to the screening of the leak. Moreover, the osmotic pressure increases, whereas the Laplace term decreases due to tension. Here, the chemical potential balance fails, which leads to further growth. All contributions lead to further volume increase. Although predicted by the model, this solution is likely to be obscured in reality by the more complex biological and molecular organization needed to start lumen formation.
The upper branches correspond to stable solutions for larger lumens . If the lumen grows, the incoming fluxes also grow. However, Eqs. 10 and 13 show that in this limit, the paracellular fluxes diverge as the lumen size approaches the size of the junction. This nonlinear dependence of the paracellular leak in this limit enables the stability of the state. The sensitivity to the edge distance is thus governed by the screening lengths and . Fig. 3B shows that small screening lengths (curve 1) result in stable lumens spanning practically the whole cell–cell contact for all pumping activities. Conversely, large screening lengths (curve 3) confine lumens to smaller sizes above a critical pumping activity. One could thus speculate that the ability of lumens from adjacent cell pairs to merge is determined by their ability to reach the cell edges and is hence controlled by the leak properties of the paracellular cleft.
Lumen Dynamics
The balance between different fluxes not only determines the steady states of the lumen but also affects lumen dynamics. Fig. 1 C and D shows that lumen growth can be either monotonous or pulsatile, depending on pumping efficiency. Our model suggests that changing the balance between leaks and ion secretion can induce a transition between both behaviors. The periodicity of the experimental pulsations is of the order of tens of minutes. Consequently, we assume a quasistatic mechanical equilibrium in the cleft. We solve Eqs. 4 and 2 as described in SI Appendix, SI(5). The time-dependent variables of the problem are the radius of curvature , the contact angle , and the difference of ion concentration in the lumen with respect to the cytosol . The lumen shape and volumes can be deduced by simple geometric relations. The cortical tension must account for the lumen expansion. In situations where the change per unit time of relative cortex area becomes “large,” then one must account for a viscous term as a dominant contribution to the periluminal stress. This results in an areal strain rate-dependent effective tension. A characteristic time delineates these two behaviors. In an active gel description of the cortex, the effective tension can be written as follows (19):
| [15] |
where the quantity is a measure of the deformation rate, which we take to be equal to the relative time variation of the lumen area. The static value of the tension is set by imposing a value of to . All other coefficients are assumed constant. The dynamical equations are expressed in SI Appendix, SI(4).
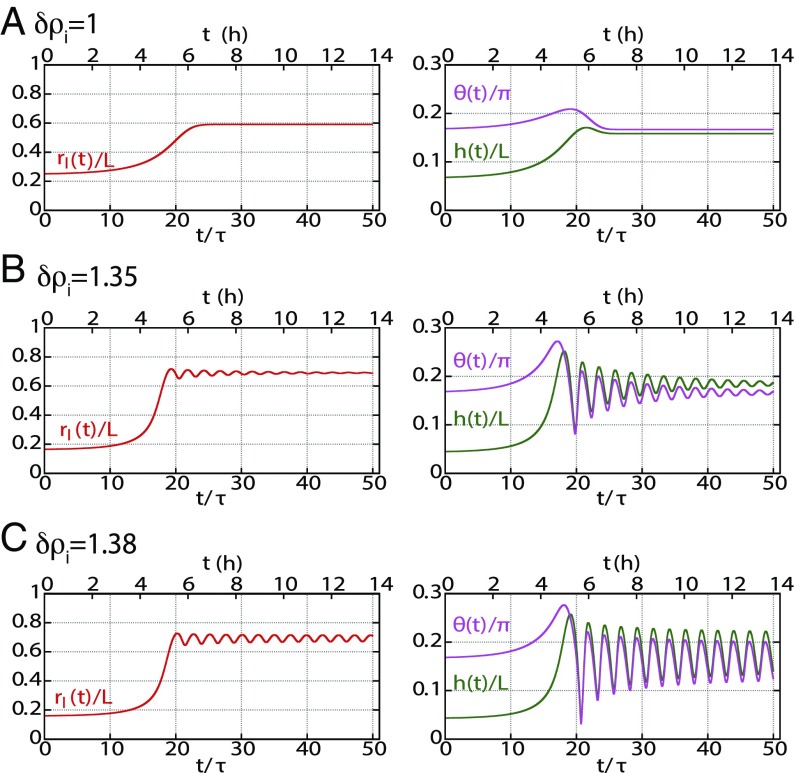
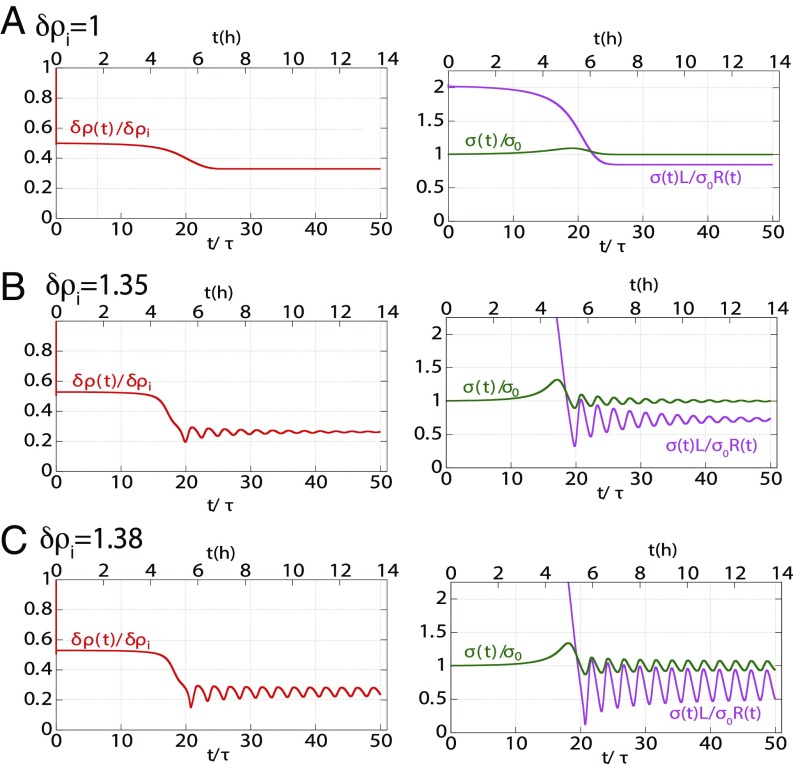
To exemplify the type of behavior predicted by the model, we fixed the screening length to and , and we solved the dynamical equation at different values of the pumping efficiency . We set the initial conditions for the lumen height , , , and just above the unstable branch of the lumen steady state. In our model, this would correspond to a lumen growing from its nucleation size. However, the final behavior of the dynamics does not depend on initial conditions. Fig. 4 shows that at lower pumping efficiency, the steady state of the lumen in reached monotonically with a mild overshoot in the contact angle and lumen height. At larger pumping efficiency, the steady state is reached after damped oscillations. At large pumping efficiency, the oscillations are sustained. An animation of lumen dynamics in each scenario can be found in Movies S1–S3. The existence of the oscillations originates from the nonlinearity of the equations, in particular from the divergence of the leak close to the contact edge. However, we could not trace one specific parameter alone that was primarily responsible for setting the behavior. In SI Appendix, SI(3), we derive an analytical solution in the transition regime in the limit for large enough lumens ( and ) and for small deviations from steady state values of the variables. In the simplified equations, terms analogous to inertia, friction, and force could be introduced [respectively, a, b, and c in SI Appendix, SI(3)]; their expressions intricately involve all model parameters. However, the crossover limits between the different dynamic behaviors is set by the parameter , which reflects the dependence of cortical tension on strain rate. Using a constant tension, our numerical solutions do not show any oscillatory behavior within the physiological range of the parameters we explored.
Fig. 4.
Dynamical behavior of lumen growth. Dynamical behavior of the normalized lumen height , junctional extension , and angle are shown as a function of normalized time (lower abscissa) and time in hours (upper abscissa), where is the cortex time (assumed 1,000 s). Changing pump efficiency shows three different characteristic behaviors: (A) Overdamped evolution toward steady state at , (B) underdamped evolution toward steady state at , and (C) sustained oscillations The numerics have been obtained for values of , , , , , , and
We then calculated the time variation of the lumen concentration (Fig. 5). In all cases, the concentration of the lumen decreases as the lumen grows. It oscillates in phase opposition with the lumen radius in the oscillatory regime. Note, however, that the total amount of ions increases with the lumen size. The cortical tension varies during the formation of the lumen, increases during the growth phase, and equals for the steady states. It oscillates in phase with the lumen radius in the oscillatory case. The inner hydrostatic pressure of the lumen calculated from Laplace’s law decreases as the lumen grows and oscillates in phase opposition with the lumen radius in the oscillatory regime. Our model thus predicts that as the lumen grows the effective periluminal tension grows due to an induced viscous stress. It is qualitatively different from a mechanosensitive feedback that would lead to an active reinforcement of the cortex. Additionally, as the lumen grows, the inner pressure decreases. This is the opposite of the “Starling’s law”-like interpretation of a lumen growing under an increasing inner pressure, leading to a final contraction that expels the inner fluid. Whereas this later scenario is possible in fully sealed lumen, our model demonstrates that the same dynamical behavior can also be recapitulated in leaking lumens.
Fig. 5.
Dynamical behavior of mechanoosmotic parameters. Dynamical behavior of the normalized lumen ion-density , lumen tension , and hydrostatic pressure for different pump efficiency are shown as a function of time (lower abscissa) and time in hours (upper abscissa), where is the cortex time (assumed 1,000 s). Changing pump activity shows three different characteristic behaviors: (A) monotonous overdamped evolution toward steady state at , (B) underdamped evolution toward steady state at , and (C) sustained oscillations All parameters used for obtaining the numerics are the same as those mentioned in Fig. 4.
Discussion
The situation of a cavity with constant ion secretion and a fixed cortical tension is intrinsically unstable. A steady state can only be achieved upon three nonexclusive conditions: size- or time-dependent cortical tension, size- or time-dependent ion secretion, and/or leaks. The two first conditions are likely to involve specific biological feedback. The incidence of leaks is far less intuitive to understand. The model we propose quantitatively explores the effect of paracellular leakage in the case of intercellular lumen formation. We account for the specific dependence of the leak on the dimensions of the paracellular cleft, and we show that, in the case of bicellular lumens, the leak can play a critical role in controlling lumen size, dynamics, and composition. The model provides a good qualitative agreement with the experimental phenotypes of canaliculi.
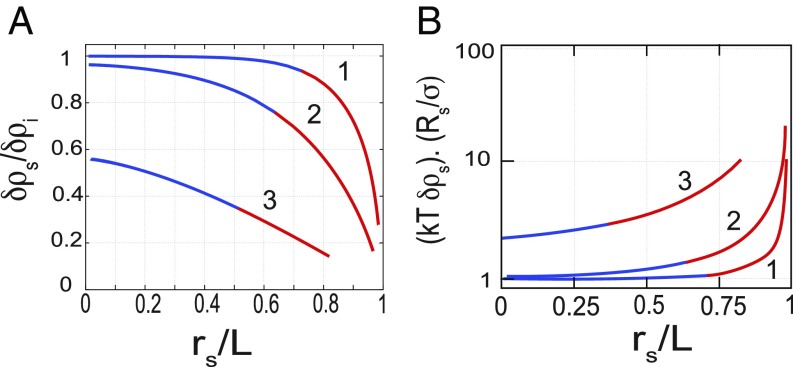
An important prediction of the model is the existence of screening lengths . The screening lengths compare longitudinal fluxes along the cleft that are mediated by osmotic potential differences and hydrostatic pressure to the transmembrane fluxes that occur orthogonal to the cleft and are mediated by channels. When transmembrane transport outweighs paracellular transport, the screening lengths are small. Curve 1 on Fig. 3 shows that in this case the lumen can grow close to the edges . In contrast, in the case of a large screening length (curve 3), the lumen hardly reaches the cell edge independently of pump activity. The lumen composition (i.e., its ion concentration) is also affected by the screening length values. Fig. 6A shows that when the distance of the lumen to the cell edge is larger than the screening length, the luminal ion concentration is of the same order as , the equilibrium value for a close lumen. As the lumen grows toward the contact edges, paracellular leaks increase, leading to a decrease in ion density and, hence, of the osmotic pressure as well as hydrostatic pressure. However, Fig. 6B shows that the osmotic pressure decreases considerably less than the hydrostatic pressure. This results in lumens with a much higher ion concentration than what is needed to balance Laplace pressure, should the lumen be closed. Our simplifying assumptions minimize the specific biological details that have yet to be accounted for to perform a quantitative comparison with experimental data. In particular, tight junctions act as diffusive barriers for different classes of ions across claudin pores (20, 21). For the sake of simplicity, we account for their activity as a steady factor included in the hydrodynamic resistance of the paracellular cleft. As the tight junctions mature, their contribution to the paracellular leak might become dominant over the simple evaluation, which is based on a hydrodynamic process. In particular, ion flux selectivity, which enhanced junction stability and mechanosensitivity of tight junctions, may then play a role in the homeostasis of lumens.
Fig. 6.
Relative enrichment of ions mediated by the leaks. (A) Comparison of steady state ion density in the lumens of various sizes with the expected concentration (). for all curves. For curve 1, ; curve 2, ; and curve 3, . (B) Comparison of the lumen osmotic pressure to the Laplace pressure as a function of lumen size for different screening lengths.
We also show that a time-dependent cortical tension is necessary to create an oscillatory behavior. In our model, the origin of cortical tension reinforcement stems from cortex dynamics. As previously mentioned, mechanosensitive mechanisms might reinforce cortex contractility by increasing the actomyosin activity in a stress-dependent manner. However, as shown in Fig. 5, the hydrostatic pressure decreases as the lumen grows, and it is not clear where the mechanosensing reinforcement of the cortex would come from within the frame of this model. Although lipid trafficking by endo- and exocytosis (1) is important for lumen growth, our model indirectly accounts for it as a nonlimiting factor of the lumen expansion. Assuming a nonlimiting rate supply of lipids by vesicular transport, their contribution to cortical tension and thus lumen morphology is negligible. We also do not account for vesicular export of bile in cholestasis cases corresponding to a liver-specific problem that would reduce the generality of our description. We indeed propose that the leak-dependent growth of lumens can be extended to understand, at the tissue scale, the direction of growth of the cavities. In the case described here, the lumen edge can only asymptotically reach the contact edge due to the divergence of the paracellular leak when approaches . Consider now a single lumen with equal pumping efficiency but embedded in a group of cells rather than a cell doublet. One can qualitatively assume that the resistance to paracellular flux will depend on the total length of paracellular cleft between the lumen edge and the external medium. would then be much larger than the actual size of a single cell–cell contact. In such a case, our model would predict that the lumen radius can extend further than a single cell length and consequently could bridge with other adjacent lumens. Maintaining the same assumptions, the problem of lumen now depends on the structure of the tissue. The work presented here sets the foundation for future studies encompassing the effect of multicellular cell–cell junctions.
Supplementary Material
Footnotes
The authors declare no conflict of interest.
This article is a PNAS Direct Submission.
This article contains supporting information online at www.pnas.org/lookup/suppl/doi:10.1073/pnas.1722154115/-/DCSupplemental.
References
- 1.Sigurbjörnsdóttir S, Mathew R, Leptin M. Molecular mechanisms of de novo lumen formation. Nat Rev Mol Cell Biol. 2014;15:665–676. doi: 10.1038/nrm3871. [DOI] [PubMed] [Google Scholar]
- 2.Sperber I. Secretion of organic anions in the formation of urine and bile. Pharmacol Rev. 1959;11:109–134. [PubMed] [Google Scholar]
- 3.Boyer JL. Bile formation and secretion. Compr Physiol. 2013;3:1035–1078. doi: 10.1002/cphy.c120027. [DOI] [PMC free article] [PubMed] [Google Scholar]
- 4.Bryant DM, Mostov KE. From cells to organs: Building polarized tissue. Nat Rev Mol Cell Biol. 2008;9:887–901. doi: 10.1038/nrm2523. [DOI] [PMC free article] [PubMed] [Google Scholar]
- 5.Andrew DJ, Ewald AJ. Morphogenesis of epithelial tubes: Insights into tube formation, elongation, and elaboration. Dev Biol. 2010;341:34–55. doi: 10.1016/j.ydbio.2009.09.024. [DOI] [PMC free article] [PubMed] [Google Scholar]
- 6.Roignot J, Peng X, Mostov K. Polarity in mammalian epithelial morphogenesis. Cold Spring Harb Perspect Biol. 2013;5:a013789. doi: 10.1101/cshperspect.a013789. [DOI] [PMC free article] [PubMed] [Google Scholar]
- 7.Ruiz-Herrero T, Alessandri K, Gurchenkov BV, Nassoy P, Mahadevan L. Organ size control via hydraulically gated oscillations. Development. 2017;144:4422–4427. doi: 10.1242/dev.153056. [DOI] [PubMed] [Google Scholar]
- 8.Gupta K, et al. Actomyosin contractility drives bile regurgitation as an early response during obstructive cholestasis. J Hepatol. 2017;66:1231–1240. doi: 10.1016/j.jhep.2017.01.026. [DOI] [PubMed] [Google Scholar]
- 9.Lipowsky R, Sackmann E. Handbook of Biological Physics, Structure and Dynamics of Membranes. Vol. 1 Elsevier; Amsterdam: 1995. [Google Scholar]
- 10.Li Q, et al. Extracellular matrix scaffolding guides lumen elongation by inducing anisotropic intercellular mechanical tension. Nat Cell Biol. 2016;18:311–318. doi: 10.1038/ncb3310. [DOI] [PubMed] [Google Scholar]
- 11.Watanabe S, et al. Bile canalicular contraction in the isolated hepatocyte doublet is related to an increase in cytosolic free calcium ion concentration. Liver Int. 1988;8:178–183. doi: 10.1111/j.1600-0676.1988.tb00988.x. [DOI] [PubMed] [Google Scholar]
- 12.Clair C, et al. Investigation of the roles of ca2+ and insp3 diffusion in the coordination of ca2+ signals between connected hepatocytes. J Cell Sci. 2001;114:1999–2007. doi: 10.1242/jcs.114.11.1999. [DOI] [PubMed] [Google Scholar]
- 13.Dong B, et al. Tube formation by complex cellular processes in Ciona intestinalis notochord. Dev. Biol. 2009;330:237–249. doi: 10.1016/j.ydbio.2009.03.015. [DOI] [PMC free article] [PubMed] [Google Scholar]
- 14.Dong B, Hannezo E, Hayashi S. Balance between apical membrane growth and luminal matrix resistance determines epithelial tubule shape. Cell Rep. 2014;7:941–950. doi: 10.1016/j.celrep.2014.03.066. [DOI] [PubMed] [Google Scholar]
- 15.Schlüter MA, Margolis B. Apical lumen formation in renal epithelia. J Am Soc Nephrol. 2009;20:1444–1452. doi: 10.1681/ASN.2008090949. [DOI] [PubMed] [Google Scholar]
- 16.Fütterer C, Colombo C, Jülicher F, Ott A. Morphogenetic oscillations during symmetry breaking of regenerating hydra vulgaris cells. Europhys Lett. 2003;64:137–143. [Google Scholar]
- 17.Turlier H, Audoly B, Prost J, Joanny JF. Furrow constriction in animal cell cytokinesis. Biophysical J. 2014;106:114–123. doi: 10.1016/j.bpj.2013.11.014. [DOI] [PMC free article] [PubMed] [Google Scholar]
- 18.Sackmann E, Smith AS. Physics of cell adhesion: Some lessons from cell-mimetic systems. Soft Matter. 2014;10:1644–1659. doi: 10.1039/c3sm51910d. [DOI] [PMC free article] [PubMed] [Google Scholar]
- 19.Kruse K, Joanny JF, Julicher F, Prost J, Sekimoto K. Generic theory of active polar gels: A paradigm for cytoskeletal dynamics. Eur Phys J E Soft Matter. 2005;16:5–16. doi: 10.1140/epje/e2005-00002-5. [DOI] [PubMed] [Google Scholar]
- 20.Adamson RH, et al. Oncotic pressures opposing filtration across non-fenestrated rat microvessels. J Physiol. 2004;557:889–907. doi: 10.1113/jphysiol.2003.058255. [DOI] [PMC free article] [PubMed] [Google Scholar]
- 21.Cattaneo I, et al. Shear stress reverses dome formation in confluent renal tubular cells. Cell Physiol Biochem. 2011;28:673–682. doi: 10.1159/000335813. [DOI] [PubMed] [Google Scholar]
Associated Data
This section collects any data citations, data availability statements, or supplementary materials included in this article.


