

Abstract
Non-coding genetic variation is a major driver of phenotypic diversity and allows investigation of mechanisms that control gene expression. Here, we systematically investigated the effects of >50 million variations from five strains of mice on mRNA, nascent transcription, transcription start sites and transcription factor binding in resting and activated macrophages. We observed substantial differences associated with distinct molecular pathways. Evaluation of genetic variation provided evidence for roles of ~100 TFs in shaping lineage-determining factor binding. Unexpectedly, a substantial fraction of strain-specific factor binding could not be explained by local mutations. Integration of genomic features with chromatin interaction data provided evidence for hundreds of connected cis-regulatory domains associated with differences in transcription factor binding and gene expression. This system and the >250 data sets establish a substantial new resource for investigation of how genetic variation affects cellular phenotypes.
eTOC Blurb
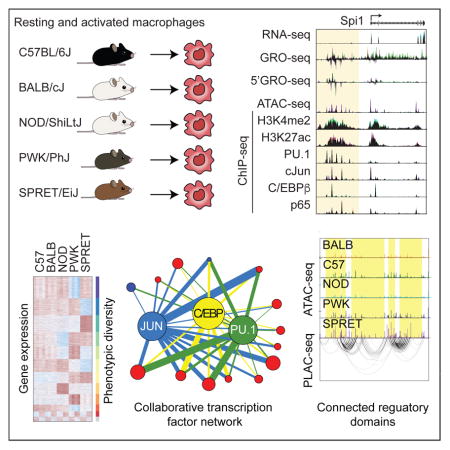
Analyses of genetic variation in macrophages from inbred mouse strains reveal how a complex network of transcription factors influence cis-regulatory elements to impact differentiation and responses to environmental change
Introduction
Mammalian organisms are composed of several hundred cell types that share a common genome. The development and function of each cell thus requires appropriate selection of promoter and enhancer elements that regulate their specific programs of gene expression (Heinz et al., 2015; Levine, 2010; Shlyueva et al., 2014). Genome-wide assessment of chromatin features specific to enhancers and promoters across mammalian cell types and tissues revealed hundreds of thousands of enhancer-like regions, with any particular cell type exhibiting on the order of 20,000–30,000 per cell type (Andersson et al., 2014; Roadmap Epigenomics et al., 2015). The general question of how each cell type selects its particular repertoire of transcriptional regulatory elements is therefore central to understanding its development and functions.
Investigation of mechanisms underlying the selection of cell-specific enhancers indicate key roles of pioneering factors that have the potential to recognize their binding motifs in the context of closed chromatin (Soufi et al., 2015) and can therefore function as lineage determining transcription factors (LDTFs) (Heinz et al., 2015; Iwafuchi-Doi and Zaret, 2014). However, such factors only bind to a small fraction of their corresponding recognition motifs that are present within the genome, and the same pioneering factor can bind to different genomic regions in different cell types (Heinz et al., 2010; Jin et al., 2011; Roadmap Epigenomics et al., 2015). Therefore, additional mechanisms are required to specify their DNA binding patterns in each cell type.
Studies in macrophages provided evidence for a collaborative/hierarchical model for enhancer selection driven by macrophage-restricted combinations of LDTFs that include PU.1 and C/EBPα/β (Heinz et al., 2010). In these studies, the pioneering functions of PU.1 and C/EBPs were suggested to be dependent on collaborative interactions at genomic sites containing closely spaced (i.e. < ~150 bp) binding motifs for each factor. Collaborative binding of PU.1 and C/EBPs was supported by studies investigating effects of genetic variation in macrophages derived from C57BL/6J and BALB/cJ mice, in which hundreds of strain-specific binding sites were observed (Heinz et al., 2013). Strain-specific mutations in the recognition motif for PU.1 resulting in loss of PU.1 binding also resulted in loss of nearby C/EBPβ binding, despite intact C/EBP recognition motifs, and vice versa. While these studies provided support for a collaborative model of enhancer selection, they also indicated that the majority of strain-specific binding of PU.1, C/EBP and P65 could not be explained by mutations in binding motifs (Heinz et al., 2013). This discrepancy raised new questions regarding the determinants of the pioneering functions of these factors and the extent to which their binding is influenced by nearby versus distant genomic elements.
Here we exploit genetic variation across five diverse inbred strains of mice to query mechanisms underlying transcription factor (TF) binding and function. To eliminate confounding effects of strain-specific differences in tissue environments that are known to influence macrophage phenotypes in vivo (Gosselin et al., 2014; Lavin et al., 2014), we performed studies in bone marrow derived macrophages (BMDMs), in which each strain-specific population of macrophages was established using an identical M-CSF-dependent differentiation protocol. To assess the impact of genetic variation on signal-dependent TF (SDTF) binding and function, BMDMs were activated with Kdo2 lipid A (KLA), a highly specific TLR4 agonist (Raetz et al., 2006). This system has several experimental strengths. BMDMs are derived from readily available inbred strains of mice in which all loci are homozygous and whole genome sequences are available (Keane et al., 2011). The five strains selected provide genetic variation ranging between ~4.5 million SNPs + InDels, similar to differences between any two individuals, to ~50 million SNPs + InDels, on the order of all such common variants in the human population (Genomes Project et al., 2015). The selected strains of mice have been extensively phenotyped and exhibit marked phenotypic diversity (Bogue et al., 2017; Lusis et al., 2016). Sufficient cells can be obtained for a broad range of genomic, proteomic, lipidomic and functional assays and can be readily derived from crosses between strains and genetically modified mice. Using this experimental system, we systematically evaluate the effects of SNPs and InDels on gene expression, nascent transcription, open chromatin, TF binding and histone modifications associated with primed and/or active regulatory elements in resting and activated primary macrophages (Figure 1A), generating >250 genome-wide data sets. In parallel, we develop a general computational pipeline for assessing the significance of motif mutations on TF binding.
Figure 1. Variation in mRNA expression scales with extent of genetic variation.

A. Overview of experimental design and main data sets. B. Comparison of RNA-seq for polyA transcripts in BMDMs derived from the indicated mouse strains under notx. Log2(TPM+1) values are plotted for BALB, NOD, PWK and SPRET vs. C57 (TPM = transcripts per kilobase million). Transcripts exhibiting >2- or >4-fold changes (FDR < 0.01) are light blue and dark blue, respectively. C. WGCNA clustering of differentially expressed genes. Top functional annotations for each cluster are illustrated on the right. (See Figure S1 for modules). D. Ratio-ratio plots of the fold response to KLA in C57 vs. BALB or SPRET BMDMs. Blue dots show genes that are 4-fold reciprocal regulated. Green dots show a 4-fold stronger response to the KLA stimulus in one strain over the other. E. Relationship of differentially expressed genes to number of genetic variation. F. Expression comparison of 46 primary interferon stimulated genes in C57 and SPRET BMDMs under notx and 6h KLA conditions. Right column represents the SPRET/C57 gene expression ratio following KLA treatment.
Given the diverse roles of macrophages in immunity, tissue homeostasis and disease (Wynn et al., 2013), the experimental system, accompanying data and analytical pipeline provide a significant new resource for investigation of the transcriptional mechanisms underlying macrophage gene expression and their context-specific functions. We observe striking effects of genetic variation on nascent and mature RNA expression that predict distinct macrophage. Differences in gene expression are associated with order of magnitude greater differences in TF binding. Leveraging these differences, we provide evidence supporting the hypothesis that the genomic binding patterns of macrophage LDTFs are influenced by a large fraction of other TFs expressed in these cells. Although most variation in nascent transcription and TF binding is consistent with cis-regulation, thousands of strain-specific differences in TF binding and chromatin features cannot be explained by local mutations. Integration of strain-specific genomic features indicate that they frequently reside in highly interconnected clusters that are associated with strain-specific gene expression, suggesting a domain-wide regulatory environment that influences TF binding and function.
Results
Macrophages from genetically diverse mice exhibit striking difference in gene expression
To investigate the impact of a broad range of genetic variation on mature RNA transcripts, we performed RNA sequencing of polyadenylated (polyA) transcripts in BMDMs derived from female C57BL/6J (C57), BALB/cJ (BALB), NOD/ShiLtJ (NOD), PWK/PhJ (PWK) and SPRET/EiJ (SPRET) mice (Figure S1A) under basal conditions (notx) and following stimulation with Kdo2- lipid A (KLA) for 1 hour. A minimum of two biological replicates was performed for each mouse strain and condition, with replicates being highly correlated (Figure S1B, S1C). Pairwise comparisons of BALB, NOD, PWK and SPRET BMDMs to C57 BMDMs indicate a progressive increase in differential gene expression in resting cells (Figure 1B). Divergent gene expression ranged from 112 RNA transcripts in the BALB x C57 comparison to 1,438 RNA transcripts in the SPRET x C57 (4-fold cutoff, FDR of 0.01) (Table S1). Shared and private differently regulated genes are shown in Figure 1C. These data show that BMDMs, despite being maintained in identical environments, exhibit remarkably diverse gene expression. For example, ~10% of the expressed transcripts vary at least 4-fold without KLA perturbation. Upon KLA treatment, 129 genes were regulated in any strain by >4-fold (Table S1). Although differences in the expression response to KLA at 1h across strains increased with genetic variation, there was strong conservation in the direction of the response between strain BMDMs (Figure 1C, D). Transcriptional variation as a function of SNPs + InDels for all ten pairwise comparisons is indicated in Figure 1E. Notably, differential gene expression exhibits a sharp rise for pairwise comparisons between C57, BALB and NOD and comparisons of these strains with PWK. Addition of SPRET results in a further but non-linear increase in divergent gene expression.
Clustering of RNA-seq data segregates samples by strain, with KLA treatment as a secondary determinant (Figure S1C). WGCNA analysis (Langfelder and Horvath, 2008) identifies numerous differentially expressed gene modules, many of which are significantly enriched for genes associated with specific biological functions including autophagy, metabolism, cell cycle and interferon signaling (Figure 1C, Figure S1D). To validate one such module, we tested the prediction that macrophages derived from SPRET mice would exhibit defects in the type I interferon response following TLR4 ligation compared to C57 macrophages. BMDMs were treated with KLA for 6h, at which time a robust Type I interferon response was observed in C57 BMDMs. This is shown by an expression heat map of 46 known interferon stimulated genes (ISGs) exhibiting >4-fold induction (Figure 1F). A subset of these genes, e.g. Mx1 and Mx2, are fully induced in SPRET BMDMs. However, 37 of 46 ISGs exhibit >2-fold less expression in SPRET BMDMs following KLA treatment, e.g. Ccl5 and Ccl2, with 40 of these exhibit >2-fold less expression in SPRET BMDMs under notx conditions. These findings suggest that differences in the basal level of Type I IFN pathway activity in these macrophages determine their expression after stimulation. Overall, these studies quantify the extensive range of gene expression associated with the >50 million SNPs + InDels provided by five diverse strains of mice.
Genetic variation primarily alters nascent transcription through distal cis-regulatory elements
Genetic variation can influence many aspects of RNA synthesis, processing and degradation. To more directly assess the effects of genetic variation on nascent transcription, we performed whole genome run-on analysis coupled to deep sequencing (GRO-seq) (Core et al., 2008) on strain-specific BMDMs under notx and 1h KLA treatment (Table S2). As in the case of polyA RNA transcripts, pairwise comparisons of nascent gene body transcripts exhibited increasing but non-linear strain-specific differences with increasing degrees of genetic variation (Figure 2A). Strain-specific GRO-seq signal is exemplified for Igf1 in Figure 2B. KLA treatment induced GRO-seq signal at 939 genes in BMDMs from at least one strain and repressed 452 genes. Clustering of GRO-seq data sets indicates that the KLA response is the dominant variable, in contrast to strain background for polyA transcripts (Figure S2A). As in the case of the RNA response, very few genes exhibited divergent responses to KLA at 1h (Figure 2C).
Figure 2. Effects of genetic variation on nascent transcription are primarily in cis at promoter-distal locations.

A. Comparison of GRO-seq gene body tag counts in BMDMs derived from the indicated mouse strains under notx. Log2(tag counts+1) values are plotted for BALB, NOD, PWK and SPRET vs. C57. Colors as in Figure 1A. B. Comparison of GRO-seq, 5′GRO-seq and H3K27ac signal at the Igf1 locus in BMDMs derived from each strain under notx conditions. C. Ratio-ratio plots of GRO-seq tag counts for KLA/notx conditions, comparing C57 vs. BALB or SPRET. Colors as in Figure 1D. D. Relationship of differential RNA-seq expression as a function of mutations between −30 and +20 bp of the TSS defined by 5′GRO-seq signal. E. Ratio-ratio plot of gene body GRO-seq tag counts in BMDMs derived from C57 and SPRET mice versus allele-specific tag counts in BMDMs derived from SPRET x C57 F1 mice. F. GRO-seq expression for Npy and Pla2g7 in BMDMs derived from C57 and SPRET mice and allele-specific tag counts in BMDMs derived from SPRET x C57 F1 mice.
To define sites of transcription initiation, we performed 5′GRO-seq, which selects for the capped ends of nascent transcripts and enables base pair resolution of RNA Pol II start sites (Lam et al., 2013). The relationship of 5′GRO-seq to GRO-seq and H3K27ac at the Igf1 locus is illustrated in Figure 2B. In addition to genic start sites, GRO-seq and 5′GRO-seq also quantify RNA generated at enhancers (eRNAs) (Hah et al., 2011; Kaikkonen et al., 2013; Lam et al., 2013), observed upstream of the Igf1 transcription start site (TSS) in Figure 2B. Using 5′GRO-seq to define genic start sites, we find ~30% of mRNAs are initiated further than 50 bp from RefSeq annotated start sites, suggesting utilization of alternative core promoter elements in macrophages and/or technical differences with respect to prior annotation methods (Figure S2B, S2C). We investigated the extent to which differences in nascent and polyA RNA levels could be explained by mutations in the core promoter (−30 to +20 bp from the TSS), the proximal promoter region (−300 to +50 bp from the TSS) and more distal elements based on 5′GRO-seq annotated TSS. Figure 2D shows the percentage of core promoter regions containing mutations that exhibit >4-fold differences in gene expression against the percentage of core promoter regions with mutations that do not. For comparisons of C57 versus PWK or SPRET, 20– 40% of core promoters contain mutations regardless of variation in gene expression. For comparisons of C57 versus BALB or NOD, the mutation frequency in core promoters of differentially expressed genes is 10–15%, compared to 5–10% in core promoters of similarly expressed genes. For the proximal promoter, ~40% of differently regulated genes in C57, BALB and NOD BMDMs contain sequence variants compared to ~20% mutation frequency in the proximal promoters of similarly expressed genes (Figure S2D). These mutation frequencies are significantly similar proportions (p<1e-3 for all comparisons), indicating that the majority of differences in gene expression cannot be explained by variation in the core or proximal promoter sequences.
We next established the relative contributions of local versus distal genetic variation on differential expression of nascent transcripts by analyzing BMDMs derived from F1 crosses of C57, PWK and SPRET mice. In this context, differences between inbred parental strains are likely a cis effect if the difference between the parental alleles is maintained within the F1 hybrid. In contrast, if alleles that are differentially expressed in the parental strains become similarly expressed in the F1 animal, we consider differential regulation in the parental strains to be mainly due to trans effects. A plot of fold difference in allele-specific reads of nascent transcripts for a cross of C57 and SPRET mice versus the fold difference in the parental strains is illustrated in Figure 2E (Figure S2E for cross of C57 and PWK). These comparisons indicate that ~80% of the differences in nascent transcripts are determined in cis (Figure S2F). Examples illustrating primarily cis-regulation are provided for Npy and Plag2g7 for C57 versus SPRET BMDMs in Figure 2F. Collectively, these findings indicate that strain-specific gene expression primarily results from cis-variation that is distal from core and proximal promoter elements.
Effect of genetic variation on TF binding greatly exceeds effects on gene expression
To investigate mechanisms by which genetic variation results in altered gene transcription, we systematically evaluated epigenetic features and TF binding in BMDMs derived from each strain under notx and KLA stimulated conditions. ChIP-seq of dimethylation of lysine 4 on histone 3 (H3K4me2) and acetylation of lysine 27 on histone 3 (H3K27ac) were used as surrogates of primed and active regulatory regions (Creyghton et al., 2010; He et al., 2010). Regions of open chromatin were assessed using the Assay for Transposase-Accessible Chromatin (ATAC-seq) (Buenrostro et al., 2013). ChIP-seq experiments were performed for macrophage LDTFs PU.1, C/EBPβ, CJUN, and the signal-dependent P65 component of NFκB. The Irreproducible Discovery Rate (IDR) method (Li et al., 2011) was used to define highly reproducible peaks across replicates for the ChIP-seq and ATAC-seq data. Because IDR is not applicable to histone modification ChIP-seq experiments, DESeq2 was used (Love et al., 2014) and regions similar between replicates (p-value < 0.001) were kept. Examples of biological replicates and correlation heat maps are provided in Figure S3A and S3B. The numbers of features identified for each of these assays in the five strains of BMDMs under notx and KLA conditions are provided in Table S3.
The effect of genetic variation on H3K27ac ChIP-seq regions is illustrated for comparisons of BALB and SPRET BMDMs to C57 BMDMs in Figure 3A (Figure S3C for H3K4me2). As in the case of polyA and nascent RNA, variation in these features scale with genetic diversity, but to a greater degree. Extension of these comparisons for ATAC-seq defined regions is illustrated in Figure 3B. Strikingly, variation in open chromatin regions occurs to an order of magnitude greater extent than polyA or nascent RNA expression. Genomic regions exhibiting ≥4-fold differences in ATAC-seq tag counts range from ~1,650 for the comparison of C57 and BALB to ~19,700 for the comparison of C57 to SPRET. We performed de novo motif analysis of distal ATAC-seq peaks (>3kb from a TSS) associated with H3K27ac, corresponding to potential enhancer elements, in resting BMDMs from each strain. This analysis returned a consistent pattern of motifs for PU.1, AP-1 and C/EBP as the most highly enriched motifs, followed by motifs for USF, RUNX and a composite PU.1-IRF motif (Figure 3C). We then defined the intersections of ChIP-seq peaks for PU.1, CJUN and C/EBPβ with distal ATAC-seq peaks associated with H3K27ac. These three factors, alone or in combination, were found to occupy ~85% of the putative distal regulatory regions of BMDMs in each strain, exemplified for C57 BMDMs (Figure 3D). H3K27ac ChIP-seq data was also used to define super enhancers, which in contrast to enhancers were generally concordant across strains (Figure 3E).
Figure 3. Variation in TF binding greatly exceeds variation in gene expression.

A. Scatter plots of log2 tag counts for H3K27ac ChIP-seq regions comparing C57 and BALB or SPRET. Colors as in Figure 1A. B. Scatter plots of log2 tag counts for ATAC-seq peaks passing IDR comparing C57 to BALB or SPRET. Colors as in Figure 1A. C. De novo motif analysis of distal (>3kb from TSS) ATAC-seq peaks associated with H3K27ac signal. Boxes display negative log10 p-values for enrichment of the motif and its rank order in parentheses. D. Pie chart indicating fractions of distal H3K27ac-positive regions of open chromatin occupied by PU.1, C/EBPβ and/or CJUN. E. Heat map of H3K27ac tag density at super enhancers. F. Comparison of log2 ChIP-seq tag counts for PU.1 in BMDMs derived from the indicated mouse strains under notx. Colors as in Figure 1A. G. Ratio-ratio plot of PU.1 ChIP-seq tag counts in BMDMs derived from C57 and SPRET mice versus allele-specific tag counts in BMDMs derived from C57 x SPRET F1 mice. H. SNPs + InDels frequencies in ATAC-seq and PU.1 peaks +/− 150 bp of the peak center for the indicated strain comparisons for stringent VCF filter criteria and more lenient criteria.
The impact of genetic variation on TF binding is illustrated for PU.1 (Figure 3F). As in the case of H3K27ac regions and ATAC-seq peaks, we observed a striking graded progression of strain-specific binding as a function of genetic variation. Strain-specific binding of PU.1 ranged from ~3,800 peaks (BALB vs. C57) to >23,000 peaks (SPRET vs. C57), the latter number representing nearly 25% of the IDR-defined PU.1 binding sites. Similar patterns were observed for C/EBPβ, CJUN and P65 (Figure S3D–S3F). To quantify the extent of cis versus trans-regulation, PU.1 ChIP-seq experiments were performed in two F1 strains (PWK x C57 and SPRET x C57) in resting BMDMs and after 1h KLA stimulation. Directly comparing fold change of allele-specific reads between parents and F1 strains indicates that >70% of the peaks follow the parental pattern and are therefore considered to be cis-regulated (Figure 3G, S3G, S3H), consistent with findings for nascent RNA. Collectively, these findings indicate that effects of genetic variation on TF binding greatly exceed effects on nascent and mature RNA transcripts.
Many strain-specific TF binding sites lack local DNA sequence variation
An important question is the extent to which strain-specific differences in open chromatin or TF binding can be explained by local mutations. To address this question, we assessed the extent to which strain-similar and strain-specific ATAC-seq and ChIP-seq peaks exhibit local genetic variation. For comparisons of C57 to BALB and NOD BMDMs, 20–22% of the strain-similar peaks contain mutations (Figure 3H) (22–25% for the more lenient definition, respectively). These frequencies increase in comparisons involving PWK and SPRET BMDMs, indicating that the great majority of local sequence variants are silent. For strain-specific peaks defined by a >4- fold cut-off, comparisons of C57 to BALB and NOD BMDMs indicated that only 52–59% of the ATAC-seq peaks and 64–78% of the PU.1 ChIP-seq peaks contain local variants. Extending the strain-specific cut-off to >8 fold, 76–77% of ATAC-seq peaks and 76–81% of PU.1 ChIP-seq peaks contain local SNPs and/or InDels (Figure 3H). Similar relationships are observed for C/EBPβ, CJUN and P65 (Figure S3I). Further examination of structural variants indicates that these regions frequently explain extreme (i.e., all or none) strain-specific differences (Figure S3J) for regions without mutations, but overall account for only about 2–4% of >4-fold differences between strains (Figure S3K). While these findings are consistent with the expected effects of genetic variation on TF binding and open chromatin, they also indicate that substantial fractions of strain-specific differences in these features cannot be explained by local variants.
Inference of an extensive network of collaborative TFs
Prior observations that mutations in PU.1 motifs alter the binding of nearby C/EBPβ and vice versa (Heinz et al., 2013) suggested the basis for a general approach for discovery of collaborative binding partners by systematic analysis of effects of local motif mutations. Here, we qualitatively advance this strategy by leveraging the diversity of five strains of mice, simultaneously assessing four TFs under basal and stimulated conditions, and developing the Mutational Analysis of Regulatory Genomic Elements (MARGE) (Link et al., 2018) software pipeline to comprehensively evaluate the relationship of motif mutations with TF binding.
We applied MARGE to systematically identify motifs for which disruptions due to mutations were highly correlated with strain-specific TF binding under notx and KLA conditions (Figure 4A, with complete set of significant motifs in Figure S4A). In total, mutations in 80 motifs were found to be significantly associated with strain-specific TF binding (Table S4). These motifs could in turn be associated with 106 confidently expressed transcription factors (>1 TPM) (Table S5), providing genetic evidence for functional roles of a large fraction of the TFs expressed in BMDMs as collaborative partners that drive enhancer selection.
Figure 4. Effects of motif mutations enable inferences of a large network of collaborative TFs.

A. Heat map of a subset of significant motifs after application of MARGE under notx and KLA treatment conditions (complete listing in Table S4). B. Top 14 of 48 motifs correlated with binding of PU.1 under notx as determined by motif mutation analysis. For highly related motifs (e.g., ETS factor motifs), the motif with the largest effect size is illustrated. Node size is fraction of PU.1 peaks containing the indicated motif and edge thickness is proportional to the effect size of motif mutations. Nodes indicate motifs in which mutations result in reduced PU.1 binding (red) or in which mutations result in increased PU.1 binding (blue). C. Top 15 out of 60 motifs correlated with binding of P65 under KLA treatment as determined by MARGE. Node size and edge thickness are defined in Panel B. D. Integrated network of collaborative TFs. The top 15 of 80 motifs for which motif mutations affected binding of at least one of the three factors are shown. Node sizes are the average fractional overlap of the indicated motif with PU.1, C/EBPβ or CJUN peaks and edges are factor-specific effect sizes. E. Fraction of >4-fold different strain specific binding of TFs explained by mutations in their respective recognition motifs and by all mutations considered by MARGE analysis. F. Overlap of binding of PU.1, RUNX1 and USF2 under notx as determined by ChIP-seq for each factor. G. Fraction of open chromatin marked by H3K27ac and not bound by PU.1, CJUN or C/EBP occupied by RUNX1, USF2 and/or NRF2. H. Relationship of mutations in RUNX motifs on binding of RUNX1 and PU.1 in C57 and SPRET BMDMs.
In addition to consensus PU.1, C/EBP, and AP-1 motifs, motifs for related factors were also among the most highly significant motifs identified, including motifs for ETS factors (e.g., GABPA, ELK, ELF), C/EBP-related factors (e.g. DBP) and CJUN-related factors (e.g., ATF, MAF). These motifs are more difficult to interpret because they are also low affinity binding sites for PU.1, C/EBPβ and CJUN, respectively. Analysis of PU.1 peaks containing a single ETS motif that is not a consensus PU.1 motif indicated that mutations in these motifs significantly impact PU.1 binding. However, many binding sites for PU.1, C/EBPβ and CJUN contain multiple iterations of ETS, C/EBP and AP-1-like motifs (e.g. about 40% of PU.1 peaks). For example, when the PU.1 motif is masked, mutations in the remaining ETS motifs remain significant as determinants of PU.1 binding, underscoring the potential complexity of combinatorial interactions between members of TF families that recognize related binding motifs.
Single factor interaction networks for PU.1 under notx conditions and P65 under KLA conditions are illustrated in Figures 4B and 4C, respectively. For corresponding networks for C/EBPβ and CJUN see Figures S4B and S4C. In these networks, the node sizes represent the fraction of PU.1 or P65 binding sites that contain the corresponding motifs, and edge thicknesses corresponds to motif mutation effect size. As expected, mutations in the PU.1 motif and related ETS motifs have the strongest effects on PU.1 binding. Mutations in AP-1 motifs and C/EBP motifs have the next strongest effect sizes, consistent with prior studies (Heinz et al., 2013). In addition, mutations in motifs for more than a dozen different classes of TFs were significantly associated with strain-specific binding of PU.1, including RUNX, USF, DR2, DBP, MAF, MYB, NRF, and E2A motifs (Figure 4B and Table S4. While most significant motif mutations are associated with decreased PU.1 and P65 binding, mutations in E2A and ZEB motifs have the opposite effect (Figure 4B, C).
An integrated interaction network for PU.1, C/EBPβ and CJUN under notx is illustrated in Figure 4D, which illustrates largely dominant effect sizes of mutations in motifs for PU.1, C/EBP and AP-1 factors on each other’s binding. In most cases, motif mutations affecting one factor affected all factors, although often with different effect sizes, exemplified for USF. However, some motifs exhibited specific correlations, such as the unique association of mutations in the KLF motif with CJUN binding.
From these analyses, it is possible to estimate the fraction of strain-specific TF binding attributable to local mutations. Taking the binding sites exhibiting > 4-fold differences in one or more strains, mutations in the motifs for PU.1, C/EBP, AP-1 and NFκB were associated with 22, 10, 8 and 9%, of strain-specific variation, respectively (Figure 4E). Incorporating the additional motifs found significant by the MARGE analysis increases the percentage of strain-specific binding explained to 70, 50, 65 and 60%. The fraction of binding sites explained by MARGE motifs is further increased considering the 500 most differential binding sites for each factor (Figure S4D). However, even at these sites, >20% of strain specific binding of each factor remains unexplained.
The interaction networks inferred from motif mutations are based on genomic regions in which genetic variation results in strain-specific differences in TF binding. To investigate the potential of RUNX, USF and NRF factors to function as collaborative binding factors for PU.1, C/EBPβ and CJUN, we performed ChIP-seq assays for RUNX1 and USF2 in C57 BMDMs. In addition, we analyzed ChIP-seq data for NRF2 in C57 BMDMs (Eichenfield et al., 2016). In each case we observed broad overlap with the genomic binding locations of PU.1, C/EBPβ and CJUN, exemplified for overlaps between PU.1, RUNX1 and USF2 (Figure 4F). We further investigated the potential of these factors to play roles in driving the selection of the 20% of open regions of chromatin marked by H3K27ac that are not occupied by PU.1, C/EBPβ, or CJUN (Figure 3D). These analyses indicated that USF2 occupied >80% of these locations, primarily in association with RUNX1 (Figure 4G). Thus, nearly all enhancer elements in macrophages are marked by combinations of only four TFs: PU.1, C/EBPβ, CJUN and RUNX1. The relationship of mutations in RUNX1 binding motifs on binding of PU.1 and RUNX1 is exemplified in Figure 4H, supporting a role of RUNX1, NRF2 and USF2 (Figure S4E and S4F, respectively) as a collaborative binding partners of PU.1. Collectively, these findings support the genetic evidence for significant roles of ~100 TFs in shaping the DNA binding patterns of major macrophage LDTFs.
Clusters of strain-specific TF binding sites exhibit regional correlation
The observations that the majority of strain-specific differences in gene expression and TF binding are in cis but that substantial fractions of strain-specific TF binding sites cannot be explained by local mutations led us to investigate the possibility of cooperativity between distinct cis-regulatory elements. To investigate this, we calculated Pearson correlation coefficients (PCC) of TF and ATAC-seq peaks across the 5 strains under notx and KLA conditions. Heat maps of these values for ATAC-seq, PU.1, and C/EBPβ peaks along ~6 MB regions of chromosome 18 are illustrated in Figure 5A–C. An example of a genomic region in the vicinity of the Colec12 gene exhibiting strain-specific correlation of ATAC-seq, PU.1, C/EBPβ, CJUN, H3K27ac and GRO-seq features is illustrated (Figure 5D). Within the shaded region more than a dozen high confidence PU.1 peaks exhibit concordant changes in binding across the five strains. Similar concordant changes are observed for ATAC-seq, C/EBPβ, CJUN, H3K27ac and GRO-seq data.
Figure 5. Clusters of ATAC-seq and ChIP-seq peaks are locally correlated.

A–C. Heat maps of Pearson correlation coefficients (PCC) of PU.1, C/EBPβ and CJUN peaks, respectively, across the five strains under notx conditions in a 5 MB window from chromosome 18. Vertical and horizontal lines represent TAD boundaries as defined by C57 Hi-C assays presented in Figure 6. Axes represent sequential locations associated with the indicated feature, with the matrix values corresponding to correlation coefficients defined by the accompanying scale. D. Regional correlation of GRO-seq, ATAC-seq, PU.1, C/EBPβ, CJUN, and H3K27ac signal in the vicinity of the Colec12 gene. E. % of PU.1 CRDs based on minimum peak number and minimum PCC. F. Relationship of strain-specific PU.1 CRDs to enhancer activity measured by 5′GRO-seq and expression of nearest expressed gene measured by RNA-seq (> 16 tag counts). Significance was calculated using a two-sided t-test. G. Heat maps for relative binding and 5′GRO-seq signal at PU.1 CRDs. The ordering of PU.1 signal and corresponding 5′GRO-seq signal is the same for the two plots.
As one approach to define these cis-regulatory domains (CRDs), we considered the minimum number of consecutive features (e.g., ChIP-seq peaks) that exceed a specific PCC (Figure 5E). No sharp inflections are observed that provide a basis for optimization of parameters. CRDs defined by arbitrary cutoffs of a PCC of >0.8 for a minimum of 4 peaks result in 400 – 800 locally correlated regions for ChIP-seq peaks and ~4000 locally correlated ATAC-seq regions (Table S6). For CRDs defined by >4 peaks and correlation coefficient >0.8, the mean number of peaks within a correlated cluster was 6 for PU.1/C/EBPβ, CJUN and P65, and 8 for ATAC-seq (Figure S5A) and the size of genomic regions containing connected peaks ranged from 1kb to 5Mb with a mean length of 70–200kb (Figure S5B). Based on the analysis of F1 hybrids, nearly all strain-specific PU.1 peaks associated with CRDs retain their parental allelic pattern in F1 BMDMs, indicating that such sites are primarily regulated in cis (Figure S5C).
CRDs capture clusters of peaks that are highly similar across all strain comparisons, as well as clusters of peaks that exhibit coordinated differences between strains, as shown for Colec12. Correlated PU.1 peaks that exhibit preferential binding in C57 or SPRET BMDMs are associated with corresponding differences in expression of the nearest gene compared to CRDs that are strain-similar (Figure 5F). Similarly, correlated PU.1 peaks that exhibit significantly different binding in C57 or SPRET BMDMs (p-value < 2.2e-16) are associated with corresponding significant differences in local 5′GRO-seq signal compared to CRDs that are strain-similar (Figure 5F and Figure 5G), as well as significantly different gene expression of the nearest expressed gene. The same was observed for ATAC-seq peaks (Figure S5E). Overall, strain-specific CRDs were highly correlated with strain-specific patterns of 5′GRO-seq signal, exemplified for PU.1 CRDs in Figure 5G. In contrast, we observed almost no overlap between strain-specific CRDs and super enhancers (Figure S5D). These findings suggest functional relationships between CRDs and strain-specific gene expression.
Correlated genomic features are highly interconnected
The observation of regionally correlated TF binding, open chromatin, histone signatures and gene expression raised the question of the relationships of these regions to DNA methylation and chromatin organization. We determined the patterns of DNA cytosine methylation in BMDMs from C57 and SPRET mice by performing bisulfite sequencing (Hajkova et al., 2002). We observed differentially methylated regions at promoters and regulatory elements, as expected, but the overall patterns of DNA methylation were very similar between the strains (Figure S6A), including at promoters of differentially expressed genes (Figure S6B, S6C) such as Colec12, Npy and Igf1 (Figure S6D). As these BMDMs are derived from the most divergent strains, differences in DNA methylation are unlikely to be major drivers or consequences of CRDs.
We next performed in situ Hi-C assays (Rao et al., 2014) in C57 and SPRET BMDMs to define maps of DNA interactions. A Hi-C contact matrix depicting normalized contact frequencies for C57 and SPRET BMDMs for chromosome 18 is indicated in Figure 6A (left). Overall there was a high degree of similarity, with the Eigenvalue of first principle component (PC1), correlated with active or inactive regions of chromatin, being nearly identical between strains. Strain-similar contact frequencies and Eigenvalues are illustrated in the vicinity of the Spi1 locus, encoding PU.1 (Figure 6B, left). However, genomic regions were also observed exhibiting markedly different contact frequencies that correlated with strain-specific gene expression, exemplified by the Colec12 locus (Figure 6B, right). The overall relationship of Eigenvalues for PC1 calculated for 100kb windows (Figure S6E) indicates a few hundred regions of the genome in which the Eigenvalue reverses sign, as in the case of Colec12 (Figure 6B right). A small fraction of these regions are associated with strain-specific differences in gene expression (Figure S6F). However, the great majority of differentially expressed genes reside in compartments associated with similar PC1 values in both strains.
Figure 6. Correlated genomic features are highly connected as determined by proximity ligation assays.

A. Hi-C contact frequency maps for chromosome 18 in BMDMs derived from C57 and SPRET mice. The values for the PC1 eigenvector are shown at the bottom (left) with zoomed-in view visualizing TAD boundaries (right). B. RNA-seq, H3K27ac, PC1, and Hi-C contact loops in the vicinity of the Spi1 and Colec12 loci. C Fraction of significant consensus PLAC-seq interactions within, between and outside of ATAC-seq CRDs. D. Example of ATAC-seq notx CRDs highly connected by PLAC-seq consensus interactions.
To examine the relationship between CRDs and chromatin organization we identified topological associating domains (TADs) from these Hi-C data sets (Dixon et al., 2012). TADs were also similar in BMDMs of C57 and SPRET mice (Figure S6G), although there were frequently subtle differences in how adjacent domains were parsed (e.g., Figure 6A, right). Comparison with ATAC-seq and ChIP-seq data indicated that nearly all CRDs reside within TADs, exemplified by the grid lines in Figures 5A, B and C.
To improve resolution of chromatin interactions and enrich for spatial relationships of CRDs associated with promoters, we performed proximity ligation-assisted ChIP-seq (PLAC-seq) in C57, BALB, NOD, and SPRET-derived BMDMs using H3K4me3 as anchor (Fang et al., 2016). From these data sets we defined all significant interactions observed in at least two strains as a consensus set. We investigated the overlap of significant interactions between and within ATAC-seq CRDs (Figure 6C). Almost 50% of all significant PLAC-seq consensus interactions are either within or between these features, with an additional 28% of interactions connecting CRDs with other regions in the genome. One example of a highly connected region of CRDs is exemplified in Figure 6D. Only about 20% of all significant PLAC-seq interactions are not connected to ATAC-seq CRDs, even though ATAC-seq CRDs only cover about 11% of the whole genome (Figure S6H). Almost 40% of the correlated ATAC-seq peaks have 11 or more significant interactions (Figure S6I). Comparing the number of PLAC-seq interactions connected to ATAC-seq CRDs to a size-match background showed a significant enrichment of interactions associated with CRDs (p-value < 2.2e−16) (Figure S6J). Thus, genomic regions exhibiting highly correlated patterns of strain-specific epigenetic features and TF binding are also highly connected as defined by PLAC-seq assays.
Discussion
These studies report systematic analyses of the effects of natural genetic variation on TF binding, epigenetic state and gene expression in resting and activated macrophages derived from female mice. We observe striking levels of variation across BMDMs isolated from different strains at each level of analysis, with diversity of TF binding greatly exceeding that of active histone modifications, nascent RNA production and mature transcript levels. In view of the diverse roles of macrophages in immunity, tissue homeostasis and diseases including atherosclerosis, diabetes, cancer and neurodegeneration (Wynn et al., 2013), the data sets provided by these studies will be substantial resources for advancing understanding of transcriptional mechanisms and effects of genetic variation. Differences in mRNA expression across the strains are substantial and segregate into distinct biological processes, suggesting corresponding differences with respect to immune and tissue homeostatic functions. Consistent with this, we validated the prediction that SPRET mice would exhibit altered Type I interferon responses following TLR4 stimulation. It will be of interest to determine whether the degree of variation in gene expression observed here in macrophages is a common feature of other cell types. Host responses to pathogens are powerful drivers of evolution of the immune system, and the unique histories of pathogen exposure in the five mouse strains used for analysis may have resulted in more substantial differences in immune cells than other cell types. As the general approach described here can be applied to any cell type, it will be of interest to apply these methods to cell types of various organs as well as to address potential differences between males and females.
The measurement of nascent RNA by GRO-seq and sites of transcription initiation by 5′GRO-seq enabled estimates of the locations of variation underlying differences in genic transcription. By using 5′GRO-seq to annotate TSS, we find that mutations affecting the core promoter element and/or adjacent upstream elements account for less than 20% of divergent nascent gene expression among the most closely related strains. Mutations in core promoter elements are expected to be associated with large effect sizes and therefore more likely to be subject to negative selection. Conversely, analysis of parental alleles in F1 crosses of C57 to PWK or SPRET mice indicates that >70% of divergent gene transcription is due to cis variation. Thus, differential regulation of gene expression observed in these studies is mostly due to effects on distal regulatory elements, consistent with recent studies across human tissues (Consortium et al., 2017). The availability of data sets for mature and nascent RNA levels across five diverse strains of mice will be of value for future exploration of how genetic variation influences diverse aspects of RNA processing, such as splicing and polyadenylation.
A primary motivation of the proposed studies was to systematically explore functional roles of the hundreds of TFs that are expressed in macrophages in establishing the cis-regulatory landscape of BMDMs. We observed that while mutations in the motifs for PU.1, C/EBP, CJUN and P65 are significantly associated with strain-specific binding, the majority of these differences are explained by mutations in nearby collaborative factors. As previously demonstrated, motif mutations in PU.1 affect nearby binding of C/EBPβ and vice versa. The present analyses of motif mutations now extend these relationships to a TF interaction network dominated by collaborative interactions between PU.1, C/EBPs, AP-1, RUNX and USF. Altogether, these studies provide evidence for significant roles of >80 motifs, which can be assigned to 106 of the 248 TFs confidently expressed in macrophages. These findings support the hypothesis that a large fraction of TFs expressed in BMDMs shape the DNA binding patterns 18 and functions of macrophage LDTFs. In general, motif importance is correlated to expression levels of the factors that recognize it.
Notably, substantial fractions of strain-specific DNA binding and ATAC-seq sites are not associated with or cannot otherwise be explained by local DNA variants. This discrepancy led to the finding of regions in the genome in which TF binding, open chromatin, histone modifications and gene expression are highly correlated. Further investigation of these regions using Hi-C and PLAC-seq analyses indicated that they primarily reside within TADs and are highly intra- and inter-connected. These studies thereby confirm and extend prior studies in human lymphoblastoid cell lines demonstrating both local and distal control of chromatin state (Grubert et al., 2015; Waszak et al., 2015). In particular, several independent lines of evidence suggest that regional interactions between cis-regulatory elements influence TF binding independently of local DNA variants. An important future goal will be to determine underlying mechanisms. Given the observation that many CRDs are associated with coding or non-coding transcripts, one possible model is that initiation of transcription from a ‘bootstrap’ enhancer or promoter enables RNA Pol II to function as a chromatin remodeling factor that overcomes local barriers to TF binding. In this model, genetic variants that disable the initiating transcriptional start site would compromise TF binding to the entire CRD.
In concert, the present studies reveal complex relationships between genetic variation, TF binding, epigenetic state and gene expression, only some of which can be currently explained. Elucidation of the underlying mechanisms will be necessary for a better understanding of how non-coding genetic variation influences cellular phenotype. Although macrophages from only five strains of mice were evaluated, they collectively provided >50 million SNPs + InDels for analysis. While many of the major conclusions derived from these studies can be achieved based on the 5–6 million variants provided by comparisons of C57, BALB and NOD strains, the inclusion of PWK and SPRET BMDMs greatly increased statistical power to detect both local and regional TF interactions. This degree of genetic variation and the number of complementary genomic assays are not typically achievable in studies of primary human cells. The model system and associated data sets provided by these studies thus represent a powerful new resource for investigation of the influence of genetic variation on gene expression and cellular phenotype. While the positions of cis-regulatory elements controlling gene expression in mice and humans are poorly conserved, the mechanisms driving cell specific gene expression are very similar (Cheng et al., 2014; Stergachis et al., 2014). It is therefore likely that general principles derived from studies of the influence of genetic variation on gene expression in mice will substantially advance efforts to understand the relationship of non-coding genetic variation and phenotype in humans.
STAR Methods
CONTACT FOR REAGENTS AND RESOURCE SHARING
Further information and requests for resources and reagents should be directed to and will be fulfilled by the Lead Contact Christopher K. Glass (ckg@ucsd.edu)
EXPERIMENTAL MODEL AND SUBJECT DETAILS
Mouse genotypes and sources
Female and male breeder mice for C57BL/6J, BALB/cJ, NOD/ShiLtJ, PWK/PhJ, and SPRET/EiJ mice were purchased from Jackson Laboratory. Mice were housed at the UCSD animal facility on a 12h/12h light/dark cycle with free access to normal chow food and water. All animal procedures were approved by the University of California San Diego Institutional Animal Care and Use Committee in accordance with University of California San Diego research guidelines for the care and use of laboratory animals. 8 – 12 week old healthy female wild type mice were used for experiments. For F1 crosses female C57BL/6J mice were crossed with male PWK/PhJ and SPRET/EiJ and 8 –12 week old healthy female wild type F1 mice were used for experiments. None of the used mice were subject to any previous procedures and all of them were used naive without any previous exposure to drugs.
Cell lines
Male L929 cells (ATCC) were grown in high glucose DMEM with 10% FBS (Omega Biosciences) and 20 U/ml penicillin/streptomycin (Gibco) for 7 days at 37°C in a T150 flask. After that the media was harvested (L929-cell conditioned laboratory-made media) and stored at −80°C until use. The cells were washed with PBS, detached from the flask with ATV and replated. After 20 passages, cells were discarded and a new batch of freshly ordered L929 cells was used.
METHOD DETAILS
Bone marrow-derived macrophage (BMDM) culture
Femur, tibia and iliac bones from the different mouse strains were flushed with DMEM high glucose (Corning) and red blood cells were lysed using red blood cell lysis buffer (eBioscience). After counting, 20 million bone marrow cells were seeded per 15cm non-tissue culture plates in DMEM high glucose (50%) with 20% FBS (Omega Biosciences), 30% L929-cell conditioned laboratory-made media (as source of M-CSF), 100 U/ml penicillin/streptomycin+L-glutamine (Gibco) and 2.5μg/ml Amphotericin B (HyClone). After 4 days of differentiation, 16.7 ng/ml mouse M-CSF (Shenandoah Biotechnology) was added to the media. After an additional 2 days of culture, non-adherent cells were washed off with room temperature DMEM and macrophages were obtained as a homogeneous population of adherent cells which were scraped and subsequently seeded onto tissue culture-treated petri dishes overnight in DMEM containing 10% FBS, 100 U/ml penicillin/streptomycin+L-glutamine, 2.5μg/ml Amphotericin B and 16.7 ng/ml M-CSF. For KLA activation, macrophages were treated with 10 ng/mL KLA (Avanti Polar Lipids) for 1 or 6 hours.
RNA-seq library preparation
Total RNA was isolated from cells and purified using Quick RNA mini prep columns and RNase-free DNase digestion according to the manufacturer’s instructions (Zymo Research). Sequencing libraries were prepared in biological replicates from polyA enriched mRNA, either as previously described (Kaikkonen, et al. 2013), or as follows. Poly A enriched mRNA was fragmented, in 2x Superscript III first-strand buffer with 10mM DTT (Invitrogen), by incubation at 94°C for 9 minutes, then immediately chilled on ice before the next step. The 10 μL of fragmented mRNA, 0.5 μL of Random primer (Invitrogen), 0.5 μL of Oligo dT primer (Invitrogen), 0.5 μL of SUPERase-In (Ambion), 1 μL of dNTPs (10 mM) and 1 μL of DTT (10 mM) were heated at 50°C for three minutes. At the end of incubation, 5.8 μL of water, 1 μL of DTT (100 mM), 0.1 μL Actinomycin D (2 μg/μL), 0.2 μL of 1% Tween-20 (Sigma) and 0.2 μL of Superscript III (Invitrogen) were added and incubated in a PCR machine using the following conditions: 25°C for 10 minutes, 50°C for 50 minutes, and a 4°C hold. The product was then purified with Agentcourt RNAClean XP beads (Beckman Coulter) according to manufacture’s instruction and eluted with 10 μL nuclease-free water. The RNA/cDNA double-stranded hybrid was then added to 1.5 μL of Blue Buffer (Enzymatics), 1.1 μL of dUTP mix (10 mM dATP, dCTP, dGTP and 20 mM dUTP), 0.2 μL of RNAse H (5 U/μL), 1.05 μL of water, 1 μL of DNA polymerase I (Enzymatics) and 0.15 μL of 1% Tween-20. The mixture was incubated at 16°C for 1 hour. The resulting dUTP-marked dsDNA was purified using 28 μL of Sera-Mag Speedbeads (Thermo Fisher Scientific), diluted with 20% PEG8000, 2.5M NaCl to final of 13% PEG, eluted with 40 μL EB buffer (10 mM Tris-Cl, pH 8.5) and frozen −80°C. The purified dsDNA (40 μL) underwent end repair by blunting, A-tailing and adapter ligation as previously described (Heinz, et al. 2010) using barcoded adapters (NextFlex, Bioo Scientific). Libraries were PCR-amplified for 9–14 cycles, size selected by gel extraction, quantified by Qubit dsDNA HS Assay Kit (Thermo Fisher Scientific) and sequenced on a HiSeq 4000 or NextSeq 500.
Crosslinking for ChIP-seq
For PU.1, C/EBPβ, H3K4me2, and H3K27ac ChIP-seq, culture media was removed and plates were washed once with PBS and then fixed for 10 minutes with 1% formaldehyde (Thermo Fisher Scientific) in PBS at room temperature and reaction was then quenched by adding glycine (Thermo Fisher Scientific) to 0.125M.
For CJUN, P65, USF2 and RUNX1 ChIP-seq, cells were cross-linked for 30 minutes with 2mM DSG (Pierce) in PBS at room temperature. Subsequently cells were fixed for 10 minutes with 1% formaldehyde at room temperature and the reaction was quenched with 0.125M glycine. After fixation, cells were washed once with cold PBS and then scraped into supernatant using a rubber policeman, pelleted for 8 minutes at 400xG at 4°C. Cells were transferred to DNA lobind tubes and pelleted at 700xG for 5 minutes at 4°C, snap-frozen in liquid nitrogen and stored at − 80°C until ready for ChIP-seq protocol preparation.
ChIP-seq library preparation
Chromatin immunoprecipitation (ChIP) was performed in biological replicates as described previously (Oishi et al., 2017). In brief, cells were resuspended in swelling buffer (10mM HEPES/KOH (pH7.9), 85mM KCl, 1mM EDTA, 0.5% IGEPAL CA-630) with protease inhibitors for 5min and then spun down and resuspended in 500μl lysis buffer (50mM Tris/HCl (pH7.4), 1% SDS, 0.5% Empigen BB, 10mM EDTA) with protease inhibitors, and chromatin was sheared using the Bioruptor (Diagenode). Lysate was diluted with 750μl dilution buffer (20mM Tris/HCl, 100mM NaCl, 0.5% TritonX-100, 2mM EDTA), 1% was taken as input DNA, and immunoprecipitation was carried out overnight with Dynabeads protein G bound to specific antibodies for PU.1 (Santa Cruz, sc-352X), C/EBPβ (Santa Cruz, sc-150), H3K4me2 (Millipore, 07- 030), H3K27ac (Active Motif, 39135), CJUN (Santa Cruz, sc-1694), P65 (Santa Cruz, sc-372X), USF2 (Santa Cruz, sc-862X) and RUNX1 (Santa Cruz, sc-365644). Beads were washed twice each with wash buffer I (20mM Tris/HCl, 150mM NaCl, 0.1% SDS, 1% Triton X-100, 2mM EDTA), wash buffer II (10mM Tris/HCl, 250mM LiCl, 1% IGEPAL CA-630, 0.7% Na-deoxycholate, 1mM EDTA), TE 0.2% Triton X-100 and TE 50mM NaCl and subsequently eluted with elution buffer (TE, 2% SDS). DNA was reverse-crosslinked and purified using ChIP DNA Clean & Concentrator (Zymo Research) according to the manufacturer’s instructions. Sequencing libraries were prepared from eluted DNA by blunting, A-tailing, adaptor ligation as previously described (Heinz et al., 2010) using NextFlex barcodes (Bioo Scientific). Libraries were PCR-amplified for 12–15 cycles, size selected using PAGE/TBE gels for 200–400bp fragments by gel extraction and single-end sequenced HiSeq 4000 or NextSeq 500.
5′GRO-seq and GRO-seq
Nascent transcription was captured in biological replicates by global nuclear run-on sequencing (GRO-seq) (Core et al., 2008) and nascent transcription start sites by 5′GRO-seq (Lam et al., 2013). Nuclei were isolated from BMDMs using hypotonic lysis [10 mM Tris-HCl (pH 7.5), 2 mM MgCl2, 3 mM CaCl2; 0.1% IGEPAL CA-630] and flash frozen in GRO-freezing buffer [50 mM Tris- HCl (pH 7.8), 5 mM MgCl2, 40% Glycerol]. 3–5 × 10⁶ BMDM nuclei were run-on with BrUTP-labelled NTPs as described (Duttke et al., 2015) with 3x NRO buffer [15mM Tris-Cl (pH 8.0), 7.5 mM MgCl2, 1.5 mM DTT, 450 mM KCl, 0.3 U/μL of SUPERase-In (Ambion), 1.5% Sarkosyl, 366 μM ATP, GTP (Thermo Fisher Scientific), Br-UTP (Sigma Aldrich) and 1.2 μM CTP (Thermo Fisher Scientific, to limit run-on length to ~40 nt)]. Reactions were stopped after five minutes by addition of 500 μL Trizol LS reagent (Invitrogen), vortexed for 5 minutes and RNA extracted and precipitated as described by the manufacturer.
GRO-seq library preparation
For GRO-seq, RNA pellets were resuspended in 18 μl ddH2O + 0.05% Tween (dH2O+T) and after addition of 2 μl fragmentation mix [100 mM ZnCl2, 10 mM Tris-HCl (pH 7.5)], incubated at 70°C for 15 minutes. Fragmentation was stopped by addition of 2.5 μl 100 mM EDTA. BrdU enrichment was performed using BrdU Antibody (IIB5) AC beads (Santa Cruz, sc-32323 AC, lot #A0215 and #C1716), as described in detail by Hetzel et al (Hetzel et al., 2016). Beads were washed once with GRO binding buffer [0.25×saline-sodium-phosphate-EDTA buffer (SSPE), 0.05% (vol/vol) Tween, 37.5 mM NaCl, 1 mM EDTA] + 300 mM NaCl followed by three washes in GRO binding buffer and resuspend as 25% (vol/vol) slurry with 0.1 U/μL SUPERase-In (Ambion). To fragmented RNA, 500 μL cold GRO binding buffer and 40 μL equilibrated BrdU antibody beads were added and samples slowly rotated at 4°C for 80 minutes. Beads were subsequently spun down at 1000xG for 15 seconds, supernatant removed and the beads transferred to a Millipore Ultrafree MC column (UFC30HVNB; Millipore) in about 2x 200 μL GRO binding buffer. The IP reaction was washed twice with 400 μL GRO binding buffer before RNA was eluted by incubation in 200 μL Trizol LS (Thermo Fisher Scientific) under gentle agitation for 3 minutes. The elution was repeated a second time, 120 μL of dH2O+T added to increase the supernatant and extracted as described by the manufacturer. For end-repair and decapping, RNA pellets were dissolved in 8 μl TET [10 mM Tris-HCl (pH 7.5), 1 mM EDTA, 0.05 % Tween20] by vigorous vortexing, heated to 70°C for 2 minutes and placed on ice. After a quick spin, 22 μl Repair MM [3 μl 10x PNK buffer, 15.5 μl dH2O+T, 0.5 μl SUPERase-In RNase Inhibitor (10 U), 2 μl PNK (20U), 1 μl RppH (5U)] was added, mixed by flicking and incubated at 37°C for 1 hour. To phosphorylate the 5′end, 0.5 μl 100 mM ATP was subsequently added and the reactions were incubated for another 45 minutes at 37°C (the high ATP concentration quenches RppH activity). Following end repair, 2.5 μl 50 mM EDTA was added, reactions mixed and then heated to 70°C for 2 minutes before being placed on ice. A second BrdU enrichment was performed as detailed above. For library preparation, RNA pellets were dissolved in 2.75 μl TET + 0.25 μl Illumina TruSeq 3′Adapter (10 μM), heated to 70°C for 2 minutes and placed on ice. 7 μl of 3′MM [4.75 μl 50% PEG8000, 1 μl 10x T4 RNA ligase buffer, 0.25 μl SUPERase-In, 1 μl T4 RNA Ligase 2 truncated (200U; NEB)] was added, mixed well by flicking and reactions incubated at 20°C for 1 hour. Reactions were diluted by addition of 10 μl TET + 2 μl 50 mM EDTA, heated to 70°C for 2 minutes, placed on ice and a third round of BrdUTP enrichment was performed. RNA pellets were transferred to PCR strips during the 75% ethanol wash and dried. Samples were dissolved in 4 μl TET [10 mM Tris-HCl (pH 7.5), 0.1 mM EDTA, 0.05% Tween 20] + 1 μl 10 μM reverse transcription (RT) primer. To anneal the RT-primer, the mixture was incubated at 75°C for 5 minutes, 37°C for 15 minutes and 25°C for 10 minutes. To ligate the 5′ Illumina TruSeq adapter, 10 μl 5′MM [1.5 μl ddH2O + 0.2% Tween20, 0.25 μl denaturated 5′TruSeq adapter (10 μM), 1.5 μl 10x T4 RNA ligase buffer, 0.25 μl SUPERase-In, 0.2 μl 10 mM ATP, 5.8 μl 50% PEG8000, 0.5 μl T4 RNA ligase 1 (5U; NEB)] was added and reactions were incubated at 25°C for 1 hour. Reverse transcription was performed using Protoscript II (NEB) [4 μl 5x NEB FirstStrand buffer (NEB; E7421AA), 0.25 μl SUPERase-In, 0.75 μl Protoscript II (150U; NEB)] at 50°C for 1 hour. After addition of 30 μl PCR MM [25 μl 2X LongAmp Taq 2X Master Mix (NEB), 0.2 μl 100 μM forward primer, 2.8 μl 5M Betaine and 2 μl 10 μM individual barcoding primer], mixtures were amplified (95°C for 3 minutes, [95°C for 60 seconds, 62°C for 30 seconds, 72°C for 15 seconds] x13, 72°C for 3 minutes). PCR reactions were cleaned up using 1.5 volumes of SpeedBeads™ (GE Healthcare) in 2.5M NaCl/20% PEG8000 and libraries size selected on a PAGE/TBE gels to 160– 225 base pairs. Gel slices were shredded by spinning through a 0.5 ml perforated PCR tube placed on top of a 1.5 ml tube. 150 μl Gel EB [0.1% LDS, 1M LiCl, 10 mM Tris-HCl (pH 7.8)] was added and the slurry incubate under agitation overnight. To purify the eluted DNA, 700 μl Zymogen ChIP DNA binding buffer was added into the 1.5 ml tube containing the shredded gel slice and the Gel EB, mixed by pipetting and the slurry transferred to a ZymoMiniElute column. Samples were first spun at 1000xG for 3 minutes, then 10,000xG for 30 seconds. Flow through was removed, and samples washed with 200 μl Zymo WashBuffer (with EtOH). Gel remainders were removed by flicking and columns washed by addition of another 200 μl Zymo WashBuffer (with EtOH). Flow through was removed, columns spun dry by centrifugation at 14,000xG for 1 minute and DNA eluted by addition of 20 μl pre-warmed Sequencing TET [10 mM Tris-HCl (pH 8.0), 0.1 mM EDTA, 0.05% Tween 20]. Libraries were sequenced on an Illumina NextSeq 500.
5′GRO-seq library preparation
RNA pellets were resuspended in 10 μl TET, heated to 70°C for 2 minutes and place on ice. 10 μl of dephosporylation MM [2 μl 10x CutSmart, 6.75 μl dH2O+T, 1 μl Calf Intestinal alkaline Phosphatase (10 U; CIP, NEB), 0.25 μl SUPERase In (5U)] was added. Following incubation at 37°C for 45 minutes, 2 μl 50 mM EDTA was added, reactions mixed, heated to 70°C for 2 minutes and place on ice. BrdU enrichment was performed as described for GRO-seq. RNA pellets were dissolved in 10 μl TET and a second round of dephosphorylation and BrdU enrichment was performed. Libraries were prepared as described in (Hetzel et al., 2016). Briefly, libraries were done as described for GRO-seq with exception of the 3′Adapter ligation step. Here, prior to 3′Adapter ligation, samples were dissolved in 3.75 μl TET heated to 70°C for 2 minutes and placed on ice. RNAs were decapped by addition of 6.25 μl RppH MM [1 μl 10x T4 RNA ligase buffer, 4 μl 50% PEG8000, 0.25 μl SUPERase-In, 1 μl RNA 5′ Pyrophosphohydrolase (5U; RppH, NEB)] and incubated at 37°C for 1 hour. Afterwards, to ligate the 3′ Illumina TruSeq adapter 10 μl of 3′MM was added [1 μl 10x T4 RNA ligase buffer, 6 μl 50% PEG8000, 1.5 μl ddH2O+T, 0.25 μl heat-denaturated Illumina TruSeq 3′Adapter, 0.25 μl SUPERase-In, 1 μl T4 RNA Ligase 2 truncated K227Q (200U; NEB)], mixed well by flicking and reactions incubated at 20°C for 1 hour. Reactions were diluted by addition of 10 μl TET + 2 μl 50 mM EDTA, heated to 70°C for 2 minutes, placed on ice and a third round of BrdUTP enrichment was performed. 5′ adapter ligation, reverse transcription and library size selection were performed as described for GRO-seq. Samples were amplified for 14 cycles, size selected for 160–250 bp and sequenced on an Illumina NextSeq 500.
ATAC-seq library preparation
To approximately 150k nuclei in biological replicates in 22.5 μl GRO freezing buffer, isolated as described for GRO-seq above, 25 μl DNA Tagmentation buffer was added, reaction mixed and 2.5 μL DNA Tagmentation Enzyme mix (Nextera DNA Library Preparation Kit, Illumina) added. Mixture was incubated at 37°C for 30 minutes and subsequently purified using the Zymogen ChIP DNA purification kit as described by the manufacturer. DNA was amplified using the Nextera Primer Ad1 and a unique Ad2.n barcoding primers using NEBNext High-Fidelity 2X PCR MM for 10 cycles. PCR reactions were purified using 1.5 volumes of SpeedBeads in 2.5M NaCl, 20% PEG8000, size selected using PAGE/TBE gels for 160 – 280 bp and DNA eluted as described for GRO-seq.
PLAC-seq library preparation
PLAC-seq libraries were prepared as described in (Fang et al., 2016) for one sample of C57, BALB, NOD, and SPRET. In brief, cells were cross-linked for 15 minutes at room temperature with 1% formaldehyde and quenched for 5 minutes at room temperature with 0.2M glycine (Thermo Fisher Scientific). The cross linked cells were centrifuged at 2500xG for 5 minutes. To isolate nuclei, cross-linked cells were resuspended in 200 μl lysis buffer (10mM Tris-HCl (pH 8.0), 10mM NaCl, 0.2% IPEGAL CA-630) and incubated on ice for 15 minutes. The suspension was then centrifuged at 2500xG for 5 minutes and the pellet washed by resuspending in 300 μl lysis buffer and centrifuging at 2500xG for 5 minutes. The pellet was resuspended in 50 μl 0.5% SDS and incubated for 10 minutes at 62°C. 170 μl 1.47% TritonX-100 was added to the suspension and incubated for 15 minutes at 37°C. 25 μl of 10X NEBuffer 2 and 100U MboI was added to digest chromatin for 2 hours at 37°C at 1000rpm rotation. Enzymes were inactivated by heating for 20 minutes at 62°C. Fragmented ends were biotin labeled by adding 50 μl of a mix containing 0.3mM biotin-14-dATP, 0.3mM dATP, 0.3mM dTTP, 0.3mM dGTP, and 0.8U/μl Klenow and incubated for 60 minutes at 23°C with rotation (500rpm). Ends were subsequently ligated by adding a 900 μl master mix containing 120 μl 10X T4 DNA ligase buffer (NEB), 100 μl 10% TritionX-100, 12 μl 10mg/mL BSA, 10 μl 400U/μl T4 DNA Ligase (NEB, high concentration formula) and 658 μl H2O and incubated for 240 minutes at 23°C with 300rpm slow rotation. Nuclei were pelleted for 5 minutes at room temperature at 2500XG. For the ChIP, nuclei were resuspended in RIPA Buffer (10mM Tris (pH 8.0), 140mM NaCl, 1mM EDTA, 1% Triton X-100, 0.1% SDS, 0.1% sodium deoxycholate) with proteinase inhibitors and incubated on ice for 10 minutes. Sonication was performed using a Covaris M220 instrument (Power 75W, duty factor 10%, cycle per bust 200, time 10 minutes, temperature 7°C) and nuclei were spun for 20 minutes at 14000rpm at 4°C. For pre-cleaning, protein G sepharose beads were added to the supernatant and rotated for 3 hours at 4°C. 5% of supernatant was taken as input DNA, and to the remaining volume 2.5μg of anti-H3K4me3 antibody (04-745, Millipore) was added and rotated at 4°C overnight for immunoprecipitation. 0.5% BSA-blocked protein G sepharose beads was added and the sample was rotated for 3 hours at 4°C. The sample was centrifuged at 2000rpm for 1 minute and the beads were washed three times with RIPA buffer, two times with high-salt RIPA buffer (10mM Tris pH 8.0, 300mM NaCl, 1mM EDTA, 1% Triton X-100, 0.1% SDS, 0.1% deoxycholate), one time with LiCl buffer (10mM Tris (pH 8.0), 250mM LiCl, 1mM EDTA, 0.5% IGEPAL CA-630, 0.1% sodium deoxycholate) and finally two times with TE buffer (10mM Tris (pH 8.0), 0.1mM EDTA). Washed beads were treated with 10μg RNase A in extraction buffer (10mM Tris (pH 8.0), 350mM NaCl, 0.1mM EDTA, 1%SDS) for 1 hour at 37°C, and subsequently 20μG proteinase K was added at 65°C overnight. ChIP DNA was purified by Phenol/Chloroform/Isoamyl Alcohol (25:24:1) extraction and then ethanol purification with final elution volume. For Biotin pull down, 20 μL of 10mg/mL Dynabeads My One T1 Streptavidin beads washed with 400 μl of 1X Tween Wash Buffer (5mM Tris-HCl (pH 7.5), 0.5mM EDTA, 1M NaCl, 0.05% Tween) supernatant removed after separation on a magnet. Beads were resuspended with 2X Binding Buffer (10mM Tris-HCl (pH 7.5), 1mM EDTA, 2M NaCl), added to the sample and incubated for 15 minutes at room temperature. Beads were subsequently washed twice with 1X Tween Wash Buffer and in between heated on a thermomixer for 2 minutes at 55°C with mixing and once washed once with 1X NEB T4 DNA ligase buffer. To repair fragmented ends and remove biotin from unligated ends, beads were resuspended in 88 μl 1X NEB T4 DNA ligase buffer, 2 μl 25mM dNTP mix, 5 μl 10U/μl NEB T4 PNK, 4 μl 3U/μl NEB T4 DNA Polymerase and 1 μl 5U/μl Klenow, incubated for 30 minutes at room temperate and supernatant was discarded after separation on magnet. Beads were washed twice with 1X Tween Wash Buffer with 2 minute incubation at 55°C on a thermomixer with mixing, and afterwards resuspended in 100μl 1X NEB Buffer 2. For dA-tailing, beads were resuspended in 90 μl 1X NEB Buffer 2, 5 μl 10mM dATP and 5 μl5U/μl Klenow (exo-, NEB M0212) and incubated for 30 minutes at 30°C. Beads were then washed twice as before. Beads were subsequentially washed in 1X NEB Quick Ligation Reaction Buffer (diluted from 2X, NEB B2200S). To ligate adapters, beads were suspended in 50 μl 1X NEB DNA Quick Ligase Buffer and 3 μl Illumina Indexed adapters and 2 μl of NEB DNA Quick ligase (M2200) were added mixed and incubated for 15 minutes at room temperature. Beads were washed twice with 1X Tween Wash Buffer with 2 minutes at 55°C on a thermomixer as before. Beads washed with 1X Tris Buffer once and resuspended in 50 μl of 1x Tris Buffer. KAPA qPCR assay was performed to estimate concentration and cycle number for final PCR. Final PCR was directly amplified off the T1 beads according to the qPCR results and DNA was cleaned with 1X AMPure Cleanup and eluted in 1X Tris Buffer and sequenced paired-end.
Bisulfite Sequencing
Bisulfite sequencing was performed as described in (Urich et al., 2015). DNA from C57 and SPRET BMDMs was isolated using the PureLink Genomic DNA Kit (Thermo Fisher Scientific) as described by the manufacturer. 2 μg of gDNA supplemented with 0.5% non-methylated λ-DNA (Promega) was used as input. DNA was fragmented to a 200 bp peak size using the Covaris microTube sonicator, size selected, end-repaired, adenylated and methylated adapters ligated exactly as detailed in Urich et al. Cytosine to uracil conversion was performed with the EZ DNA methylation-Gold kit (Zymo Research) with 450ng of adapter-ligated gDNA input as described within. Following bisulfite-treated DNA purification, reactions were amplified with four cycles, purified using one volume of AMPure XP bead solution and sequenced on an Illumina NextSeq 500 for 25 million and 31 million reads for C57Bl/6J and SPRET/EiJ, respectively. Conversion rates were 99.69%.
Hi-C sequencing
In situ Hi-C was performed for C57 and SPRET using the Arima-HiC kit (Arima Genomics Inc) as described by the manufacturer.
QUANTIFICATION AND STATISTICAL ANALYSIS
Statistical details are indicated throughout the main text, in the Figure legends and within the supplemental Tables
Data mapping and shifting
Custom genomes were generated for BALB/cJ, NOD/ShiLtJ, PWK/PhJ, and SPRET/EiJ from invariant positions of the mm10 sequence with alleles replaced by those reported in the VCF files (version v3) from the Mouse Genomes Project (Keane et al., 2011). For stringent VCF filter criteria, only homozygous mutations that pass VCF quality control were considered. For the more lenient definition, all mutations in the VCF file were considered. For C57BL/6J the mm10 reference genome from the UCSC genome browser was used. ChIP-seq, ATAC-seq, GRO-seq and 5′GRO-seq data was mapped to custom genomes using bowtie2 (Langmead and Salzberg, 2012) with default parameters. RNA-seq data was mapped to custom genomes using STAR (Dobin et al., 2013) with default parameters. DNA methylation data was mapped to custom genomes using Bismark (Krueger and Andrews, 2011) (bismark -n 1 -l 40), Hi-C data was mapped to custom genomes using bowtie2 (Langmead and Salzberg, 2012) with default parameters and PLAC-seq data was mapped to custom genomes using BWA (version 0.7.15-r1140) (Li and Durbin, 2009) with default parameters. For visualization and data analysis, the strain genomes were shifted to the positions of the reference genome (mm10) using MARGE (Link et al., 2018). Deletions in the strains compared to the reference were not assigned with any reads. Mapped reads on insertions in the strain were shifted to the last overlapping position between strain and reference and summed up at this position. To overlap peaks with structural variances (SV), the SV file for all strain comparisons to C57 was downloaded from the mouse genome project webpage.
IDR analysis
TF ChIP-seq experiments were performed in two replicates with corresponding input experiments. HOMER (Heinz et al., 2010) tag directories were created for both replicates and both inputs and peaks were called with HOMER for each tag directory with relaxed peak finding parameters (-L 0 -C 0 -fdr 0.9) and the corresponding input directory. For ATAC-seq, no inputs were used, but the size was set to 200bp (-L 0 -C 0 -fdr 0.9 -minDist 200 -size 200). IDR (Li, 2011) was installed using Anaconda 3. To test for reproducibility between replicates, tag directories for input and ChIP-seq were pooled and pseudo replicates were generated. Peaks were called and IDR was run on both replicates and considered good if the replicate with more peaks had less than twice the number of peaks of the other replicate. To assess reproducibility within one experiment, each replicate was randomly split into two replicates. Peaks were called and IDR was run on each pseudo replicate. Experiments were considered self-consistent if the pseudo replicate with more peaks had less than twice the number of peaks of the other pseudo replicate. After passing these two quality control steps, IDR was performed on replicates and all optimal peaks defined by IDR were used for downstream analysis. For downstream analysis, the pooled input and experiment tag directories were used.
Histone modification ChIP-seq quality control
IDR is not applicable for histone modification data. Therefore, for H3K4me2 and H3K27ac ChIP-seq, peaks were called on each replicate independently with HOMER’s findPeaks -style histone, 8-fold enrichment over the input sample and normalization to 10 million mapped reads per experiment. These peaks then were merged using HOMER’s mergePeaks –size given and subsequently similar peaks between both replicates were identified using HOMER’s getDifferentialPeaks with the parameter –same. Peaks that were significantly similar (p-value < 0.001) were kept.
ATAC-seq and ChIP-seq analysis
To quantify the number of differentially bound TF binding site and open chromatin, the optimal peak files from the IDR analysis were merged between two strains with HOMER’s mergePeaks. Subsequently the merged file was annotated with HOMER’s annotatePeaks.pl with parameters mm10 –noann –nogene and the pooled IDR tag directories were used. Peaks bound >2-fold different between strains were colored light blue, peaks bound >4-fold different were colored dark blue. All tag counts reported throughout the manuscript are normalized to 10 million reads per sample.
De novo Motif analysis
To identify motifs enriched in peak regions over random background, HOMER’s de novo motif analysis (findMotifsGenome.pl) was modified to account for differences in the strain genomes. The hand-curated motif file was used to compare enriched consensus sequences with known motifs.
Super enhancers
Super enhancers were identified using H3K27ac ChIP-seq data in HOMER using the findPeaks – style super and –i <input sample> parameters.
Network analysis
To calculate the effect size of mutations within a motif on binding, the r.squaredGLMM function of the MuMIn package (Barton, 2017) in R was used. The marginal R value (sqrt(R2)) was multiplied by 100 and reported as effect size. The network was visualized using Cytoscape 3.5.1 (Shannon et al., 2003) scaling the edges by effect size and nodes by percentage of peaks containing the motif of interest at least once.
RNA-seq analysis
To compare strain-specific gene expression, first HOMER’s analyzeRepeats with the option rna and the parameters –condenseGenes, -noadj, and –count exons was used on two replicates per strain. Differential gene expression was assessed with DESeq2 using HOMER’s getDiffExpression.pl with the parameters –fdr 0.01 and −log2fold 1 (for 2-fold differently expressed genes) or −log2fold 2 (for 4-fold differently expressed genes). All genes shorted than 250bp were removed and for the remaining genes the TPM (transcript per kilobase million) values were plotted and colored according to fold change (2-fold different: light blue, 4-fold different: dark blue). For ratio-ratio plots, the TPM values of both replicates per treatment and 43 strain were averaged and the induction of gene expression was calculated avg(TPM KLA+1)/avg(TPM notx + 1) on a log 2 scale. To assess the difference in interferon response, 46 genes associated with interferon response were manually selected and the average TPM values for both strains and both treatments were shown and used to calculate the fold difference in KLA response.
WGCNA analysis
Raw gene counts defined by HOMER’s analyzeRepeats was imported in R, processed with EdgeR version 3.16.5 (Robinson et al., 2010). Genes smaller than 250 bp, with less than 1 count per million (CPM) in at least 2 samples were discarded and WGCNA analysis (Version 1.61) (Langfelder and Horvath, 2008) was performed on the remaining genes. The coexpression network was created using a softpower value of 20. Tree cutting was performed with PAM stage, minimum module size of 250 genes and a cut height of 0.99 (Langfelder et al., 2008). The modules were ordered according to number of genes, and were assigned colors from the ‘Spectral’ palette of RcolorBrewer (1.1–2) (Neuwirt, 2014). Module trait correlations were calculated using ‘treatment’, ‘strain combinations’ and ‘treatment and strain interaction’ as surrogate trait variables. P-values based on the correlation scores were FDR multiple testing corrected with the Stats-package (Version 4.3.3.2), and only modules-trait correlated FDR < 1E- 3 were considered to be significant. Modules were annotated using Metascape (Tripathi et al., 2015).
GRO-seq analysis
To compare strain-specific nascent transcription the level of nascent transcripts at the gene bodies was assessed with HOMER’s analyzeRepeats with the option rna and the parameters – condenseGenes –noadj and –count genes on two replicates per strain. Differential nascent transcription was assessed with DESeq2 using HOMER’s getDiffExpression.pl with the parameters –fdr 0.01 and −log2fold 1 (for 2-fold different nascent transcription) or −log2fold 2 (for 4-fold different nascent transcription). All genes shorted than 250bp were removed and for the remaining gene bodies the TPM values for the pooled tag directories were used for 44 visualization. For ratio-ratio plots analyzeRepeats was used with option rna and the parameters –condenseGenes, -tpm and –count genes using the pooled tag directories per strain and treatment.
5′GRO-seq analysis
5′GRO-seq signal was assessed with HOMER’s findPeaks –style tss using the pooled GRO-seq signal tag directories as input. 5′GRO-seq peaks were merged between strains using mergePeaks and signal was quantified with annotatePeaks.pl with parameters –fragLength 1 and –strand +. To quantify the distance between the 5′GRO-seq signals and the annotated TSS, the distances annotatePeaks.pl reports were used.
To determine the percentage of genetic variation within TSS affection gene expression, all TSS were merged between all possible strains combinations with HOMER’s mergePeaks –d given - strand. These sites then were centered and extended by the respective distances. For TSS on the negative strand the extension was reversed. The extended regions were annotated with mutations from the strains. Furthermore, the expression of each gene was measured by RNA-seq read counts using TPM. Genes on chromosome X and chromosome Y were excluded. All genes with less than 4 TPM were filtered out. For the remaining genes, the log2 fold change was calculated. Genes were split into similarly expressed between strains (log2 fold change between −0.5 and 0.5) and differently expressed (log2 fold change greater than 1 or less than − 1). The genes were associated with the closest 5′GRO-seq signal and promoter regions with natural genetic variation were defined as mutated, whereas regions without any genetic variation were defined as equal sequence. To determine if the fractions of TSS with mutations associated with differentially expressed genes versus similarly expressed genes were significantly similar, a 2-sample test for equality of proportions with continuity correction, was used in R.
CRD analysis
The optimal peak files from all five strains were merged into one large file with HOMER’s mergePeaks and annotated with the tag counts from the pooled IDR tag directories. The Pearson correlation coefficient (PCC) between all pairs of peaks was calculated with the perl module Statistics::Basic using the correlation sub function. To visualize the data, a sub part of the matrix was selected and visualized in R with heatmap.2 from the gplots package. To define CRDs 4 or more consecutive peaks with a PCC of 0.8 or greater from each peak to the start peak was selected to plot length and average numbers of peaks. To annotate the signal at CRDs PU.1 or 5′GRO-seq signal was annotated at each original peak with annotatePeaks. For 5′GRO-seq the parameters –fragLength 1 was used. The signal of all peaks within one CRD was summed up to the final signal at the CRDs. In order to differentiate between highly similar and highly different CRDs between strains, the minimal and maximal binding strength was defined by locus and the difference between minimum and maximum was calculated as (max – min)/max. Loci with a score greater than 0.6 were labeled as different, whereas loci with a score smaller than 0.5 were labeled as similar.
To test whether strain-specific binding in CRDs overlap with strain-specific enhancer signature and gene expression, CRDs were annotated with binding signal of C57 and SPRET, the log2 fold change was calculated (log2((C57+1)/(SPRET+1))) and separated into C57-specifc (log2 fold change > 1), SPRET-specific (log 2 fold change < −1), and common (abs(log2 fold change) < 0.5).
Hi-C analysis
Hi-C fastq files were mapped separately and HOMER tag directories were created with makeTagDirectory <read1>,<read2> -tbp 1. Hi-C interaction matrices were visualized as observed interactions versus expected with Juicebox (Durand et al., 2016) and in the WashU (Zhou and Wang, 2012) genome browser as pairwise interactions. PC1 values were calculated using HOMER’s runHiCpca.pl with –res 50000 –superRes 100000. TADs were called with HOMER’s findTADsAndCPs.pl find with parameters –res 3000 –superRes 15000 for C57 and SPRET independently. To remove false positive regions, filterTADsAndCPs.pl was used. To compare TADs between strains the TADs were merged using merge2Dbed.pl and then the inclusion ratio was quantified with findTADsAndCPs.pl score with default parameters. The inclusion ratio was calculated by finding the average interaction counts as a function of distance for interactions within the TAD (intra-TAD) and for interactions between the TAD and the regions of upstream and downstream of the TAD of the same size (inter-TAD). To visualize TADs in the matrices for the CRDs TADbit-analysis (Serra et al., 2017) was used to call TADs on raw count interactions matrices in a 100kb window generated by HOMER.
PLAC-seq analysis
PLAC-seq data was preprocessed with PrepPlac.sh script from the FithiChIP package version 1 (https://github.com/ay-lab/FitHiChIP). After mapping, two separate alignments files were created for short (< 1 kb) and long (> 10 kb) range interactions. Peak calling was performed on the short distance alignment file using MACS2 (Zhang et al., 2008) (version 2.1.1.20160309). BAM and bed peak files were used as input for FitHiChIP to calculate statistically significant interactions between bin size of 5000 bp. Significant interactions were calculated for each of the strains individually. A consensus PLAC-seq interaction set was generated considering only interactions that were identified in minimally two strains (Q<0.01). Overlap between CRDs and the PLAC-seq consensus set were calculated and the fraction of intra-CRD, inter-CRD, CRD to none CRD region, and interactions without CRDs were calculated. A 5-times bigger size-matched and peak-matched background set of consecutive ATAC-seq peaks with a PCC smaller than 0.6 was generated. Consequentially, the number of consensus PLAC-seq interactions with the CRDs and the background was counted and compared using the Kruskall Wallis between group test.
DNA-Methylation analysis
For analysis only CpG data was considered. To account for additional CpG residues generated in SPRET due to mutations all CpGs present in both strains were considered in the downstream analysis and counted as 0 when not present. HOMER tag directories were created with parameters –format bismark –genome mm10 –checkGC –minCounts 0. The optimal number of minCounts was assessed per experiment and tag directories were re-generated with parameters –format bismark –genome mm10 –checkGC –minCounts 5 for C57 and –minCounts 7 for SPRET. To assess the differences between both strains the transcription start sites of all genes were annotated with the percentage of methylated CpGs using HOMER’s annotatePeaks with option tss and parameters –mC. Subsequently the percentage of methylated CpGs was plotted for all gene promoters, for gene promoters of genes that are 2-fold differently expressed, as well as genes that are 4-fold differently expressed.
MARGE analysis
Mutation Analysis for Regulatory Genomic Elements (MARGE) (Link et al., 2018) was used to generate custom genomes and shift the mapped data back to reference coordinates. To model the impact of a motif on the binding of the measured TFs, a linear mixed model (LMM) was used. The binding of the TF is modeled as the fixed effect motif existence with random effects locus and genotype with the lme4 package (Douglas, 2015) in R (R Development Core Team, 2016). To calculate significance for each motif, the drop1 command was used. It compares a model including motif score with a model without motif score and reports the Akaike information criterion (AIC) (Akaike, 1973) for the difference.
MARGE uses an input of normalized ChIP-seq or ATAC-seq data from genetically diverse samples, a library of motifs to query and corresponding genomic sequence for each sample, to apply the LMM and to calculate a p-value for whether mutations in a particular motif are significantly associated with differential TF binding, chromatin accessibility or transcription initiation. Because many motifs in existing databases are highly redundant and are recognized by the same factor or family of factors, we generated a non-redundant motif.
Generation of consensus motif file
Position Probability Matrices (PPMs) of all pairs of DNA sequence motifs were generated and all pairwise combinations were aligned with Smith-Waterman algorithm (Smith and Waterman, 1981) without gaps. For each position in the alignment a Pearson correlation was calculated. Sets of motifs that had PPMs with a Pearson correlation of 0.9 or greater were merged by iteratively aligning each PPM within the set and averaging the nucleotide frequencies at each position, similar to the STAMP approach (Mahony and Benos, 2007). The threshold for motif finding was set to have a false-positive rate lesser than 0.001 using the Biopython module motifs (Cock et al., 2009) with the function distribution.threshold_fpr.
F1 analysis
F1 data was mapped to both parental genomes. Only reads without any mismatch were considered for downstream analysis. Tag directories were generated for perfectly aligned reads per parental genome, as well as for all reads that overlap loci with differences in the parental alleles. All loci without differences were discarded. To assign allele-specific reads, MARGE was used. In short, the ratio of reads overlapping mutations was calculated and subsequently all perfectly aligned reads for this locus were multiplied by this ratio * 10 and assigned to the parental genomes. Loci annotated with 0 reads in one of the F1 alleles were filtered out. For GRO-seq analysis, gene bodies with less than 4 tag counts in either one of the parental or F1 alleles were filtered out. For ChIP-seq analysis, loci with less than 16 reads were discarded. To determine cis-regulation, the difference of fold change between parental alleles and F1 alleles were calculated.
Data visualization
All ChIP-seq, RNA-seq, GRO-seq, 5′GRO-seq and Bisulfite data was visualized in the UCSC genome browser (Kent et al., 2002). To show interactions for Hi-C and PLAC-seq, data was uploaded to the WashU browser (Zhou and Wang, 2012).
DATA AND SOFTWARE AVAILABILITY
All raw data and processed data files were deposited to GEO under accession number GSE109965. MARGE can be downloaded under https://github.com/vlink/marge.
References
- Akaike H. Information theory and an extension of the maximum likelihood principle. 2nd International Symposium on Information Theory.1973. [Google Scholar]
- Barton K. MuMIn: Multi-Model Inference. 2017. [Google Scholar]
- Cock PJ, Antao T, Chang JT, Chapman BA, Cox CJ, Dalke A, Friedberg I, Hamelryck T, Kauff F, Wilczynski B, et al. Biopython: freely available Python tools for computational molecular biology and bioinformatics. Bioinformatics. 2009;25:1422–1423. doi: 10.1093/bioinformatics/btp163. [DOI] [PMC free article] [PubMed] [Google Scholar]
- Core LJ, Waterfall JJ, Lis JT. Nascent RNA sequencing reveals widespread pausing and divergent initiation at human promoters. Science (New York, NY) 2008;322:1845–1848. doi: 10.1126/science.1162228. [DOI] [PMC free article] [PubMed] [Google Scholar]
- Dobin A, Davis CA, Schlesinger F, Drenkow J, Zaleski C, Jha S, Batut P, Chaisson M, Gingeras TR. STAR: ultrafast universal RNA-seq aligner. Bioinformatics. 2013;29:15–21. doi: 10.1093/bioinformatics/bts635. [DOI] [PMC free article] [PubMed] [Google Scholar]
- Machler Douglas BM, Bolker Ben, Steve Walker. Fitting Linear Mixed-Effects Models Using lme4. Journal of Statistical Software 2015 [Google Scholar]
- Durand NC, Robinson JT, Shamim MS, Machol I, Mesirov JP, Lander ES, Aiden EL. Juicebox Provides a Visualization System for Hi-C Contact Maps with Unlimited Zoom. Cell Syst. 2016;3:99–101. doi: 10.1016/j.cels.2015.07.012. [DOI] [PMC free article] [PubMed] [Google Scholar]
- Duttke SH, Lacadie SA, Ibrahim MM, Glass CK, Corcoran DL, Benner C, Heinz S, Kadonaga JT, Ohler U. Human promoters are intrinsically directional. Molecular cell. 2015;57:674–684. doi: 10.1016/j.molcel.2014.12.029. [DOI] [PMC free article] [PubMed] [Google Scholar]
- Fang R, Yu M, Li G, Chee S, Liu T, Schmitt AD, Ren B. Mapping of long-range chromatin interactions by proximity ligation-assisted ChIP-seq. Cell Res. 2016;26:1345–1348. doi: 10.1038/cr.2016.137. [DOI] [PMC free article] [PubMed] [Google Scholar]
- Heinz S, Benner C, Spann N, Bertolino E, Lin YC, Laslo P, Cheng JX, Murre C, Singh H, Glass CK. Simple Combinations of Lineage-Determining Transcription Factors Prime cis-Regulatory Elements Required for Macrophage and B Cell Identities. Molecular cell. 2010;38:576–589. doi: 10.1016/j.molcel.2010.05.004. [DOI] [PMC free article] [PubMed] [Google Scholar]
- Hetzel J, Duttke SH, Benner C, Chory J. Nascent RNA sequencing reveals distinct features in plant transcription. Proceedings of the National Academy of Sciences of the United States of America. 2016;113:12316–12321. doi: 10.1073/pnas.1603217113. [DOI] [PMC free article] [PubMed] [Google Scholar]
- Keane TM, Goodstadt L, Danecek P, White MA, Wong K, Yalcin B, Heger A, Agam A, Slater G, Goodson M, et al. Mouse genomic variation and its effect on phenotypes and gene regulation. Nature. 2011;477:289–294. doi: 10.1038/nature10413. [DOI] [PMC free article] [PubMed] [Google Scholar]
- Kent WJ, Sugnet CW, Furey TS, Roskin KM, Pringle TH, Zahler AM, Haussler D. The human genome browser at UCSC. Genome research. 2002;12:996–1006. doi: 10.1101/gr.229102. [DOI] [PMC free article] [PubMed] [Google Scholar]
- Krueger F, Andrews SR. Bismark: a flexible aligner and methylation caller for Bisulfite-Seq applications. Bioinformatics. 2011;27:1571–1572. doi: 10.1093/bioinformatics/btr167. [DOI] [PMC free article] [PubMed] [Google Scholar]
- Lam MT, Cho H, Lesch HP, Gosselin D, Heinz S, Tanaka-Oishi Y, Benner C, Kaikkonen MU, Kim AS, Kosaka M, et al. Rev-Erbs repress macrophage gene expression by inhibiting enhancer-directed transcription. Nature. 2013;498:511–515. doi: 10.1038/nature12209. [DOI] [PMC free article] [PubMed] [Google Scholar]
- Langfelder P, Horvath S. WGCNA: an R package for weighted correlation network analysis. BMC Bioinformatics. 2008;9:559. doi: 10.1186/1471-2105-9-559. [DOI] [PMC free article] [PubMed] [Google Scholar]
- Langfelder P, Zhang B, Horvath S. Defining clusters from a hierarchical cluster tree: the Dynamic Tree Cut package for R. Bioinformatics. 2008;24:719–720. doi: 10.1093/bioinformatics/btm563. [DOI] [PubMed] [Google Scholar]
- Langmead B, Salzberg SL. Fast gapped-read alignment with Bowtie 2. Nature methods. 2012;9:357–359. doi: 10.1038/nmeth.1923. [DOI] [PMC free article] [PubMed] [Google Scholar]
- Li H, Durbin R. Fast and accurate short read alignment with Burrows-Wheeler transform. Bioinformatics. 2009;25:1754–1760. doi: 10.1093/bioinformatics/btp324. [DOI] [PMC free article] [PubMed] [Google Scholar]
- Li QBJBHHBPJ. Measuring reproducibility of high-throughput experiments. The Annals of Applied Statistics. 2011;5:1752–1779. [Google Scholar]
- Link VM, Romanoski CE, Metzler D, Glass CK. MARGE: Mutation analysis of Regulatory Genomic Elements. bioRxiv. 2018 doi: 10.1093/nar/gky491. [DOI] [PMC free article] [PubMed] [Google Scholar]
- Mahony S, Benos PV. STAMP: a web tool for exploring DNA-binding motif similarities. Nucleic acids research. 2007;35:W253–258. doi: 10.1093/nar/gkm272. [DOI] [PMC free article] [PubMed] [Google Scholar]
- Neuwirt E. RColorBrewer: ColorBrewer Palettes. 2014. [Google Scholar]
- Oishi Y, Spann NJ, Link VM, Muse ED, Strid T, Edillor C, Kolar MJ, Matsuzaka T, Hayakawa S, Tao J, et al. SREBP1 Contributes to Resolution of Pro-inflammatory TLR4 Signaling by Reprogramming Fatty Acid Metabolism. Cell Metab. 2017;25:412–427. doi: 10.1016/j.cmet.2016.11.009. [DOI] [PMC free article] [PubMed] [Google Scholar]
- R Development Core Team. R: A Language and Environment for Statistical Computing. R Foundation for Statistical Computing; Vienna, Austria: 2016. https://www.R-project.org/ [Google Scholar]
- Robinson MD, McCarthy DJ, Smyth GK. edgeR: a Bioconductor package for differential expression analysis of digital gene expression data. Bioinformatics. 2010;26:139–140. doi: 10.1093/bioinformatics/btp616. [DOI] [PMC free article] [PubMed] [Google Scholar]
- Serra F, Bau D, Goodstadt M, Castillo D, Filion GJ, Marti-Renom MA. Automatic analysis and 3D-modelling of Hi-C data using TADbit reveals structural features of the fly chromatin colors. PLoS Comput Biol. 2017;13:e1005665. doi: 10.1371/journal.pcbi.1005665. [DOI] [PMC free article] [PubMed] [Google Scholar]
- Shannon P, Markiel A, Ozier O, Baliga NS, Wang JT, Ramage D, Amin N, Schwikowski B, Ideker T. Cytoscape: a software environment for integrated models of biomolecular interaction networks. Genome research. 2003;13:2498–2504. doi: 10.1101/gr.1239303. [DOI] [PMC free article] [PubMed] [Google Scholar]
- Smith TF, Waterman MS. Identification of common molecular subsequences. J Mol Biol. 1981;147:195–197. doi: 10.1016/0022-2836(81)90087-5. [DOI] [PubMed] [Google Scholar]
- Tripathi S, Pohl MO, Zhou Y, Rodriguez-Frandsen A, Wang G, Stein DA, Moulton HM, DeJesus P, Che J, Mulder LC, et al. Meta- and Orthogonal Integration of Influenza “OMICs” Data Defines a Role for UBR4 in Virus Budding. Cell Host Microbe. 2015;18:723–735. doi: 10.1016/j.chom.2015.11.002. [DOI] [PMC free article] [PubMed] [Google Scholar]
- Urich MA, Nery JR, Lister R, Schmitz RJ, Ecker JR. MethylC-seq library preparation for base-resolution whole-genome bisulfite sequencing. Nat Protoc. 2015;10:475–483. doi: 10.1038/nprot.2014.114. [DOI] [PMC free article] [PubMed] [Google Scholar]
- Zhang Y, Liu T, Meyer CA, Eeckhoute J, Johnson DS, Bernstein BE, Nusbaum C, Myers RM, Brown M, Li W, et al. Model-based analysis of ChIP-Seq (MACS) Genome Biol. 2008;9:R137. doi: 10.1186/gb-2008-9-9-r137. [DOI] [PMC free article] [PubMed] [Google Scholar]
- Zhou X, Wang T. Using the Wash U Epigenome Browser to examine genome-wide sequencing data. Curr Protoc Bioinformatics. 2012;Chapter 10(Unit10):10. doi: 10.1002/0471250953.bi1010s40. [DOI] [PMC free article] [PubMed] [Google Scholar]
Supplementary Material
A. (Left) Bones were extracted from 8 – 12 week old female mice and 20 million cells were plated per 15 cm dish in Media with M-CSF for 7 days. (Right) Average number of cells extracted per mouse (C57: 14 harvest (n=53), BALB: 11 harvest (n=54), NOD: 10 harvest (n=47), PWK: 12 harvest (n=99), SPRET: 9 harvest (n=66)). B. Comparison of polyA RNA-seq replicates for C57 in no treatment (left) and after KLA treatment for 1h (right) (TPM = transcripts per kilobase million). C. Clustered Spearman correlation matrix for different RNA-seq replicates for no treatment and KLA 1h. D. Gene dendrogram and module colors from WGCNA analysis.
Gene expression measured by RNA-seq normalized to log2 transcripts per million (TPM) in replicates for all expressed genes (TPM > 1) for BALB, C57, NOD, PWK, and SPRET BMDMs under notx and after KLA 1h treatment.
A. Clustered Spearman correlation matrix for GRO-seq replicates using tag counts along gene bodies for no treatment and KLA 1h. B. Distance of RefSeq annotated transcription start sites (TSS) and TSS defined by 5′GRO-seq data for C57. C. Bar plot showing the percentage of overlap between RefSeq annotated TSS and TSS defined by 5′GRO-seq signal for no treatment and KLA 1h. D. Relationship of differential RNA-seq expression as a function of mutations between -300 and +50 bp of the TSS defined by 5′GRO-seq signal. E. Ratio-ratio plot of gene body GRO-seq tag counts in BMDMs derived from C57 and PWK mice versus allele-specific tag counts in BMDMs derived from PWK x C57 F1 mice. F. Boxplot showing average percentage of cis-regulated genes between parental and F1 alleles (FPC = PWK x C57 F1, FSC = SPRET x C57 F1).
A. Comparison of replicates for PU.1 notx ChIP-seq for C57 (left) and SPRET (right). Grey dots are peaks called in either replicate, green dots are peaks passing IDR. B. Clustered Spearman correlation matrix for PU.1 ChIP-seq replicates (top left), C/EBPβ ChIP-seq replicates (top right), CJUN ChIP-seq replicates (bottom left), and P65 ChIP-seq replicates (bottom right) for all strains in no treatment and KLA 1h conditions (KLA 1h condition only for P65). C–F. Scatter plots of log2 tag counts for H3K4me2 ChIP-seq regions (C), C/EBPβ ChIP-seq peaks (D), CJUN ChIP-seq peaks (E) and P65 ChIP-seq peaks (F) comparing BALB and C57 (left) and SPRET and C57 (right). Regions exhibiting >2-fold or >4-fold different binding are colored light blue and dark blue, respectively. G. Ratio-ratio plot of normalized PU.1 ChIP-seq tag counts in BMDMs derived from C57 and PWK mice versus allele-specific tag counts in BMDMs derived from PWK x C57 F1 mice. H. Boxplot showing average percentage of cis-regulated TF binding sites for all loci with fold change going in the same direction, for all loci with 2-fold change (4-fold change, respectively) in parental and F1 alleles a I. SNP+InDel frequencies in CEBPβ, CJUN and P65 peaks for the indicated strain comparisons. J. Average minimum and maximum tag counts per peak for ATAC-seq (left) and PU.1 (right) with >4-fold difference in binding between C57 versus SPRET without mutations that overlap or do not overlap structural variances. K. Percentage of differently bound ATAC-seq and PU.1 peaks without mutations overlapping structural variances (left panel) and peaks with mutations overlapping structural variances (right panel).
A. Heat map of all significant motifs (p-value < 1e−10) after application of MARGE under notx and KLA treatment conditions. Dendrogram on right shows clustering of consensus motifs by similarity based on Pearson correlation coefficient (PCC). On the left consensus motif logos are shown. B. Top motifs correlated with binding of C/EBPβ under no treatment conditions as determined by MARGE’s motif mutation analysis. Node size is fraction of C/EBPβ peaks containing the indicated motif and edge thickness is proportional to the effect size of motif mutations. Nodes in red indicate motifs in which mutations result in reduced C/EBPβ binding. Nodes in blue indicate motifs in which mutations result in increased C/EBPβ binding. C. Top motifs correlated with binding of CJUN under no treatment conditions as determined by MARGE’s motif mutation analysis. Node size and edge thickness are as defined in Panel B. D. Fraction of strain specific MPF binding explained by mutations in their respective recognition motifs and by all motifs found significant by MARGE analysis. Values are for the 500 most differently bound peaks containing local variants. E. Relationship of mutations in NRF2 motifs on binding of NRF2 and PU.1 in C57 and SPRET BMDMs with intact PU.1, C/EBP, and AP-1 binding motifs. F. Relationship of mutations in USF motifs on binding of USF2 and PU.1 in C57 and SPRET BMDMs with intact PU.1, C/EBP and AP-1 binding motifs.
A. Bar plot showing the average number of peaks within CRDs for different ChIP-seq data sets and treatments B. Bar plot showing the average length of CRDs in kilo bases (kb) for different ChIP-seq data sets and treatments. C. Ratio-ratio plot of normalized PU.1 ChIP-seq tag counts summed for all peaks within CRDs in BMDM derived from C57 and SPRET mice versus allele-specific tag counts in BMDMs derived from SPRET x C57 F1 mice. D. Overlap of CRDs and super enhancers in percentage. CRDs and super enhancers were merged for different assays and percentage of CRDs only, super enhancers only and overlap of both was calculated. E. Relationship of strain-specific ATAC-seq notx CRDs to enhancer activity measured by 5′GRO-seq and expression of nearest expressed gene measured by RNA-seq (tag counts > 16). Significance was calculated using a two-sided t-test.
A. Percentage of CpGs methylated (mCpG) at promoters (defined by RefSeq) of all genes for C57 (green) and SPRET (purple). B. Percentage of CpGs methylated at promoters of genes 2-fold differently expressed in C57 vs. SPRET. C. Percentage of CpGs methylated at promoters of genes 4-fold differently expressed in C57 vs. SPRET. D. UCSC genome browser shot showing promoter methylation for highly differently expressed genes Colce12 (left), Npy (middle) and Igf1 (right). E. Scatter plot of PC1 Eigenvector values comparing C57 and SPRET derived from the respective Hi-C contact maps. F. Expression values of genes associated with Eigenvector values of the same sign (black) in C57 and SPRET BMDMs and genes associated with Eigenvector values of opposite sign (red). G. General conservation of TAD boundaries and contact frequency within TADs measured by inclusion ratio in BMDMs derived from C57 and SPRET mice. H. Fraction of genome covered by ATAC-seq CRDs. I. Distribution of significant PLAC-seq consensus interactions in ATAC-seq CRDs. J. Comparison of overlap of significant PLAC-seq interactions in ATAC-seq CRDs comparisoned to size-matched background shows significant enrichment of PLAC-seq interactions in CRDs.
GRO-seq tag counts along gene bodies normalized to 10 million sequenced reads in replicates for BALB, C57, NOD, PWK, and SPRET BMDMs under notx conditions and after KLA 1h treatment. A minimum of two biological replicates was performed for each mouse strain and condition.
Number of features (peaks or regions) identified for each of assay (ATAC-seq, PU.1 ChIP-seq, CEBPβ, ChIP-seq, CJUN ChIP-seq, P65 ChIP-seq, H3K27ac ChIP-seq and H3K4me2 ChIP-seq) in the five strains of BMDMs under notx and KLA-treated conditions for 1 hour after IDR, as well as the union of features per experiment.
List of all TF binding motifs found significant (p-value of less than 1e−10) in MARGE analysis for at least one factor and treatment condition.
Table S5 (related to Figure 4). Candidate TFs for MARGE analysis results. List of all expressed TFs (TPM > 1) which can bind motifs found as significant by MARGE analysis including the TF, its TF family, as well as RNA-seq expression of this factor in all five strains and treatment (in TPM).
Table S6 (related to Figure 5). Summary of CRDs. List of all CRDs for all assays and treatments, as well as number of CRDs that are strain-specific and strain-similar.
Highlights.
Transcriptomic and genomic analyses of macrophages from 5 diverse strains of mice
Substantial variation in gene expression predicts broad phenotypic differences
A network of >100 transcription factors shapes binding of PU.1, CJUN, C/EBP and NFkB
Evidence for domain-wide control of transcription factor binding and function
Acknowledgments
We thank L. Van Ael for assistance with manuscript preparation and J. Collier for technical assistance. These studies were supported by NIH grants DK091183, CA17390 and GM085764 and a Leducq Transatlantic Network grant to CKG. DNA sequencing was supported by NIH grant DK063491. SHD. is a CRI-Irvington Postdoctoral Fellow. DM was supported by the German Research Council (DFG) within the Collaborative Research Center 1243 (project A16). DS was supported by NIH T32DK007541. TS was supported by the Swedish Society for Medical Research. HCB. was supported by the Sarnoff Cardiovascular Research Foundation Fellowship. TDT was supported by NIH T32DK007044 and T32CA009523. IRH was supported the Dutch MS Research Foundation, and the Gemmy and Mibeth Tichelaar Foundation. CER was supported by NIH-NHLBI R00123485.
Footnotes
Author Contributions
VML, DM, BR, and CKG conceived the study. VML, SHD, HBC, EW, MH, YA, TDT, MS, GJF, TS performed experiments. MY and RH performed PLAC-seq experiments. RF shared PLAC-seq data processing pipeline. VML, IRH, DS, JT, and CER analyzed data. VML and CKG wrote the manuscript with contributions from DM and BR.
Declaration of Interests
The authors declare no conflict of interests.
Publisher's Disclaimer: This is a PDF file of an unedited manuscript that has been accepted for publication. As a service to our customers we are providing this early version of the manuscript. The manuscript will undergo copyediting, typesetting, and review of the resulting proof before it is published in its final citable form. Please note that during the production process errors may be discovered which could affect the content, and all legal disclaimers that apply to the journal pertain.
References
- Andersson R, Gebhard C, Miguel-Escalada I, Hoof I, Bornholdt J, Boyd M, Chen Y, Zhao X, Schmidl C, Suzuki T, et al. An atlas of active enhancers across human cell types and tissues. Nature. 2014;507:455–461. doi: 10.1038/nature12787. [DOI] [PMC free article] [PubMed] [Google Scholar]
- Bogue MA, Grubb SC, Walton DO, Philip VM, Kolishovski G, Stearns T, Dunn MH, Skelly DA, Kadakkuzha B, TeHennepe G, et al. Mouse Phenome Database: an integrative database and analysis suite for curated empirical phenotype data from laboratory mice. Nucleic acids research. 2017 doi: 10.1093/nar/gkx1082. [DOI] [PMC free article] [PubMed] [Google Scholar]
- Buenrostro JD, Giresi PG, Zaba LC, Chang HY, Greenleaf WJ. Transposition of native chromatin for fast and sensitive epigenomic profiling of open chromatin, DNA-binding proteins and nucleosome position. Nature methods. 2013;10:1213–1218. doi: 10.1038/nmeth.2688. [DOI] [PMC free article] [PubMed] [Google Scholar]
- Cheng Y, Ma Z, Kim BH, Wu W, Cayting P, Boyle AP, Sundaram V, Xing X, Dogan N, Li J, et al. Principles of regulatory information conservation between mouse and human. Nature. 2014;515:371–375. doi: 10.1038/nature13985. [DOI] [PMC free article] [PubMed] [Google Scholar]
- Consortium, G.T., Laboratory, D.A., Coordinating Center -Analysis Working, G., Statistical Methods groups-Analysis Working, G., Enhancing, G.g., Fund, N.I.H.C., Nih/Nci, Nih/Nhgri, Nih/Nimh, Nih/Nida, et al. Genetic effects on gene expression across human tissues. Nature. 2017;550:204–213. doi: 10.1038/nature24277. [DOI] [PMC free article] [PubMed] [Google Scholar]
- Core LJ, Waterfall JJ, Lis JT. Nascent RNA sequencing reveals widespread pausing and divergent initiation at human promoters. Science (New York, NY) 2008;322:1845–1848. doi: 10.1126/science.1162228. [DOI] [PMC free article] [PubMed] [Google Scholar]
- Creyghton MP, Cheng AW, Welstead GG, Kooistra T, Carey BW, Steine EJ, Hanna J, Lodato MA, Frampton GM, Sharp PA, et al. Histone H3K27ac separates active from poised enhancers and predicts developmental state. Proceedings of the National Academy of Sciences of the United States of America. 2010;107:21931–21936. doi: 10.1073/pnas.1016071107. [DOI] [PMC free article] [PubMed] [Google Scholar]
- Dixon JR, Selvaraj S, Yue F, Kim A, Li Y, Shen Y, Hu M, Liu JS, Ren B. Topological domains in mammalian genomes identified by analysis of chromatin interactions. Nature. 2012;485:376–380. doi: 10.1038/nature11082. [DOI] [PMC free article] [PubMed] [Google Scholar]
- Eichenfield DZ, Troutman TD, Link VM, Lam MT, Cho H, Gosselin D, Spann NJ, Lesch HP, Tao J, Muto J, et al. Tissue damage drives co-localization of NF-kappaB, Smad3, and Nrf2 to direct Rev-erb sensitive wound repair in mouse macrophages. Elife. 2016;5 doi: 10.7554/eLife.13024. [DOI] [PMC free article] [PubMed] [Google Scholar]
- Fang R, Yu M, Li G, Chee S, Liu T, Schmitt AD, Ren B. Mapping of long-range chromatin interactions by proximity ligation-assisted ChIP-seq. Cell Res. 2016;26:1345–1348. doi: 10.1038/cr.2016.137. [DOI] [PMC free article] [PubMed] [Google Scholar]
- Genomes Project, C. Auton A, Brooks LD, Durbin RM, Garrison EP, Kang HM, Korbel JO, Marchini JL, McCarthy S, McVean GA, et al. A global reference for human genetic variation. Nature. 2015;526:68–74. doi: 10.1038/nature15393. [DOI] [PMC free article] [PubMed] [Google Scholar]
- Gosselin D, Link VM, Romanoski CE, Fonseca GJ, Eichenfield DZ, Spann NJ, Stender JD, Chun HB, Garner H, Geissmann F, et al. Environment drives selection and function of enhancers controlling tissue-specific macrophage identities. Cell. 2014;159:1327–1340. doi: 10.1016/j.cell.2014.11.023. [DOI] [PMC free article] [PubMed] [Google Scholar]
- Grubert F, Zaugg JB, Kasowski M, Ursu O, Spacek DV, Martin AR, Greenside P, Srivas R, Phanstiel DH, Pekowska A, et al. Genetic Control of Chromatin States in Humans Involves Local and Distal Chromosomal Interactions. Cell. 2015;162:1051–1065. doi: 10.1016/j.cell.2015.07.048. [DOI] [PMC free article] [PubMed] [Google Scholar]
- Hah N, Danko CG, Core L, Waterfall JJ, Siepel A, Lis JT, Kraus WL. A rapid, extensive, and transient transcriptional response to estrogen signaling in breast cancer cells. Cell. 2011;145:622–634. doi: 10.1016/j.cell.2011.03.042. [DOI] [PMC free article] [PubMed] [Google Scholar]
- Hajkova P, el-Maarri O, Engemann S, Oswald J, Olek A, Walter J. DNA-methylation analysis by the bisulfite-assisted genomic sequencing method. Methods Mol Biol. 2002;200:143–154. doi: 10.1385/1-59259-182-5:143. [DOI] [PubMed] [Google Scholar]
- He HH, Meyer CA, Shin H, Bailey ST, Wei G, Wang Q, Zhang Y, Xu K, Ni M, Lupien M, et al. Nucleosome dynamics define transcriptional enhancers. Nature genetics. 2010;42:343–347. doi: 10.1038/ng.545. [DOI] [PMC free article] [PubMed] [Google Scholar]
- Heinz S, Benner C, Spann N, Bertolino E, Lin YC, Laslo P, Cheng JX, Murre C, Singh H, Glass CK. Simple Combinations of Lineage-Determining Transcription Factors Prime cis-Regulatory Elements Required for Macrophage and B Cell Identities. Molecular cell. 2010;38:576–589. doi: 10.1016/j.molcel.2010.05.004. [DOI] [PMC free article] [PubMed] [Google Scholar]
- Heinz S, Romanoski CE, Benner C, Allison KA, Kaikkonen MU, Orozco LD, Glass CK. Effect of natural genetic variation on enhancer selection and function. Nature. 2013 doi: 10.1038/nature12615. [DOI] [PMC free article] [PubMed] [Google Scholar]
- Heinz S, Romanoski CE, Benner C, Glass CK. The selection and function of cell type-specific enhancers. Nature reviews Molecular cell biology. 2015 doi: 10.1038/nrm3949. [DOI] [PMC free article] [PubMed] [Google Scholar]
- Iwafuchi-Doi M, Zaret KS. Pioneer transcription factors in cell reprogramming. Genes & development. 2014;28:2679–2692. doi: 10.1101/gad.253443.114. [DOI] [PMC free article] [PubMed] [Google Scholar]
- Jin F, Li Y, Ren B, Natarajan R. PU.1 and C/EBP(alpha) synergistically program distinct response to NF-kappaB activation through establishing monocyte specific enhancers. Proceedings of the National Academy of Sciences of the United States of America. 2011;108:5290–5295. doi: 10.1073/pnas.1017214108. [DOI] [PMC free article] [PubMed] [Google Scholar]
- Kaikkonen MU, Spann NJ, Heinz S, Romanoski CE, Allison KA, Stender JD, Chun HB, Tough DF, Prinjha RK, Benner C, et al. Remodeling of the Enhancer Landscape during Macrophage Activation Is Coupled to Enhancer Transcription. Molecular cell. 2013;51:310–325. doi: 10.1016/j.molcel.2013.07.010. [DOI] [PMC free article] [PubMed] [Google Scholar]
- Keane TM, Goodstadt L, Danecek P, White MA, Wong K, Yalcin B, Heger A, Agam A, Slater G, Goodson M, et al. Mouse genomic variation and its effect on phenotypes and gene regulation. Nature. 2011;477:289–294. doi: 10.1038/nature10413. [DOI] [PMC free article] [PubMed] [Google Scholar]
- Lam MT, Cho H, Lesch HP, Gosselin D, Heinz S, Tanaka-Oishi Y, Benner C, Kaikkonen MU, Kim AS, Kosaka M, et al. Rev-Erbs repress macrophage gene expression by inhibiting enhancer-directed transcription. Nature. 2013;498:511–515. doi: 10.1038/nature12209. [DOI] [PMC free article] [PubMed] [Google Scholar]
- Langfelder P, Horvath S. WGCNA: an R package for weighted correlation network analysis. BMC Bioinformatics. 2008;9:559. doi: 10.1186/1471-2105-9-559. [DOI] [PMC free article] [PubMed] [Google Scholar]
- Lavin Y, Winter D, Blecher-Gonen R, David E, Keren-Shaul H, Merad M, Jung S, Amit I. Tissue-resident macrophage enhancer landscapes are shaped by the local microenvironment. Cell. 2014;159:1312–1326. doi: 10.1016/j.cell.2014.11.018. [DOI] [PMC free article] [PubMed] [Google Scholar]
- Levine M. Transcriptional enhancers in animal development and evolution. Current biology: CB. 2010;20:R754–763. doi: 10.1016/j.cub.2010.06.070. [DOI] [PMC free article] [PubMed] [Google Scholar]
- Li Q, Brown JB, Huang H, Bickel J. Measuring reproducibility of high-throughput experiments. The Annals of Applied Statistics. 2011;5:1752–1779. [Google Scholar]
- Link VM, Romanoski CE, Metzler D, Glass CK. MARGE: Mutation analysis of Regulatory Genomic Elements. bioRxiv. 2018 doi: 10.1093/nar/gky491. [DOI] [PMC free article] [PubMed]
- Love MI, Huber W, Anders S. Moderated estimation of fold change and dispersion for RNA-seq data with DESeq2. Genome Biol. 2014;15:550. doi: 10.1186/s13059-014-0550-8. [DOI] [PMC free article] [PubMed] [Google Scholar]
- Lusis AJ, Seldin MM, Allayee H, Bennett BJ, Civelek M, Davis RC, Eskin E, Farber CR, Hui S, Mehrabian M, et al. The Hybrid Mouse Diversity Panel: a resource for systems genetics analyses of metabolic and cardiovascular traits. J Lipid Res. 2016;57:925–942. doi: 10.1194/jlr.R066944. [DOI] [PMC free article] [PubMed] [Google Scholar]
- Raetz CR, Garrett TA, Reynolds CM, Shaw WA, Moore JD, Smith DC, Jr, Ribeiro AA, Murphy RC, Ulevitch RJ, Fearns C, et al. Kdo2-Lipid A of Escherichia coli, a defined endotoxin that activates macrophages via TLR-4. J Lipid Res. 2006;47:1097–1111. doi: 10.1194/jlr.M600027-JLR200. [DOI] [PubMed] [Google Scholar]
- Rao SS, Huntley MH, Durand NC, Stamenova EK, Bochkov ID, Robinson JT, Sanborn AL, Machol I, Omer AD, Lander ES, et al. A 3D map of the human genome at kilobase resolution reveals principles of chromatin looping. Cell. 2014;159:1665–1680. doi: 10.1016/j.cell.2014.11.021. [DOI] [PMC free article] [PubMed] [Google Scholar]
- Roadmap Epigenomics C. Kundaje A, Meuleman W, Ernst J, Bilenky M, Yen A, Heravi-Moussavi A, Kheradpour P, Zhang Z, Wang J, et al. Integrative analysis of 111 reference human epigenomes. Nature. 2015;518:317–330. doi: 10.1038/nature14248. [DOI] [PMC free article] [PubMed] [Google Scholar]
- Shlyueva D, Stampfel G, Stark A. Transcriptional enhancers: from properties to genome-wide predictions. Nature reviews Genetics. 2014;15:272–286. doi: 10.1038/nrg3682. [DOI] [PubMed] [Google Scholar]
- Soufi A, Garcia MF, Jaroszewicz A, Osman N, Pellegrini M, Zaret KS. Pioneer Transcription Factors Target Partial DNA Motifs on Nucleosomes to Initiate Reprogramming. Cell. 2015 doi: 10.1016/j.cell.2015.03.017. [DOI] [PMC free article] [PubMed] [Google Scholar]
- Stergachis AB, Neph S, Sandstrom R, Haugen E, Reynolds AP, Zhang M, Byron R, Canfield T, Stelhing-Sun S, Lee K, et al. Conservation of trans-acting circuitry during mammalian regulatory evolution. Nature. 2014;515:365–370. doi: 10.1038/nature13972. [DOI] [PMC free article] [PubMed] [Google Scholar]
- Waszak SM, Delaneau O, Gschwind AR, Kilpinen H, Raghav SK, Witwicki RM, Orioli A, Wiederkehr M, Panousis NI, Yurovsky A, et al. Population Variation and Genetic Control of Modular Chromatin Architecture in Humans. Cell. 2015;162:1039–1050. doi: 10.1016/j.cell.2015.08.001. [DOI] [PubMed] [Google Scholar]
- Wynn TA, Chawla A, Pollard JW. Macrophage biology in development, homeostasis and disease. Nature. 2013;496:445–455. doi: 10.1038/nature12034. [DOI] [PMC free article] [PubMed] [Google Scholar]
Associated Data
This section collects any data citations, data availability statements, or supplementary materials included in this article.
Supplementary Materials
A. (Left) Bones were extracted from 8 – 12 week old female mice and 20 million cells were plated per 15 cm dish in Media with M-CSF for 7 days. (Right) Average number of cells extracted per mouse (C57: 14 harvest (n=53), BALB: 11 harvest (n=54), NOD: 10 harvest (n=47), PWK: 12 harvest (n=99), SPRET: 9 harvest (n=66)). B. Comparison of polyA RNA-seq replicates for C57 in no treatment (left) and after KLA treatment for 1h (right) (TPM = transcripts per kilobase million). C. Clustered Spearman correlation matrix for different RNA-seq replicates for no treatment and KLA 1h. D. Gene dendrogram and module colors from WGCNA analysis.
Gene expression measured by RNA-seq normalized to log2 transcripts per million (TPM) in replicates for all expressed genes (TPM > 1) for BALB, C57, NOD, PWK, and SPRET BMDMs under notx and after KLA 1h treatment.
A. Clustered Spearman correlation matrix for GRO-seq replicates using tag counts along gene bodies for no treatment and KLA 1h. B. Distance of RefSeq annotated transcription start sites (TSS) and TSS defined by 5′GRO-seq data for C57. C. Bar plot showing the percentage of overlap between RefSeq annotated TSS and TSS defined by 5′GRO-seq signal for no treatment and KLA 1h. D. Relationship of differential RNA-seq expression as a function of mutations between -300 and +50 bp of the TSS defined by 5′GRO-seq signal. E. Ratio-ratio plot of gene body GRO-seq tag counts in BMDMs derived from C57 and PWK mice versus allele-specific tag counts in BMDMs derived from PWK x C57 F1 mice. F. Boxplot showing average percentage of cis-regulated genes between parental and F1 alleles (FPC = PWK x C57 F1, FSC = SPRET x C57 F1).
A. Comparison of replicates for PU.1 notx ChIP-seq for C57 (left) and SPRET (right). Grey dots are peaks called in either replicate, green dots are peaks passing IDR. B. Clustered Spearman correlation matrix for PU.1 ChIP-seq replicates (top left), C/EBPβ ChIP-seq replicates (top right), CJUN ChIP-seq replicates (bottom left), and P65 ChIP-seq replicates (bottom right) for all strains in no treatment and KLA 1h conditions (KLA 1h condition only for P65). C–F. Scatter plots of log2 tag counts for H3K4me2 ChIP-seq regions (C), C/EBPβ ChIP-seq peaks (D), CJUN ChIP-seq peaks (E) and P65 ChIP-seq peaks (F) comparing BALB and C57 (left) and SPRET and C57 (right). Regions exhibiting >2-fold or >4-fold different binding are colored light blue and dark blue, respectively. G. Ratio-ratio plot of normalized PU.1 ChIP-seq tag counts in BMDMs derived from C57 and PWK mice versus allele-specific tag counts in BMDMs derived from PWK x C57 F1 mice. H. Boxplot showing average percentage of cis-regulated TF binding sites for all loci with fold change going in the same direction, for all loci with 2-fold change (4-fold change, respectively) in parental and F1 alleles a I. SNP+InDel frequencies in CEBPβ, CJUN and P65 peaks for the indicated strain comparisons. J. Average minimum and maximum tag counts per peak for ATAC-seq (left) and PU.1 (right) with >4-fold difference in binding between C57 versus SPRET without mutations that overlap or do not overlap structural variances. K. Percentage of differently bound ATAC-seq and PU.1 peaks without mutations overlapping structural variances (left panel) and peaks with mutations overlapping structural variances (right panel).
A. Heat map of all significant motifs (p-value < 1e−10) after application of MARGE under notx and KLA treatment conditions. Dendrogram on right shows clustering of consensus motifs by similarity based on Pearson correlation coefficient (PCC). On the left consensus motif logos are shown. B. Top motifs correlated with binding of C/EBPβ under no treatment conditions as determined by MARGE’s motif mutation analysis. Node size is fraction of C/EBPβ peaks containing the indicated motif and edge thickness is proportional to the effect size of motif mutations. Nodes in red indicate motifs in which mutations result in reduced C/EBPβ binding. Nodes in blue indicate motifs in which mutations result in increased C/EBPβ binding. C. Top motifs correlated with binding of CJUN under no treatment conditions as determined by MARGE’s motif mutation analysis. Node size and edge thickness are as defined in Panel B. D. Fraction of strain specific MPF binding explained by mutations in their respective recognition motifs and by all motifs found significant by MARGE analysis. Values are for the 500 most differently bound peaks containing local variants. E. Relationship of mutations in NRF2 motifs on binding of NRF2 and PU.1 in C57 and SPRET BMDMs with intact PU.1, C/EBP, and AP-1 binding motifs. F. Relationship of mutations in USF motifs on binding of USF2 and PU.1 in C57 and SPRET BMDMs with intact PU.1, C/EBP and AP-1 binding motifs.
A. Bar plot showing the average number of peaks within CRDs for different ChIP-seq data sets and treatments B. Bar plot showing the average length of CRDs in kilo bases (kb) for different ChIP-seq data sets and treatments. C. Ratio-ratio plot of normalized PU.1 ChIP-seq tag counts summed for all peaks within CRDs in BMDM derived from C57 and SPRET mice versus allele-specific tag counts in BMDMs derived from SPRET x C57 F1 mice. D. Overlap of CRDs and super enhancers in percentage. CRDs and super enhancers were merged for different assays and percentage of CRDs only, super enhancers only and overlap of both was calculated. E. Relationship of strain-specific ATAC-seq notx CRDs to enhancer activity measured by 5′GRO-seq and expression of nearest expressed gene measured by RNA-seq (tag counts > 16). Significance was calculated using a two-sided t-test.
A. Percentage of CpGs methylated (mCpG) at promoters (defined by RefSeq) of all genes for C57 (green) and SPRET (purple). B. Percentage of CpGs methylated at promoters of genes 2-fold differently expressed in C57 vs. SPRET. C. Percentage of CpGs methylated at promoters of genes 4-fold differently expressed in C57 vs. SPRET. D. UCSC genome browser shot showing promoter methylation for highly differently expressed genes Colce12 (left), Npy (middle) and Igf1 (right). E. Scatter plot of PC1 Eigenvector values comparing C57 and SPRET derived from the respective Hi-C contact maps. F. Expression values of genes associated with Eigenvector values of the same sign (black) in C57 and SPRET BMDMs and genes associated with Eigenvector values of opposite sign (red). G. General conservation of TAD boundaries and contact frequency within TADs measured by inclusion ratio in BMDMs derived from C57 and SPRET mice. H. Fraction of genome covered by ATAC-seq CRDs. I. Distribution of significant PLAC-seq consensus interactions in ATAC-seq CRDs. J. Comparison of overlap of significant PLAC-seq interactions in ATAC-seq CRDs comparisoned to size-matched background shows significant enrichment of PLAC-seq interactions in CRDs.
GRO-seq tag counts along gene bodies normalized to 10 million sequenced reads in replicates for BALB, C57, NOD, PWK, and SPRET BMDMs under notx conditions and after KLA 1h treatment. A minimum of two biological replicates was performed for each mouse strain and condition.
Number of features (peaks or regions) identified for each of assay (ATAC-seq, PU.1 ChIP-seq, CEBPβ, ChIP-seq, CJUN ChIP-seq, P65 ChIP-seq, H3K27ac ChIP-seq and H3K4me2 ChIP-seq) in the five strains of BMDMs under notx and KLA-treated conditions for 1 hour after IDR, as well as the union of features per experiment.
List of all TF binding motifs found significant (p-value of less than 1e−10) in MARGE analysis for at least one factor and treatment condition.
Table S5 (related to Figure 4). Candidate TFs for MARGE analysis results. List of all expressed TFs (TPM > 1) which can bind motifs found as significant by MARGE analysis including the TF, its TF family, as well as RNA-seq expression of this factor in all five strains and treatment (in TPM).
Table S6 (related to Figure 5). Summary of CRDs. List of all CRDs for all assays and treatments, as well as number of CRDs that are strain-specific and strain-similar.