

Summary
Degrons are minimal elements that mediate the interaction of proteins with degradation machineries to promote proteolysis. Despite their central role in proteostasis, the number of known degrons remains small and a facile technology to characterize them is lacking. Using a strategy combining Global Protein Stability (GPS) profiling with a synthetic human peptidome, we identify thousands of peptides containing degron activity. Using CRISPR screening, we established that the stability of many proteins is regulated through degrons located at their C-terminus. We characterize eight Cullin-RING E3 ubiquitin ligase (CRL) complexes adaptors that regulate C-terminal degrons including six CRL2 and two CRL4 complexes and computationally implicate multiple non-CRLs in end recognition. Human proteome analysis revealed that the C-termini of eukaryotic proteins are depleted for C-terminal degrons, suggesting an E3 ligase-dependent modulation of proteome composition. Thus, we propose that a series of ‘C-end rules’ operate to govern protein stability and shape the eukaryotic proteome.
Graphical abstract
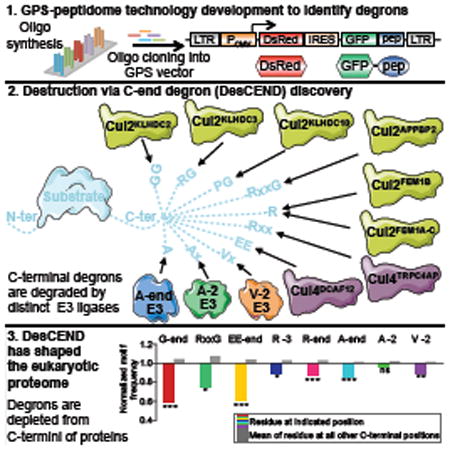
A class of C-terminal protein sequence degrons regulate mammalian protein stability via interactions with Cullin RING ubiquitin ligase complexes.
Introduction
Protein degradation plays a key role in nearly all cellular processes. The importance of this role is underscored by the fact that nearly 5% of mammalian genes are dedicated to the control of protein stability (Clague et al., 2015; Peng et al., 2003). Failure to maintain protein homeostasis can lead to a variety of pathological disorders, including inflammation, neurodegeneration and cancer (Popovic et al., 2014).
The ubiquitin-proteasome system (UPS) represents the major route by which the cell degrades unwanted proteins (Kwon and Ciechanover, 2017), with E3 ubiquitin ligases (E3) playing a crucial role in providing specificity to this process (Zheng and Shabek, 2017). The Cullin-RING E3 ligases (CRL) represent the largest E3 sub-family. Six main Cullins are found in human cells. They function as scaffolds to recruit target substrates through Cullin adaptor proteins which bind at their N-terminus, together with E2s which bind at their C-terminus (Lydeard et al., 2013). Previously, using the small molecule pan-Cullin inhibitor MLN4924 (Soucy et al., 2009) combined with the Global Protein Stability (GPS) approach developed in our lab and other proteomic approaches, we and others identified hundreds of CRL substrates (Bennett et al., 2010; Emanuele et al., 2011; Harper and Tan, 2012; Liao et al., 2011; Yen and Elledge, 2008; Yen et al., 2008).
A major challenge towards the goal of a systems-level understanding of the UPS is to understand in molecular detail how the approximately 600 E3s select their substrates. In most cases it is thought that E3s bind their substrates through recognition of specific short peptide motifs termed degrons (Lucas and Ciulli, 2017; Varshavsky, 1991). An important property of degrons is transferability, such that fusion of a degron can confer instability on an otherwise long-lived protein. The first degrons discovered were N-degrons (Bachmair et al., 1986), leading to the discovery of the N-end rule pathway (Varshavsky, 2011).
Despite their importance, to date only a handful of degrons have been identified and matched to their cognate E3s (Meszaros et al., 2017). Degron discovery remains challenging, mainly because (1) for most E3s no substrates have been identified, and (2) the mean size of human proteins is large (∼470 amino acids), which makes mapping degron motifs in the context of the full-length proteins labor-intensive.
Here, by combining GPS technology with a synthetic representation of the human peptidome, we present a high-throughput method to identify degron sequences in human proteins. Coupling this approach with CRISPR-mediated genetic screens, we uncovered a mechanism, DesCEND (Destruction via C-End Degrons), described here and in a related manuscript (Lin et al., submitted) in which many unstable peptides targeted by CRLs are recognized through distinct C-terminal degrons. In total we identify six CRL2 and two CRL4 complexes that target C-terminal degrons, and computationally uncover multiple C-terminal degrons not recognized by CRLs. Eukaryotic proteomes are depleted of proteins bearing C-terminal degron motifs, suggesting that the recognition of C-terminal degrons by E3s has sculpted eukaryotic proteomes through evolution.
Results
Characterizing degron motifs in human proteins using GPS-peptidome technology
Towards the goal of establishing a systems level understanding of the specificity of E3s, we sought to develop a genome-wide approach to characterize degron motifs in mammalian proteins. To accomplish this we combined GPS technology (Emanuele et al., 2011; Yen and Elledge, 2008; Yen et al., 2008) with a peptidome library covering the entire human proteome synthesized on high-density oligonucleotide microarrays. GPS is based on a lentiviral construct encoding two fluorescent proteins: DsRed, which serves as an internal reference, and a GFP fusion protein that is translated from an internal ribosome entry site (IRES) (Figure 1A). As both DsRed and GFP are expressed from the same transcript, the GFP/DsRed ratio can be used to readout the effect of the fusion partner on the stability of GFP.
Figure 1. CRISPR screening combined with GPS profiling of a synthetic human peptidome identifies multiple CRL2 complexes targeting unstable peptides.
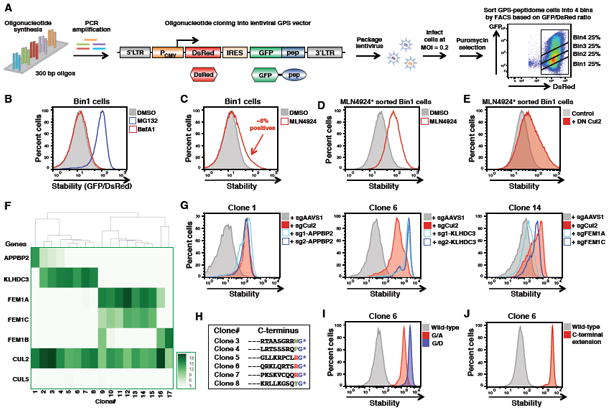
(A) Overview of GPS-peptidome library construction and screening pipeline.
(B) Stabilization of unstable GFP-peptide fusions in the Bin1 population upon treatment for 5 h with 5 mM of the proteasome inhibitor MG132, or 100 nM of the lysosomal inhibitor Bafilomycin A1 (BafA1), as assessed by FACS.
(C to E) Isolation of CRL substrates. (C) Bin1 population was treated for 5 h with 1 μM of MLN4924. Cells expressing stabilized GFP-peptide fusion peptides were then purified by FACS, and, after recovery, reanalyzed following MLN4924 treatment (D). Expression of DN Cullins for 24 h followed by FACS analysis (E, see also Figure S1D).
(F) The heatmap represents the CRISPR screen MAGeCK scores for the indicated genes across each of the 17 individual clones. The full data for each clone is shown in Figure S2.
(G) CRISPR-mediated ablation of the indicated genes in selected clones resulted in the stabilization of the GFP-peptide fusion proteins. An sgRNA targeting AAVS1 was used as a negative control.
(H to J) KLHDC3 recognizes glycine-ended substrates. Six of the KLHDC3 substrates identified in the CRISPR screen terminated in glycine (H). For one example substrate (clone 6), mutation of the terminal glycine stabilized the GFP-peptide fusion (I), as did repositioning the glycine by adding an additional 10 amino acids (-DNYNEPKANQ*) at the C-terminus (J). See also Figures S1 and S2.
An oligonucleotide library encoding a synthetic representation of the human proteome, arranged as a series of 90 residue peptides overlapping by 45 residues, was cloned downstream of the GFP reporter. The resulting ‘GPS-peptidome’ library was packaged into lentiviral particles and used to infect HEK-293T cells at a low multiplicity of infection (MOI); untransduced cells were eliminated through puromycin selection. Fluorescence-activated cell sorting (FACS) was used to partition the population into four bins of equal size based on the stability of the GFP-peptide fusion (Figures 1A and S1A). Subsequently we focused on the most unstable pool (Bin1), which contained thousands of GFP-peptide fusions that are proteasome substrates (Figure 1B) and were at least an order of magnitude less stable than GFP alone (Figure S1B).
CRISPR/Cas9 screens identify CRL2 adaptors mediating the degradation of unstable peptides
To simplify the task of identifying the proteins responsible for the degradation of the unstable peptides, we focused a single E3 class, the CRL family. Treatment of the GPS-peptidome Bin1 cells with MLN4924 resulted in the stabilization of ∼8% of GFP-peptide fusions (Figures 1C and S1C). Cells expressing MLN4924-responsive substrates were isolated by FACS (Figure 1D). Next we asked which of six Cullins were responsible for degrading the GFP-peptide fusions. Exogenous expression of C-terminally truncated dominant-negative (DN) versions of Cul2 and Cul5 resulted in marked stabilization of the MLN4924-responsive pool, whereas the other DN Cullins had more modest effects (Figures 1E and S1D).
To identify the CRL2/5 adaptors responsible for targeting the unstable GFP-peptide fusions we performed a series of CRISPR genetic screens. Single cell clones of 17 GFP-peptide fusions stabilized by expression of DN Cul2 and Cul5 were selected at random, and each clone was transduced with an sgRNA library targeting known adaptors for CRL2/5 (Figure S2A; Table S1). Cells in which disruption of a CRL adaptor resulted in stabilization were isolated by FACS, and the sgRNAs enriched in this population were identified by DNA sequencing (Figure S2A; Table S1). In each case, CRL2, but not CRL5, was required for degradation of the GFP-peptide fusion (Figures 1F and S2B). The 17 clones could be clustered into four broad groups based on their requirements for CRL2 adaptors: 7 (clones 2-8) are regulated by KLHDC3, 7 (clones 9-15) by both FEM1A and FEM1C, while FEM1B had a significant effect in 3 (clones 9, 16 and 17). Finally, APPBP2 loss strongly impaired the degradation of the GFP-peptide fusion in clone 1, and weakly in clones 2-4, which are also targeted by KLHDC3 (Figure 1F). These results were validated by individual adaptor disruption experiments in one clone from each group (Figure 1G).
The CRL2 adaptor KLDC3 targets glycine-ended peptides for proteasomal degradation
Sequence analysis of the 17 clones (Table S1) revealed that 6 of 7 peptides regulated by KLHDC3 terminated with a C-terminal glycine (the 7th ended with alanine) (Figure 1H). The previously reported KLHDC3 substrate, SEPHS2 (Lin et al., 2015), also terminated with a glycine, raising the possibility that KLHDC3 recognizes its substrates through a specific interaction with an exposed C-terminal glycine residue. Co-immunoprecipitation experiments demonstrated that KLHDC3 physically interacted with its GFP-peptide substrates (Figures S1E-G), while mutational analysis showed that alteration of the C-terminal glycine residue alone stabilized the GFP-peptide fusion: substitution of the glycine to aspartic acid resulted in marked stabilization, while substitution to alanine, which differs from glycine only by a single methyl group, resulted in partial stabilization (Figures 1I and S1H). Adding additional amino acids to the C-terminus of the peptide also led to stabilization (Figures 1J and S1I), indicating that the glycine residue only serves as a functional degron when located at the C-terminus. Therefore, Cul2KLHDC3 targets glycine-ended peptides for proteasomal degradation.
A GPS-ORFeome screen demonstrates CRL2-mediated degradation of glycine-ended full-length proteins
We extended these observations by examining whether full-length proteins ending with glycine were also targeted for degradation by CRL2. To do this, we performed a GPS experiment in which full-length proteins were fused to GFP (Figure 2). We cloned a library of ∼15,000 cDNA constructs encoding full-length human proteins into the GPS vector. To allow the identity of the encoded protein to be determined through Illumina sequencing, a library of ‘barcode’ sequences were added at the 3′ end of each construct, with each ORF represented by on average 5 different barcodes to provide internal replicates (Figure 2A).
Figure 2. A GPS-ORFeome screen identifies full-length glycine-ended proteins as CRL2 substrates.
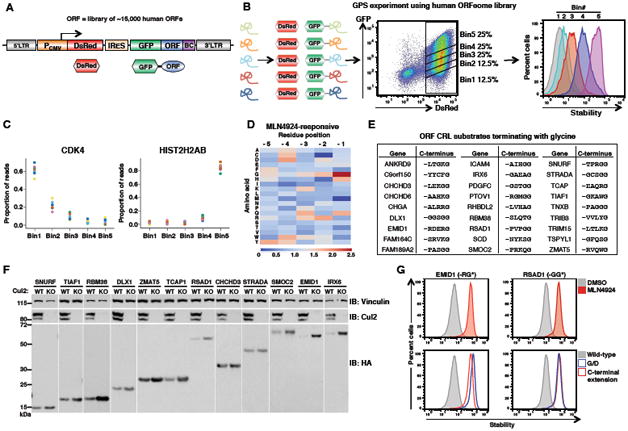
(A)Schematic representation of the GPS lentiviral vector. BC- barcode
(B) Schematic representation of the GPS-ORFeome screen.
(C) Example profiles for one unstable protein (CDK4) and one stable protein (HIST2H2AB) are shown. Each color series represents the distribution of sequencing reads for an individual barcode attached to the same GFP-ORF fusion.
(D) Heatmap showing the relative proportions of each amino acid across the last five C-terminal residues of the ORFs stabilized by MLN4924 compared to the whole GPS-ORFeome library.
(E) List of high confidence CRL substrates identified from the GPS-ORFeome screen that terminated with glycine.
(F) Twelve candidate genes were selected at random from the list in (E), expressed with an N-terminal HA epitope tag in either wild-type (WT) or Cul2 knockout (KO) HEK-293T cells, and protein abundance assessed by immunoblot (IB).
(G) For two example GPS-ORF substrates, treatment with 1 μM MLN4924 for 5 h stabilized the wild-type proteins (top row), while mutation of the C-terminal glycine or the addition of one extra residue to the C-terminus resulted in peptide stabilization (bottom row). See also Figure S3.
HEK-293T cells were infected with the barcoded GPS-ORFeome library and sorted into five bins based on the GFP/DsRed ratio (Figure 2B). Illumina sequencing revealed that the barcoding strategy allowed reproducible identification of the encoded ORF (Figures 2C and S3A; Table S2). Proteasomal degradation was again the dominant mechanism driving instability of the fusion proteins (Figure S3B).
To identify CRL substrates we treated the three most unstable populations with MLN4924 and isolated cells expressing stabilized GFP-ORF fusion proteins by FACS, followed by a 2nd round of sorting without MLN4924 (Figures S3C and S3D). Then the CRL substrates identified through sequencing of the ORF barcodes. Notably, sequence analysis of the C-termini of the CRL substrates revealed that glycine at the terminal position was the most enriched feature (Figure 2D). The 27 glycine-ended CRL substrates identified are listed in Figure 2E. Again CRL2 was responsible for the degradation of the majority of the CRL substrates (Figure S3E), and by immunoblot we validated that Cul2 ablation resulted in the stabilization of a panel of exogenously expressed glycine-ended HA-epitope tagged substrates (Figure 2F). For two example substrates, we also confirmed that the C-terminal glycine was indeed critical for CRL2-mediated degradation (Figure 2G). Thus, CRL2 complexes are also responsible for the degradation of full-length proteins ending with glycine.
Glycine-ended proteins are underrepresented in eukaryotic proteomes
Strikingly, we found that the presence of glycine specifically at the C-terminus was negatively correlated with protein stability in our GPS-ORF dataset (Figure 3A). This information, together with the knowledge that full-length proteins ending in glycine are substrates for CRL-mediated degradation, prompted us to examine the overall amino acid composition of the terminal regions of the eukaryotic proteome. This analysis revealed several surprising features. First, the composition of the C-terminal residue of eukaryotic proteins is more variable than all other positions, suggesting that the amino acid present at the C-terminus is particularly important (Figure 3B). Second, glycine is strongly depleted at the terminal position, with glycine-ended proteins occurring at ∼65% of the expected frequency (P < 10-164) (Figure 3B). Both of these effects are observed across a range of eukaryotic organisms (Figures 3C and 3D).
Figure 3. C-terminal glycine correlates with protein instability and is depleted from eukaryotic proteomes.
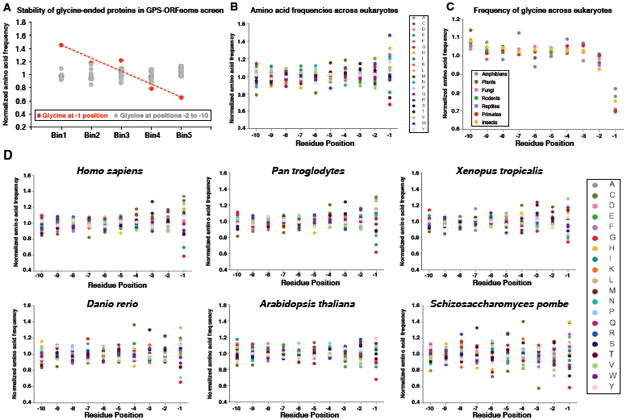
(A) C-terminal glycine correlates with instability: ORFs terminating in glycine are enriched in Bin1 and depleted from Bin5. Glycine at the terminal (-1) position is depicted in red, while glycine at all other positions in the last ten residues is shown in gray.
(B) Normalized amino acid frequencies across the last ten residues of eukaryotic proteins.
(C) Normalized frequency of glycine across the last ten residues of proteomes from the indicated taxa.
(D) Amino acid proportions across the last ten positions of each proteome are shown. The data for each residue are normalized to the mean proportion across the last ten positions.
We hypothesized that the depletion of glycine at the C-termini of eukaryotic proteins is a result of avoidance of E3s targeting G-end degrons. If so, amino acids at the penultimate (-2) position that favor degron function should be depleted among existing glycine-ended proteins relative to amino acids that disrupt degron function.
Defining the composition of glycine-end degrons targeted by CRLs
To distinguish these possibilities, we needed to precisely define the amino acid requirements of glycine-end degrons. We began by assessing the extent of the degron recognized by KLHDC3 by performing alanine-scanning mutagenesis across the last 10 residues for 5 peptides substrates from the original CRISPR screens (Table S3). In each case, mutation of the terminal glycine to alanine resulted in stabilization; mutation of the amino acid at the penultimate position also prevented degradation in some cases (Figure S4A). For one peptide substrate we also performed a saturation mutagenesis experiment, mutating each residue to every other possible amino acid across the 12 terminal residues (Figure S4B; Table S4). This confirmed that the C-terminal glycine residue was absolutely critical for degradation, with only alanine being partially tolerated at the -1 position. Some preferences were also observed at the -2 and -3 positions, where acidic and small hydrophobic residues inhibited degradation (Figure S4B).
To delineate a consensus sequence for the Cul2KLHDC3 degron, we sought to identify a larger number of KLHDC3 substrates. Starting with the MLN4924-responsive pool of unstable GPS-peptide substrates (Figure 1D), we disrupted KLHDC3 function using two independent sgRNAs and isolated cells displaying stabilization of the GFP-peptide fusions by FACS (Figure S4C; Table S5). In total this revealed 65 unique KLHDC3 substrates, 69% of which ended with glycine and 19% ended with alanine. At the -2 position the basic residues arginine and lysine were enriched in addition to glutamine and serine, while acidic and hydrophobic residues were disfavored (Figures S4D and S4E).
The CRL2 adaptors KLHDC2, KLHDC3 and KLHDC10 cooperate to degrade glycine-ended proteins
To explore the possibility that additional E3s beyond Cul2KLHDC3 might also target glycine-ended proteins, we performed an additional GPS experiment in which 2,245 56-mer peptides representing the C-terminal tails of all known isoforms of human proteins ending with glycine were fused to GFP (Table S6). This ‘G-end’ library was expressed in HEK-293T cells and the cells partitioned into 3 bins based on stability by FACS (Figure 4A). Sequencing of the fusion peptides in each bin revealed major differences in amino acid composition at the -2 position in the unstable (Bin1) versus the stable (Bin3) populations. Glycine and arginine were enriched in the unstable pool and depleted from the stable pool, suggesting efficient degradation of GFP-peptide fusions ending in -GG and –RG, while for other amino acids, such as aspartic acid and glutamic acid, the opposite pattern was observed, suggesting inefficient recognition of peptides terminating in –DG and –EG (Figure S4F).
Figure 4. The CRL2 adaptors KLHDC2, KLHDC3 and KLHDC10 target distinct C-terminal glycine degrons.
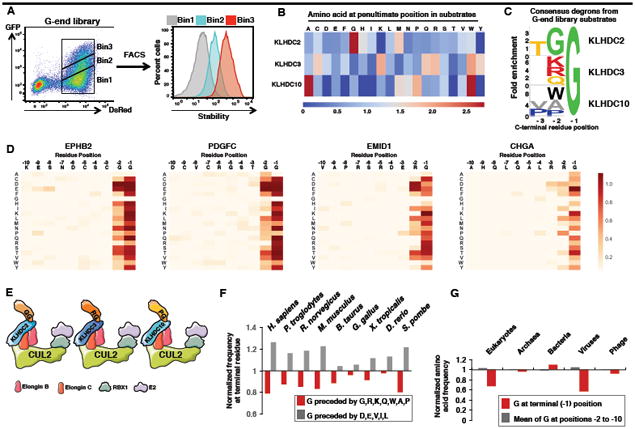
(A) Schematic representation of the G-end GPS library screen.
(B) Comparison of the amino acid frequencies observed at the -2 position preceding the C-terminal glycine residue among KLHDC2, KLHDC3 or KLHDC10 substrates.
(C) Consensus sequences for the C-terminal degrons recognised by KLHDC2, KLHDC3 or KLHDC10.
(D) Saturation mutagenesis was performed for two Cul2KLHDC2 substrates (EPHB2 and PDGFC) and for two Cul2KLHDC3 substrates (EMID1 and CHGA). In each case, darker colors represent a greater degree of stabilization conferred by the mutation.
(E) Summary of the C-terminal degrons recognized by KLHDC2, KLHDC3 and KLHDC10.
(F) Comparison of the normalized frequency at the -2 position of the indicated “favored” (G,R, K, Q, W, P, A) or “disfavored” (D, E, V, I and L) amino acids for recognition by KLHDC2, KLHDC3 and KLHDC10.
(G) Depletion of C-terminal glycine is specific to the proteomes of eukaryotes and eukaryotic viruses. See also Figure S4.
Our previous data (Figure S4C-E) suggested that KLHDC3 would efficiently degrade substrates ending –RG. Based on the fact that –GG ends were enriched in the unstable pool in addition to –RG ends, we considered whether additional CRL adaptors might also target this subset of glycine-ended proteins. Obvious candidates were the related CRL2 adaptors KLHDC2 and KLHDC10, which share 26% and 24% amino acid identity with KLHDC3, respectively. KLHDC2 has also previously been shown to mediate the degradation of the selenoproteins SELK and SELS, both end in –GG (Lin et al., 2015). To test this hypothesis, we took the MLN4924-responsive unstable population derived from the G-end peptidome library (Figure S4G), inactivated either KLHDC2, KLHDC3, or KLHDC10 using CRISPR and isolated the cells expressing stabilized glycine-ended GFP-peptide fusions by FACS (Figure S4H). This experiment confirmed the expected preferences at the -2 position for KLHDC3, with substrates enriched for C-terminal -RG, -KG and -QG motifs, whereas the KLHDC2 substrates were most enriched for -GG ends, and the KLHDC10 substrates were enriched for –WG, -PG and –AG ends (Figures 4B-C). Saturation mutagenesis experiments were performed on two –GG and –RG substrates, in which each residue was mutated to every other possible amino acid across the 10 terminal residues (Figure 4D; Table S4). This confirmed that the C-terminal –GG motif was absolutely critical for the degradation of KLHDC2 substrates. The terminal glycine residue was also critical for the degradation of KLHDC3 substrates bearing an –RG end, but additional preferences were observed at the -2 position, where acidic and small hydrophobic residues inhibited degradation (Figure 4D; Table S4). Therefore, the CRL2 adaptors KLHDC2, KLHDC3 and KLHDC10 are jointly responsible for targeting proteins terminating in glycine for degradation (Figure 4E).
Glycine-end degrons are depleted from the C-termini of eukaryotic proteins
Overall, these experiments defined C-termini ending in –GG, –RG, -KG, –QG, -WG, -PG and -AG as the optimal degrons for CRL2-mediated degradation via the adaptors KLHDC2, KLHDC3 and KLHDC10. Furthermore, certain -2 amino acids (D, E, V, I and L) are more enriched in the stable G-end peptide populations (Figure S4F) and disfavored by KLHDC3 (Figures 4D and S4B). With knowledge of these preferred and disfavored degron sequences in hand, we re-evaluated the amino acid proportions at the C-termini of human proteins. In support of the hypothesis that the depletion of glycine-ended proteins is due in part to the evasion of CRL-mediated proteasomal degradation, we found that the amino acids at the -2 position that favor degron activity are depleted among glycine-ended proteins, while those amino acids that antagonize degron activity are correspondingly enriched (Figure 4F).
Two additional lines of evidence further support the hypothesis that avoidance of glycine-end degrons shapes C-terminal residue frequencies. Whilst glycine is depleted at the C-terminal position across eukaryotes, no depletion of glycine-ends is observed in bacteria or archaea (Figure 4G). This finding is consistent with the idea that proteasomal degradation drives glycine-end depletion, as organisms from these kingdoms do not share similar ubiquitin-proteasome systems (Jastrab and Darwin, 2015). Interestingly, viruses also show depletion of glycine ends (Figure 4G) suggesting they have evolved to evade glycine-end degradation mechanisms in their eukaryotic hosts; conversely bacteriophage show no glycine depletion at the C-terminus (Figure 4G). Finally, we also searched eukaryotic proteomes to identify atypical species in which depletion of glycine-ended proteins is not observed. Among the few taxa in which terminal glycine is not depleted are members of the Plasmodium genus. These organisms have only two Cullin proteins, one fewer than those found in fungi (Marin, 2009; Ponts et al., 2008), and lack obvious orthologs of Elongin B and C suggesting they lack a functional CRL2. Thus, the distortion of the frequency of glycine at the termini of eukaryotic proteins is in part, if not primarily, driven by selective pressure to avoid CRLs that target glycine-end degrons.
Identification of additional classes of C-terminal degrons in human proteins
The termini of proteins exhibit greater disorder than do internal sequences (Lobanov et al., 2010), and, relieved of the evolutionary constraints to maintain a structure, we posit they may exhibit more flexibility to evolve regulatory capacity, as has been demonstrated for the tails of histone proteins (Campos and Reinberg, 2009). With this in mind, we examined whether C-terminal regions of proteins might be a fertile region to explore for degrons.
To identify putative C-terminal degrons, we performed a GPS experiment in which a library encoding the final 23 residues of all human proteins were fused to GFP (Figures 5A and S6A; Table S7). As before, the lentiviral library was introduced into HEK-293T cells and divided into bins based on the stability of the GFP-peptide fusions. The sequence composition of the peptides that destabilize GFP (Bin1) was markedly different from those that stabilize GFP (Bin4): regardless of their position across the peptide, the presence of the bulky hydrophobic residues phenylalanine, tryptophan and tyrosine promoted instability, whereas greater numbers of the charged residues aspartic acid, glutamic acid and lysine correlated with stability (Figures 5B and 5C), indicating a general property that influences protein stability in this context.
Figure 5. Global identification of C-terminal degrons through stability profiling of C-terminal peptides.
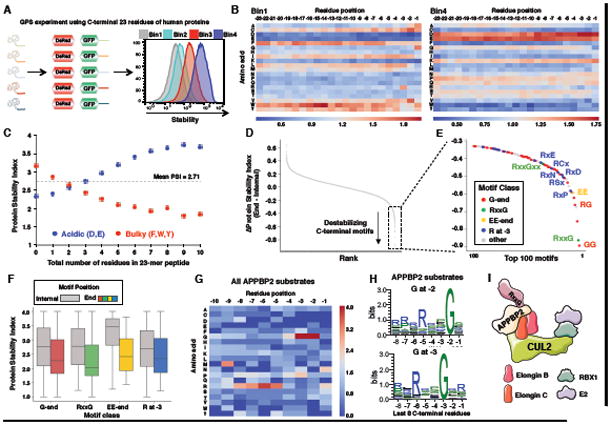
(A) Schematic representation of the C-termini GPS-peptidome screen.
(B) Heatmaps showing the relative depletion (blue) or enrichment (red) of each amino acid across all positions of the 23-mer peptide in the unstable Bin1 population (left) versus the stable Bin4 population (right).
(C) Greater numbers of acidic residues correlate with increased stability, while greater numbers of bulky aromatic residues correlate with instability.
(D) For all possible combinations of di-peptide motifs, the mean difference in stability between peptides containing the motif at the extreme C-terminus was compared to peptides containing the motif at an internal position in the 23-mer peptide (see Methods).
(E) Identification of common classes of potential degron motifs among the top 100 motifs predicted to be most destabilizing specifically when located at the C-terminus.
(F) Boxplots showing the distribution of Protein Stability Indices (PSI) for all peptide sharboring the indicated classes of motif internally within the 23-mer peptide (gray boxes) or at the C-terminus (colored boxes).
(G) Heatmap showing the relative enrichment (red) or depletion (blue) of amino acids among the C-terminal tails of APPBP2 substrates relative to the whole pool of unstable peptides in the GPS-peptidome library.
(H) Logoplots showing the consensus C-terminal amino acid sequences among APPBP2 substrates containing glycine at -2 (top) or -3 (bottom) position.
(I) Summary of the C-terminal degron recognized by APPBP2. See also Figures S5, S6 and S7.
We were particularly interested in motifs that might promote instability specifically when located at or near the C-terminus of the peptide. For all possible combinations of di-peptide motifs, computationally we compared the mean stability of all GFP-peptide fusions harboring the motif within the last six C-terminal amino acids versus those harboring the motif at an internal position in the 23-mer peptide (Figure 5D; Table S7). As expected, motifs encompassing a C-terminal glycine residue dominated the list of the most destabilizing motifs (Figure 5E), but many additional motifs were also apparent, including an RxxG motif, a C-terminal twin glutamic acid (-EE) motif, and a set of motifs that shared in common an arginine at the -3 position (R-3 motif) (Figures 5E and 5F).
Cul2APPBP2 targets proteins bearing C-terminal RxxG motifs for proteasomal degradation
The RxxG motif was intriguing, as the sole substrate from the original GPS-peptidome screen (clone 1) that we found to be specifically targeted for degradation by Cul2APPBP2 contained a perfect match (-RNLGIR*) (Figures 1F and 1G; Table S1). Furthermore, three additional clones in which ablation of APPBP2 had some stabilizing effect contained a perfect sequence match (clone3: -SGRRWG* and clone4: -SSRQFG*), or two close matches with alanine instead of glycine (clone2: -RRSAA*) (Table S1). To further test whether APPBP2 recognized proteins bearing C-terminal RxxG motifs, we identified more Cul2APPBP2 substrates. We ablated APPBP2 function in the unstable MLN4924-reponsive population from the original GPS-peptidome screen (Figure 1D) and isolated cells containing stabilized GFP-peptide fusions by FACS (Figure S5A; Table S5). Sequencing revealed 64 unique APPBP2 substrates; 41 (64%) of these contained an RxxG motif at or near the C-terminus, with RxxGx* and RxxGxx* motifs predominating (Figures 5G and 5H). To confirm that this degron was only functional at the C-terminus, we randomly selected several unstable peptides and full-length protein substrates harboring RxxG motifs mutated the degron or moved the degron away from the end by adding additional amino acids at the C-terminus. All validated as APPBP2 substrates (Figure S5B) and for each, both mutation of or repositioning of the RxxG motif away from the C-terminus resulted in stabilization (Figure S5C). Saturation mutagenesis experiments. confirmed the absolute requirement for the C-terminal arginine and glycine in the RxxG degron (Figure S5D; Table S4). Thus, APPBP2 represents a CRL2 adaptor that recognises C-terminal degrons (Figure 5I).
Recognition of additional C-terminal degrons by CRL2 and CRL4 complexes
Next we tested whether the EE and the R-3 motifs identified computationally also represented C-terminal degrons. We isolated CRL substrates from the GPS-C-terminal 23-mer library by treating the unstable Bin1 and Bin2 populations with MLN4924 and isolating the stabilized population (Figure S6B; Table S7). In addition to enrichment for C-terminal glycine, sequence analysis of the CRL substrates revealed overrepresentation of glutamic acid at both the -1 and -2 positions, and arginine at the -3 position (Figure 6A). Further examination revealed that the C-terminal acidic residues are indeed found together as a twin glutamic acid motif (Figure S6C), while an arginine at the -3 position is frequently paired with terminal histidine, proline, aspartic acid or glutamine residues (Figure S6D).
Figure 6. Identification of additional classes of C-terminal degrons recognized by CRL2 and CRL4 complexes.
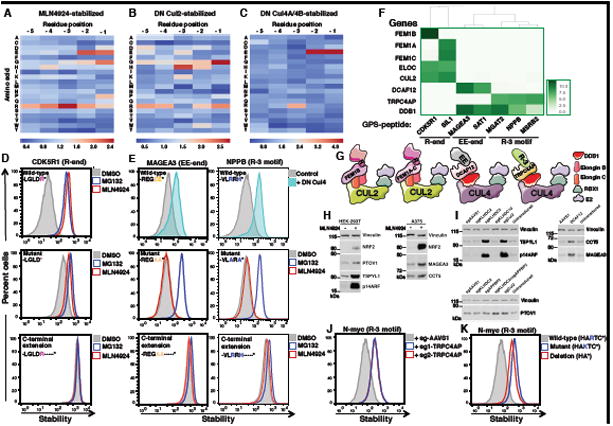
(A to C) Heatmaps displaying the relative depletion (blue) or enrichment (red) of each amino acid across the last five C-terminal residues of peptide substrates stabilized following treatment with (A) MLN4924, (B) DN Cul2 or (C) DN Cul4, compared in each case to the whole C-terminal GPS-peptidome library.
(D and E) Cells expressing GPS constructs in which GFP is fused to the last 23 residues of (D) CDK5R1, (E) MAGEA3 or NPPB were analyzed either as wild-type, with mutation of the key C-terminal residues or with addition of amino acids (-KASTN*) at the C-terminus, with or without the indicated inhibitor or expression of DN Cullin as indicated.
(F) Heatmap representing the degree of enrichment of the indicated genes in the CRIPSR screen as determined by MAGeCK comparing the sorted cells to the unselected populations.
(G) Summary of the C-terminal degrons recognized by FEM1A-C, DCAF12 and TRPC4AP.
(H) HEK-293T or A375 cells were treated with 1 μM MLN4924 for 8h and protein abundance assessed by immunoblot (IB).
(I) HEK-293T cells (TSPYL1, p14ARF or PTOV1 immunoblots) or A375 cells (CCT5 or MAGEA3 immunoblot) were transduced with Cas9 and sgRNAs targeting the indicated genes and protein abundance was assessed by immunoblot 7 days later.
(J) HEK-293T cells expressing GFP fused to N-Myc C-terminal 23 residues were transduced with Cas9 and two independent sgRNAs targeting TRPC4AP and analyzed 7 days later by FACS.
(K) Mutation of the critical arginine or deletion of the last three residues stabilized the GFP-fusion protein as measured by FACS. See also Figures S6 and S7.
To identify which Cullin was recognizing these motifs, we employed DN Cullin constructs. DN Cul2 expression again stabilized the greatest proportion of substrates, but, in contrast to the entire GPS-peptidome library (Figure S1D), expression of both DN Cul4A and DN Cul4B had an effect approaching a similar magnitude (Figure S6E). Sequencing revealed that, in addition to the glycine-end motif, an arginine-end motif was enriched among the CRL2 substrates (Figure 6B; Table S7), while both the -EE and the R-3 motifs were enriched specifically among the substrates stabilized by expression of both DN Cul4A and Cul4B (Figure 6C; Table S7).
For each motif class we selected several C-terminal 23-mer peptides at random for validation. Addition of the C-terminal tails of CDK5R1 and SIL1, which both end in arginine, to GFP resulted in destabilization of the fusion protein; this effect was abrogated upon deletion of the terminal arginine residue or the addition of extra residues at the C-terminus (Figures 6D and S7A). Next we confirmed that the fusion of peptides terminating with twin glutamic acid residues (MAGEA3 and MYH3) or harboring R at -3 motifs (NPPB and MSRB2) to the C-terminus of GFP resulted in CRL4-mediated degradation (Figures 6E and S7B). Addition of extra residues to the C-terminus again stabilized the GFP-peptide fusions, but, interestingly, while alanine mutagenesis of the terminal motifs (–EE to –AA and –RxH to –AxA) abolished CRL-mediated degradation, the mutant peptides remained unstable and presumably now served as substrates for other E3s (Figures 6E and S7B). For one substrate ending –EE and one substrate containing an R-3 motif we also performed a saturation mutagenesis experiment, which confirmed the importance of the terminal twin glutamic acid motif and the arginine at the -3 position for the degron activity (Figure S7C; Table S4).
To identify the CRL adaptors recognizing these degrons, we performed CRISPR screens. We transduced HEK-293T cells expressing GFP-peptide fusions bearing either Rend, EE-end or R at -3 degron motifs with a CRISPR library targeting either CRL2 BC box adaptors (R-end peptide fusions) or CRL4 DCAF adaptors (EE-end and R at -3 peptide fusions). Cells in which the GFP-peptide fusion were stabilized were isolated by FACS, and enriched sgRNAs detected by sequencing (Figure S7D). The adaptors found in common between the different peptides bearing the same C-terminal degron motifs are depicted in Figure 6F. As expected, DDB1, an integral component of both Cul4A and Cul4B, scored across all samples. The screens unambiguously identified DCAF12 as the adaptor recognizing the EE-end degron and TRP4CAP as the adaptor recognizing the R-3 degron, (Figures 6F and S7E; Table S8). Thus, Cul4DCAF12 and Cul4TRP4CAP mediate the degradation of –EE end and R-3 substrates respectively (Figure 6G).
The BC box CRISPR screens identified the FEM family adaptors as critical for the degradation of the peptides ending in arginine, with Cul2FEM1B responsible for the degradation of the GFP-CDK5R1 peptide fusion and both Cul2FEM1A and Cul2FEM1C required for the degradation of the GFP-SIL1 peptide fusion (Figures 6F and S7E; Table S8). As expected, Cul2 and Elongin C scored in both clones. The identification of the FEM family adaptors was intriguing, as previously we found that several of the unstable GFP-peptides from the original GPS-peptidome library (Clones 9-17) were stabilized by knockout of either FEM1A/FEM1C or FEM1B (Figures 1F and S2). With the exception of clone 17, all of these constructs terminated with –QGRAR*, a common sequence derived from the backbone of the GPS expression vector. These findings supports the hypothesis that Cul2FEM1A-C complexes target substrates ending in arginine (Figure 6G). However, given that all (with the exception of peptides derived from the C-terminus of proteins) of the full-length GFP-peptide fusion proteins in the GPS-peptidome library terminate with –QGRAR*, and yet only a small proportion of these proteins are substrates for Cul2FEM1A-C, we anticipate that the full degron recognized by FEM adaptors must be considerably more complex.
Proteasomal degradation of endogenous proteins through C-terminal degrons
To validate that endogenous cellular proteins can be degraded by CRLs targeting C-terminal degrons, we examined the degradation of the following substrates for which antibodies were readily available: p14ARF and TSPYL1 (G-end), PTOV1 (RxxGG), CCT5 (EE-end) and MAGEA3 (EE-end). First we confirmed that these proteins are CRL substrates (Figure 6H), and then performed individual CRISPR-mediated disruption experiments to delineate the adaptors involved (Figure 6I). The glycine-ended proteins p14ARF and TSPYL1 were stabilized following ablation of KLHDC3; PTOV1, which bears both a –GG degron and a RxxG degron, was stabilized upon the combined knockout of both KLHDC2 and APPBP2, while MAGEA3 and CCT5 (ending -EE) were stabilized following the loss of DCAF12 (Figure 6I).
N-Myc has previously been identified as a substrate of Cul4TRPC4AP (Choi et al., 2010). N-Myc C-terminal peptide was identified as a CRL substrate when fused to GFP in our C-terminal 23-mer GPS-peptidome screen (Figure 5 and Table S7), and, intriguingly, examination of the N-Myc amino sequence revealed that it contained an arginine residue at the -3 position. Therefore, we directly tested the hypothesis that the Cul4TRPC4AP-mediated degradation of N-Myc occurs through its R-3 motif. We first showed that a GPS construct in which the C-terminal 23 residues of N-Myc was fused to GFP was stabilized upon CRISPR-mediated ablation of TRPC4AP (Figure 6J). Furthermore, mutation of the arginine residue at the -3 position to lysine or deletion of the last three residues of the N-Myc peptide also resulted in stabilization of the GFP-fusion protein (Figure 6K). Altogether, these data demonstrate that N-Myc is targeted for degradation by Cul4TRPC4AP through an R-3 C-terminal degron motif.
Recognition of C-terminal degrons is not restricted to CRLs
Spurred by the finding that alanine mutagenesis of the EE-end and R-3 motifs could change the specificity of a degron from a CRL substrate to a non-CRL substrate (Figure 6E), we re-examined the data from the C-terminal GPS screen to search specifically for additional putative C-terminal degrons not targeted by CRLs. Based on the fold enrichment of each motif among the substrates stabilized following MLN4924 treatment (Figure S6B), computationally we divided the top 100 predicted destabilizing C-terminal motifs (Figure 5E) into CRL and non-CRL substrates (Figure 7A; Table S7). Although the majority (58%) were targeted by CRLs, comprising predominantly G-end, EE-end, R at -3 and RxxG motifs, the 42 non-CRLs motifs could also be grouped into a number of functional classes (Figures 7A and 7B). These included alanine at both the terminal and penultimate positions, supporting the existence of alanine-end degrons suggested by our previous alanine mutagenesis experiment (Figures 6E).
Figure 7. Recognition of C-terminal degrons is a general property of E3s that has shaped the human proteome.
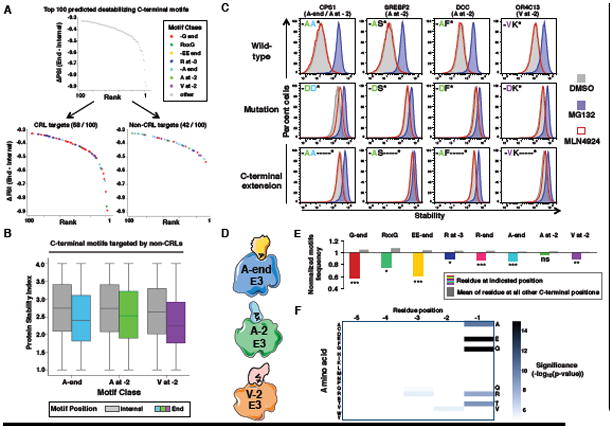
(A) Of the top 100 predicted destabilizing C-terminal motifs (Figure 5), 58 are enriched among the pool of CRL substrates while 42 are not.
(B) Boxplots showing the distribution of PSI for all peptides harboring the indicated classes of motif internally within the 23-mer peptide (gray boxes) or at the C-terminus (colored boxes).
(C) Cells expressing GPS constructs in which the C-terminal 23 residues of the indicated genes comprising representative non-CRL degrons were fused to GFP. These degrons were analyzed either as wild-type, with mutation of the key C-terminal residues, or with addition of amino acids (-KASTN*) at the C-terminus as indicated, with or without the indicated inhibitors.
(D) Summary of the non-CRL C-terminal degrons.
(E) Normalized amino acid frequency of the indicated residue(s) in the human proteome, showing the degree of depletion at the degron position (colored bars) versus the mean normalized frequency across all other positions in the C-terminal tail (gray bars). (*P<0.05,**P<0.01, ***P<0.001; Fisher's exact test).
(F) Heatmap showing the significance of the depletion of each residue across the last five C-terminal residues of the human proteome.
To experimentally validate these additional classes of C-terminal degrons, we analyzed randomly selected 23-mer C-terminal peptides harboring either A-end, A at -2 or V at -2 motifs (Figure 7C). In each case the peptide conferred instability on GFP, which was rescued with MG132 but not MLN4924, while mutation or repositioning of the degron motifs resulted in stabilization (Figure 7C). Thus, recognition of C-terminal degrons is not restricted to CRLs (Figure 7D).
C-terminal degron recognition has shaped the human proteome
Strikingly, all C-terminal motifs identified in this study, with the exception of the A at -2 degron motif, are significantly under-represented among human proteins (Figure 7E). Furthermore, when considering the most depleted amino acids across the C-termini of human proteins, all but one of the most significantly depleted residues comprise a C-terminal degron motif (Figure 7F). The exception is threonine. Since we did not observe destabilization of threonine-ended proteins, threonine-ends may be under-represented for degradation-independent. Overall, we propose that an array of E3s recognize C-terminal degrons to regulate the stability of eukaryotic proteins (Figure S7F), which has in turn sculpted the composition of eukaryotic proteomes.
Discussion
Achieving a systems-level understanding of protein stability control will require the identification of degron motifs recognized by E3s on a global scale. The GPS-peptidome method represents an advance towards this goal. Coupling this approach with CRISPR screens, here we have characterized a suite of CRLs that target their substrates through the recognition of specific degron motifs located at their extreme C-terminus. Computationally we also implicated non-CRL family E3s in C-end recognition, suggesting that DesCEND is a general principle used by the UPS to regulate protein turnover.
Exploiting the GPS-peptidome approach to identify degrons in human proteins
E3s sculpt the proteome in much the same way miRNAs filter the transcriptome (Fabian and Sonenberg, 2012; Ordureau et al., 2015), providing control critical to the identity and function of cells. The identification of degrons and their cognate E3s is a key issue for achieving a systems-level understanding of protein stability control. By adapting the GPS approach to measure the stability of short peptides, we have identified on the order of 100,000 peptides that confer instability on GFP. Although many peptides may represent similar degrons such as due to exposed hydrophobic residues, it is likely that others will comprise a large number of distinct degrons recognized by different E3s.
Recognition of C-terminal degrons by CRL adaptors
The GPS-peptidome approach led us to the observation that multiple CRL2 and CRL4 complexes recognize a variety of degron motifs located at the C-terminus of proteins. The localization of degrons at proteins ends appears attractive from an evolutionary perspective: the ends of proteins exhibit a greater degree of disorder than internal sequences (Lobanov et al., 2010), and, without the evolutionary constraints associated with maintaining a 3-D structure, protein termini may have an enhanced ability to incorporate regulatory sequences.
We found 3 related CRL2 adaptors, KLHDC2, KLHDC3 and KLHDC10, which recognize distinct motifs at the C-terminus that all terminate with a glycine residue. KLHDC2 and KLHDC3 had been previously shown to be responsible for degradation of truncated selenoproteins (Lin et al., 2015), although it appears that their physiological role also extends to the regulation of dozens of full-length glycine-ended proteins as we found in our GPS-ORFeome. We also found that another family of CRL2 adaptors, FEM1A, FEM1B and FEM1C, share substrates that are enriched for C-terminal arginine residues, although the full degron motif recognized by the FEM proteins must also comprise additional internal sequences. Both FEM1A and FEM1C were found to be required for the degradation of the same substrates; suggesting that they may function as a heterodimer or that they each individually target a similar set of substrates. Another CRL2 adaptor, APPBP2, recognizes RxxG motifs in which the glycine residue is optimally located at the -2 or -3 position relative to the end.
The recognition of C-terminal degrons is not limited to CRL2. We found that Cul4DCAF12 targets proteins ending in a twin-glutamic acid degron and Cul4TRPC4AP degrades proteins containing arginine at the -3 position. Intriguingly, all of these CRL adaptors that recognize C-terminal degrons contain repeats of protein domains that form solenoid structures (Hrabe and Godzik, 2014): Kelch domains in KLHDC2, KLHDC3 and KLHDC10, Ankyrin repeats in FEM1A, FEM1B and FEM1C, Tetratricopeptide repeat (TPR) domains in APPBP2, WD40 repeats in DCAF12, and Armadillo-like repeats in TRPC4AP. Structural insight would be invaluable to ascertain why such solenoid structures are particularly suited to the task of distinguishing short peptide motifs located at the exposed C-termini of proteins.
Further bioinformatic analysis identified additional C-terminal degron sequences that are targeted by non-CRLs. Thus far we have implicated approximately 11 E3s in the recognition of C-terminal degrons, and currently this number already exceeds the number of E3s thought to be involved in the recognition of N-degrons. It is important to note that, because we have limited our analysis to just two defining amino acids, our bioinformatic predictions are very likely to be underestimating the total number of C-terminal degrons, as there are likely to be many degrons that employ more than two amino acids for specificity.
Beyond the recognition of specific degrons sequences, we have uncovered a general rule governing peptide stability based on overall amino acid composition. Larger numbers of the bulky aromatic residues tryptophan (W), phenylalanine (F) and tyrosine (Y), as well as cysteine (C), confer instability in opposition to the acidic residues aspartic acid (D) and glutamic acid (E), which, together with the positively charged lysine (K), promote stability. We predict that there will be an E3 or a family of E3s that recognize such hydrophobic stretches and which may be responsible for the elimination of unfolded proteins to maintain protein homeostasis. The mechanism underlying the stabilizing effect of the acidic residues is not yet clear, and we do not know whether the presence of acidic residues merely counters the destabilizing impact of hydrophobic residues, or whether acidic residues can act independently to stabilize otherwise neutral sequences. This effect cannot simply be explained by the charge of the stabilizing residues, as enrichment for sequences rich in arginine was not observed in the stable bin.
Sculpting of eukaryotic proteomes by C-terminal degrons
How the C-terminal degrons are utilized to regulate protein stability remains to be determined. It is likely to vary on a case-by-case basis, as proteins bearing C-terminal degrons cannot be readily grouped into functional categories and the CRL adaptors that recognize C-terminal degrons are broadly expressed across human tissues. C-terminal degrons could be important for enforcing the stoichiometry of multi-subunit complexes, acting as constitutive degradation signals that are only exposed when a protein is not correctly assembled with its binding partners. Indeed, N-end rule pathways have been shown to regulate subunit stoichiometry in this way (Shemorry et al., 2013), although we did not observe a significant enrichment for C-terminal degrons among proteins found in the CORUM database (Ruepp et al., 2010). The accessibility of C-terminal degrons might also be regulated by PTMs, thus linking them to signal transduction, or, as is the case for most N-end rule substrates (Tasaki et al., 2012), they could be generated from internal sequences following proteolysis. C-terminal degrons might also play a role in protein quality control, for example by degrading aberrant C-terminally extended proteins that result from failed translation termination and read through into the 3′ untranslated region (Arribere et al., 2016; Dunn et al., 2013). On a practical level, these data should guide the use of epitope tags, which might interfere with the endogenous regulation of protein stability by blocking the recognition of C-terminal degrons or adding new ones. The amino acid composition of the epitope tag may also in itself influence protein stability: the widely used FLAG epitope tag (DYKDDDDK), for example, is rich in aspartic acid and lysine residues, both of which could exert a stabilizing effect on the stability of the tagged protein (Figure 5B).
Irrespective of their predominant physiological role, it is clear that the C-terminal degrons have played an important role in sculpting eukaryotic proteomes. The greater variability of amino acid abundances observed at the terminal position relative to internal positions suggests that some residues have particular functional significance when placed at the extreme C-terminus, this placing them under selective pressure. Evolutionary forces have reduced the number of proteins terminating in glycine among eukaryotes. In further support of the hypothesis that the selective pressure to reduce glycine at C-termini is due to the avoidance of CRL2 complexes that target glycine-end degrons, we found that the remaining glycine-end proteins are further depleted for residues at the -2 position that constitute favorable glycine-end degrons for CRL2-mediated degradation and enriched for residues that disfavor CRL2-mediated degradation. This effect is not limited to glycine, however, as we also found that the human proteome is depleted of protein sequences containing other classes of C-terminal degron motifs.
Conclusion
The GPS-peptidome technology represents a versatile tool for the identification of degron sequences. The ability to rapidly generate libraries of potential degrons, screen for degron activity, and define the degron sequences using scanning mutagenesis libraries is very powerful. This system has revealed that over half of all 90 amino acid peptides have degron activity, which has certain implications for de novo protein evolution. A detailed understanding of the specific sites on proteins that confer instability, coupled with genetics to uncover the cognate E3s involved, would open the way for the identification of drugs that inhibit these E3s for therapeutic modulation of the UPS in human disease.
STAR Methods
Contact For Reagent And Resource Sharing
Further information and request for reagents should be directed to and will be fulfilled by the Lead Contact, Stephen J. Elledge (selledge@genetics.med.harvard.edu).
Experimental Model And Subject Details Cell Lines
HEK-293T (ATCC® CRL-3216™) and A375 (a gift from C. Novina) cells were maintained at 37°C and 5% CO2 in Dulbecco's Modified Eagle's Medium (DMEM) (Life Technologies) supplemented with 10% fetal bovine serum (HyClone), 100 units/ml of penicillin and 0.1 mg/ml of streptomycin (Thermo Fisher Scientific). For experiments involving inhibitors treatment, 6 million cells were plated per 6-well plate. 24 h later, cells were treated for 5 h using 5 μM MG132, 1 μM MLN4924 or 100 nM Bafilomycin A1. HEK-293T GPS libraries generation is explained in details later.
Method Details
Transfection and lentivirus production
Lentiviral stocks were generated through the transfection of HEK-293T cells with the lentiviral transfer vector plus plasmid encoding Gag-Pol, Rev, Tat and VSV-G using either TransIT-293 transfection reagent (Mirus) or PolyJet In Vitro DNA Transfection Reagent (SignaGen Laboratories) as recommended by the manufacturer. Lentiviral supernatants were collected 48 h later, passed through a 0.45 μm filter, and applied to target cells in the presence of 8 μg/ml hexadimethrine bromide (Polybrene, Sigma-Aldrich).
Plasmids
Plasmid vectors encoding cDNAs for SNURF, TIAF1, RBM38, DLX1, ZMAT5, TCAP, RSDA1, CHCHD3, STRADA, SMOC2, EMID1, IRX6, KLHDC3 and METAP2 were obtained from the Ultimate ORF Clone collection (Thermo Fisher Scientific) and were subcloned into the lentiviral pHAGE-Flag-HA or pHAGE-GPS Gateway Destination vector via an LR recombination reaction (Thermo Fisher Scientific). Dominant-negative Cullin constructs were a kind gift from W. Harper. For individual CRISPR/Cas9-mediated gene-disruption experiments, sgRNAs were cloned into lentiCRISPR v2 (Addgene #52961, deposited by Feng Zhang) as described (Sanjana et al., 2014). Please see Key Resource Table for the sgRNA nucleotide sequences used in this paper.
Flow cytometry
HEK-293T cells were detached with trypsin, washed once with PBS, and then analyzed on a BD LSRII instrument (Becton Dickinson). Flow cytometry data was collected using BD FACS Diva software (Becton Dickinson) and analyzed using FlowJo software. Cell sorting was performed on either a BD FACSAria II (Becton Dickinson) or a MoFlo Astrios (Beckman Coulter) instrument.
Generation of GPS libraries
GPS-peptidome library
Protein coding sequences (CDS) for all human genes were downloaded from RefSeq database and the longest isoform of each gene used for oligonucleotide design. The protein sequences were first encoded as DNA bases using random codons, which were then divided into 270 bp regions tiling across the entire CDS with 135 bp overlaps between neighboring oligonucleotides and with flanking 15 bp primers as described (Xu et al., 2016). The DNA was amplified by PCR using specific primers that included attB sites to allow the products to be cloned into pDONR223 via a Gateway BP recombination reaction and subsequently into the the lentiviral GPS vector pHAGE-GPS3.0-DEST via an LR recombination reaction (Thermo Fisher Scientific). At least 100-fold representation of the library was maintained at each cloning step.
Barcoded GPS-ORFeome library
A three step cloning strategy was used to generate the barcoded GPS-ORFeome library. First, random 24-mer oligonucleotides (IDT) were amplified by PCR and cloned into the lentiviral Gateway destination vector pHAGE-CMV-DEST-PGKpuro between the SbfI and XhoI sites to generate a barcoded vector library (pHAGE-CMV-DEST-PGKpuro 3′BC). The pool of barcoded vectors was then linearized with BstZ17I (NEB), gel purified (Qiagen QIAEX II Gel Extraction Kit), and subjected to a Gateway LR recombination reaction (Thermo Fisher Scientific) using entry clones from the Ultimate ORF collection assembled into six pools containing approximately 3000 ORFs each. ORF-barcode pairs were subsequently mapped by linearizing the plasmids with I-SceI, followed by fragmentation (NEBNext dsDNA Fragmentase), end repair, dA tailing and adaptor ligation (NEBNext DNA Library Prep kit). After the ligation step, fragments ranging from 300-600 bp were purified from an agarose gel (Qiagen QIAEX II Gel Extraction Kit) and two rounds of PCR were performed to add the appropriate adaptor sequences for paired-end Illumina sequencing; the final pHAGE-CMV-ORF-PGKpuro 3′BC library had an average complexity of approximately 5 barcodes per ORF. Lastly, the CMV promoter was replaced with a CMV-DsRed-IRES-GFP cassette using PI-SceI and I-Ppol sites to generate the final barcoded GPS-ORFeome expression library.
GPS G-end library
Human protein-coding sequences were downloaded from the GENCODE database. In total, 2245 unique sequences encoding a protein terminating in glycine followed by a stop codon were selected for oligonucleotide design. The terminal 168 bp of each sequence together with common flanking PCR primer sites were synthesized as an oligonucleotide library by Twist Bioscience. The pool of oligonucleotides were amplified by PCR and inserted into pHAGE-GPS3.0-DEST via Gateway BP and LR recombination reactions.
GPS C-terminal 23-mer library
Protein-coding sequences for all human proteins were downloaded from the RefSeq database and the terminal 23 amino acids of each selected for oligonucleotide design (27,030 sequences in total). Protein sequences were encoded as DNA bases using random codons, common 15 bp flanking primer sequences were added at each end and the oligonucleotide library was synthesized by Agilent. The pool of oligonucleotides were amplified by PCR and inserted into pHAGE-GPS3.0-DEST via Gateway BP and LR recombination reactions.
Mutagenesis libraries
Scanning mutagenesis was performed for five clones (Clones 3, 5, 6, 7 and 8). For each of the five peptide sequences, each amino acid in turn was mutated to alanine (encoded by GCT), or, if the original residue was glycine, to arginine (encoded by CGT). Saturation mutagenesis was performed on a single clone from the original 90-mer peptidome (Clone 8), as well as on selected C23-mer peptides bearing the different identified degrons. For each amino acid in the peptide sequence, a set of mutant sequences were generated in which the residue was mutated in turn to all of the other 19 possible amino acids. The codons used for the amino acids substitutions were: A: GCT, C: TGC, D: GAC, E: GAA, F: TTC, G: GGC, H: CAC, I: ATC, K: AAA, L: CTC, M: ATG, N: AAC, P: CCT, Q: CAA, R: CGC, S: TCT, T: ACT, V: GTC, W: TGG, Y: TAC. Finally, common 15 bp flanking primer sequences were added at each end and the oligonucleotide library was synthesized by Twist. The pool of oligonucleotides were amplified by PCR and inserted into pHAGE-GPS3.0-DEST via Gateway BP and LR recombination reactions.
GPS screens
GPS libraries were packaged into lentiviral particles. HEK-293T cells were transduced at low multiplicity of infection (MOI) (approximately 20% DsRed+ cells) at sufficient scale to maintain ∼500-fold coverage of the library. Untransduced cells were eliminated through 3 days of puromycin selection (1.5 μg/ml) commencing 48 h post transduction. The surviving cells were then expanded and sorted 7-9 days post-transduction into either 3 bins (GPS G-end library, scanning alanine mutagenesis library and the saturation mutagenesis library), 4 bins (GPS-peptidome library, C-terminal 23-mer GPS-peptidome library) or 5 bins (GPS-ORFeome library), based on the GFP/DsRed ratio.
Genomic DNA was extracted from each of the pools (Qiagen Gentra Puregene Cell Kit). The GFP-fusion peptides (or associated ORF barcodes in the case of the GPS-ORFeome screen) were amplified by PCR with Q5 Hot Start Polymerase (NEB) using PCR primers annealing to common regions of the lentiviral vectors; overall the reactions contained a total mass of DNA equivalent to the mass of genomic DNA from cells representing 500-fold coverage of the library. All of the PCR products were pooled, purified using a spin column (Qiagen PCR purification kit), and then 200 ng of the purified product used as a template for a second PCR reaction using primers to add the Illumina P5 sequence and a ‘stagger’ region of 1-7 bp at the 5′end and an Illumina index and the P7 sequence at the 3′ end (Meyer and Kircher, 2010). Samples were then further purified on an agarose gel (QiaQuick Gel Extraction kit), pooled, and sequenced on either an Illumina HiSeq2500, NextSeq or MiSeq instrument.
CRISPR screens
For the initial CRISPR screens performed on the 17 clones derived from the original GPS-peptidome screen (Figure 1F), a custom sgRNA library was designed targeting 69 CRL2/5 adaptors at a depth of 12 sgRNAs per gene. For the CRISPR screens performed using the C-terminal 23-mer GFP-peptide fusion GPS constructs (Figure 6F), two further custom sgRNA libraries were designed targeting 11 CRL components and either 109 CRL2/5 adaptors or 62 CRL4 adaptors at a depth of 6 sgRNAs per gene. In each case, the sgRNA sequences were flanked with BbsI restriction sites and common primer sites and synthesized as oligonucleotides by Agilent or Twist Bioscience. The resulting oligonucleotide pool was amplified by PCR, and the products purified on a spin column (Qiagen PCR purification kit) and digested with BbsI (NEB). Following ethanol precipitation, DNA fragments were separated on a 10% TBE PAGE gel (Thermo Fisher Scientific) and the 28 bp band corresponding to the sgRNAs excised. The DNA was extracted by crushing the gel slice into small pieces followed by soaking in TE buffer for 2 h at room temperature. Following a final ethanol precipitation step, the sgRNA fragment was ligated into the lentiCRISPR v2 (Addgene plasmid #52961) vector that had previously been digested with BsmBI (NEB) and purified on an agarose gel (Qiagen QIAEX II gel extraction kit).
The sgRNA library was packaged into lentiviral particles which were used to transduce HEK-293T expressing unstable GFP-peptide fusions at a MOI ∼0.3 at sufficient scale to maintain ∼1000-fold representation of the library. Eight days later the top 5% of the population based on GFP/DsRed ratio were isolated by FACS. For each clone, genomic DNA was extracted from both the sorted cells and the unsorted library as a reference. sgRNA sequences in both populations were amplified by PCR and sgRNA abundance quantified by Illumina sequencing.
Immunoprecipitation and immunoblotting
Immunoprecipitation of HA-tagged proteins was performed from HEK-293T cells growing in 10 cm plates 24 h after transfection and 4 h after treatment with 5 μM MG132. Cells were lysed in ice-cold lysis buffer (50 mM Tris, 100 mM NaCl, 0.5% NP-40, pH 7.5 supplemented with EDTA-free protease inhibitor tablet and Phos-Stop phosphatase inhibitor tablet (Roche)) for 25 min at 4°C. Lysates were clarified by centrifugation (20,000 × g, 15 min, 4°C) and nuclear pellets were resuspended in lysis buffer, sonicated briefly, and re-clarified. HA agarose beads (Sigma-Aldrich) were added to the combined whole cell extracts and the samples incubated with rotation for 2 h at 4°C. Beads with bound immune complexes were washed 4 times with lysis buffer and twice with TBS (25 mM Tris, 100 mM NaCl), followed by elution with 100 μg/ml HA peptide (Sigma-Aldrich) for 30 min at 30°C. SDS-PAGE sample buffer was then added to the eluted sample and boiled. Proteins were separated by SDS-PAGE, transferred to a nitroceullose membrane, blocked in 10% Nonfat Dry Milk in PBS + 0.1% Tween-20 (PBS-T), and then probed with primary antibody overnight at 4°C. Following three washes with PBS-T, the membrane was incubated with secondary antibody for 1 h at room temperature, washed a further three times in PBS-T, incubated with Western Lightning Plus ECL (Perkin Elmer) for 5 min and reactive bands visualized using HyBlot CL film (Denville Scientific).
GFP immunoprecipitations were performed in a similar way, using GFP-Trap®_MA magnetic agarose beads (ChromoTek GmbH) to capture GFP-fusion proteins followed by elution with 2M Glycine for 1 min. In vitro transcription and translation was performed using the PURExpress In Vitro Protein Synthesis Kit (NEB) as recommended by the manufacturer. Plasmids (500 ng) encoding GFP alone or a GFP-peptide fusion were incubated in 25 μl reaction mix, supplemented with RNAse inhibitor, for 3 h at 37°C. All of the material was then bound to GFP-Trap®_MA magnetic beads (ChromoTek GmbH) for 2 h at 4°C in 500 μl lysis buffer.
Quantification and statistical analysis
CRISPR screens
Illumina reads were first trimmed of constant regions derived from the backbone of lentiCRISPR v2 expression vector using Cutadapt (Martin, 2011). Count tables were generated from the remaining variable sgRNA sequences using Bowtie 2 (Langmead and Salzberg, 2012; Langmead et al., 2009). The Model-based Analysis of Genome-wide CRISPR/Cas9 Knockout (MAGeCK) method (Li et al., 2014) was used to rank the performance of individual genes targeted by multiple sgRNAs enriched in the selected cells versus the unsorted populations. The full MAGeCK results for each screen are presented either in Table S1 or Table S8.
GPS-ORFeome screen
Illumina reads were trimmed of constant regions derived from the backbone of the GPS expression vector using Cutadapt. The number of occurrences of each of the 24 nt barcode sequences that remained was then quantified using Bowtie 2. In the majority of cases barcodes could be uniquely assigned to individual ORFs; however in cases where a barcode could not distinguish between multiple isoforms of the same gene (indicated by a lower case ‘ioh’ identifier in Table S2), read counts were assigned to all isoforms of that gene. After correcting for sequencing depth, the stability of each individual barcoded ORF was assessed based either simply on the bin containing the greatest number of reads (Modal Bin) or using the protein stability index (PSI) metric, given by the sum of multiplying the proportion of reads in each bin by the Bin number (1-5 in this case), thus yielding a stability score between 1 (maximally unstable) and 5 (maximally unstable):
(where i represents the Bin number and Ri represents the proportion of the Illumina reads present for an ORF in that given subpopulation i).
Two methods were used to identify CRL substrates. First, the mean of the counts for each barcode was used to collapse the data for each ORF, and then ORFs were categorized as CRL substrates if the read counts were >5-fold enriched in either of the MLN4924-responsive populations derived from Bin1, Bin2 or Bin3 compared to the corresponding starting populations. Additionally, to generate a set of CRL substrates at higher stringency, MAGeCK was used to identify barcoded ORFs significantly enriched in the MLN4924-responsive populations versus the corresponding starting populations. For the heatmap shown in Figure 2D, the intensity of the colors represent the depletion (blue) or enrichment (red) of each amino acid across the last five C-terminal residues comparing the pool of CRL substrates to all ORF detected in the GPS-ORFeome library. For the scatterplot in Figure 3A ORFs were assigned to bins using the Modal Bin stability metric, and for each pool of ORFs the relative frequency of glycine at each position in the last ten C-terminal residues was compared to the frequency of glycine at the corresponding position among all ORFs detected in the GPS-ORFeome library.
Proteome composition analysis
Reviewed protein sequences were downloaded from the Swiss-Prot database. For each position across the last 10 C-terminal residues, the total abundance of each amino acid was quantified, expressed as a proportion of the total number of protein sequences, and then normalized to the mean proportion observed across the last 10 C-terminal residues. For the graph shown in Figure 4G, we further categorized glycine residues occurring within the last 10 amino acids as either ‘favored’ for CRL2-mediated degradation if they were preceded by G, R, K, Q, A, P or W, or ‘disfavored’ if preceded by D, E, V I or L. The abundance of Gfavored and Gdisfavored across the last 10 C-terminal amino acids was then quantified and normalized as above, and the normalized frequency of each at the extreme C-terminal residue is plotted.
Mutagenesis GPS experiments
Sequencing reads were mapped to peptidome library using BLAT (Kent, 2002) and only reads perfectly matching the reference sequence were considered. After normalization for sequencing depth, the PSI stability metric was calculated as above for each peptide (yielding a value between 1 and 3 in this case). The heatmaps displayed in Figures 4A and 4B were generated using the Seaborn visualization library for Python (https://seaborn.pydata.org/) and illustrate the difference between the PSI for each individual mutant peptide and the median PSI of all peptides; the darker the red color, the greater the stabilizing effect of the mutation. The full data for all mutant peptides is detailed in Tables S4 and S5.
Defining the degrons for KLHDC3 and APPBP2 from GPS-peptidome substrates
Sequencing reads were mapped to peptidome library using BLAT. Peptides were classified as substrates if, with both of the two independent KLHDC3 or APPBP2 sgRNAs, they exhibited >2-fold enrichment over the unsorted starting population, >2-fold enrichment over the control sorted populations (those transduced with either Cas9 alone or Cas9 plus the sgAAVS1 control guide), and were identified with at least 100 reads in the sorted sample (Table S5). The logoplots shown in Figures 5H and S4C were generated by WebLogo3 (Crooks et al., 2004); as a reference, the expected composition of the sequences was set to reflect the relative frequency of amino acids residues across the human proteome.
G-end GPS-peptidome screen
Illumina MiSeq reads were trimmed of common flanking sequences using Cutadapt and Bowtie 2 was used to count the occurrences of the 168 nt variable regions encoding the 56-mer peptides. Only reads perfectly matching the reference sequence were considered. The PSI was calculated as described previously, yielding a stability score between 1 and 3 for each peptide. Peptides were categorized as CRL substrates if they exhibited >5-fold enrichment in either MLN4924-responsive population compared to the corresponding starting populations (Bin1 and Bin2) (Table S6). Substrates of KLHDC2, KLHDC3 or KLHDC10 were identified by examining the sorted cells that contained stabilized GFP-peptide fusions following CRISPR-mediated ablation of each adaptors. Peptides were classified as substrates if, with both of the two independent sgRNAs, they exhibited >2.5-fold enrichment over the unsorted starting population, >3-fold enrichment over the control sorted populations (those transduced with either Cas9 alone or Cas9 plus the sgAAVS1 control guide), and were identified with at least 100 reads in the sorted sample (Table S6). The logoplots presented in Figure 4E were generated using Seq2Logo (Thomsen and Nielsen, 2012) from a custom position-specific scoring matrix. Amino acids were included on the plots if (1) >10% of the substrates (>9% for KLHDC10) contained the residue at that position, and (2) if the observed frequency of the amino acid was enriched >1.5-fold over the overall frequency across the whole G-end GPS-peptidome library.
C-termini GPS-peptidome screen
Illumina reads were trimmed with Cutadapt and resulting 69 nt reads that perfectly mapped the reference sequence were enumerated using Bowtie 2. Following read count correction for sequencing depth, a PSI score was calculated for each peptide (yielding a score between 1 and 4) and CRL substrates were identified based on a cut-off of a >5-fold enrichment in either MLN4924-responsive population compared to the corresponding starting populations (Bin1 and Bin2) (Table S7). CRL substrates were further categorized as either CRL2 substrates or CRL4A and/or CRL4B substrates based on their enrichment in the stabilized populations isolated by FACS following expression of dominant-negative Cullin constructs if the following criteria were all met: >2.5-fold enrichment over the unsorted starting population, >3-fold enrichment over the sorted population transduced with an empty expression vector, >10-fold enrichment over the other dominant-negative (DN) Cullin sorted population (ie. over both the DN Cul4A and DN Cul4B sorted populations for potential CRL2 substrates, and over the DN Cul2 sorted population for potential CRL4 substrates) and covered at a read depth of at least 1000 reads in the sorted sample (Table S7). For the scatterplot shown in Figure 5C, first the total number of acidic (D or E) or bulky aromatic (F, W or Y) residues in each peptide were counted, and then, for each value between 0 and 10, the mean PSI of all the peptides containing that number of acidic or aromatic residues was calculated.
The stability data derived from the C-termini GPS-peptidome screen was used to predict potential destabilizing C-terminal degron motifs. We focused the search on the last six amino acids of each peptide. Varying two residues at a time, for all possible combinations of di-peptide motifs (allowing gaps) we computed the mean PSI of all the peptides containing the motif at the extreme C-terminus. To focus the search on motifs that only act as degrons specifically when located at the end, as a reference we computed the mean PSI of all other peptides in the library that contained the motif at an internal position on the 23-mer peptides. To predict whether destabilizing C-terminal motifs were targeted by Cullin-family ligases, for each motif we computed the proportion of peptides ending with that motif identified as CRL substrates from the MLN4924-responsive populations and compared it to the proportion of peptides harboring that motif at an internal position on the peptides identified as CRL substrates. The boxplots in Figures 5F and 7B display the distribution of PSI scores for all peptides in the C-termini GPS-peptidome library containing the indicated motif either at the extreme C-terminus of the peptide (colored boxes) or at an internal position in the peptide (gray boxes). For the data presented in Figure 7A, C-terminal motifs exhibiting <1.5-fold enrichment for CRL substrates were considered potential non-CRL substrates. The full data for each peptide is presented in Table S7.
Data and Software Availability
Detailed GPS and CRISPR screen data are available in Supplemental tables S1-S13.
Key Resources Table
| Reagent or Resource | Source | Identifier |
|
| ||
| Antibodies | ||
|
| ||
| Mouse anti-Vinculin | Sigma-Aldrich | V9131 |
|
| ||
| Rat anti-HA-peroxidase | Sigma-Aldrich | 1201381900 |
|
| ||
| Mouse anti-p14ARF | Cell Signaling Technology | 2407 |
|
| ||
| Rabbit anti-MAGEA3 | Abgent | AP6165a |
|
| ||
| Rabbit anti-PTOV1 | Abcam | ab81173 |
|
| ||
| Rabbit anti-TSPYL1 | Abcam | ab95943 |
|
| ||
| Rabbit anti-GFP | Abcam | ab290 |
|
| ||
| Rabbit anti-CCT5 | Bethyl | A303-480A |
|
| ||
| Goat Anti-Rabbit IgG (H+L) HRP | Jackson Immuno Research | 111-035-003 |
|
| ||
| Goat Anti-Mouse IgG (H+L) HRP | Jackson Immuno Research | 115-035-003 |
|
| ||
| Chemicals, Peptides, and Recombinant Proteins | ||
|
| ||
| MG132 | R&D Systems | 1748/5 |
|
| ||
| Bafilomycin A1 | Enzo Life Science | BML-CM110-0100 |
|
| ||
| MLN4924 | Active Biochem | A-1139 |
|
| ||
| Polybrene | Santa Cruz | sc-134220 |
|
| ||
| HA peptide | Sigma-Aldrich | I2149 |
|
| ||
| Critical Commercial Assays | ||
|
| ||
| NEBNext DNA Library Prep kit | New England Biolabs | E7370S |
|
| ||
| PURExpress In Vitro Protein Synthesis Kit | New England Biolabs | E6800S |
|
| ||
| QIAEX II Gel Extraction Kit | Qiagen | 20051 |
|
| ||
| PCR purification kit | Qiagen | 28106 |
|
| ||
| Gentra Puregene Cell Kit | Qiagen | 158767 |
|
| ||
| Deposited Data | ||
|
| ||
| Experimental Models: Cell Lines | ||
|
| ||
| HEK-293T | ATCC | ATCC® CRL-3216™ |
|
| ||
| A375 | Carl Novina lab | N/A |
|
| ||
| Experimental Models: Organisms/Strains | ||
|
| ||
| Oligonucleotides | ||
|
| ||
| sg1-APPBP2: GATGTAGTTGTCCACGACAG | This paper | N/A |
|
| ||
| sg2-APPBP2: GGATGTTCTCGGGCAAGGAG | This paper | N/A |
|
| ||
| sg1-KLHDC2: GGCCACATGTTCGTCTGGGG | This paper | N/A |
|
| ||
| sg2-KLHDC2: GAGCTTCCTGACATAGAAGG | This paper | N/A |
|
| ||
| sg1-KLHDC3: GCGGTGGACAGTGCACCTGG | This paper | N/A |
|
| ||
| sg2-KLHDC3: GGGGCAGCCCTGCACGCTGG | This paper | N/A |
|
| ||
| sg1-KLHDC10: GCCTCCGCCACCAGCGCCGG | This paper | N/A |
|
| ||
| sg2-KLHDC10: GGGCGCCTCCTCCCCTCCGG | This paper | N/A |
|
| ||
| sgFEM1A: GGCGCGAGCGTGGAGGCCGG | This paper | N/A |
|
| ||
| sgFEM1C: GTCAAGGTGCCCATACCTGG | This paper | N/A |
|
| ||
| sgCUL2: GTTGACGACAATAAAAGCCG | This paper | N/A |
|
| ||
| sgDACF12: GCAACTTCCCAGTCTCCTGA | This paper | N/A |
|
| ||
| sg1-TRPC4AP: GATAGCCTCCATGGAGAGAAG | This paper | N/A |
|
| ||
| sg2-TRPC4AP: GAGGCCTACGATCTCTATCCG | This paper | N/A |
|
| ||
| sgAAVS1: GGGGCCACTAGGGACAGGAT | This paper | N/A |
|
| ||
| Recombinant DNA | ||
|
| ||
| pHAGE-GPS3.0-DEST | This paper | N/A |
|
| ||
| pHAGE-CMV-DEST-PGKpuro 3′BC | This paper | N/A |
|
| ||
| barcoded GPS-ORFeome expression library | This paper | N/A |
|
| ||
| pHAGE-GPS3.0-peptide libraries | This paper | N/A |
|
| ||
| pHAGE-Flag-HA-DEST | This paper | N/A |
|
| ||
| lentiCRISPR v2 | Addgene | 52961 |
|
| ||
| Software and Algorithms | ||
|
| ||
| Bowtie 2 | Langmead and Salzberg, 2012; Langmead et al., 2009 | http://bowtie-bio.sourceforge.net/index.shtml |
|
| ||
| Cutadapt | Martin, 2011 | http://cutadapt.readthedocs.io/en/stable/index.html |
|
| ||
| MAGeCK | Li et al., 2014 | http://mageck.sourceforge.net. |
|
| ||
| BLAT | Kent, 2002 | https://genome.ucsc.edu/cgi-bin/hgBlat |
|
| ||
| Seq2Logo | Thomsen and Nielsen, 2012 | http://www.cbs.dtu.dk/biotools/Seq2Logo/ |
|
| ||
| Seaborn visualization library for Python | Seaborn | https://seaborn.pydata.org/ |
|
| ||
| Flojow | Flojow | https://www.flowjo.com |
|
| ||
| Other | ||
Supplementary Material
Supplementary Figure 1. Isolating CRL substrates using a synthetic human peptidome, Related to Figure 1.
(A and B) Performance of the GPS-peptidome library in HEK-293T cells. (A) Flow cytometry analysis of the starting library (pink line) compared to the four sorted populations (filled histograms). (B) Comparison of the relative stability of the Bin1 population, which contains the most unstable GFP-peptide fusions, compared to GFP alone.
(C and D) Isolation of CRL substrates using the Cullin inhibitor MLN4924. (C) The Bin1 population was treated with either MLN4924 or DMSO and analyzed by flow cytometry. Approximately 8% of the GFP-peptide fusions were stabilized by MLN4924, and these cells were isolated by FACS. (D) The Bin1 MLN4924-responsive cells from (C) were transduced with lentiviruses encoding dominant-negative (DN) Cullins and analyzed by flow cytometry 24 h later.
(E-H) KLHDC3 physically associates with its peptide substrates. (E) HA-tagged KLHDC3 or METAP2 (control) expression constructs were transiently transfected into Clone 3 cells which express an unstable GFP-peptide fusion peptide targeted by Cul2KLHDC3. KLHDC3 was immunoprecipitated with anti-HA antibodies and co-immunoprecipitating proteins identified by immunoblot using the indicated antibodies. (F) HEK-293T cells stably expressing HA-tagged KLHDC3 were transfected with expression constructs encoding the GFP-peptide fusion from Clone 6 (a Cul2KLHDC3 substrate) or Clone 14 (a Cul2FEM1A/C substrate) and analysed as in (E).
(G) KLHDC3 associates with a GFP-peptide substrate generated in vitro. The GFP-peptide expressed by Clone 6 or GFP alone were in vitro transcribed and translated using E. coli extracts and immobilized on magnetic beads coated with anti-GFP antibodies. The beads were then incubated with extracts from cells stably expressing HA-tagged KLHDC3 and binding assessed by immunoblot.
(H and I) A C-terminal glycine residue is required for Cul2KLHDC3 mediated degradation. In addition to the data presented in Figures 1I and 1J, data for a further clone (Clone 5) is shown here. (H) Stabilization of the GFP-peptide fusion was observed by flow cytometry upon mutation of the C-terminal glycine to alanine (G/A) or, to a greater extent, to aspartic acid (G/D). (I) Stabilization was also observed upon the addition of an extra 10 residues (-DNYNEPKANQ*) to the C-terminus.
Supplementary Figure 2. CRISPR/Cas9 genetic screens identify CRL2 BC box adaptors responsible for the degradation of unstable peptides, Related to Figure 1.
(A) Schematic representation of the screen. Seventeen clones expressing GFP-peptide fusions stabilized by expression of DN Cul2 and Cul5 were selected at random and transduced with a CRISPR library targeting 69 CRL2/5 adaptors. The population of cells in which the GFP-peptide fusion was stabilized were then isolated by FACS and the enriched sgRNAs identified by Illumina sequencing.
(B) CRISPR screen results for each of the 17 clones, as determined using the MAGeCK algorithm (7).
Supplementary Figure 3. A GPS-ORFeome screen measures the stability of the human proteome and identifies full-length CRL substrates, Related to Figure 2.
(A) Illumina sequencing of the 3′ ‘barcode’ cassette enables effective identification of the upstream ORF. Example profiles from each of the five sorted populations are shown; each color series represents the distribution of sequencing reads for a different barcode attached to the same GFP-ORF fusion. In each case, highly similar distributions are observed between the different barcodes.
(B) GFP-fusion proteins are predominantly degraded by proteasomes. Each of the five populations was treated with the proteasome inhibitor MG132 (5 μM for 5 h) and stabilization of the GFP-fusion proteins was monitored by flow cytometry.
(C and D) Sorting strategy used to isolate CRL substrates from the GPS-ORFeome library. (C) Populations of cells expressing unstable GFP-ORF fusion proteins were treated for 5 h with 1 mM MLN4924 and the stabilized protein isolated by FACS. After recovery in the absence of the inhibitor, cells in which the GFP-fusion proteins were once again efficiently degraded were recovered in a second sort. Sorting plots for Bin1 are shown; a similar procedure was also carried out using Bin2 and Bin3. (D) The final populations of MLN4924-responsive substrates recovered after sorting were reanalysed in the presence of 1 μM MLN4924.
(E) CRL2 is responsible for degrading the majority of unstable GFP-ORF fusion proteins. The MLN4924-responsive populations isolated from Bin1 and Bin2 were transduced with lentiviral vectors encoding dominant-negative (DN) versions of the indicated Cullins, and the proportion of substrates stabilized was assessed by flow cytometry 24 h later.
Supplementary Figure 4. The CRL2 adaptors KLHDC2, KLHDC3 and KLHDC10 target glycine-ended substrates for proteasomal degradation, Related to Figure 4. (A and B) Defining the glycine-end degron recognized by KLHDC3. (A) Alanine scanning mutagenesis was performed across five Cul2KLHDC3 GFP-peptide substrates, while (B) saturation mutagenesis was performed for one substrate (Clone 8). In each case, the darker the color the greater the degree of stabilization conferred by the mutation.
(C) Isolation of Cul2KLHDC3 substrates. Schematic representation of the experiment. The MLN4924-responsive pool of unstable GFP-peptide fusions was transduced with two independent sgRNAs targeting KLHDC3, and cells in which the GFP-peptide fusion were stabilized were isolated by FACS.
(D and E) Sequence analysis of KLHDC3 substrates. (D) Heatmap displaying the relative enrichment (red) or depletion (blue) of amino acids among the C-terminal tails of KLHDC3 substrates relative to the whole pool of unstable peptides. The vast majority of KLHDC3 substrates have a glycine (G) residue at the terminal position, although some substrates bearing a terminal alanine (A) were also identified. An enrichment for arginine (R), lysine (K) and glutamine (Q) was observed at the penultimate (-2) position. (E) Logoplot representing the consensus C-terminal sequence of all KLHDC3 substrates identified from the GPS-peptidome library
F-H) Identification of glycine-ended peptide CRL substrates using the G-end GPS library.(F) The identity of the penultimate amino acid affects the stability of glycine-ended proteins. The normalized frequency of the indicated amino acids at the penultimate (-2) position relative to the overall frequency of amino acids in the G-end peptide library is shown for each of the three bins. (G) Isolation of CRL substrates. The Bin1 population of cells from the G-end GPS-peptidome library was treated with MLN494 for 5 hours and then analyzed by flow cytometry; approximately 11% of cells expressed GFP-peptide fusions that were stabilized by MLN4924, and these cells were isolated by FACS. (H) Isolation of KLHDC2, KLHDC3 and KLHDC10 substrates. The MLN4924-responsive sorted population from (G) was transduced with Cas9 and sgRNAs targeting either KLHDC2, KLHDC3, KLHDC10 or AAVS1 as a negative control and the indicated populations of cells exhibiting stabilization of the GFP-peptide fusion were isolated by FACS.
Supplementary Figure 5. Cul2APPBP2 targets substrates bearing RxxG motifs near their C-terminus for proteasomal degradation, Related to Figure 5. (A) Schematic representation of the experiment designed to identify the degron recognized by Cul2APPBP2. The MLN4924-responsive pool of GFP-peptide fusions of the GPS-peptidome library was transduced with two independent sgRNAs targeting APPBP2, and cells in which the GFP-peptide fusion was stabilized were isolated by FACS.
(B and C) APPBP2 recognizes C-terminal RxxG motifs. (B) Knockout of APPBP2 stabilizes substrates bearing C-terminal RxxG motifs. HEK-293T cells were transduced with GPS constructs expressing GFP fused to either full-length PXN, peptides corresponding to the C-terminal tails of PIK3C2B and ASCC3, or the peptide sequence of Clone 1 (Figure 1F), and then subsequently transduced with Cas9 and two independent sgRNAs targeting APPBP2 and analyzed 7 days later by flow cytometry. The last 6 amino acids of each GFP-fusion protein are shown with the RxxG motifs underlined. (C) Alteration or repositioning of the RxxG motif stabilizes APPBP2 substrates. Mutation of the RxxG motif (blue line) or repositioning of the RxxG motif through the addition of extra residues (-DNYNEPKVANQ*) at the C-terminus (red line) resulted in the stabilization of the GFP-fusion proteins, as measured by flow cytometry.
(D) Defining the RxxG degron recognized by APPBP2. Saturation mutagenesis was performed for two substrates (left- XP_211896, right- peptide #35 (Table S5)). In each case, the darker the color the greater the degree of stabilization conferred by the mutation.
Supplementary Figure 6. Identifying degrons at the C-termini of human proteins targeted by CRLs, Related to Figure 5. (A) Performance of the C-terminal GPS library in HEK-293T cells. A GPS library in which the last 23 residues of all human proteins were fused to GFP was expressed in HEK-293T cells and sorted into four bins based on the stability of the GFP-peptide fusion protein.
(B) Isolation of C-terminal peptides targeted by CRLs. To purify CRL substrates, the Bin1 and Bin2 populations from the C-terminal GPS-peptidome library were treated with MLN4924 and the cells expressing stabilized GFP-peptide fusions isolated by FACS.
(C and D) Composition of C-terminal motifs targeted by CRLs. The heatmaps display the relative depletion (blue) or enrichment (red) of each amino acid across the last five C-terminal residues of peptide substrates stabilized by MLN4924 that contain a glutamic acid residue at either the -1 or -2 position (C) or an arginine residue at the -3 position (D). This revealed that the C-terminal acidic residues are found together as a twin glutamic acid degron motif (-EE end), while arginine at the -3 position (R at -3 motif) is frequently paired with terminal histidine, proline, aspartic acid or glutamine residues.
(E) CRL2 and CRL4 complexes recognize C-terminal degrons. The MLN4924-reponsive populations from (B) were treated with MLN4924 or transduced with constructs encoding dominant-negative (DN) Cul2, Cul4A or Cul4B; the cells in which the GFP-peptide fusions were stabilized were again isolated by FACS.
Supplementary Figure 7. CRISPR screens identify the CRL adaptors targeting additional classes of C-terminal degrons, Related to Figure 6. (A and B) Validation of CRL-mediated degradation through R-end, EE-end and R at -3 C-terminal degron motifs. Additional validation data is presented here as in Figures 6D and 6E, using a different example peptide sequence in each case. (A) A C-terminal arginine can act as a degron for CRL2-mediated degradation. A GPS construct in which the last 23 residues of SIL1 was fused to GFP was used as an example arginine-end degron. Wild-type GFP-SIL1 peptide is stabilized after 5 h treatment with either MLN4924 or MG132 (top); whereas mutation (middle) or deletion (bottom) of the terminal arginine abrogated CRL-mediated degradation and stabilized the GFP-peptide fusion. (B) CRL4-mediated recognition of C-terminal degrons. Attaching the last 23 residues of MYH3 (ending –EE) or MSRB2 (ending – RxH) to GFP destabilizes the fusion protein; this can be rescued upon exogenous expression of DN Cul4 (top). In each case alanine mutagenesis of the terminal motifs (–EE to –AA and – RxH to –AxA) abolished CRL-mediated degradation; however, the mutant peptides remained unstable and presumably now served as substrates for other E3s (middle). Addition of extra residues at the C-terminus also resulted in stabilization (bottom).
(C) Defining the degrons recognized by DACF12 or TRPC4AP. Saturation mutagenesis was performed for one substrate each. In each case, the darker the color the greater the degree of stabilization conferred by the mutation.
(D-E) CRISPR/Cas9-mediated genetic screens identify additional CRL2 and CRL4 adaptors responsible for C-terminal recognition. (D) Overview of the CRISPR screening strategy. Example 23-mer C-terminal peptides ending in –R (CDK5R1 and SIL1), -EE (MAGEA3 and SAT1) or containing an R at -3 motif (MGAT2, MSRB2 and NPPB) were fused to GFP and expressed in HEK-293T cells, and then transduced with a CRISPR sgRNA library targeting either CRL2 adaptors (-R end peptides) or CRL4 adaptors (-EE end and R-3 motif peptides). The population of cells in which the GFP-peptide fusion was stabilized were then isolated by FACS and the enriched sgRNAs identified by Illumina sequencing. (E) CRISPR screen results for each of the 7 clones, as determined using the MAGeCK algorithm, together with the amino acid sequences of the last 10 residues of each construct.
(F) Regulation of protein stability through the recognition of terminal degrons. As at the N-terminus, an array of E3s identified in this study target proteins bearing C-terminal degron motifs for proteasomal degradation. (B, Elongin B; C, Elongin C).
Table S1. Results from the CRISPR screens on the GPS-peptidome CRL2 clones as analyzed by MAGeCK, Related to Figure 1.
Table S1A contains the results for Clone 1.
Table S1B contains the results for Clone 2.
Table S1C contains the results for Clone 3.
Table S1D contains the results for Clone 4.
Table S1E contains the results for Clone 5. Table S1F contains the results for Clone 6.
Table S1G contains the results for Clone 7.
Table S1H contains the results for Clone 8.
Table S1I contains the results for Clone 9.
Table S1J contains the results for Clone 10.
Table S1K contains the results for Clone 11.
Table S1L contains the results for Clone 12.
Table S1M contains the results for Clone 13.
Table S1N contains the results for Clone 14.
Table S1O contains the results for Clone 15.
Table S1P contains the results for Clone 16.
Table S1Q contains the results for Clone 17.
Table S2. GPS-ORFeome screen data, Related to Figure 2.
Table S2A contains raw GPS data for each barcoded ORF across the five bins and in the three MLN4924-responsive populations.
Table S2B contains collapsed GPS data for each ORF.
Table S3. Alanine scanning mutagenesis experiments for five KLHDC3 substrates clones, Related to Figure 4.
Table S3A contains the results for Clone 3.
Table S3B contains the results for Clone 5.
Table S3C contains the results for Clone 6.
Table S3D contains the results for Clone 7.
Table S3E contains the results for Clone 8.
Table S4. Saturation mutagenesis experiments of peptides bearing C-end degron, Related to Figure 4, 5 and 6.
Table S4A contains saturation mutagenesis of KLHDC3 substrate Clone 8.
Table S4B contains saturation mutagenesis of KLHDC2 substrate EPHB2.
Table S4C contains saturation mutagenesis of KLHDC2 substrate PDGFC.
Table S4D contains saturation mutagenesis of KLHDC3 substrate EMID1.
Table S4E contains saturation mutagenesis of KLHDC3 substrate CHGA.
Table S4F contains saturation mutagenesis of APPBP2 substrate XP_211896.
Table S4G contains saturation mutagenesis of APPBP2 substrate peptide #35 (Table S11).
Table S4H contains saturation mutagenesis of DCAF12 substrate MAGEA3.
Table S4I contains saturation mutagenesis of TRPC4AP substrate MSRB2.
Table S5. Amino acid sequences of KLHDC3 and APPBP2 peptide substrates identified from the original GPS-peptidome screen, Related to Figure 4 and 5.
Table S5A contains KLHDC3 substrates.
Table S5B contains APPBP2 substrates.
Table S6. G-end GPS-peptidome library screen data, Related to Figure 4.
Table S6A contains raw GPS data for G-end GPS screen across the three bins and in the two MLN4924-responsive populations. Table S6B contains KLHDC2 substrates.
Table S6C contains KLHDC3 substrates.
Table S6D contains KLHDC10 substrates.
Table S7. C-terminal 23-mer GPS-peptidome library screen data, Related to Figure 5, 6 and 7.
Table S7A contains raw GPS data for C-terminal 23-mer GPS screen across the four bins and in the two MLN4924-responsive populations.
Table S7B contains computational prediction of C-terminal degrons.
Table S7C contains amino acid sequences of CRL2 substrates from the C-terminal 23-mer GPS-peptidome library. Table S7D contains amino acid sequences of CRL4A substrates.
Table S7E contains amino acid sequences of CRL4B substrates.
Table S7F contains amino acid sequences of CRL4A and CRL4B substrates.
Table S8. Results from the CRISPR screens of the CRL2 and CRL4 substrate C-terminal 23-mer peptides as analyzed by MAGeCK, Related to Figure 6.
Table S8A contains the results for the CDK5R1 construct (R-end).
Table S8B contains the results for the SIL1 construct (R-end).
Table S8C contains the results for the MAGEA3 construct (EE-end).
Table S8D contains the results for the SAT1 construct (EE-end).
Table S8E contains the results for the MGAT2 construct (R-3 motif).
Table S8F contains the results for the NPPB construct (R-3 motif).
Table S8G contains the results for the MSRB2 construct (R-3 motif).
Highlights.
GPS-peptidome is a high throughput technology to identify degrons in mammalian cells
The stability of many proteins is regulated via degrons located at their C-terminus.
Distinct classes of C-terminal degrons are degraded by Cullin RING ligase complexes
DesCEND (Destruction via C-End Degrons) has shaped the eukaryotic proteome
Acknowledgments
We thank W. Harper and T. Westbrook for reagents and C. Araneo and his team for FACS. R.T.T. is a Sir Henry Wellcome Postdoctoral Fellow (201387/Z/16/Z). This work was supported by an NIH grant AG11085 to S.J.E. S.J.E. is an Investigator with the Howard Hughes Medical Institute.
Footnotes
Author Contributions: Conceptualization, I.K. and S.J.E.; Methodology, I.K., M.Z.L. S.J.E.; Software, I.K., R.T.T., T.K., Q.X.; Formal analysis, I.K., R.T.T., T.K., Q.X.; Investigation, I.K., R.T.T.; Resources, M.Z.L.; Writing-Original draft, I.K., R.T.T., S.J.E.; Writing-Review & Editing, I.K., R.T.T., S.J.E.
Declaration Of Interest: The authors declare no competing interests.
Publisher's Disclaimer: This is a PDF file of an unedited manuscript that has been accepted for publication. As a service to our customers we are providing this early version of the manuscript. The manuscript will undergo copyediting, typesetting, and review of the resulting proof before it is published in its final citable form. Please note that during the production process errors may be discovered which could affect the content, and all legal disclaimers that apply to the journal pertain.
References
- Arribere JA, Cenik ES, Jain N, Hess GT, Lee CH, Bassik MC, Fire AZ. Translation readthrough mitigation. Nature. 2016;534:719–723. doi: 10.1038/nature18308. [DOI] [PMC free article] [PubMed] [Google Scholar]
- Bachmair A, Finley D, Varshavsky A. In vivo half-life of a protein is a function of its amino-terminal residue. Science. 1986;234:179–186. doi: 10.1126/science.3018930. [DOI] [PubMed] [Google Scholar]
- Bennett EJ, Rush J, Gygi SP, Harper JW. Dynamics of cullin-RING ubiquitin ligase network revealed by systematic quantitative proteomics. Cell. 2010;143:951–965. doi: 10.1016/j.cell.2010.11.017. [DOI] [PMC free article] [PubMed] [Google Scholar]
- Campos EI, Reinberg D. Histones: annotating chromatin. Annu Rev Genet. 2009;43:559–599. doi: 10.1146/annurev.genet.032608.103928. [DOI] [PubMed] [Google Scholar]
- Choi SH, Wright JB, Gerber SA, Cole MD. Myc protein is stabilized by suppression of a novel E3 ligase complex in cancer cells. Genes Dev. 2010;24:1236–1241. doi: 10.1101/gad.1920310. [DOI] [PMC free article] [PubMed] [Google Scholar]
- Clague MJ, Heride C, Urbe S. The demographics of the ubiquitin system. Trends Cell Biol. 2015;25:417–426. doi: 10.1016/j.tcb.2015.03.002. [DOI] [PubMed] [Google Scholar]
- Crooks GE, Hon G, Chandonia JM, Brenner SE. WebLogo: a sequence logo generator. Genome Res. 2004;14:1188–1190. doi: 10.1101/gr.849004. [DOI] [PMC free article] [PubMed] [Google Scholar]
- Dunn JG, Foo CK, Belletier NG, Gavis ER, Weissman JS. Ribosome profiling reveals pervasive and regulated stop codon readthrough in Drosophila melanogaster. Elife. 2013;2:e01179. doi: 10.7554/eLife.01179. [DOI] [PMC free article] [PubMed] [Google Scholar]
- Emanuele MJ, Elia AE, Xu Q, Thoma CR, Izhar L, Leng Y, Guo A, Chen YN, Rush J, Hsu PW, et al. Global identification of modular cullin-RING ligase substrates. Cell. 2011;147:459–474. doi: 10.1016/j.cell.2011.09.019. [DOI] [PMC free article] [PubMed] [Google Scholar]
- Fabian MR, Sonenberg N. The mechanics of miRNA-mediated gene silencing: a look under the hood of miRISC. Nat Struct Mol Biol. 2012;19:586–593. doi: 10.1038/nsmb.2296. [DOI] [PubMed] [Google Scholar]
- Harper JW, Tan MK. Understanding cullin-RING E3 biology through proteomics-based substrate identification. Mol Cell Proteomics. 2012;11:1541–1550. doi: 10.1074/mcp.R112.021154. [DOI] [PMC free article] [PubMed] [Google Scholar]
- Hrabe T, Godzik A. ConSole: using modularity of contact maps to locate solenoid domains in protein structures. BMC Bioinformatics. 2014;15:119. doi: 10.1186/1471-2105-15-119. [DOI] [PMC free article] [PubMed] [Google Scholar]
- Jastrab JB, Darwin KH. Bacterial Proteasomes. Annu Rev Microbiol. 2015;69:109–127. doi: 10.1146/annurev-micro-091014-104201. [DOI] [PMC free article] [PubMed] [Google Scholar]
- Kent WJ. BLAT--the BLAST-like alignment tool. Genome Res. 2002;12:656–664. doi: 10.1101/gr.229202. [DOI] [PMC free article] [PubMed] [Google Scholar]
- Kwon YT, Ciechanover A. The Ubiquitin Code in the Ubiquitin-Proteasome System and Autophagy. Trends Biochem Sci. 2017;42:873–886. doi: 10.1016/j.tibs.2017.09.002. [DOI] [PubMed] [Google Scholar]
- Langmead B, Salzberg SL. Fast gapped-read alignment with Bowtie 2. Nat Methods. 2012;9:357–359. doi: 10.1038/nmeth.1923. [DOI] [PMC free article] [PubMed] [Google Scholar]
- Langmead B, Trapnell C, Pop M, Salzberg SL. Ultrafast and memory-efficient alignment of short DNA sequences to the human genome. Genome Biol. 2009;10:R25. doi: 10.1186/gb-2009-10-3-r25. [DOI] [PMC free article] [PubMed] [Google Scholar]
- Li W, Xu H, Xiao T, Cong L, Love MI, Zhang F, Irizarry RA, Liu JS, Brown M, Liu XS. MAGeCK enables robust identification of essential genes from genome-scale CRISPR/Cas9 knockout screens. Genome Biol. 2014;15:554. doi: 10.1186/s13059-014-0554-4. [DOI] [PMC free article] [PubMed] [Google Scholar]
- Liao H, Liu XJ, Blank JL, Bouck DC, Bernard H, Garcia K, Lightcap ES. Quantitative proteomic analysis of cellular protein modulation upon inhibition of the NEDD8-activating enzyme by MLN4924. Mol Cell Proteomics. 2011;10:M111009183. doi: 10.1074/mcp.M111.009183. [DOI] [PMC free article] [PubMed] [Google Scholar]
- Lin HC, Ho SC, Chen YY, Khoo KH, Hsu PH, Yen HC. SELENOPROTEINS. CRL2 aids elimination of truncated selenoproteins produced by failed UGA/Sec decoding. Science. 2015;349:91–95. doi: 10.1126/science.aab0515. [DOI] [PMC free article] [PubMed] [Google Scholar]
- Lobanov MY, Furletova EI, Bogatyreva NS, Roytberg MA, Galzitskaya OV. Library of disordered patterns in 3D protein structures. PLoS Comput Biol. 2010;6:e1000958. doi: 10.1371/journal.pcbi.1000958. [DOI] [PMC free article] [PubMed] [Google Scholar]
- Lucas X, Ciulli A. Recognition of substrate degrons by E3 ubiquitin ligases and modulation by small-molecule mimicry strategies. Curr Opin Struct Biol. 2017;44:101–110. doi: 10.1016/j.sbi.2016.12.015. [DOI] [PubMed] [Google Scholar]
- Lydeard JR, Schulman BA, Harper JW. Building and remodelling Cullin-RING E3 ubiquitin ligases. EMBO Rep. 2013;14:1050–1061. doi: 10.1038/embor.2013.173. [DOI] [PMC free article] [PubMed] [Google Scholar]
- Marin I. Diversification of the cullin family. BMC Evol Biol. 2009;9:267. doi: 10.1186/1471-2148-9-267. [DOI] [PMC free article] [PubMed] [Google Scholar]
- Martin M. Cutadapt removes adapter sequences from high-throughput sequencing reads. MBnetjournal. 2011;17:10–12. [Google Scholar]
- Meszaros B, Kumar M, Gibson TJ, Uyar B, Dosztanyi Z. Degrons in cancer Sci Signal. 2017;10 doi: 10.1126/scisignal.aak9982. [DOI] [PubMed] [Google Scholar]
- Meyer M, Kircher M. Illumina sequencing library preparation for highly multiplexed target capture and sequencing. Cold Spring Harb Protoc. 2010;2010 doi: 10.1101/pdb.prot5448. pdb prot5448. [DOI] [PubMed] [Google Scholar]
- Ordureau A, Munch C, Harper JW. Quantifying ubiquitin signaling. Mol Cell. 2015;58:660–676. doi: 10.1016/j.molcel.2015.02.020. [DOI] [PMC free article] [PubMed] [Google Scholar]
- Peng J, Schwartz D, Elias JE, Thoreen CC, Cheng D, Marsischky G, Roelofs J, Finley D, Gygi SP. A proteomics approach to understanding protein ubiquitination. Nat Biotechnol. 2003;21:921–926. doi: 10.1038/nbt849. [DOI] [PubMed] [Google Scholar]
- Ponts N, Yang J, Chung DW, Prudhomme J, Girke T, Horrocks P, Le Roch KG. Deciphering the ubiquitin-mediated pathway in apicomplexan parasites: a potential strategy to interfere with parasite virulence. PLoS One. 2008;3:e2386. doi: 10.1371/journal.pone.0002386. [DOI] [PMC free article] [PubMed] [Google Scholar]
- Popovic D, Vucic D, Dikic I. Ubiquitination in disease pathogenesis and treatment. Nat Med. 2014;20:1242–1253. doi: 10.1038/nm.3739. [DOI] [PubMed] [Google Scholar]
- Ruepp A, Waegele B, Lechner M, Brauner B, Dunger-Kaltenbach I, Fobo G, Frishman G, Montrone C, Mewes HW. CORUM: the comprehensive resource of mammalian protein complexes--2009. Nucleic Acids Res. 2010;38:D497–501. doi: 10.1093/nar/gkp914. [DOI] [PMC free article] [PubMed] [Google Scholar]
- Sanjana NE, Shalem O, Zhang F. Improved vectors and genome-wide libraries for CRISPR screening. Nat Methods. 2014;11:783–784. doi: 10.1038/nmeth.3047. [DOI] [PMC free article] [PubMed] [Google Scholar]
- Shemorry A, Hwang CS, Varshavsky A. Control of protein quality and stoichiometries by N-terminal acetylation and the N-end rule pathway. Mol Cell. 2013;50:540–551. doi: 10.1016/j.molcel.2013.03.018. [DOI] [PMC free article] [PubMed] [Google Scholar]
- Soucy TA, Smith PG, Milhollen MA, Berger AJ, Gavin JM, Adhikari S, Brownell JE, Burke KE, Cardin DP, Critchley S, et al. An inhibitor of NEDD8-activating enzyme as a new approach to treat cancer. Nature. 2009;458:732–736. doi: 10.1038/nature07884. [DOI] [PubMed] [Google Scholar]
- Tasaki T, Sriram SM, Park KS, Kwon YT. The N-end rule pathway. Annu Rev Biochem. 2012;81:261–289. doi: 10.1146/annurev-biochem-051710-093308. [DOI] [PMC free article] [PubMed] [Google Scholar]
- Thomsen MC, Nielsen M. Seq2Logo: a method for construction and visualization of amino acid binding motifs and sequence profiles including sequence weighting, pseudo counts and two-sided representation of amino acid enrichment and depletion. Nucleic Acids Res. 2012;40:W281–287. doi: 10.1093/nar/gks469. [DOI] [PMC free article] [PubMed] [Google Scholar]
- Varshavsky A. Naming a targeting signal. Cell. 1991;64:13–15. doi: 10.1016/0092-8674(91)90202-a. [DOI] [PubMed] [Google Scholar]
- Varshavsky A. The N-end rule pathway and regulation by proteolysis. Protein Sci. 2011;20:1298–1345. doi: 10.1002/pro.666. [DOI] [PMC free article] [PubMed] [Google Scholar]
- Xu GJ, Shah AA, Li MZ, Xu Q, Rosen A, Casciola-Rosen L, Elledge SJ. Systematic autoantigen analysis identifies a distinct subtype of scleroderma with coincident cancer. Proc Natl Acad Sci U S A. 2016;113:E7526–E7534. doi: 10.1073/pnas.1615990113. [DOI] [PMC free article] [PubMed] [Google Scholar]
- Yen HC, Elledge SJ. Identification of SCF ubiquitin ligase substrates by global protein stability profiling. Science. 2008;322:923–929. doi: 10.1126/science.1160462. [DOI] [PubMed] [Google Scholar]
- Yen HC, Xu Q, Chou DM, Zhao Z, Elledge SJ. Global protein stability profiling in mammalian cells. Science. 2008;322:918–923. doi: 10.1126/science.1160489. [DOI] [PubMed] [Google Scholar]
- Zheng N, Shabek N. Ubiquitin Ligases: Structure, Function, and Regulation. Annu Rev Biochem. 2017;86:129–157. doi: 10.1146/annurev-biochem-060815-014922. [DOI] [PubMed] [Google Scholar]
Associated Data
This section collects any data citations, data availability statements, or supplementary materials included in this article.
Supplementary Materials
Supplementary Figure 1. Isolating CRL substrates using a synthetic human peptidome, Related to Figure 1.
(A and B) Performance of the GPS-peptidome library in HEK-293T cells. (A) Flow cytometry analysis of the starting library (pink line) compared to the four sorted populations (filled histograms). (B) Comparison of the relative stability of the Bin1 population, which contains the most unstable GFP-peptide fusions, compared to GFP alone.
(C and D) Isolation of CRL substrates using the Cullin inhibitor MLN4924. (C) The Bin1 population was treated with either MLN4924 or DMSO and analyzed by flow cytometry. Approximately 8% of the GFP-peptide fusions were stabilized by MLN4924, and these cells were isolated by FACS. (D) The Bin1 MLN4924-responsive cells from (C) were transduced with lentiviruses encoding dominant-negative (DN) Cullins and analyzed by flow cytometry 24 h later.
(E-H) KLHDC3 physically associates with its peptide substrates. (E) HA-tagged KLHDC3 or METAP2 (control) expression constructs were transiently transfected into Clone 3 cells which express an unstable GFP-peptide fusion peptide targeted by Cul2KLHDC3. KLHDC3 was immunoprecipitated with anti-HA antibodies and co-immunoprecipitating proteins identified by immunoblot using the indicated antibodies. (F) HEK-293T cells stably expressing HA-tagged KLHDC3 were transfected with expression constructs encoding the GFP-peptide fusion from Clone 6 (a Cul2KLHDC3 substrate) or Clone 14 (a Cul2FEM1A/C substrate) and analysed as in (E).
(G) KLHDC3 associates with a GFP-peptide substrate generated in vitro. The GFP-peptide expressed by Clone 6 or GFP alone were in vitro transcribed and translated using E. coli extracts and immobilized on magnetic beads coated with anti-GFP antibodies. The beads were then incubated with extracts from cells stably expressing HA-tagged KLHDC3 and binding assessed by immunoblot.
(H and I) A C-terminal glycine residue is required for Cul2KLHDC3 mediated degradation. In addition to the data presented in Figures 1I and 1J, data for a further clone (Clone 5) is shown here. (H) Stabilization of the GFP-peptide fusion was observed by flow cytometry upon mutation of the C-terminal glycine to alanine (G/A) or, to a greater extent, to aspartic acid (G/D). (I) Stabilization was also observed upon the addition of an extra 10 residues (-DNYNEPKANQ*) to the C-terminus.
Supplementary Figure 2. CRISPR/Cas9 genetic screens identify CRL2 BC box adaptors responsible for the degradation of unstable peptides, Related to Figure 1.
(A) Schematic representation of the screen. Seventeen clones expressing GFP-peptide fusions stabilized by expression of DN Cul2 and Cul5 were selected at random and transduced with a CRISPR library targeting 69 CRL2/5 adaptors. The population of cells in which the GFP-peptide fusion was stabilized were then isolated by FACS and the enriched sgRNAs identified by Illumina sequencing.
(B) CRISPR screen results for each of the 17 clones, as determined using the MAGeCK algorithm (7).
Supplementary Figure 3. A GPS-ORFeome screen measures the stability of the human proteome and identifies full-length CRL substrates, Related to Figure 2.
(A) Illumina sequencing of the 3′ ‘barcode’ cassette enables effective identification of the upstream ORF. Example profiles from each of the five sorted populations are shown; each color series represents the distribution of sequencing reads for a different barcode attached to the same GFP-ORF fusion. In each case, highly similar distributions are observed between the different barcodes.
(B) GFP-fusion proteins are predominantly degraded by proteasomes. Each of the five populations was treated with the proteasome inhibitor MG132 (5 μM for 5 h) and stabilization of the GFP-fusion proteins was monitored by flow cytometry.
(C and D) Sorting strategy used to isolate CRL substrates from the GPS-ORFeome library. (C) Populations of cells expressing unstable GFP-ORF fusion proteins were treated for 5 h with 1 mM MLN4924 and the stabilized protein isolated by FACS. After recovery in the absence of the inhibitor, cells in which the GFP-fusion proteins were once again efficiently degraded were recovered in a second sort. Sorting plots for Bin1 are shown; a similar procedure was also carried out using Bin2 and Bin3. (D) The final populations of MLN4924-responsive substrates recovered after sorting were reanalysed in the presence of 1 μM MLN4924.
(E) CRL2 is responsible for degrading the majority of unstable GFP-ORF fusion proteins. The MLN4924-responsive populations isolated from Bin1 and Bin2 were transduced with lentiviral vectors encoding dominant-negative (DN) versions of the indicated Cullins, and the proportion of substrates stabilized was assessed by flow cytometry 24 h later.
Supplementary Figure 4. The CRL2 adaptors KLHDC2, KLHDC3 and KLHDC10 target glycine-ended substrates for proteasomal degradation, Related to Figure 4. (A and B) Defining the glycine-end degron recognized by KLHDC3. (A) Alanine scanning mutagenesis was performed across five Cul2KLHDC3 GFP-peptide substrates, while (B) saturation mutagenesis was performed for one substrate (Clone 8). In each case, the darker the color the greater the degree of stabilization conferred by the mutation.
(C) Isolation of Cul2KLHDC3 substrates. Schematic representation of the experiment. The MLN4924-responsive pool of unstable GFP-peptide fusions was transduced with two independent sgRNAs targeting KLHDC3, and cells in which the GFP-peptide fusion were stabilized were isolated by FACS.
(D and E) Sequence analysis of KLHDC3 substrates. (D) Heatmap displaying the relative enrichment (red) or depletion (blue) of amino acids among the C-terminal tails of KLHDC3 substrates relative to the whole pool of unstable peptides. The vast majority of KLHDC3 substrates have a glycine (G) residue at the terminal position, although some substrates bearing a terminal alanine (A) were also identified. An enrichment for arginine (R), lysine (K) and glutamine (Q) was observed at the penultimate (-2) position. (E) Logoplot representing the consensus C-terminal sequence of all KLHDC3 substrates identified from the GPS-peptidome library
F-H) Identification of glycine-ended peptide CRL substrates using the G-end GPS library.(F) The identity of the penultimate amino acid affects the stability of glycine-ended proteins. The normalized frequency of the indicated amino acids at the penultimate (-2) position relative to the overall frequency of amino acids in the G-end peptide library is shown for each of the three bins. (G) Isolation of CRL substrates. The Bin1 population of cells from the G-end GPS-peptidome library was treated with MLN494 for 5 hours and then analyzed by flow cytometry; approximately 11% of cells expressed GFP-peptide fusions that were stabilized by MLN4924, and these cells were isolated by FACS. (H) Isolation of KLHDC2, KLHDC3 and KLHDC10 substrates. The MLN4924-responsive sorted population from (G) was transduced with Cas9 and sgRNAs targeting either KLHDC2, KLHDC3, KLHDC10 or AAVS1 as a negative control and the indicated populations of cells exhibiting stabilization of the GFP-peptide fusion were isolated by FACS.
Supplementary Figure 5. Cul2APPBP2 targets substrates bearing RxxG motifs near their C-terminus for proteasomal degradation, Related to Figure 5. (A) Schematic representation of the experiment designed to identify the degron recognized by Cul2APPBP2. The MLN4924-responsive pool of GFP-peptide fusions of the GPS-peptidome library was transduced with two independent sgRNAs targeting APPBP2, and cells in which the GFP-peptide fusion was stabilized were isolated by FACS.
(B and C) APPBP2 recognizes C-terminal RxxG motifs. (B) Knockout of APPBP2 stabilizes substrates bearing C-terminal RxxG motifs. HEK-293T cells were transduced with GPS constructs expressing GFP fused to either full-length PXN, peptides corresponding to the C-terminal tails of PIK3C2B and ASCC3, or the peptide sequence of Clone 1 (Figure 1F), and then subsequently transduced with Cas9 and two independent sgRNAs targeting APPBP2 and analyzed 7 days later by flow cytometry. The last 6 amino acids of each GFP-fusion protein are shown with the RxxG motifs underlined. (C) Alteration or repositioning of the RxxG motif stabilizes APPBP2 substrates. Mutation of the RxxG motif (blue line) or repositioning of the RxxG motif through the addition of extra residues (-DNYNEPKVANQ*) at the C-terminus (red line) resulted in the stabilization of the GFP-fusion proteins, as measured by flow cytometry.
(D) Defining the RxxG degron recognized by APPBP2. Saturation mutagenesis was performed for two substrates (left- XP_211896, right- peptide #35 (Table S5)). In each case, the darker the color the greater the degree of stabilization conferred by the mutation.
Supplementary Figure 6. Identifying degrons at the C-termini of human proteins targeted by CRLs, Related to Figure 5. (A) Performance of the C-terminal GPS library in HEK-293T cells. A GPS library in which the last 23 residues of all human proteins were fused to GFP was expressed in HEK-293T cells and sorted into four bins based on the stability of the GFP-peptide fusion protein.
(B) Isolation of C-terminal peptides targeted by CRLs. To purify CRL substrates, the Bin1 and Bin2 populations from the C-terminal GPS-peptidome library were treated with MLN4924 and the cells expressing stabilized GFP-peptide fusions isolated by FACS.
(C and D) Composition of C-terminal motifs targeted by CRLs. The heatmaps display the relative depletion (blue) or enrichment (red) of each amino acid across the last five C-terminal residues of peptide substrates stabilized by MLN4924 that contain a glutamic acid residue at either the -1 or -2 position (C) or an arginine residue at the -3 position (D). This revealed that the C-terminal acidic residues are found together as a twin glutamic acid degron motif (-EE end), while arginine at the -3 position (R at -3 motif) is frequently paired with terminal histidine, proline, aspartic acid or glutamine residues.
(E) CRL2 and CRL4 complexes recognize C-terminal degrons. The MLN4924-reponsive populations from (B) were treated with MLN4924 or transduced with constructs encoding dominant-negative (DN) Cul2, Cul4A or Cul4B; the cells in which the GFP-peptide fusions were stabilized were again isolated by FACS.
Supplementary Figure 7. CRISPR screens identify the CRL adaptors targeting additional classes of C-terminal degrons, Related to Figure 6. (A and B) Validation of CRL-mediated degradation through R-end, EE-end and R at -3 C-terminal degron motifs. Additional validation data is presented here as in Figures 6D and 6E, using a different example peptide sequence in each case. (A) A C-terminal arginine can act as a degron for CRL2-mediated degradation. A GPS construct in which the last 23 residues of SIL1 was fused to GFP was used as an example arginine-end degron. Wild-type GFP-SIL1 peptide is stabilized after 5 h treatment with either MLN4924 or MG132 (top); whereas mutation (middle) or deletion (bottom) of the terminal arginine abrogated CRL-mediated degradation and stabilized the GFP-peptide fusion. (B) CRL4-mediated recognition of C-terminal degrons. Attaching the last 23 residues of MYH3 (ending –EE) or MSRB2 (ending – RxH) to GFP destabilizes the fusion protein; this can be rescued upon exogenous expression of DN Cul4 (top). In each case alanine mutagenesis of the terminal motifs (–EE to –AA and – RxH to –AxA) abolished CRL-mediated degradation; however, the mutant peptides remained unstable and presumably now served as substrates for other E3s (middle). Addition of extra residues at the C-terminus also resulted in stabilization (bottom).
(C) Defining the degrons recognized by DACF12 or TRPC4AP. Saturation mutagenesis was performed for one substrate each. In each case, the darker the color the greater the degree of stabilization conferred by the mutation.
(D-E) CRISPR/Cas9-mediated genetic screens identify additional CRL2 and CRL4 adaptors responsible for C-terminal recognition. (D) Overview of the CRISPR screening strategy. Example 23-mer C-terminal peptides ending in –R (CDK5R1 and SIL1), -EE (MAGEA3 and SAT1) or containing an R at -3 motif (MGAT2, MSRB2 and NPPB) were fused to GFP and expressed in HEK-293T cells, and then transduced with a CRISPR sgRNA library targeting either CRL2 adaptors (-R end peptides) or CRL4 adaptors (-EE end and R-3 motif peptides). The population of cells in which the GFP-peptide fusion was stabilized were then isolated by FACS and the enriched sgRNAs identified by Illumina sequencing. (E) CRISPR screen results for each of the 7 clones, as determined using the MAGeCK algorithm, together with the amino acid sequences of the last 10 residues of each construct.
(F) Regulation of protein stability through the recognition of terminal degrons. As at the N-terminus, an array of E3s identified in this study target proteins bearing C-terminal degron motifs for proteasomal degradation. (B, Elongin B; C, Elongin C).
Table S1. Results from the CRISPR screens on the GPS-peptidome CRL2 clones as analyzed by MAGeCK, Related to Figure 1.
Table S1A contains the results for Clone 1.
Table S1B contains the results for Clone 2.
Table S1C contains the results for Clone 3.
Table S1D contains the results for Clone 4.
Table S1E contains the results for Clone 5. Table S1F contains the results for Clone 6.
Table S1G contains the results for Clone 7.
Table S1H contains the results for Clone 8.
Table S1I contains the results for Clone 9.
Table S1J contains the results for Clone 10.
Table S1K contains the results for Clone 11.
Table S1L contains the results for Clone 12.
Table S1M contains the results for Clone 13.
Table S1N contains the results for Clone 14.
Table S1O contains the results for Clone 15.
Table S1P contains the results for Clone 16.
Table S1Q contains the results for Clone 17.
Table S2. GPS-ORFeome screen data, Related to Figure 2.
Table S2A contains raw GPS data for each barcoded ORF across the five bins and in the three MLN4924-responsive populations.
Table S2B contains collapsed GPS data for each ORF.
Table S3. Alanine scanning mutagenesis experiments for five KLHDC3 substrates clones, Related to Figure 4.
Table S3A contains the results for Clone 3.
Table S3B contains the results for Clone 5.
Table S3C contains the results for Clone 6.
Table S3D contains the results for Clone 7.
Table S3E contains the results for Clone 8.
Table S4. Saturation mutagenesis experiments of peptides bearing C-end degron, Related to Figure 4, 5 and 6.
Table S4A contains saturation mutagenesis of KLHDC3 substrate Clone 8.
Table S4B contains saturation mutagenesis of KLHDC2 substrate EPHB2.
Table S4C contains saturation mutagenesis of KLHDC2 substrate PDGFC.
Table S4D contains saturation mutagenesis of KLHDC3 substrate EMID1.
Table S4E contains saturation mutagenesis of KLHDC3 substrate CHGA.
Table S4F contains saturation mutagenesis of APPBP2 substrate XP_211896.
Table S4G contains saturation mutagenesis of APPBP2 substrate peptide #35 (Table S11).
Table S4H contains saturation mutagenesis of DCAF12 substrate MAGEA3.
Table S4I contains saturation mutagenesis of TRPC4AP substrate MSRB2.
Table S5. Amino acid sequences of KLHDC3 and APPBP2 peptide substrates identified from the original GPS-peptidome screen, Related to Figure 4 and 5.
Table S5A contains KLHDC3 substrates.
Table S5B contains APPBP2 substrates.
Table S6. G-end GPS-peptidome library screen data, Related to Figure 4.
Table S6A contains raw GPS data for G-end GPS screen across the three bins and in the two MLN4924-responsive populations. Table S6B contains KLHDC2 substrates.
Table S6C contains KLHDC3 substrates.
Table S6D contains KLHDC10 substrates.
Table S7. C-terminal 23-mer GPS-peptidome library screen data, Related to Figure 5, 6 and 7.
Table S7A contains raw GPS data for C-terminal 23-mer GPS screen across the four bins and in the two MLN4924-responsive populations.
Table S7B contains computational prediction of C-terminal degrons.
Table S7C contains amino acid sequences of CRL2 substrates from the C-terminal 23-mer GPS-peptidome library. Table S7D contains amino acid sequences of CRL4A substrates.
Table S7E contains amino acid sequences of CRL4B substrates.
Table S7F contains amino acid sequences of CRL4A and CRL4B substrates.
Table S8. Results from the CRISPR screens of the CRL2 and CRL4 substrate C-terminal 23-mer peptides as analyzed by MAGeCK, Related to Figure 6.
Table S8A contains the results for the CDK5R1 construct (R-end).
Table S8B contains the results for the SIL1 construct (R-end).
Table S8C contains the results for the MAGEA3 construct (EE-end).
Table S8D contains the results for the SAT1 construct (EE-end).
Table S8E contains the results for the MGAT2 construct (R-3 motif).
Table S8F contains the results for the NPPB construct (R-3 motif).
Table S8G contains the results for the MSRB2 construct (R-3 motif).