

Abstract
The small and conserved genomes of birds are likely a result of flight-related metabolic constraints. Recombination-driven deletions and minimal transposable element (TE) expansions have led to continually shrinking genomes during evolution of many lineages of volant birds. Despite constraints of genome size in birds, we identified multiple waves of amplification of TEs in Piciformes (woodpeckers, honeyguides, toucans, and barbets). Relative to other bird species’ genomic TE abundance (< 10% of genome), we found ∼17–30% TE content in multiple clades within Piciformes. Several families of the retrotransposon superfamily chicken repeat 1 (CR1) expanded in at least three different waves of activity. The most recent CR1 expansions (∼4–7% of genome) preceded bursts of diversification in the woodpecker clade and in the American barbets + toucans clade. Additionally, we identified several thousand polymorphic CR1 insertions (hundreds per individual) in three closely related woodpecker species. Woodpecker CR1 insertion polymorphisms are maintained at lower frequencies than single nucleotide polymorphisms indicating that purifying selection is acting against additional CR1 copies and that these elements impose a fitness cost on their host. These findings provide evidence of large scale and ongoing TE activity in avian genomes despite continual constraint on genome size.
Keywords: transposable elements, CR1, genomics, woodpeckers, diversification
Introduction
Birds, the only extant saurischian dinosaurs, have comparatively small genome sizes (∼0.9–2.1 Gb) relative to other tetrapods (Gregory et al. 2007; Wright et al. 2014). Flying organisms—including bats, birds, and pterosaurs—have convergently evolved constricted genome sizes (Organ and Shedlock 2009), and a growing body of evidence indicates that avian genome size is constrained by the metabolic requirements of powered flight. A reduced genome size in birds corresponds with decreased intron size (Zhang and Edwards 2012), decreased red blood cell and nucleus size (Gregory 2001, 2002), and increased flight ability (Wright et al. 2014). Among avian ancestors, initial genomic contraction appears to have occurred > 200 Ma in the lineage leading to saurischian dinosaurs (Organ et al. 2007).
Genome size is, however, fluctuating across avian lineages (Hughes and Hughes 1995; Wright et al. 2014; Kapusta et al. 2017), but at a lower relative pace compared with most vertebrates because genome size evolution scales positively with genome size (Oliver et al. 2007). Continual avian genome contraction is driven by recombination-caused deletions of small to large (> 10 kb) segments of the genome (Nam and Ellegren 2012; Kapusta et al. 2017), and a remarkable paucity of transposable elements (TEs) (< 10% genomic content) (Chalopin et al. 2015; Kapusta and Suh 2017; Sotero-Caio et al. 2017). Reduced TE activity likely limits genome size increases and genomic rearrangements, resulting in large-scale synteny in macrochromosomes across highly divergent lineages in the avian clade (Ellegren 2010).
An exception to this trend is the downy woodpecker (Dryobates pubescens), the only species of Piciformes with a complete genome sequence. A major genomic explosion event, that is, massive expansion of TEs (Belyayev 2014), occurred somewhere in the evolutionary lineage leading to this species (Zhang et al. 2014); its genome contains greater than a 2-fold increase in genomic TE content relative to all other sequenced birds, mostly due to expansion of the superfamily chicken-repeat 1 (CR1), a type of non-long terminal repeat (LTR) retrotransposon. Whereas TE insertions may occasionally impact some aspect of an organism’s phenotype, periods of intense TE amplification can potentially instigate profound genomic changes and may promote evolutionary diversification (Jurka et al. 2007; Belyayev 2014; Hoffmann et al. 2015). Coincident bursts of lineage diversification and genomic explosions of TEs have been identified in radiations of fishes (de Boer et al. 2007) and mammals (Pascale et al. 1990; Pritham and Feschotte 2007; Ray et al. 2008).
Some evidence supports that genome size increased slightly in the ancestor of Piciformes (Wright et al. 2014); this is suggestive of potential TE expansions across the entire clade outpacing deletions that maintain small genome size. To date, only one piciform genome has been sequenced, and its sister lineage (Galbuliformes) lacks any genome sequence, precluding inference about scale, temporal dynamics, and evolutionary context and extent of genomic TE expansions in Piciformes. With whole-genome shotgun sequencing data, we used two data sets to characterize transposable element evolution in Piciformes. First, we sequenced representatives of all major lineages of Piciformes (fig. 1a)—including woodpeckers, honeyguides, toucans, and barbets—and a single lineage of Galbuliformes—a jacamar—to characterize genomic TE expansions and periods of activity. In addition, we sequenced several individuals of closely related woodpeckers (Genus: Dryobates) to describe TE polymorphisms. The results indicate at least three genomic expansions of different families of CR1, which preceded diversification rate shifts in two clades. In addition, several thousand polymorphic TEs are found at low frequencies relative to single nucleotide polymorphisms, suggestive of ongoing negative selection against TE expansions.
Fig. 1.

—Summary of Piciformes genomic transposable element content. (a) Phylogeny of samples in our study [based on phylogeny of Jetz et al. (2012)]. (b) Summary of TE superfamily content. Stars indicate estimates from fully assembled genomes (Jarvis et al. 2014) and show that our estimates are conservative and underestimate genomic TE content. (c) Summary of select TE families genomic content. (d) Divergence curves of select CR1 families based on BLASTing raw TE matches to a portion of the 3′ end of species- and TE-specific consensus sequences (see supplementary table S1, Supplementary Material online). The y axis is the relative frequency of percent divergence, and the families are on different scales to make them all legible. (e) Genome size estimates of all sampled clades (Gregory et al. 2007). Gray boxes highlight the Picidae clade (woodpeckers) and the clade including barbets and toucans.
Materials and Methods
Sampling
To characterize TE diversity and genomic content across Piciformes’ genomes, we partially sequenced the genome of 13 species in the avian orders Piciformes and Galbuliformes at low coverage (0.75× following conservative quality trimming, assuming a 1.2 Gb genome) and downloaded raw sequencing reads for the downy woodpecker (Dryobates pubescens) and the northern carmine bee-eater (Merops nubicus) from avian phylogenomics projects (Jarvis et al. 2014) (table 1). We implemented this sampling scheme to maximize phylogenetic diversity in woodpeckers (family: Picidae) and to represent other major lineages in Piciformes. For previously sequenced genomes, we used the reads from library preparations with a target insert size of 500 bp for direct comparability to our newly sequenced data. All tissue samples were provided by the University of Kansas Biodiversity Institute. We used the bee-eater as an outgroup, a jacamar as a more closely related outgroup, and included representatives of major lineages within Piciformes, including major woodpecker clades (Dufort 2016; Shakya et al. 2017), honeyguides, three lineages of barbets, and toucans (fig. 1a and table 1). Hereafter, we refer to these samples as the “phylogeny data set.”
Table 1.
Sampling Information
| Common Name | Species Name | Sample # | Set | # Reads | Prop. Reads |
|---|---|---|---|---|---|
| Northern Carmine Bee-eater | Merops nubicus | SRR958514 | Phy | 12,000,000 | 0.51 |
| Bluish-fronted Jacamar | Galbula cyanescens | KU 24566 | Phy | 14,193,044 | 0.77 |
| Green-eared Barbet | Psilopogon faiostrictus | KU 33324 | Phy | 15,599,647 | 0.61 |
| Vieillot’s Barbet | Lybius vieilloti | KU 15540 | Phy | 19,029,009 | 0.64 |
| Green-billed Toucan | Ramphastos dicolorus | KU 3649 | Phy | 18,531,397 | 0.64 |
| Gilded Barbet | Capito auratus | KU 18855 | Phy | 12,855,219 | 0.74 |
| Spotted Honeyguide | Indicator maculatus | KU 29101 | Phy | 17,445,057 | 0.78 |
| Rufous Piculet | Sasia abnormis | KU 24421 | Phy | 16,261,827 | 0.69 |
| Antillean Piculet | Nesoctites micromegas | KU 8153 | Phy | 15,253,876 | 0.77 |
| Greater Flameback | Chrysocolaptes lucidus | KU 25777 | Phy | 11,283,426 | 0.72 |
| Gilded Flicker | Colaptes chrysoides | KU 30078 | Phy | 16,480,947 | 0.84 |
| Yellow-bellied Sapsucker | Sphyrapicus varius | KU 21911 | Phy | 17,981,465 | 0.82 |
| Eurasian Three-toed Woodpecker | Picoides tridactylus | KU 30447 | Phy | 10,515,156 | 0.67 |
| Brown-backed Woodpecker | Dendropicos obsoletus | KU 20039 | Phy | 9,945,685 | 0.69 |
| Downy Woodpecker | Dryobates pubescens | SRR949789 | Phy | 12,000,000 | 0.66 |
| Nuttall’s Woodpecker | Dryobates nuttallii | KU 29815 | Pol | 39,814,228 | 0.94 |
| Nuttall’s Woodpecker | Dryobates nuttallii | KU 29816 | Pol | 59,121,354 | 0.96 |
| Ladder-backed Woodpecker | Dryobates scalaris | KU 29797 | Pol | 74,403,829 | 0.97 |
| Ladder-backed Woodpecker | Dryobates scalaris | KU 30061 | Pol | 53,177,745 | 0.96 |
| Downy Woodpecker | Dryobates pubescens | KU 11987 | Pol | 57,308,585 | 0.96 |
| Downy Woodpecker | Dryobates pubescens | KU 15939 | Pol | 60,567,542 | 0.97 |
Note.—KU samples from University of Kansas Biodiversity Institute and SRR numbers from NCBI sequence read archive.
Phy, phylogenetic data set; Pol, polymorphisms data set; # reads, number raw reads in FASTQ files; Prop. Reads, proportion of raw reads retained after quality trimming.
We also sequenced the genome of two samples each of downy woodpecker (Dryobates pubescens), ladder-backed woodpecker (D. scalaris), and Nuttall’s woodpecker (D. nuttallii) at moderate-coverage (4–8× following quality trimming) to investigate CR1 insertion polymorphisms in closely related individuals and species (table 1 and fig. 2a). The ladder-backed woodpecker and Nuttall’s woodpecker are sister species, with both together the sister lineage of the downy woodpecker (Weibel and Moore 2002; Dufort 2016). Hereafter, we refer to these samples as the “polymorphisms data set.”
Fig. 2.

—Patterns of CR1 polymorphisms in three closely related woodpeckers (genus Dryobates). (a) Patterns of CR1 J3_Pass insertion polymorphisms. Numbers on branches indicate fixed differences in that lineage. (b) Variation of insertion detection using four sensitivity settings in the MELT analyses. (c) Pairwise comparisons of polymorphisms* in four CR1 families relative to single nucleotide polymorphisms (SNPs). * = [FixedBETWEEN/(FixedBETWEEN + PolymorphicWITHIN)].
We extracted genomic DNA from all tissue samples using a magnetic bead DNA extraction protocol (Rohland and Reich 2012). We quantified all DNA extractions—for concentration standardization—using Qubit Fluorometric Quantitation (Life Technologies). We used standard Illumina library preparation for each sample (mean insert size between 500 and 700 bp), and then sequenced all individuals on either an Illumina HiSeq2500 (101-bp paired-end) or Illumina HiSeq3000 (151-bp paired-end). Sequencing was performed at the New York University Abu Dhabi Center for Genomics and Systems Biology (HiSeq2500) or at the Oklahoma Medical Research Foundation Clinical Genomics Center (HiSeq3000).
Phylogeny Data Set Quality Checking and Repeat Database Creation
We used Trimmomatic v0.36 (Bolger et al. 2014) to remove adapter contamination and trim reads of low-quality bases. We trimmed all bases below a threshold of Q20 on the ends of all sequences, and trimmed regions of the sequences if the average quality dropped below Q30 in sliding windows of 15 bp. Following trimming, reads were retained if they were still ≥ 75 bp to limit spurious short-read matches to TEs.
All reads were filtered for mitochondrial DNA sequences using the bbsplit.sh perl script implemented as part of BBMap v36.x (Bushnell 2014). We used several mitogenomes of birds from the orders Coraciiformes, Galbuliformes, and Piciformes to filter reads. We standardized the number of basepairs (bp) per individual, trimmed every sequence to 75 bp using the FASTX toolkit (Gordon and Hannon 2010) and then used Seqtk v1.2-r95-dirty (Li 2015) to randomly sample six million paired-end reads from each individual, which we used for all downstream analyses.
We used REPdenovo (Chu et al. 2016) with the default settings to identify putative transposable elements and repetitive sequences from the raw sequencing reads. REPdenovo is a kmer-based approach that identifies overrepresented kmers in the genome. Following initial kmer identification, these sequences are joined where possible to create longer contigs. With the output contigs from REPdenovo, we used a homology-based approach to identify putative transposable elements. First, we downloaded the vertebrate database of repetitive elements from RepBase v21.10, accessed on October 10, 2016 (Jurka et al. 2005). We used BLAST+ v2.6.0 (Camacho et al. 2009) and the function rmblastn to match REPdenovo contigs to previously identified transposable elements and repeats. rmblastn is a modified function of blastn for use with RepeatMasker (Smit et al. 2015). For annotation to transposable elements, we required the matches to have a minimum of 60% identity to a previously annotated element, alignment length of ≥ 50 bp, and an e-value < 1e-6. All BLAST matches >90% identity were removed because raw reads would be mappable to original RepBase sequences. We created a custom repeat database for further analyses by combining the newly annotated repeats with the RepBase database. After de novo repeat identification and sequence annotation, we included 5,732 novel repeat sequences in our modified repeat database. We identified novel repeat sequences with homology matches to 123 TE families, largely CR1 elements or endogenous retroviruses. In total, the vast majority (∼85%) of newly identified repeats for our custom database shared homology with CR1 elements.
Summarizing Transposable Element Content in Piciformes (Phylogeny Data Set)
We used six million paired-end sequencing reads per individual and our custom repeat database to identify the proportion of each species’ genome comprised of transposable elements (fig. 3). We used BLAST+ to match raw reads to our custom repeat database with the following requirements: maximum e-value of 0.01 (1e-2), a minimum of 60% identity, and less than three gaps in the alignment. We minimized the number of gaps allowed to minimize matching of spurious short portions of reads matching multiple regions of TE sequences with wide-spanning gaps.
Fig. 3.

—Workflow to detect genomic TE content using low-coverage shotgun sequencing of Piciformes genomes. Detailed information for all steps is described in Materials and Methods. Green shaded ovals indicate output used for comparisons and are summarized in figure 1.
We performed the above BLAST+ search with the RepBase database (i.e., not including our newly annotated TEs) to see how including species-specific repetitive sequence information improved overall TE identification across low-coverage genomes. Additionally, we summarized results with various maximum e-values (1e-2, 1e-4, and 1e-6) to investigate sensitivity of genome-wide TE content estimation to this parameter.
We extracted all reads matching several common CR1 families (supplementary table S1, Supplementary Material online) for downstream use. We used all reads that completely matched TEs (i.e., 75 bp alignment) to perform reference-guided assemblies in Geneious v9.1.7 (BioMatters Ltd.). The RepBase reference sequences for each subfamily were used to guide assembly. From these assemblies, we created consensus sequences for each subfamily using a minimum of 10× coverage and a 25% threshold to call the consensus sequence bases. For each species, we created a separate consensus sequence for each subfamily. We aligned all consensus sequences for each of the four common CR1 families using MAFFT (Katoh and Standley 2013), implemented in Geneious. For each of these families, we extracted the longest stretch of aligned consensus sequences that was covered by each species (supplementary table S1, Supplementary Material online). From these alignments, we created a neighbor-joining phylogeny using Tamura–Nei distance matrices in Geneious (fig. 4).
Fig. 4.
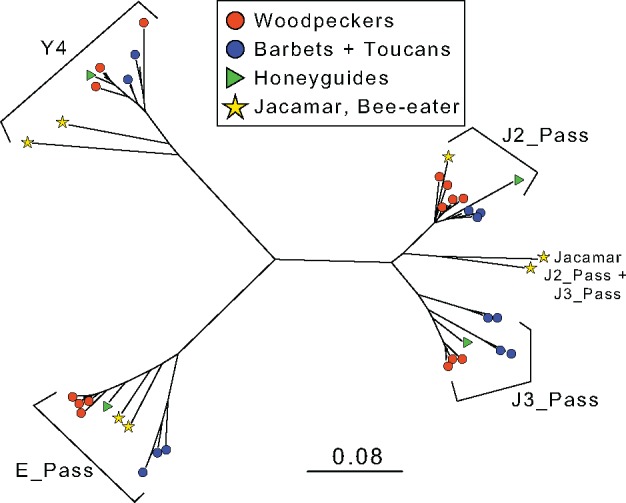
—Neighbor-joining phylogeny of consensus TE sequences from CR1 families with large expansions in Piciformes genomes. The scale bar indicates estimated sequence divergence across the phylogeny.
Our next goal with the common CR1 consensus sequences was to identify trends in percent sequence divergence to investigate amplification patterns. CR1 insertions in the genome initiate on the 3′ end of the full length element, with most insertions only including a small portion (i.e., severe 5′ truncations) of the complete element (Burch et al. 1993). Indeed, we observed a majority of the raw reads matching their respective consensus sequences near the 3′ end. Because we did not want to bias our results if there might be differential selective pressures (or ages) for shorter or longer CR1 insertions, as well as to keep analyses consistent between different CR1 families, we limited our analysis to sequences matching 500 bp regions near the 3′ end of the full-length CR1 consensus sequences (supplementary table S1, Supplementary Material online). We used raw reads that were initially identified as one of these four CR1 families to measure percent sequence divergence from species-specific consensus sequences using BLAST+. We created divergence histograms from this output with reads containing ≥ 50 bp matching the CR1 consensus sequences (fig. 1d and supplementary table S1, Supplementary Material online).
CR1 Polymorphism Detection in Three Woodpecker Species (Polymorphisms Data Set)
We used Trimmomatic v0.36 (Bolger et al. 2014) for quality filtering of all raw reads with less conservative filtering relative to the phylogeny data set because of higher representative coverage. We removed adapter contamination and trimmed reads of low-quality bases using the following filters: we removed all bases below a quality of Q20 on the ends of all sequences, and trimmed regions in sliding windows of 25 bp if the average quality dropped below Q20. We filtered mitochondrial DNA with the bbsplit.sh perl script implemented as part of BBMap v36.x (Bushnell 2014) with the downy woodpecker mitochondrial genome as a reference.
We used the BWA-MEM implementation of the Burrows–Wheeler transform algorithm in BWA (Li and Durbin 2009) to align all quality-filtered sequences to the downy woodpecker (Dryobates pubescens) genome (April 28, 2014 version, dx.doi.org/10.5524/101012). We used samtools v1.4.1 (Li et al. 2009) to convert the BWA output SAM file to BAM format. Next, we cleaned, sorted, added read groups to, and removed duplicates from the BAM file for each individual using Picard (available at: http://broadinstitute.github.io/picard).
We used the final cleaned and filtered BAM files for each individual as input for detecting polymorphic transposable elements with the Mobile Element Locator Tool v2.1.2 (MELT) (Gardner et al. 2017). MELT uses unaligned and split reads from BWA alignments, a reference genome, and consensus TE sequences to identify polymorphic TEs. Because MELT relies on sequence similarity for identifying TEs, we could not use reference elements from RepBase. Instead, we used the downy woodpecker partial consensus sequences of the CR1 subfamilies J3_Pass (length = 3,720 bp), J2_Pass (2,934 bp), E_Pass (2,655 bp), and Y4 (1,214 bp) that we created for use in the phylogeny data set. While these are not full-length consensus sequences, we are confident they are representative of their respective CR1 subfamilies in the three species of Dryobates woodpeckers investigated here because of the large number of sequencing reads used to construct the consensus sequences, the fact that the consensus sequences are typical representatives of their respective subfamilies, and because they generally reflect the phylogenetic patterns in their hosts (fig. 4). We preprocessed BAM and TE consensus files with the “Preprocess” and “BuildTransposonZIP” utilities of MELT, respectively.
When detecting polymorphic TEs in multiple individuals, MELT is a multistep process: 1) Discovery of potential TEs in each individual (“IndivAnalysis”); 2) Output of all individuals’ TE discovery analyses are compiled together to identify putative insertion breakpoints in the reference genome (“GroupAnalysis”); 3) Genotyping of all insertions for each individual (“Genotype”); and 4) Filtering of genotype files and variant call format (VCF) file creation (“MakeVCF”). We limited the MELT analyses to scaffolds of at least two megabases (n = 179; ∼52% of genome) because highly fragmented scaffolds and contigs influence the performance of the program. These four steps were run for each CR1 family separately. MELT allows different sensitivity thresholds for TE detection by changing the maximum amount of allowed divergence between putative polymorphic TEs and the consensus sequence. We used four maximum divergence levels (3%, 6%, 10%, and 15%) to have conservative and liberal TE polymorphism estimates (i.e., different sensitivity levels). Any polymorphisms called by MELT for more than one of the CR1 families (breakpoints within 100 bp to allow some error) were matched to the most similar CR1 consensus sequence and removed from other VCF files. We additionally postprocessed the MELT output using several filtering steps by removing: 1) putative insertions near scaffold breakpoints (≤ 10 kb) to limit any effects of misassembly on scaffold edges; 2) TEs called with limited evidence, for example, imprecise breakpoints due to ambiguous alignment (MELT ASSESS flag ≥ 3); 3) reads not passing MELT’s suggested quality filters (MELT FILTER flag == PASS); and 4) any polymorphic TEs with missing calls for any individuals.
To compare CR1 polymorphisms to putatively neutral genomic patterns, we called single nucleotide polymorphisms (SNPs) from all six Dryobates individuals. From the filtered and cleaned BAM file, we used the Genome Analysis Toolkit (GATK) (McKenna et al. 2010) HaplotypeCaller to create an intermediate genomic variant call format (gVCF) file for each individual. All gVCFs were used as input in GATK to group genotype all SNPs and small indels. We filtered all output SNPs in VCFtools v0.1.14 (Danecek et al. 2011) to keep those with the following conditions: 1) sites with quality ≥ 20; 2) genotypes with quality ≥ 20; 3) biallelic SNPs; 4) minimum depth per individual ≥ 5; 5) maximum mean depth per individual < 20; and 6) the site is covered in all individuals. Lastly, we only used SNPs present on the scaffolds used in MELT analyses for comparisons.
Analysis of Diversification Rates in Piciformes
We used the program Bayesian Analysis of Macroevolutionary Mixtures (BAMM) v2.5.0 (Rabosky 2014; Rabosky et al. 2014; Mitchell and Rabosky 2017) to assess whether bursts of TE amplification coincide with diversification in Piciformes. For the input phylogeny for BAMM, we obtained data for all individuals of the Coraciiformes, Galbuliformes, and Piciformes with available genetic data from birdtree.org (Hackett et al. 2008; Jetz et al. 2012) using the Hackett 6670 OTUs data set. We used the highest clade credibility phylogeny from the 10,000 tree set as input. We used the BAMMtools (Rabosky et al. 2014) function “setBAMMpriors” to determine all input prior settings for BAMM, that is, using empirically optimized parameterization. We ran two iterations of BAMM with 100 million MCMC generations, using 10% burn-in (supplementary fig. S1, Supplementary Material online) and an assumption of 50% missing taxa. This resulted in effective sample sizes for all estimated paramaters > 3,500, and estimates of 23 or 25 variations of credible shifts in the 95% posterior distribution for the two runs. The major distinctive shift configurations output from the two BAMM iterations were largely the same; the different configurations had slight variation of node placement (supplementary fig. S1, Supplementary Material online). For example, one rate shift varied between the nodes of the woodpecker clade Picinae to the Picidae clade, which is inclusive of Picinae and a few more genera (supplementary fig. S1, Supplementary Material online).
Recently, a critical analysis of BAMM (Moore et al. 2016) identified several putative flaws with the methodologies and consistency of the program, to which BAMM’s authors provided a rebuttal (Rabosky et al. 2017): 1) the posterior of BAMM has strong prior sensitivity, 2) a faulty nondefault extinction-rate calculation, 3) strong impact of unobserved lineages on final rate shift results, and 4) unreliable results when many shifts are present relative to the number of extant tips in the phylogeny. Rabosky et al. (2017) showed that these arguments were either flawed or did not have significant effects on final results when reasonable considerations were taken: 1) checking whether the prior distribution systematically shaped the posterior distribution, 2) use of nonhidden, that is, default, extinction parameterization, 3) the use of empirically parameterized values for the calculations, and 4) the use of phylogenies with a large tip to rate-shift ratio (> 10: 1). We followed the protocols outlined by (Rabosky et al. 2017) and additional guidelines at (http://bamm-project.org), checked the distribution of the prior versus the posterior (supplementary fig. S1, Supplementary Material online), used empirically derived values for calculations as determined using BAMMtools (Rabosky et al. 2014), and used a phylogeny with hundreds of tips relative to only a few possible variations of estimated rate shifts (supplementary fig. S1, Supplementary Material online).
Nesoctites Satellite Investigation
In Nesoctites, we found a distinct pattern in the rank-abundance curves (supplementary fig. S2, Supplementary Material online), due to a large expansion of satellite DNA (∼10.5% of genome; fig. 1b). The majority of the satellite BLAST matches in Nesoctites were similar to a 153-bp repeat identified with REPdenovo (supplementary fig. S2a, Supplementary Material online). We manually investigated the satellite sequences to ensure these results were not spurious. First, we aligned 2,000 75-bp sequence matches using MAFFT (Katoh and Standley 2013) to create a consensus sequence of the satellite. Within the consensus, we used mreps (Kolpakov et al. 2003) to identify any repetitive elements of the consensus. We found a 10-bp motif (supplementary fig. S2c, Supplementary Material online) with 3.5 repeats in the consensus. We searched all long Nesoctites satellite BLAST matches (≥ 70 bp, n = 594,155) for the repeat motif using the Biostrings R package (Pages et al. 2017), while allowing one mutation maximum (i.e., one mismatch) in the repeat motif.
Results
Characterizing TE Dynamics with Whole-Genome Shotgun Sequencing
We used whole-genome shotgun sequencing data to characterize TE abundance and diversity across the genomes of Piciformes. We identified a massive expansion of the retrotransposon superfamily CR1 (13–19% genomic content) in the woodpecker and toucans + barbets clades, but not in honeyguides or jacamars (fig. 1b andsupplementary table S2, Supplementary Material online). Minor expansions (< 2% genomic content) of endogenous retrovirus (ERV3) and woodpecker-specific R2 elements were also identified (fig. 1b and supplementary table S2, Supplementary Material online). One piculet species (Nesoctites micromegas), from a monotypic genus endemic to Hispaniola, displayed a massive expansion of satellite sequence in its genome (fig. 1b). With further investigation of these satellite sequences, we found the sequences exhibited an abundance of a 10-bp repeat motif (median = three motifs per 75 bp sequence, sd = 1.11; supplementary fig. S2, Supplementary Material online). Compared with the two previously assembled genomes—northern carmine bee-eater and downy woodpecker—our approach underestimated genomic TE content by ∼2–5% (fig. 1b), suggesting our approach in identifying genomic TE content is conservative. Using different sensitivities for detecting TEs, we found small changes in the absolute levels of genomic TE content (up to 4% less), but not in relative differences between species (supplementary fig. S3, Supplementary Material online). It was critical to incorporate the custom repeats into the repeat search database; using only the RepBase consensus sequences resulted in missing a large proportion of TEs (∼1–15% genomic content), which positively scaled with genomic TE content, that is, more TEs were missed in genomes with more TE content (supplementary fig. S4, Supplementary Material online). Overall, this approach could be implemented with few reads per individual for overall genomic TE content and TE family content; we recovered consistent results when we used subsets of 100,000 sequencing reads (supplementary fig. S5 and table S2, Supplementary Material online).
The CR1 expansion in Piciformes is due to at least three waves of activity in different CR1 families (fig. 1c and supplementary table S3, Supplementary Material online): 1) All Piciformes had modest expansions (∼1–2% of genome each; i.e., tens of millions of bp) of J2_Pass and Y4; 2) The woodpeckers had a major expansion of J3_Pass (∼4–5%) and a minor expansion of E_Pass (∼1–2%); 3) Lastly, the barbets + toucans clade had mixed patterns, but massive overall expansions of J3_Pass + E_Pass (∼8–10%). These results specifically exemplify the dynamic nature of the E_Pass and J3_Pass families; these two families each amplified at least twice and to different magnitudes (fig. 1c) in the barbets + toucans and woodpecker clades. Apart from major CR1 genomic explosions, all Piciformes genomes are generally homogenous in TE richness (types of TEs) and evenness (similarity of TE abundances across species) (supplementary fig. S6, Supplementary Material online). To estimate divergence curves for the J3_Pass, E_Pass, J2_Pass, and Y4 families, we created species-specific and CR1 family specific consensus sequences for each species (fig. 4 and supplementary table S1, Supplementary Material online) and estimated divergence of sequence reads from consensus sequences. The clade-specific expansions of J3_Pass and E_Pass occurred simultaneously, as well as more recently than Piciformes-wide expansions of J2_Pass and Y4 (fig. 1d and supplementary table S1, Supplementary Material online).
Because large expansions of TEs, and associated genomic changes, may promote evolutionary diversification (Jurka et al. 2007; Belyayev 2014; Hoffmann et al. 2015) we looked for bursts of speciation that may coincide with major TE expansions in Piciformes. Using BAMM, we found two consistent shifts in diversification rate that follow clade-specific TE expansions: 1) increased diversification in the early radiation of either Picidae (all woodpeckers) or Picinae (all woodpeckers excluding several genera of wrynecks and piculets: Jynx, Picumnus, Sasia, Verreauxia, and Vivia); and 2) increased diversification in the early radiation of either both Ramphastidae + Capitonidae (toucans and American barbets, respectively) or only Ramphastidae (supplementary fig. S1, Supplementary Material online).
CR1 Polymorphisms in Three Species of Closely Related Woodpeckers
We searched for the presence of polymorphic CR1 insertions in the downy woodpecker and two close relatives to determine if CR1 is still active in woodpeckers. We also characterized several traits of polymorphic TEs to determine whether polymorphic CR1s show different patterns relative to those exhibited in the downy woodpecker genome. Polymorphic CR1s were largely short (< 1,000 bp) and truncated on the 5′ end (supplementary fig. S7, Supplementary Material online); ∼20–25% of polymorphic CR1s were intronic and had a random orientation relative to their respective gene insertion site (∼50% same orientation as gene) (supplementary table S4, Supplementary Material online). These general patterns of the polymorphic CR1s mirror the downy woodpecker genome-wide patterns of CR1 truncation, intronic abundance, and orientation within genes, suggesting that current patterns of CR1 activity mirror general trends of long-term CR1 accumulation. We compared putatively neutral genetic variation (i.e., genome-wide SNPs) with CR1 J3_Pass polymorphisms, the most abundant TEs in woodpeckers. We found a much smaller proportion of CR1 J3_Pass polymorphisms to be fixed between species than SNPs (fig. 2c); similarly, J3_Pass insertions had a much higher frequency of singletons than SNPs (supplementary fig. S8, Supplementary Material online). We looked at patterns of observed heterozygosity across all individuals to see if neutral genetic diversity was related to diversity of TE insertion polymorphisms and found that observed heterozygosity was negatively correlated between SNPs and CR1 insertions, but positively correlated among all CR1 families (supplementary table S5, Supplementary Material online). Because selection is more effective in large populations relative to smaller populations, this pattern is consistent with selection acting against CR1 proliferation, because genomes with higher genetic diversity—and likely higher recent population sizes—have lower diversity of CR1 polymorphisms.
Discussion
Multiple Transposable Element Genomic Explosions in Piciformes
Our results demonstrate multiple, independent waves of CR1 amplification in the Piciformes, with clade-specific expansions of a similar magnitude to total TE content identified in most bird genomes (Zhang et al. 2014). The history of TE proliferation and activity in Piciformes is dynamic (fig. 1); we found different temporal patterns of CR1 activity. The J2_Pass and Y4 families were active and amplifying at low levels during early evolution of the Piciformes clade, but lineage-specific amplification of different CR1 subsets occurred subsequently. The honeyguides exhibit more TE content than most birds, but have relatively small expansions of CR1s compared with all other Piciformes (fig. 1a). The toucans + barbets clade displayed the highest amplitude of CR1 expansions from the J3_Pass and E_Pass families, with distinct patterns in different lineages. Lastly, we found remarkably consistent patterns of TE superfamily and family abundance across woodpeckers (fig. 1) with major amplifications of the CR1 J3_Pass and a clade-specific amplification of an R2 element described from the downy woodpecker genome. One major deviant from the general trend in woodpeckers was Nesoctites, with expansions of satellite sequences (fig. 1a and supplementary fig. S2, Supplementary Material online). Nesoctites is the lone representative of a monotypic genus and will need to be investigated further with high-coverage genomic sequencing and assembly. Similarly, a recent study identified a large genomic proportion of satellites in a North American bird species, the northern spotted owl (Strix occidentalis caurina) (Hanna et al. 2017).
Large and variable clade-specific expansions of CR1s cause distinct evolutionary genomic patterns and lineage-specific increases in genomic content. Overall, genome size in Piciformes (fig. 1e) likely increased relative to the clade’s common ancestor (Wright et al. 2014), varies slightly among Piciformes lineages, and differs by several hundred Mb within lineages (fig. 1e). Recently, genome-wide analyses of bird genome assemblies indicated that genome size remains relatively static through evolutionary time despite TE activity due to mid- and large-scale deletions (Kapusta et al. 2017). However, these genome-size stability analyses relied on highly fragmented genome assemblies and taxonomic sampling at the level of avian orders.
Despite the genome size variation across birds (range ∼0.9 to 2.1 Gb), the current collection of avian genome assemblies is largely homogenous in size (Zhang et al. 2014), with moderate-coverage assemblies generally ranging between ∼1.0 and 1.3 Gb. The discrepancy between genome-size estimates and genome-assembly sizes suggests we are missing a large portion of avian genome size dynamics through the inability to accurately annotate and assemble large-scale interspersed repetitive elements in avian genomes. Although no genome size estimate exists for the downy woodpecker to compare with its genome assembly, one of its two closest relatives (Nuttall’s woodpecker, Dryobates nuttallii) has a genome size of ∼1.48 Gb (Gregory et al. 2007), which indicates an incongruence of at least 200 Mb. These gaps in genome assemblies are likely due to the most difficult regions to assemble: highly repetitive elements. The misrepresentation of genome size dynamics with highly fragmented assemblies is exemplified by two recent surveys with high-quality and chromosome-scale genome assemblies (chicken and crow) that have identified large genomic regions of repetitive elements that were undetected and unaccounted for in short-read sequencing assemblies (Kapusta and Suh 2017; Weissensteiner et al. 2017). This suggests that while some genome size variation in birds may be moderated with mid- and large-scale deletions (Kapusta et al. 2017), we are also missing a substantial portion of the picture with most current genome assemblies.
Massive CR1 Expansions Precede Shifts in Diversification Rate
We found that two large bursts of CR1 activity preceded bursts of diversification in the woodpeckers and in the toucans + barbets (but also see other slightly different possibilities in supplementary fig. S1, Supplementary Material online). Transposable elements have long been recognized to have potential for rearranging genomes, with phenotypic consequences (Feschotte and Pritham 2007; Feschotte 2008), and it was proposed that TEs could promote speciation when bursts of diversification occur simultaneous with or after TE genomic amplification (Jurka et al. 2007; Belyayev 2014; Hoffmann et al. 2015). This provides a chicken or the egg type of question (the egg definitely came before the chicken.): Does rapid diversification induce rampant TE activity or does TE amplification promote increased speciation rates and consequent rapid diversification?
During rapid diversification, small populations—due to founder events or other causes—will be more influenced by genetic drift and have less effective selection against TE expansions (Tollis and Boissinot 2013; Ruggiero et al. 2017; Trizzino et al. 2017). Similarly, populations experiencing novel stressors, such as during population expansions to new environments, could experience disruption of TE epigenetic repression (Zeh et al. 2009). In contrast, the TE-thrust hypothesis (Oliver and Greene 2011, 2012) posits that the continuum of TE activity—from extinct to highly abundant and active—has various evolutionary consequences. With a moderate TE abundance and activity in a lineage’s genomes, the TE-thrust hypothesis suggests those genomes are more dynamic, adaptable, and may lead to increased rates of speciation (Oliver and Greene 2011, 2012).
While the present data do not allow us to distinguish between these two possibilities, it is unlikely by chance that rapid diversification and large TE expansions coincided. A large body of evidence indicates that TE activity contributed to novel phenotypes (Feschotte 2008; Belyayev 2014; Trizzino et al. 2017), and TE expansions occurring coincidently with diversification is documented in fishes (de Boer et al. 2007), mammals (Pascale et al. 1990; Pritham and Feschotte 2007; Ray et al. 2008), and now birds (this study). Because the massive CR1 expansions we identified here precede diversification rate shifts in Piciformes, we hypothesize that TEs may have promoted genomic novelty in the woodpecker and barbets + toucans clades and contributed to their bursts of increased diversification rate, although we cannot imply causation and this hypothesis will require further investigation using high-coverage genomic data for this group.
Woodpeckers Have Moderate Levels of CR1 Polymorphisms
We identified thousands of polymorphic CR1 elements in three woodpecker species in the genus Dryobates (fig. 2). CR1 polymorphisms may be present in these species due to maintained ancestral polymorphism since their most recent common ancestor, that is, at least several Ma (Shakya et al. 2017) or continually maintained through low but continual CR1 activity. The magnitude of CR1 activity in woodpeckers produced a number of insertion polymorphisms similar to those in other vertebrates with greater genomic TE content. For example, the woodpecker CR1 polymorphism level we identified is greater in magnitude than LINE-1 polymorphisms in humans (Stewart et al. 2011), as would be expected because most LINE-1 elements are inactive in humans. In contrast, the green anole (Anolis carolinensis) has more than double the number of CR1 polymorphisms per individual than we found in our samples (Ruggiero et al. 2017).
Similar to the overall pattern of the woodpecker genome, CR1 polymorphisms showed a trend of extreme 5′ truncation (supplementary fig. S7, Supplementary Material online), consistent with patterns in anoles (Ruggiero et al. 2017). These highly truncated CR1 elements are essentially inactive on insertion, and are likely the result of inefficient reverse transcription or host interruption of reverse transcription (Levin and Moran 2011). Consequently, CR1s are precluded from overactivity but maintain some genomic proliferation with few functional copies producing mainly truncated copies. J3_Pass CR1 polymorphism insertions are maintained at lower frequencies than SNP minor alleles, similar to patterns in anoles (Ruggiero et al. 2017). The low to moderate, but nonzero, frequency of CR1 insertions is strongly suggestive of ongoing selection against additional CR1 genomic expansions in the woodpecker lineage. Selection against ongoing expansions may be due to continued constraints on genome size, or, alternatively, due to negative effects of high retrotransposition rates, for example, a high prevalence of ectopic recombination.
If woodpecker genomes exhibit continued selection against high levels of CR1 proliferation, the question remains how CR1s amplified to such high numbers in the recent evolutionary past. Two mechanisms potentially explain CR1 proliferation throughout the woodpecker genomes. First, novel features of CR1s, such as new promoter classes (as observed in human LINE-1 elements; Khan et al. 2006), start amplifying because host genomes lack strong defense mechanisms against TEs with newly evolved features. This hypothesis is doubtful for woodpeckers, because all CR1 consensus sequences look like normal CR1s relative to outgroup sequences (fig. 4). Alternatively, and more likely, population fragmentation, founder events, or speciation may result in small population sizes, and subsequently allow CR1 accumulation through drift (Jurka et al. 2011), whereas in larger populations CR1 accumulation would be limited by selection. In particular, accumulation of relatively more deleterious full-length CR1s could cause higher retrotransposition rates and cause genomic CR1 copy number increases.
Altogether, CR1 polymorphisms at low to moderate levels and selection against large CR1 genomic expansions in the woodpecker lineage, together with high levels of TE amplification across Piciformes, provide multiple lines of evidence that woodpeckers’ and related species’ genomes are not a barren landscape of fossil TEs, but a landscape under the influence of prolonged and ongoing TE action.
Conclusions
Using whole-genome sequencing of several species of Piciformes (woodpeckers, toucans, barbets, and honeyguides), we identified massive TE expansions from at least three waves of activity, resulting in doubling or tripling genomic TE content in multiple Piciformes lineages. Additionally, we found thousands of polymorphic CR1 insertions in woodpeckers maintained at low frequencies relative to single nucleotide polymorphisms. Our findings show that TE activity in woodpeckers and closely related species has been prolonged and remains ongoing.
Supplementary Material
Supplementary data are available at Genome Biology and Evolution online.
Authors’ Contributions
J.D.M. and S.B. conceived and designed the study. J.D.M. and R.G.M. provided samples. S.B. and R.G.M. funded the study. J.D.M. performed laboratory work, and all bioinformatics and data analyses. J.D.M. wrote the original draft of the manuscript and all authors contributed to the review and editing of the final version of the article.
Supplementary Material
Acknowledgments
We thank Mark Robbins at the University of Kansas Biodiversity Institute for assistance with all tissue loans. Much of the data analyses were performed using the high-performance computing cluster at New York University in Abu Dhabi. We thank Marc Arnoux from the Genome Core Facility at NYUAD for assistance with genome sequencing. This work was supported by New York University Abu Dhabi (NYUAD) research funds AD180 (to S.B.) and National Science Foundation DEB-1241181 and DEB-1557053 (to R.G.M.). The NYUAD Sequencing Core is supported by NYUAD Research Institute grant G1205-1205A to the NYUAD Center for Genomics and Systems Biology.
Literature Cited
- Belyayev A. 2014. Bursts of transposable elements as an evolutionary driving force. J Evol Biol. 2712:2573–2584. [DOI] [PubMed] [Google Scholar]
- Bolger AM, Lohse M, Usadel B.. 2014. Trimmomatic: a flexible trimmer for Illumina sequence data. Bioinformatics 3015:2114–2120. [DOI] [PMC free article] [PubMed] [Google Scholar]
- Burch J, Davis DL, Haas NB.. 1993. Chicken repeat 1 elements contain a pol-like open reading frame and belong to the non-long terminal repeat class of retrotransposons. Proc Natl Acad Sci U S A. 9017:8199–8203. [DOI] [PMC free article] [PubMed] [Google Scholar]
- Bushnell B. 2014. BBMap: a Fast, Accurate, Splice-Aware Aligner Berkeley; (CA): Ernest Orlando Lawrence Berkeley National Laboratory. [Google Scholar]
- Camacho C, et al. , . 2009. BLAST+: architecture and applications. BMC Bioinformatics 101:421. [DOI] [PMC free article] [PubMed] [Google Scholar]
- Chalopin D, Naville M, Plard F, Galiana D, Volff J-N.. 2015. Comparative analysis of transposable elements highlights mobilome diversity and evolution in vertebrates. Genome Biol Evol. 72:567–580. [DOI] [PMC free article] [PubMed] [Google Scholar]
- Chu C, Nielsen R, Wu Y.. 2016. REPdenovo: inferring de novo repeat motifs from short sequence reads. PLoS One 113:e0150719.. [DOI] [PMC free article] [PubMed] [Google Scholar]
- Danecek P, et al. , . 2011. The variant call format and VCFtools. Bioinformatics 2715:2156–2158. [DOI] [PMC free article] [PubMed] [Google Scholar]
- de Boer JG, Yazawa R, Davidson WS, Koop BF.. 2007. Bursts and horizontal evolution of DNA transposons in the speciation of pseudotetraploid salmonids. BMC Genomics 8:422.. [DOI] [PMC free article] [PubMed] [Google Scholar]
- Dufort MJ. 2016. An augmented supermatrix phylogeny of the avian family Picidae reveals uncertainty deep in the family tree. Mol Phylogenet Evol. 94(Pt A):313–326. [DOI] [PubMed] [Google Scholar]
- Ellegren H. 2010. Evolutionary stasis: the stable chromosomes of birds. Trends Ecol Evol. 255:283–291. [DOI] [PubMed] [Google Scholar]
- Feschotte C. 2008. The contribution of transposable elements to the evolution of regulatory networks. Nat Rev Genet. 95:397.. [DOI] [PMC free article] [PubMed] [Google Scholar]
- Feschotte C, Pritham EJ.. 2007. DNA transposons and the evolution of eukaryotic genomes. Annu Rev Genet. 41:331–368. [DOI] [PMC free article] [PubMed] [Google Scholar]
- Gardner EJ, et al. , . 2017. The Mobile Element Locator Tool (MELT): Population-scale mobile element discovery and biology. Genome Res. 27:1916–1929. [DOI] [PMC free article] [PubMed] [Google Scholar]
- Gordon A, Hannon G.. 2010. Fastx-toolkit: FASTQ/A short-reads preprocessing tools. Available from: http://hannonlab.cshl.edu/fastx_toolkit.
- Gregory TR. 2001. The bigger the C-value, the larger the cell: genome size and red blood cell size in vertebrates. Blood Cells Mol Dis. 275:830–843. [DOI] [PubMed] [Google Scholar]
- Gregory TR. 2002. A bird’s-eye view of the C-value enigma: genome size, cell size, and metabolic rate in the class Aves. Evolution 561:121–130. [DOI] [PubMed] [Google Scholar]
- Gregory TR, et al. , . 2007. Eukaryotic genome size databases. Nucleic Acids Res. 35(Database issue):D332–D338. [DOI] [PMC free article] [PubMed] [Google Scholar]
- Hackett SJ, et al. , . 2008. A phylogenomic study of birds reveals their evolutionary history. Science 3205884:1763–1768. [DOI] [PubMed] [Google Scholar]
- Hanna ZR, et al. , . 2017. Northern spotted owl (Strix occidentalis caurina) genome: divergence with the barred owl (Strix varia) and characterization of light-associated genes. Genome Biol Evol. 910:2522–2545. [DOI] [PMC free article] [PubMed] [Google Scholar]
- Hoffmann FG, McGuire LP, Counterman BA, Ray DA.. 2015. Transposable elements and small RNAs: genomic fuel for species diversity. Mobile Genet Elem. 55:63–66. [DOI] [PMC free article] [PubMed] [Google Scholar]
- Hughes AL, Hughes MK.. 1995. Small genomes for better flyers. Nature 3776548:391.. [DOI] [PubMed] [Google Scholar]
- Jarvis ED, et al. , . 2014. Whole-genome analyses resolve early branches in the tree of life of modern birds. Science 3466215:1320–1331. [DOI] [PMC free article] [PubMed] [Google Scholar]
- Jetz W, Thomas G, Joy J, Hartmann K, Mooers A.. 2012. The global diversity of birds in space and time. Nature 4917424:444–448. [DOI] [PubMed] [Google Scholar]
- Jurka J, Bao W, Kojima KK.. 2011. Families of transposable elements, population structure and the origin of species. Biol Dir. 6:44.. [DOI] [PMC free article] [PubMed] [Google Scholar]
- Jurka J, et al. , . 2005. Repbase Update, a database of eukaryotic repetitive elements. Cytogenet Genome Res. 110(1–4):462–467. [DOI] [PubMed] [Google Scholar]
- Jurka J, Kapitonov VV, Kohany O, Jurka MV.. 2007. Repetitive sequences in complex genomes: structure and evolution. Annu Rev Genomics Hum Genet. 8:241–259. [DOI] [PubMed] [Google Scholar]
- Kapusta A, Suh A.. 2017. Evolution of bird genomes—a transposon’s‐eye view. Ann N Y Acad Sci. 13891:164–185. [DOI] [PubMed] [Google Scholar]
- Kapusta A, Suh A, Feschotte C.. 2017. Dynamics of genome size evolution in birds and mammals. Proc Natl Acad Sci U S A. 1148:E1460–E1469. [DOI] [PMC free article] [PubMed] [Google Scholar]
- Katoh K, Standley DM.. 2013. MAFFT multiple sequence alignment software version 7: improvements in performance and usability. Mol Biol Evol. 304:772–780. [DOI] [PMC free article] [PubMed] [Google Scholar]
- Khan H, Smit A, Boissinot S.. 2006. Molecular evolution and tempo of amplification of human LINE-1 retrotransposons since the origin of primates. Genome Res. 161:78–87. [DOI] [PMC free article] [PubMed] [Google Scholar]
- Kolpakov R, Bana G, Kucherov G.. 2003. mreps: efficient and flexible detection of tandem repeats in DNA. Nucleic Acids Res. 3113:3672–3678. [DOI] [PMC free article] [PubMed] [Google Scholar]
- Levin HL, Moran JV.. 2011. Dynamic interactions between transposable elements and their hosts. Nat Rev Genet. 129:615.. [DOI] [PMC free article] [PubMed] [Google Scholar]
- Li H. 2015. Seqtk: a toolkit for processing sequences in FASTA/Q formats. Available from: https://github.com/lh3/seqtk.
- Li H, Durbin R.. 2009. Fast and accurate short read alignment with Burrows–Wheeler transform. Bioinformatics 2514:1754–1760. [DOI] [PMC free article] [PubMed] [Google Scholar]
- Li H, et al. , . 2009. The sequence alignment/map format and SAMtools. Bioinformatics 2516:2078–2079. [DOI] [PMC free article] [PubMed] [Google Scholar]
- McKenna A, et al. , . 2010. The Genome Analysis Toolkit: a MapReduce framework for analyzing next-generation DNA sequencing data. Genome Res. 209:1297–1303. [DOI] [PMC free article] [PubMed] [Google Scholar]
- Mitchell JS, Rabosky DL.. 2017. Bayesian model selection with BAMM: effects of the model prior on the inferred number of diversification shifts. Methods Ecol Evol. 81:37–46. [Google Scholar]
- Moore BR, Höhna S, May MR, Rannala B, Huelsenbeck JP.. 2016. Critically evaluating the theory and performance of Bayesian analysis of macroevolutionary mixtures. Proc Natl Acad Sci U S A. 11334:9569–9574. [DOI] [PMC free article] [PubMed] [Google Scholar]
- Nam K, Ellegren H.. 2012. Recombination drives vertebrate genome contraction. PLoS Genet. 85:e1002680.. [DOI] [PMC free article] [PubMed] [Google Scholar]
- Oliver KR, Greene WK.. 2011. Mobile DNA and the TE-Thrust hypothesis: supporting evidence from the primates. Mobile DNA 21:8.. [DOI] [PMC free article] [PubMed] [Google Scholar]
- Oliver KR, Greene WK.. 2012. Transposable elements and viruses as factors in adaptation and evolution: an expansion and strengthening of the TE‐thrust hypothesis. Ecol Evol. 211:2912–2933. [DOI] [PMC free article] [PubMed] [Google Scholar]
- Oliver MJ, Petrov D, Ackerly D, Falkowski P, Schofield OM.. 2007. The mode and tempo of genome size evolution in eukaryotes. Genome Res. 175:594–601. [DOI] [PMC free article] [PubMed] [Google Scholar]
- Organ CL, Shedlock AM.. 2009. Palaeogenomics of pterosaurs and the evolution of small genome size in flying vertebrates. Biol Lett. 51:47–50. [DOI] [PMC free article] [PubMed] [Google Scholar]
- Organ CL, Shedlock AM, Meade A, Pagel M, Edwards SV.. 2007. Origin of avian genome size and structure in non-avian dinosaurs. Nature 4467132:180.. [DOI] [PubMed] [Google Scholar]
- Pages H, Aboyoun P, Gentleman R, DebRoy S.. 2017. String objects representing biological sequences, and matching algorithms. R package version 2.44.2.
- Pascale E, Valle E, Furano AV.. 1990. Amplification of an ancestral mammalian L1 family of long interspersed repeated DNA occurred just before the murine radiation. Proc Natl Acad Sci U S A. 8723:9481–9485. [DOI] [PMC free article] [PubMed] [Google Scholar]
- Pritham EJ, Feschotte C.. 2007. Massive amplification of rolling-circle transposons in the lineage of the bat Myotis lucifugus. Proc Natl Acad Sci U S A. 1046:1895–1900. [DOI] [PMC free article] [PubMed] [Google Scholar]
- Rabosky DL. 2014. Automatic detection of key innovations, rate shifts, and diversity-dependence on phylogenetic trees. PLoS One 92:e89543.. [DOI] [PMC free article] [PubMed] [Google Scholar]
- Rabosky DL, et al. , . 2014. BAMMtools: an R package for the analysis of evolutionary dynamics on phylogenetic trees. Methods Ecol Evol. 57:701–707. [Google Scholar]
- Rabosky DL, Mitchell JS, Chang J.. 2017. Is BAMM flawed? Theoretical and practical concerns in the analysis of multi-rate diversification models. Syst Biol. 664:477–498. [DOI] [PMC free article] [PubMed] [Google Scholar]
- Ray DA, et al. , . 2008. Multiple waves of recent DNA transposon activity in the bat, Myotis lucifugus. Genome Res. 185:717–728. [DOI] [PMC free article] [PubMed] [Google Scholar]
- Rohland N, Reich D.. 2012. Cost-effective, high-throughput DNA sequencing libraries for multiplexed target capture. Genome Res. 225:939–946. [DOI] [PMC free article] [PubMed] [Google Scholar]
- Ruggiero RP, Bourgeois Y, Boissinot S.. 2017. LINE insertion polymorphisms are abundant but at low frequencies across populations of Anolis carolinensis. Front Genet. 8:44.. [DOI] [PMC free article] [PubMed] [Google Scholar]
- Shakya SB, Fuchs J, Pons J-M, Sheldon FH.. 2017. Tapping the woodpecker tree for evolutionary insight. Mol Phylogenet Evol. 116:182–191. [DOI] [PubMed] [Google Scholar]
- Smit A, Hubley R, Green P.. 2015. RepeatMasker Open-4.0. 2013–2015. Institute for Systems Biology. Available from: http://repeatmasker/org.
- Sotero-Caio CG, Platt RN, Suh A, Ray DA.. 2017. Evolution and diversity of transposable elements in vertebrate genomes. Genome Biol Evol. 91:161–177. [DOI] [PMC free article] [PubMed] [Google Scholar]
- Stewart C, et al. , . 2011. A comprehensive map of mobile element insertion polymorphisms in humans. PLoS Genet. 78:e1002236. [DOI] [PMC free article] [PubMed] [Google Scholar]
- Tollis M, Boissinot S.. 2013. Lizards and LINEs: selection and demography affect the fate of L1 retrotransposons in the genome of the green anole (Anolis carolinensis). Genome Biol Evol. 59:1754–1768. [DOI] [PMC free article] [PubMed] [Google Scholar]
- Trizzino M, et al. , . 2017. Transposable elements are the primary source of novelty in primate gene regulation. Genome Res. 2710:1623–1633. [DOI] [PMC free article] [PubMed] [Google Scholar]
- Weibel AC, Moore WS.. 2002. Molecular phylogeny of a cosmopolitan group of woodpeckers (genus Picoides) based on COI and cyt b mitochondrial gene sequences. Mol Phylogenet Evol. 221:65–75. [DOI] [PubMed] [Google Scholar]
- Weissensteiner MH, et al. , . 2017. Combination of short-read, long-read, and optical mapping assemblies reveals large-scale tandem repeat arrays with population genetic implications. Genome Res. 275:697–708. [DOI] [PMC free article] [PubMed] [Google Scholar]
- Wright NA, Gregory TR, Witt CC.. 2014. Metabolic ‘engines’ of flight drive genome size reduction in birds. Proc R Soc Lond B Biol Sci. 2811779:20132780.. [DOI] [PMC free article] [PubMed] [Google Scholar]
- Zeh DW, Zeh JA, Ishida Y.. 2009. Transposable elements and an epigenetic basis for punctuated equilibria. Bioessays 317:715–726. [DOI] [PubMed] [Google Scholar]
- Zhang G, et al. , . 2014. Comparative genomic data of the Avian Phylogenomics Project. GigaScience 31:1. [DOI] [PMC free article] [PubMed] [Google Scholar]
- Zhang Q, Edwards SV.. 2012. The evolution of intron size in amniotes: a role for powered flight? Genome Biol Evol. 410:1033–1043. [DOI] [PMC free article] [PubMed] [Google Scholar]
Associated Data
This section collects any data citations, data availability statements, or supplementary materials included in this article.