Abstract
Integrins are a family of α/β heterodimeric membrane proteins, which mediate cell–cell and cell–matrix interactions. The molecular mechanisms by which integrins are activated and cluster are currently poorly understood. One hypothesis posits that the cytoplasmic tails of the α and β subunits interact strongly with one another in a 1:1 interaction, and that this interaction is modulated in the course of the activation of αIIbβ3 [Hughes, P. E., et al. (1996) J. Biol. Chem. 271, 6571–6574]. To examine the structural basis for this interaction, protein fragments encompassing the transmembrane helix plus cytoplasmic tails of the α and β subunits of αIIbβ3 were expressed and studied in phospholipid micelles at physiological salt concentrations. Analyses of these fragments by analytical ultracentrifugation, NMR, circular dichroism, and electrophoresis indicated that they had very little or no tendency to interact with one another. Instead, they formed homomeric interactions, with the α- and β-fragments forming dimers and trimers, respectively. Thus, these regions of the protein structure may contribute to the clustering of integrins that accompanies cellular adhesion.
Integrins, a family of α/β heterodimers, mediate essential cell–cell and cell–matrix interactions (1). Each subunit of the integrin heterodimer is composed of a large extracellular domain, a transmembrane (TM) helix, and a short cytoplasmic (CYTO) tail. Heterodimer formation results from interactions between sequences located in the extracellular domain of each subunit (2). Many cells actively regulate integrin ligand-binding activity (3). The prototypic example of integrin regulation is the platelet integrin αIIbβ3 (4). In unstimulated platelets, αIIbβ3 is inactive, whereas exposing platelets to agonists such as ADP and thrombin enables αIIbβ3 to bind ligands such as fibrinogen and von Willebrand factor. The integrin is activated in a bidirectional manner, in which intracellular events can trigger a conformational change in the extracellular ligand-binding domains (inside-out signaling) or vice versa. In one proposed mechanism for this process, the CYTO tails of αIIb and β3 interact in the inactive state through the formation of a salt bridge (5). This interaction is broken and the CYTO domains separate when the integrin is activated. Evidence for this hypothesis came from mutational studies (5), as well as biochemical studies that seemed to show a weak but divalent cation-dependent interaction between peptides corresponding to the CYTO tails of αIIb and β3 (6, 7). Further, elegant protein engineering studies by Springer and coworkers (8, 9) unambiguously demonstrated that when the CYTO domains or the C termini of the extracellular domains were forced to interact, the integrin αLβ2 or α5β1 was inactivated. However, a very recent and carefully executed NMR study indicated that the αIIb and β3 CYTO tails were unable to interact, even when tethered in close proximity from the same end of a heterodimeric coiled coil (10). Further, the observation that replacing the CYTO tail of αIIb with those of α5 or α6 results in constitutive αIIbβ3 activity, despite the fact that the membrane-proximal portions of the CYTO tails of these α subunits are nearly identical to αIIb, suggests that the putative salt bridge cannot account completely for αIIbβ3 regulation (11). Thus, it is important to conduct biophysical experiments on peptide systems that more closely resemble the integrin proteins, and also to modify the original salt bridge hypothesis to include possible interactions with the cytoskeletal and other intracellular proteins (10).
For example, exposing unstimulated platelets to drugs that impair actin polymerization induces fibrinogen binding to αIIbβ3 (12). This observation suggests that the platelet cytoskeleton constrains αIIbβ3 in an inactive state and relieving this constraint is sufficient to induce αIIbβ3 function. In B lymphocytes, low concentrations of cytochalasin D increase cell adhesion to intercellular adhesion molecule-1 (ICAM-1) and concurrently increase the rate of random diffusion of the integrin αLβ2 in the lymphocyte membrane, suggesting that the formation of αLβ2 oligomers either accompanies or is responsible for the function of this integrin (13). Ligand-occupied clusters of αIIbβ3 are present on the surface of thrombin-stimulated platelets (14), and the forced clustering of αIIbβ3 expressed in Chinese hamster ovary cells has been found to induce ligand binding, albeit to a lesser extent than exposing αIIbβ3 to stimulatory mAbs (15). Nevertheless, these data suggest that the formation of αIIbβ3 oligomers after agonist stimulation may contribute to the regulation of αIIbβ3 function.
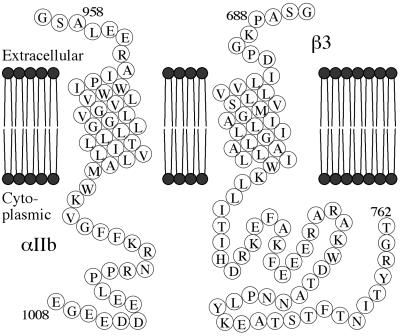
To address whether the TM helices and CYTO tails of αIIb and β3 contribute to intramolecular and intermolecular interactions, we have examined the association of peptides corresponding to the TM-CYTO segments of each protein (Fig. 1). These peptides are significantly longer than the CYTO peptides used in previous studies (6, 7, 16, 17), and hence may provide a more realistic model for exploring their interactions.
Figure 1.
Sequences of αIIb and β3 TM-CYTO proteins. The integrin sequence included in each TM-CYTO protein is depicted with starting and ending residue numbers. In both proteins, glycine-serine at the amino terminus remains after thrombin cleavage.
Materials and Methods
Expression of Glutathione S-Transferase (GST)-Fusion Proteins Corresponding to the TM-CYTO Domains of αIIb and β3.
cDNA encoding αIIb amino acids Ala-958 → Glu-1008 and β3 amino acids Pro-688 → Thr-762, corresponding to the TM and CYTO domains of each protein, were amplified by PCR. The plasmids pREP9 and pREP4 containing cDNAs for αIIb and β3 (18) were used as templates. The forward αIIb primer (CTAGAAGGATCCGCCTTGGAGGAGCGCGCCATTCCAATCTGG) added a BamHI restriction site ahead of A958 and changed the codon for R962 to preclude expression problems arising from the presence of rare arginine codons (19). The reverse αIIb primer (GTCGACTCGAGTTACTCCCCCTCTTCATCATC) added an XhoI restriction site at the other end. Similarly, the primers for P688-T762 of β3 [CTAGAAGGATCCGCTCCCAAGGGCCCTGACATCCTGG (forward) and GTCGACTCGAGTTAAGTGCCCCGGTACGTGATATTGG (reverse)] added BamHI and XhoI sites, respectively. In all four primers, five or six random nucleotides were added at each end to ensure efficient digestion by BamHI or XhoI. The cDNAs encoding the αIIb and β3 TM-CYTO proteins were cloned into the vector pGEX-4T-3 (Amersham Pharmacia) and expressed in BL21-transformed cells.
Purification of Integrin TM-CYTO Proteins.
The glutathione S-transferase (GST)-fusion proteins synthesized by induced BL21 cells were isolated as described (20). Cleavage of the GST-TM-CYTO fusion proteins was accomplished by using thrombin (3.5–4.0 units/mg of protein) in 1% (wt/vol) N-octyl glucoside for 4 h at 25°C. The cleaved sample was dialyzed extensively at 4°C against water, and the turbid solution was lyophilized. The lyophilized proteins were solubilized by using a mixture of a formic acid-acetic acid-chloroform-trifluoroethanol (FACT) mix (21), acetonitrile, and water in a ratio of 1:3:3 and purified by preparative RP-HPLC as described (22). The purified TM-CYTO protein was lyophilized and stored at −80°C. The purity of both proteins was confirmed by SDS/PAGE, analytical HPLC, and MS. An SDS gel depicting purification steps and HPLC tracings of the purified proteins are shown in Figs. 7–9, which are published as supporting information on the PNAS web site, www.pnas.org.
Dispersion of the αIIb and β3 TM-CYTO Proteins in Dodecylphosphocholine (DPC) Micelles.
Each αIIb and β3 TM-CYTO protein, or an equimolar mixture of the two proteins, was dissolved in methanol and added to a glass vial containing DPC (Avanti Polar Lipids) dissolved in methanol. The methanol was evaporated by using a stream of nitrogen, and the protein/DPC mixture was put under high vacuum overnight. The dried mixture was dissolved in aqueous buffer without detergent, and the concentration of protein was determined from its absorbance at 280 nm. The extinction coefficients for αIIb and β3 TM-CYTO proteins were calculated as 16,500 M−1⋅cm−1 and 13,980 M−1⋅cm−1, respectively (23).
Circular Dichroism (CD) Spectroscopy.
Protein samples were added to 25 mM Mops [3-(N-morpholino)propanesulfonic acid] buffer, pH 7.4, containing 10 mM DPC and 100 mM KCl, to achieve a final protein concentration of 20–30 μM. All spectra were collected by using an Aviv Associates (Lakewood, NJ) 62A DS CD spectrometer at 25°C with a scan speed of 10 nm/min, an averaging time of 4 sec, and a bandwidth of 1.5 nm. Six scans for each sample were recorded, averaged, and corrected for the buffer contribution. For spectra collected from 203 to 260 nm, a 0.1-cm cuvette was used; for spectra from 195 to 210 nm, a 0.02-cm cuvette was used.
SDS/PAGE and Immunoblotting.
The electrophoretic mobility of the αIIb and β3 TM-CYTO proteins was assessed by using precast SDS polyacrylamide gels (4–12% NuPAGE Bis-Tris gels; Invitrogen). The apparent molecular masses of markers on the SDS gel have been calibrated with known membrane proteins (data not shown). Before electrophoresis, each sample was incubated at 70°C for 10 min. Electrophoresis was carried out at room temperature with NuPAGE MES SDS running buffer (Invitrogen). Immunoblotting was performed by electrophoretically transferring proteins to nitrocellulose paper (0.45 μm; Schleicher & Schuell). Then the paper was incubated with polyclonal rabbit αIIb and β3 antisera at concentrations of 50 μg/ml (24). Ab binding was detected with 125I-labeled Staphylococcal Protein A followed by autoradiography, using Kodak X-0mat AR film at −70°C.
Analytical Ultracentrifugation.
Equilibrium sedimentation was carried out in a Beckman XL-I analytical ultracentrifuge at 25°C (22). D2O (50.5%) was added to the buffer (10 mM DPC/20 mM Mops/100 mM KCl/1 mM MgCl2, pH 7.4) to match the density of DPC, thereby eliminating its contribution to the buoyant molecular mass. The molecular mass and partial specific volume of both TM-CYTO proteins were calculated from their amino acid sequences by using the program sedinterp (25), which was modified to use the partial specific volumes of Kharazov (26). Values obtained were 6,017 Da and 0.7595 cm3/g for the αIIb TM-CYTO protein, and 8,737 Da and 0.7543 cm3/g for the β3 TM-CYTO protein. For each experiment, samples at various protein/detergent ratios were placed into different compartments of the same cuvette and centrifuged at different speeds for times sufficient to achieve equilibrium based on radial profiles of UV absorption at 280 nm. Equilibrium data sets were analyzed by nonlinear least-squares global curve-fitting as described (22). The simplest model with the lowest χ2/N score was considered the best model.
NMR Spectroscopy.
15N-labeled TM-CYTO proteins were mixed with deuterated DPC (Cambridge Isotope Laboratories, Cambridge, MA) before being dissolved in 650 μl of freshly made 50 mM deuterated imidazole/100 mM KCl/2 mM MgCl2, pH 7.40. CaCl2 (2 mM) was added when needed. The final protein and DPC concentrations were 500 μM and 100 mM, respectively. NMR spectra were recorded at 29°C on a Varian Inova spectrometer operating at 750 MHz (1H). Gradient-selected sensitivity-enhanced 15N-heteronuclear sequential quantum correlation (HSQC) data (27) were collected with 512 t2 and 128 t1 complex points. The data were processed by using the program felix (Molecular Simulations, San Diego, CA), to a final matrix size of 1,024 × 1,024.
Results
CD Spectra of TM-CYTO Proteins.
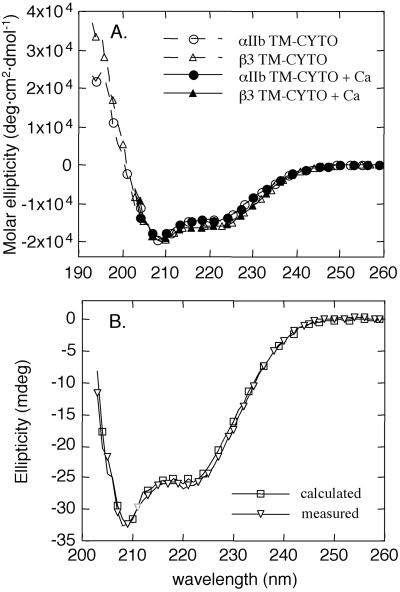
The αIIb and β3 TM-CYTO proteins, dispersed alone or together in DPC micelles, were examined by CD spectroscopy. As expected for proteins containing a TM helix and a relatively short CYTO tail, the spectra were similar and had minima at 208 and 222 nm (Fig. 2A). Analysis of the spectra, using the program cdsstr (28), suggested that ≈50% of the secondary structure of each protein is α-helical, whereas substantial amounts of 310-helix and β-turn may also be present (data not shown).
Figure 2.
CD spectra of αIIb and β3 TM-CYTO proteins. (A) Far-UV CD spectra of TM-CYTO proteins in 10 mM DPC/25 mM Mops/100 mM KCl, pH 7.4, and at 25°C with and without 1 mM CaCl2. Spectra in the presence of Ca2+ were collected only at 203–260 nm. Spectra obtained in the presence of Mg2+ were essentially the same as in the presence of Ca2+ (not shown). (B) Far-UV CD spectrum of an equimolar mixture of the αIIb and β3 TM-CYTO proteins (open triangles). The concentration of each protein was 15 μM. A calculated spectrum for the mixture was obtained by adding the spectra for the individual α and β proteins and is shown by the open squares.
Under conditions of low ionic strength, calcium and other divalent cations bind to the CYTO tail of αIIb, perhaps to its acidic carboxyl-terminal portion (6). To determine whether Ca2+ and/or Mg2+ induce conformational changes in the αIIb and β3 TM-CYTO proteins, CD spectra were collected in the presence of 1 mM CaCl2 and/or 1 mM MgCl2 (Fig. 2A). No significant spectral differences were detected for either protein, implying that divalent cations, at physiologically relevant concentrations, do not have a significant effect on the secondary structure of the TM-CYTO domains of αIIb and β3.
We also investigated whether mixing the αIIb and β3 TM-CYTO proteins in DPC micelles resulted in a change in their CD spectra. We found no differences between the CD spectrum calculated by using the combined spectra of the individual proteins and that obtained experimentally from equimolar mixtures (Fig. 2B). Further, addition of Ca2+ and/or Mg2+ failed to induce detectable changes in the spectra (data not shown). Thus, these data suggest that either association between the TM-CYTO domains of αIIb and β3 does not induce large scale conformational changes detectable by CD spectroscopy or simply that the TM-CYTO domains of αIIb and β3 do not associate with each other.
SDS/PAGE of the TM-CYTO Proteins.
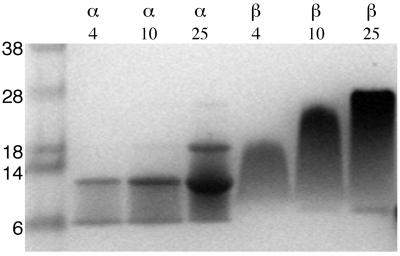
To address further possible interactions between the αIIb and β3 TM-CYTO proteins, we used SDS/PAGE, a technique that has been used to demonstrate the association of other TM helices (29, 30). The αIIb TM-CYTO protein migrated predominantly as two distinct bands (Fig. 3). Based on a molecular mass of 6.0 kDa for the monomeric protein, the bands correspond to αIIb TM-CYTO monomers and dimers. Moreover, only the intensity of the band corresponding to the dimer increased significantly as the amount of protein was increased from 4 to 25 μg, implying that the dimer/monomer ratio increased with the total protein concentration. In addition, in the lane containing 25 μg of αIIb protein, a band corresponding to α trimer was clearly visible.
Figure 3.
Oligomerization of the αIIb and β3 TM-CYTO proteins in SDS gels. The loading volume was 20 μl with 2% (wt/vol) SDS for each sample. The amount of protein in each sample is labeled in micrograms on top of each lane. Molecular markers (in kDa) are shown (Left).
In contrast to αIIb, the β3 protein did not form distinct bands in the gel, but instead migrated as a “smear.” Nonetheless, the molecular mass range encompassed by the β3 protein varied according to the amount of protein loaded. As more protein was loaded, the apparent molecular mass of the protein increased from a range of 9–18 kDa to a range of 9–29 kDa. In the lane containing 25 μg of protein, the majority of the protein migrated with an apparent molecular mass of 29 kDa (Fig. 3). Based on a molecular mass of 8.7 kDa for the monomeric protein, these data suggest that the β3 protein is present in a monomer-trimer equilibrium with no clearly defined dimeric intermediate.
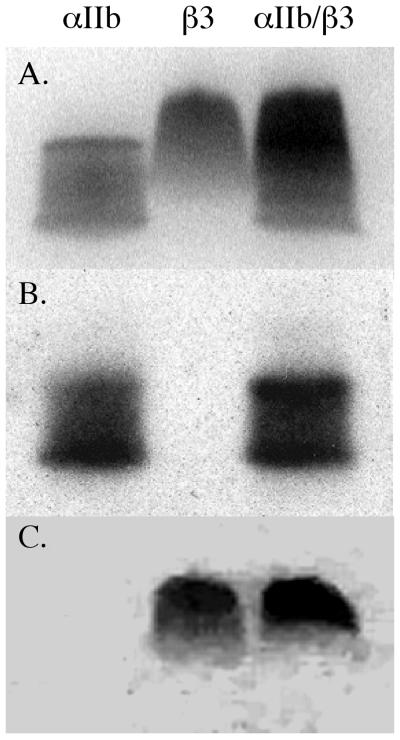
We next electrophoresed a mixture of 4 μg each of the αIIb and β3 proteins, based on the premise that if heterooligomers formed, they would decrease the electrophoretic mobility of each protein. As shown by the immunoblot in Fig. 4, we found that the mobility of αIIb TM-CYTO protein was unaffected by the presence of the β3 protein. Because the β3 TM-CYTO protein could not be transferred to the nitrocellulose membrane, we were unable to perform immunoblotting by using anti-β3 antisera. Nevertheless, staining the polyacrylamide gel with Coomassie blue after transfer revealed that like the αIIb protein, the mobility of β3 protein in the SDS gel was unaffected by the presence of αIIb.
Figure 4.
The αIIb and β3 TM-CYTO proteins migrate independently in SDS gel electrophoresis. Four μg of each TM-CYTO protein was electrophoresed separately or together. (A) SDS gel stained with Coomassie blue. (B) Immunoblot by using rabbit anti-human αIIb polyclonal antisera of proteins transferred to nitrocellulose membranes after electrophoresis. (C) Coomassie blue stain of residual protein in the SDS gel after transfer.
Ultracentrifugation of TM-CYTO Proteins in DPC Micelles.
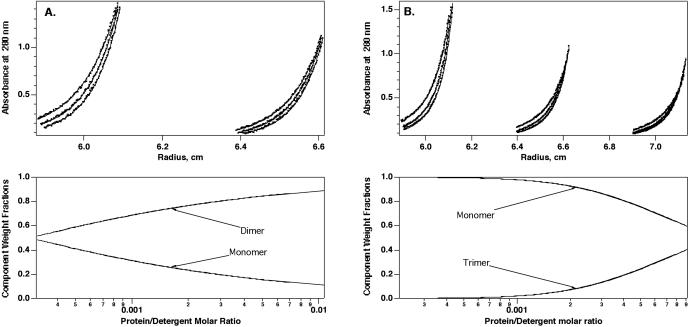
Analytical ultracentrifugation was used to quantitatively analyze αIIb and β3 TM-CYTO oligomerization. All equilibrium sedimentation experiments were carried out in 10 mM DPC at protein/detergent ratios between 1/200 to 1/500 with the density of the buffer adjusted to that of DPC. Mathematical models describing monomers in reversible equilibrium with dimers, trimers, or tetramers were fit to the equilibrium radial concentration profiles (Fig. 5; Table 1). As expected from gel electrophoresis, a monomer-dimer scheme gave a very good fit to the αIIb data. The χ2/N score was only slightly worse for a monomer-trimer equilibrium, but the residuals were nonrandomly distributed, indicative of a less satisfactory fit to the data (not shown). Monomer-dimer-trimer and monomer-dimer-tetramer schemes were also considered. However, the fit was not improved relative to the monomer-dimer equilibrium, and the Kd for the second equilibrium predicted that very little, if any, higher-order aggregate was present. Analytical ultracentrifugation of the β3 TM-CYTO protein was also consistent with the results from gel electrophoresis. Of the various monomer-n-mer schemes considered, the data were best fit by a monomer-trimer scheme. Again, consideration of multiple equilibria (with an additional fitting parameter) failed to significantly improve the goodness of the fit. Fig. 5 A and B (Bottom) illustrate the population of the pertinent species as a function of the mole fraction of the protein in the detergent micelle.
Figure 5.
Sedimentation equilibrium of the αIIb and β3 TM-CYTO proteins in 10 mM DPC at pH 7.4. (A) αIIb TM-CYTO protein. (B) β3 TM-CYTO protein. (Top) Equilibrium A280 vs. radius profiles for two or three cell compartments with different protein/detergent ratios at 40, 45, and 48K rpm. The lines represent the best fit to an equilibrium model. (Bottom) The calculated relative population of the different species as a function of the molar fraction over the range observed in the experiment. Enlarged views of the curve fits, along with residual plots, are included in Figs. 7–9.
Table 1.
Analysis of the analytical ultracentrifugation of the αIIb and β3 TM-CYTO proteins
| Model | αIIb TM-CYTO protein
|
β3 TM-CYTO protein
|
||
|---|---|---|---|---|
| χ2/N | pKd | χ2/N | pKd | |
| Monomer-dimer | 3.2 | 3.54 | 2.0 | 2.15 |
| Monomer-trimer | 3.4 | 4.36 | 1.0 | 3.88 |
| Monomer-tetramer | 6.3 | 6.18 | 2.3 | 5.85 |
| Monomer-dimer-trimer | 3.2 | 3.52, 4.82 | 0.95 | 0.96, 3.87 |
| Monomer-dimer-tetramer | 3.2 | 3.47, 6.64 | 1.1 | 1.72, 5.91 |
χ2/N is the weighted sum of squared residuals divided by the number of degrees of freedom in the curve fitting (39). The smaller the number, the better the fit. pKd is negative log10 of the dissociation constant of the monomer-dimer or monomer-n-mer equilibria in molar fraction units. There are two pKd values for the equilibrium model with three species.
We also examined an equimolar mixture of the αIIb and β3 TM-CYTO proteins and evaluated a model in which a theoretical curve was defined only by the homomeric dissociation constants, as well as a model in which a heteromeric association was allowed. A homomeric association model accounted for the experimental curves, and there was no significant improvement in the fit when a heteromeric dissociation constant was included (as assessed visually or by χ2/N scores). Thus, if heteromeric association of these two proteins occurs, it must be substantially weaker than homomeric association.
15N-HSQC NMR Spectra of TM-CYTO Proteins.
Because chemical shifts of nuclei are sensitive to the structural and electrostatic environment in which they reside, NMR spectroscopy is extraordinarily sensitive to protein–protein interactions. Thus, protein–protein interfaces can be identified by mapping chemical shift perturbations. Accordingly, we used NMR spectroscopy to explore the possible association of the αIIb and β3 TM-CYTO proteins in DPC micelles. To avoid potential artifacts associated with nonphysiologic pH or ionic strength, all NMR spectra were collected at pH 7.4 in the presence of 100 mM KCl. Based on an average molecular mass of a DPC micelle of ≈23 kDa, the molecular masses of the protein–detergent complex approached 35 kDa. Despite the large protein–detergent complex size and a relatively high pH that results in an increased rate of hydrogen exchange, we were able to obtain 15N-HSQC two-dimensional NMR spectra for the αIIb and β3 TM-CYTO proteins. For both proteins, >95% of the amide peaks could be accounted for despite the lack of a complete assignment. The chemical shift dispersion for both proteins was typical of an α-helical protein.
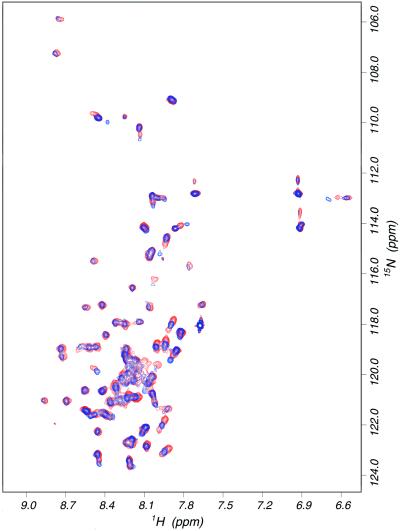
Equimolar mixtures of the proteins were studied next. As shown in Fig. 6, an overlay of the 15N-HSQC spectra for 15N-labeled β3 TM-CYTO, and for the mixture of labeled β3 TM-CYTO with unlabeled αIIb TM-CYTO, revealed no significant changes in chemical shift. Peaks were essentially superimposable: typical chemical shift changes in the proton dimension were less than 0.02 ppm and the largest change was ≈0.08 ppm. A similar spectral overlay was performed for the 15N-labeled αIIb TM-CYTO with and without β3, and no “peak movement” was observed (data not shown). Adding Ca2+ to the protein mixture did not induce significant changes in chemical shift. Considering the protein concentration used in these experiments, we would have expected to observe perturbation of either spectra if there was an interaction between the TM or CYTO domains of αIIb and β3 proteins with a Kd in the μM range. Thus, these data suggest that a strong and specific interaction between αIIb and β3 TM-CYTO proteins in DPC micelles is unlikely.
Figure 6.
Overlay of 15N-HSQC NMR spectra of 15 N-labeled β3 (red) and the mixture of 15N-labeled β3 with unlabeled αIIb TM-CYTO proteins (blue). Indole peaks around 10.4 ppm are not shown.
Discussion
Because platelets circulate in a plasma milieu containing high concentrations of the principle αIIbβ3 ligands, fibrinogen, and von Willebrand factor, it is imperative that they tightly regulate the ligand binding activity of this integrin to prevent the spontaneous formation of platelet aggregates. However, the mechanisms whereby platelets regulate αIIbβ3 function are largely unknown. Because recombinant αIIbβ3 extracellular domains constitutively bind ligands (31), active inhibition of αIIbβ3 function likely involves its TM and/or CYTO domains. Moreover, our preliminary data suggest that the platelet cytoskeleton interacts with the CYTO tails of β3 and/or αIIb to constrain αIIbβ3 in an inactive state (12). Hence, it is possible that release of this constraint results in changes in the homo- or heterooligomeric associations of the TM helices and/or CYTO tails of αIIb and β3. To address these possibilities, we have established a model system to study associations of unconstrained proteins corresponding to the αIIb and β3 TM and CYTO domains in membrane-like environments. We found that these proteins maintain stable predominantly α-helical structures in phospholipid micelles, but we were unable to detect heterophilic associations by using a variety of methods. On the other hand, we found that the αIIb and β3 proteins readily participated in homophilic association leading to the formation of homodimers and homotrimers, respectively.
The NMR and CD data indicate that the αIIb and β3 TM-CYTO proteins are largely α-helical in micelles. Quantitative analysis of the CD data indicates that ≈30 and 48 residues are in a helical conformation for the αIIb and β3 constructs, respectively. These values, longer than the ≈20-residue stretch expected for a minimal TM helix, are consistent with previous studies. NMR and CD spectroscopy of a myristoylated αIIb CYTO domain peptide in DPC micelles revealed that its amino-terminal half was α-helical, suggesting that the α-helix of the αIIb TM domain continues for a substantial distance into the CYTO extension of the protein (32). Previous work also indicated that a β3 peptide corresponding to residues 719–762 had little secondary structure in an aqueous buffer at pH 7.2, but acquired substantial β-sheet structure in 5–20% trifluoroethanol (TFE), and became nearly 50% α-helical at higher TFE concentrations (16). Further, heteronuclear NMR of the β3 tail showed a tendency to form a transient helix between residues 724–735. Thus, taken in the context of the previous reports, our data suggest the secondary structure of the αIIb and β3 CYTO domains is critically influenced by the presence of the adjacent TM domains.
Rotary-shadowed electron microscope images of purified αIIbβ3 in detergent solution indicate that the TM and CYTO domains of αIIb and β3 are located at the ends of 18 × 2 nm highly flexible stalks (2). Thus, it is conceivable that in the absence of membranous or submembranous constraints, the TM and/or CYTO domains interact. It has been proposed that a salt-bridge involving a membrane-proximal hinge region, which encompasses a conserved GFFKR motif in αIIb and a LLITIHD motif in β3, maintains αIIbβ3 in an inactive state (5). Although αIIb and β3 CYTO peptides were initially reported to interact (6, 7), more recent studies on related systems failed to show a specific interaction (10). Our data on the full TM-CYTO domain constructs are consistent with this recent article, showing a lack of heteromeric interaction.
Instead, we observed a reversible homomeric interaction, both in acidic (SDS) as well as zwitterionic (DPC) detergents. Because interactions involving the largely hydrophilic CYTO domains of each protein would likely have been eradicated by SDS, it is probable that interactions involving the TM domains were responsible for the formation of the homooligomers. It is noteworthy in this regard that the β3 TM domain contains a small aliphatic side-chain motif that has been detected in membrane proteins known to form homo- or heterodimers (33). Similarly, the sequence LVGVLGGLL present in the αIIb TM domain corresponds to the GxxxG motif proposed as a framework for TM helix–helix association (34, 35). It is also possible that the membrane-proximal hydrophobic residues of each CYTO domain contribute to oligomerization, as recent evidence suggests that they may actually reside in the plasma membrane (36).
Ligand-occupied αIIbβ3 forms clusters on the platelet surface after agonist stimulation (14). Our data suggest that the formation of TM domain-driven αIIb and β3 homooligomers may contribute to integrin clustering when cytoskeletal constraints are relieved. However, the functional consequences of αIIbβ3 oligomer formation are uncertain. Dimerization of receptors for growth factors, such as the receptors for erythropoietin and platelet-derived growth factor, initiates signal transduction (37), and the formation of αIIbβ3 clusters is likely involved in the “outside-in” signaling that follows platelet aggregation (38). Nonetheless, it has also been observed that FK506-binding protein-mediated αIIbβ3 clustering in Chinese hamster ovary cells induced 25–50% as much ligand binding to αIIbβ3 as an activating αIIbβ3 mutation or an activating mAb (15). Similarly, we found that impairing actin polymerization in platelets with cytochalasin D or latrunculin A induced ≈50% as soluble fibrinogen binding to αIIbβ3 as stimulating platelets with 10 μM ADP (12). Thus, in light of our present data, we propose that after the agonist-induced release of cytoskeletal constraints, TM domain-driven αIIbβ3 oligomerization makes a major contribution to the regulation of αIIbβ3 ligand-binding activity.
Supplementary Material
Acknowledgments
This work was supported by National Institutes of Health Grants HL54500, HL40387 (to J.S.B. and W.F.D.) and DK39806 (to A.J.W.). R.L. was supported by a postdoctoral fellowship from the Cancer Research Fund of the Damon Runyon–Walter Winchell Foundation (DRG-1536). C.R.B. was supported by a National Institutes of Health postdoctoral fellowship (GM20806).
Abbreviations
- CD
circular dichroism
- DPC
dodecylphosphocholine
- TM
transmembrane
- CYTO
cytoplasmic
- HSQC
heteronuclear sequential quantum correlation
References
- 1.Hynes R O. Cell. 1992;69:11–25. doi: 10.1016/0092-8674(92)90115-s. [DOI] [PubMed] [Google Scholar]
- 2.Weisel J W, Nagaswami C, Vilaire G, Bennett J S. J Biol Chem. 1992;267:16637–16643. [PubMed] [Google Scholar]
- 3.Bazzoni G, Hemler M E. Trends Biochem Sci. 1998;23:30–34. doi: 10.1016/s0968-0004(97)01141-9. [DOI] [PubMed] [Google Scholar]
- 4.Bennett J S. Trends Cardiovasc Med. 1996;6:31–36. doi: 10.1016/1050-1738(95)00126-3. [DOI] [PubMed] [Google Scholar]
- 5.Hughes P E, Diaz-Gonzalez F, Leong L, Wu C, McDonald J A, Shattil S J, Ginsberg M H. J Biol Chem. 1996;271:6571–6574. doi: 10.1074/jbc.271.12.6571. [DOI] [PubMed] [Google Scholar]
- 6.Haas T A, Plow E F. J Biol Chem. 1996;271:6017–6026. doi: 10.1074/jbc.271.11.6017. [DOI] [PubMed] [Google Scholar]
- 7.Vallar L, Melchior C, Plancon S, Drobecq H, Lippens G, Regnault V, Kieffer N. J Biol Chem. 1999;274:17257–17266. doi: 10.1074/jbc.274.24.17257. [DOI] [PubMed] [Google Scholar]
- 8.Lu C, Takagi J, Springer T A. J Biol Chem. 2001;276:14642–14648. doi: 10.1074/jbc.M100600200. [DOI] [PubMed] [Google Scholar]
- 9.Takagi J, Erickson H P, Springer T A. Nat Struct Biol. 2001;8:412–416. doi: 10.1038/87569. [DOI] [PubMed] [Google Scholar]
- 10.Ulmer T S, Yaspan B, Ginsberg M H, Campbell I D. Biochemistry. 2001;40:7498–7508. doi: 10.1021/bi010338l. [DOI] [PubMed] [Google Scholar]
- 11.O'Toole T E, Katagiri Y, Faull R J, Peter K, Tamura R, Quaranta V, Loftus J C, Shattil S J, Ginsberg M H. J Cell Biol. 1994;124:1047–1059. doi: 10.1083/jcb.124.6.1047. [DOI] [PMC free article] [PubMed] [Google Scholar]
- 12.Bennett J S, Zigmond S, Vilaire G, Cunningham M E, Bednar B. J Biol Chem. 1999;274:25301–25307. doi: 10.1074/jbc.274.36.25301. [DOI] [PubMed] [Google Scholar]
- 13.Kucik D F, Dustin M L, Miller J M, Brown E J. J Clin Invest. 1996;97:2139–2144. doi: 10.1172/JCI118651. [DOI] [PMC free article] [PubMed] [Google Scholar]
- 14.Fox J B E, Shattil S J, Kinlough-Rathbone R L, Richardson M, Packham M A, Sanan D A. J Biol Chem. 1996;271:7004–7011. doi: 10.1074/jbc.271.12.7004. [DOI] [PubMed] [Google Scholar]
- 15.Hato T, Pampori N, Shattil S J. J Cell Biol. 1998;141:1685–1695. doi: 10.1083/jcb.141.7.1685. [DOI] [PMC free article] [PubMed] [Google Scholar]
- 16.Haas T A, Plow E F. Protein Eng. 1997;10:1395–1405. doi: 10.1093/protein/10.12.1395. [DOI] [PubMed] [Google Scholar]
- 17.Muir T W, Williams M J, Ginsberg M H, Kent S B. Biochemistry. 1994;33:7701–7708. doi: 10.1021/bi00190a025. [DOI] [PubMed] [Google Scholar]
- 18.Loh E, Qi W, Vilaire G, Bennett J S. J Biol Chem. 1996;271:30233–30241. doi: 10.1074/jbc.271.47.30233. [DOI] [PubMed] [Google Scholar]
- 19.Sharp P M, Cowe E, Higgins D G, Shields D C, Wolfe K H, Wright F. Nucleic Acids Res. 1988;16:8207–8211. doi: 10.1093/nar/16.17.8207. [DOI] [PMC free article] [PubMed] [Google Scholar]
- 20.Frangioni J V, Neel B G. Anal Biochem. 1993;210:179–187. doi: 10.1006/abio.1993.1170. [DOI] [PubMed] [Google Scholar]
- 21.Jones D H, Ball E H, Sharpe S, Barber K R, Grant C W. Biochemistry. 2000;39:1870–1878. doi: 10.1021/bi992495e. [DOI] [PubMed] [Google Scholar]
- 22.Kochendoerfer G G, Salom D, Lear J D, Wilk-Orescan R, Kent S B H, DeGrado W F. Biochemistry. 1999;38:11905–11913. doi: 10.1021/bi990720m. [DOI] [PubMed] [Google Scholar]
- 23.Pace C N, Vajdos F, Fee L, Grimsley G, Gray T. Protein Sci. 1995;4:2411–2423. doi: 10.1002/pro.5560041120. [DOI] [PMC free article] [PubMed] [Google Scholar]
- 24.Poncz M, Eisman R, Heidenreich R, Silver S M, Vilaire G, Surrey S, Schwartz E, Bennett J S. J Biol Chem. 1987;262:8476–8482. [PubMed] [Google Scholar]
- 25.Laue T, Shaw B D, Ridgeway T M, Pelletier S L. In: Analytical Ultracentrifugation in Biochemistry and Polymer Science. Harding S E, Rowe A J, Horton J C, editors. Cambridge, U.K.: R. S. Chem.; 1992. pp. 90–125. [Google Scholar]
- 26.Kharakoz D P. Biochemistry. 1997;36:10276–10285. doi: 10.1021/bi961781c. [DOI] [PubMed] [Google Scholar]
- 27.Kay L E, Keifer P, Saarinen T. J Am Chem Soc. 1992;114:10663–10665. [Google Scholar]
- 28.Johnson W C. Proteins. 1999;35:307–312. [PubMed] [Google Scholar]
- 29.Zhou F X, Cocco M J, Russ W P, Brunger A T, Engelman D M. Nat Struct Biol. 2000;7:154–160. doi: 10.1038/72430. [DOI] [PubMed] [Google Scholar]
- 30.Choma C, Gratkowski H, Lear J D, DeGrado W F. Nat Struct Biol. 2000;7:161–166. doi: 10.1038/72440. [DOI] [PubMed] [Google Scholar]
- 31.Peterson J A, Visentin G P, Newman P J, Aster R H. Blood. 1998;92:2053–2063. [PubMed] [Google Scholar]
- 32.Vinogradova O, Haas T, Plow E F, Qin J. Proc Natl Acad Sci USA. 2000;97:1450–1455. doi: 10.1073/pnas.040548197. . (First Published February 4, 2000; 10.1073/pnas.040548197) [DOI] [PMC free article] [PubMed] [Google Scholar]
- 33.Bormann B J, Engelman D M. Annu Rev Biophys Biomol Struct. 1992;21:223–242. doi: 10.1146/annurev.bb.21.060192.001255. [DOI] [PubMed] [Google Scholar]
- 34.Russ W P, Engelman D M. J Mol Biol. 2000;296:911–919. doi: 10.1006/jmbi.1999.3489. [DOI] [PubMed] [Google Scholar]
- 35.Lemmon M A, Treutlein H R, Adams P D, Brunger A T, Engelman D M. Nat Struct Biol. 1994;1:157–163. doi: 10.1038/nsb0394-157. [DOI] [PubMed] [Google Scholar]
- 36.Armulik A, Nilsson I, von Heijne G, Johansson S. J Biol Chem. 1999;274:37030–37034. doi: 10.1074/jbc.274.52.37030. [DOI] [PubMed] [Google Scholar]
- 37.Kishimoto T, Taga T, Akira S. Cell. 1994;76:253–262. doi: 10.1016/0092-8674(94)90333-6. [DOI] [PubMed] [Google Scholar]
- 38.Shattil S J, Kashiwagi H, Pampori N. Blood. 1998;91:2645–2657. [PubMed] [Google Scholar]
- 39.Straume M, Johnson M L. In: Numerical Computer Methods. Brand L, Johnson M L, editors. Vol. 210. San Diego: Academic; 1992. pp. 87–105. [Google Scholar]
Associated Data
This section collects any data citations, data availability statements, or supplementary materials included in this article.


