

Abstract
Understanding the role of DNA methylation often requires accurate assessment and comparison of these modifications in a genome-wide fashion. Sequencing-based DNA methylation profiling provides an unprecedented opportunity to map and compare complete DNA CpG methylomes. These include whole genome bisulfite sequencing (WGBS), Reduced-Representation Bisulfite- Sequencing (RRBS), and enrichment-based methods such as MeDIP-seq, MBD-seq, and MRE-seq. An investigator needs a method that is flexible with the quantity of input DNA, provides the appropriate balance among genomic CpG coverage, resolution, quantitative accuracy, and cost, and comes with robust bioinformatics software for analyzing the data. In this chapter we describe four protocols that combine state-of-art experimental strategies with state-of-art computational algorithms to achieve this goal. We first introduce two experimental methods that are complementary to each other. MeDIP-seq, or methylation dependent immunoprecipitation followed by sequencing, uses an anti-methyl-cytosine antibody to enrich for methylated DNA fragments, and uses massively parallel sequencing to reveal identity of enriched DNA. MRE-seq, or methylation sensitive restriction enzyme digestion followed by sequences, relies on a collection of restriction enzymes that recognize CpG containing sequence motif but only cut when the CpG is unmethylated. Digested DNA fragments enrich for unmethylated CpGs at their ends, and these CpGs are revealed by massively parallel sequencing. The two computational methods both implement advanced statistical algorithms that integrate MeDIP-seq and MRE-seq data. M&M is a statistical framework to detect differentially methylated regions between two samples. methylCRF is a machine learning framework that predicts CpG methylation levels at single CpG resolution, thus raising the resolution and coverage of MeDIP-seq and MRE-seq on CpGs to a comparable level of WGBS, but only incurring a cost of less than 5% of WGBS. Together these methods form an effective, robust, and affordable platform for the investigation of genome-wide DNA methylation.
Keywords: MeDIP-seq, MRE-seq, M&M, methylCRF
1. Introduction
DNA methylation typically refers to the methylation of the 5 position of cytosine (mC) by DNA methyltransferases (DNMT). It is a major epigenetic modification in human and many other species [1]. In mammals, most DNA methylations occur within the context of CpG dinucleotides [2,3], although some non-CpG (i.e., CHG, CHH) methylation is also observed in embryonic stem cell [4,5]. DNA methylation is thought to be a repressive chromatin modification. The abnormal loss of DNA methylation in the genome, especially in repetitive elements, may result in genome destabilization [1,6–8]. DNA methylation plays a crucial role in normal development [1,8,9]. Aberrant methylation can lead to many diseases including cancers [10,11].
Analyses of DNA methylation have been traditionally focused on CpG dense regions including gene promoters and CpG islands, and more recently on CpG island shores [12], partly due to limitation in technology. These regions only account for a small fraction of the genome-wide CpGs (7.4% of the 28M CpGs in human genome are in CpG islands, and an additional 4.9% are in island shores). Just in the past several years, the rapid development of next-generation sequencing-based technology allowed much more comprehensive views of genome-wide DNA methylation patterns. Perhaps the most exciting findings are related to the dynamic nature of DNA methylation changes on regulatory elements, especially on distal enhancers which usually locate in intergenic and intronic regions [13–16]. For example, Stadler et al. discovered that DNA binding factors could lead to demethylation of distal regulatory regions in the mouse. By investigating intergenic hypomethylated regions in various human cell types, Schlesinger et al. suggested that de novo DNA demethylation defines distal regulatory elements [17]. Xie et al. discovered that thousands of transposable elements undergo DNA hypomethylation in a tissue-specific manner, and could serve as tissue-specific enhancers [18]. Hon et al. pointed out that identifying tissue-specific DMRs (tsDMRs) can be an alternative strategy for finding putative regulatory elements [13]. By profiling 30 different tissues and cell types, Ziller et al. estimated that 21.8% of the DNA methylome is dynamic [16]. These recent studies highlight the importance of measuring CpG methylation in a genome-wide, unbiased fashion.
Sequencing-based DNA methylation profiling methods provide an opportunity to map complete DNA methylomes. These technologies include whole genome bisulfite sequencing (WGBS, MethylC-seq [19,20] or BS-seq [21]), Reduced-Representation Bisulfite-Sequencing (RRBS) [22,23], enrichment-based methods (MeDIP-seq [24,25], MBD-seq [26], mTAG-seq [27], and methylation-sensitive restriction enzyme based methods (HELP [27], MRE-seq [25]). These methods yield largely concordant results, but differ significantly in the extent of genomic CpG coverage, resolution, quantitative accuracy, and cost [28,29]. For example, WGBS based methods produce the most comprehensive and high-resolution DNA methylome maps, but typically require sequencing to 30× coverage which is still expensive for the routine analysis of many samples, particularly those with a large methylome (e.g. human). Additionally, bisulfite-based methods including WGBS and RRBS conflate methylcytosine (mC) and hydroxymethylcytosine (hmC) (Huang et al. 2010) unless combined with additional experiments (Booth et al. 2012; Yu et al. 2012).
Both MeDIP-seq and MRE-seq are technologies for measuring DNA methylation at genome-wide level. They represent complementary ways to enrich for either methylated portion of the genome, or unmethylated portion of the genome. Each technology has its own advantages and disadvantages, and can be applied independently or jointly. We will first describe each technology, and then discuss how integrating the two complementary technologies significantly increase their values (Figure 1).
Figure 1. Integration of MeDIP-seq and MRE-seq.
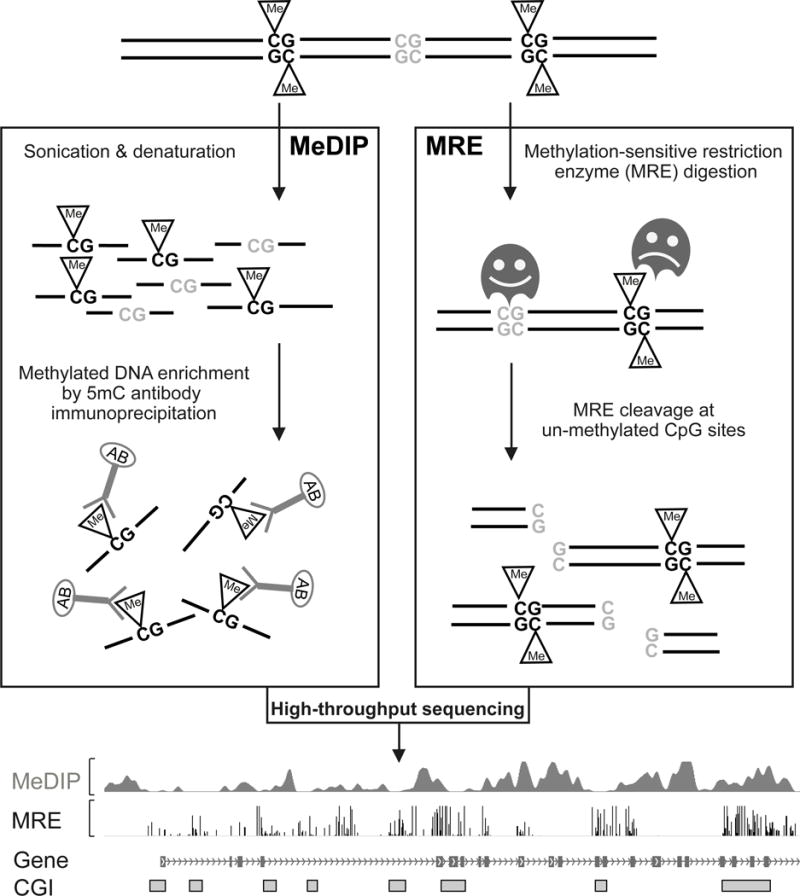
Work flow of MeDIP-seq and MRE-seq. Genomic DNA is isolated and purified. On the MeDIP-seq side, genomic DNA is sonicated to a specific size range, and a monoclonal anti-5′methylcytosine antibody is used to enrich for methylated DNA fragments. Immunoprecipitated DNA fragments are then sequenced and mapped back to the reference genome assembly to review methylated regions. On the MRE-seq side, several methylation sensitive restriction endonucleases are used to digest intact genomic DNA. The resulting DNA fragments are then size-selected and sequenced. When mapped back to the reference genome assembly, these sequencing reads can reveal locations of unmethylated CpG sites which are located within recognition sites of specific restriction enzymes. Both MeDIP-seq and MRE-seq results can be easily visualized on a Genome Browser.
MeDIP-seq stands for methylation dependent immunoprecipitation followed by sequencing (Figure 1). In a typical MeDIP-seq protocol, a monoclonal antibody against 5-methylcytosine is used to enrich methylated DNA fragments of select sizes (typically 150bp to 300bp), then these fragments are sequenced and analyzed. MeDIP-seq was first reported by Weber et al [24]. A protocol working on 50ng of input DNA was published in 2012 [30]. It has been estimated that MeDIP-seq saturates at 5 Gb of sequencing [31].
MRE-seq stands for methylation sensitive restriction enzyme digestion followed by sequencing (Figure 1). In a typical MRE-seq protocol, genomic DNA is digested in parallel by 3~5 methylation sensitive restriction endonucleases. These methylation-sensitive enzymes cut only restriction sites with unmethylated CpGs. Sequencing of digested DNA fragment ends allows identification of cut sites, which provides information of the methylation status of these sites. While methylated CpG’s could be inferred by the absence of reads at cutting sites, this would require assuming perfect digestion which is not typically done in practice. MRE-seq was first reported in Manuakea et al. [25]. Utilizing multiple cut- sites, MRE-seq can cover close to 30% of the genome and saturates at ~3 Gb of sequencing [31].
Both MeDIP-seq and MRE-seq detect 5-methylcytosine exclusively. MRE-seq provides DNA methylation estimates at single CpG resolution, but is considered low coverage due to the limit of CpG containing recognition sites. An important advantage of MeDIP over enzymatic digestion based methods is a lack of bias for a specific nucleotide sequence, other than CpGs. However, the relationship of enrichment to absolute methylation levels is confounded by variables such as CpG density [32]. Another inherent limitation of MeDIP-seq is its lower resolution (~150bp) compared to MRE-seq or bisulfite-based methods in that one or more of the CpGs in the immunoprecipitated DNA fragment could be responsible for the antibody binding.
The MeDIP-seq and MRE-seq technologies each has its own advantages and disadvantages comparing to other genome-wide DNA methylation profiling technology, and both are widely and independently used by investigators. Because MeDIP-seq and MRE-seq are independent and complementary, combining the two assays provides additional, synergistic advantages, as we have demonstrated previously [28,25]. Their combined value can be significantly increased with the application of the two algorithms we developed: M&M [15] and methylCRF [33].
M&M is a new statistical framework that identifies differentially methylated regions (DMRs) by jointly modeling MeDIP-seq and MRE-seq data. Experimental measurements can be modeled as a function of the underlying methylation state and genomic context. Thus, independent measurements (i.e., MeDIP-seq and MRE-seq) of the same sample can be integrated on the same underlying methylation state. Detecting DMRs between two samples can then be modeled as a test of the null hypothesis, namely that the two samples have the same methylation state, given the observed measurements and genomic context. We formulated the statistical test and provided a numerical solution to compute a probability that a genomic region is differentially methylated given observed MeDIP-seq and MRE-seq measurements [15].
methylCRF is a Conditional Random Fields-based [34,35] algorithm that integrates MeDIP-seq and MRE-seq data to predict genome-wide DNA methylation levels at single CpG resolution. Because MeDIP-seq is enrichment-based, its resolution is limited by the size of the DNA fragments from immunoprecipitation. MRE-seq is a single CpG resolution method but is limited by the availability of restriction enzyme recognition sites in the genome. Based on the same principle that experimental measurements can be modeled as a function of the underlying methylation state and genomic context, Conditional Random Fields provide a machine learning framework to infer the absolute values of the underlying methylation state at single CpG level. We demonstrated that methylCRF transforms MeDIP-seq and MRE-seq data to the equivalent of a whole genome bisulfite sequencing (WGBS) experiment, which typically costs 20 times more to produce [33].
The main advantage of these two algorithms is the integration of independent, heterogeneous experiments on the same biological state that they measure – in this case, DNA methylation. All current genome-wide technologies for measuring DNA methylation have their inherent biases and limitations, but our confidence in inferring methylation state increases when results from two independent methods are integrated. For example, a decrease of MeDIP-seq signal could reflect a biological event (we infer that this region is demethylated) or could be a methodological artifact; but if it is corroborated by an increase of MRE-seq signal, then the inference of demethylation can be much more accurate. Taken together, the integrated protocols we describe in this chapter provide a streamlined platform for investigators to explore DNA methylation with high coverage, high resolution, and low cost.
2. Materials
2.1. MeDIP-seq
2.1.1. Genomic DNA extraction
- Extraction buffer (50 mM Tris-HCl pH 8.0, 1 mM EDTA pH 8.0, 0.5% SDS and 1 mg/ml proteinase K) (see Note 1).
- 1 M Tris-HCl (pH 8.0), dissolve 121.14 g of Trizma base (Sigma-Aldrich; cat. no. T1503) in 700 ml of ultrapure water. Add HCl (Sigma-Aldrich; cat. no. H1758) and test the pH. When pH reaches 8.0, fill up to 1,000 ml with ultrapure water. Sterile-filter and store at room temperature.
- 0.5 M EDTA, pH 8.0 (Life Technologies; cat. no. AM9261).
- 20% SDS solution (Life Technologies; cat. no. AM9820).
- Proteinase K (Roche; cat. no. 03115879001).
Phase lock gel light 2 ml, 5 PRIME (Fisher Scientific; cat. no. FP2302820).
Phenol/chloroform/isoamyl alcohol (Roche; cat. no. 03117979001).
RNase A, DNase and protease-free (Thermo Scientific; cat. no. EN0531).
Chloroform (Sigma-Aldrich; cat. no. 372978).
Sodium Acetate, pH 5.5 (3 M, Life Technologies; cat. no. AM9740).
Ethanol (Sigma-Aldrich; cat. no. E7023).
NanoVue spectrophotometer (GE Healthcare, Piscataway, NJ).
Qubit fluorometer for quantification (Life Technologies, Carlsbad, CA).
Qubit dsDNA HS Assay Kit (Life Technologies; cat. no. Q32851).
Qubit assay tubes (Life Technologies; cat. no. Q32856).
Agarose, Molecular Biology Grade (VWR; cat. no. IB70042).
Ethidium bromide (BioExpress; cat. no. X328-10ML).
TAE 50× Reagent, 5 PRIME (Fisher Scientific; cat. no. FP2500060).
Orange DNA loading dye (6×, Thermo Scientific; cat. no. R0631).
2-Log DNA ladder (NEB; cat. no. N3200L).
Gel electrophoresis system (Thermo Scientific, Kalamazoo, MI).
Gel Doc Imaging System (Bio-Rad, Hercules, CA).
2.1.2. DNA fragmentation
Bioruptor Pico system for DNA sonication (Diagenode, Denville, NJ).
Gel electrophoresis system for fragments size validation (Thermo Scientific, Kalamazoo, MI).
Gel Doc Imaging System (Bio-Rad, Hercules, CA).
2.1.3. Library preparation I
- Reagents for DNA end repair.
- DNA Polymerase I, Large (Klenow) Fragment (NEB; cat. no. M0210L).
- T4 DNA Polymerase (NEB; cat. no. M0203L).
- T4 Polynucleotide Kinase (NEB; cat. no. M0201L).
- Deoxynucleotide Solution Mix (NEB; cat. no. N0447S).
- Denosine 5´-Triphosphate (ATP) (NEB; cat. no. P0756S).
- Reagents for dA-tailing.
- Klenow Fragment (3´→5´ exo–) (NEB; cat. no. M0212L).
- dATP solution (NEB; cat. no. N0440S).
- Reagents for adapter ligation.
- T4 ligase reaction buffer for adapter annealing (10×, NEB; cat. no. 10B0202S).
- Adapter oligos (HPLC purification, IDT; see Table 1) (see Note 2).
- ○ Spin down lyophilized adapter oligos and resuspend each oligo in 1× T4 ligase reaction to 20 μM. Add equimolar quantities of each adapter into a 1.5-ml microcentrifuge tube. Divide into small aliquots (50 μl) and incubate at 95 °C for 10 min, and then leave to cool down to room temperature. Store aliquots at − 20 °C until required. Final concentration is10 μM.
- Quick Ligation Kit (NEB; cat. no. M2200L).
Agencourt AMPure XP beads for all steps DNA purification (Beckman Coulter; cat. no. A63881).
Thermal cycler CC007387 for incubation (Bio-Rad, Hercules, CA).
Table 1.
Oligos used in the protocol
| Name | Sequence (5′-3′) | Length (bp) | Amplicon size (bp) |
|---|---|---|---|
| adapter: PE 1.0 | ACACTCTTTCCCTACACGACGCTCTTCCGATC*T | 33 | NA |
| adapter: PE 2.0 | P-GATCGGAAGAGCACACGTCTGAACTCCAGTCAC | 33 | NA |
| PCR primer: PE 1.0 |
AATGATACGGCGACCACCGAGATCTACACTCTTTCCCTACACGACGCTCTTCCGATCT | 58 | NA |
| PCR primer: PE 2.0 |
CAAGCAGAAGACGGCATACGAGATNNNNNNNGTGACTGGAGTTCAGACGTGTGCTCTTCCGA | 62 | NA |
| SNRPN-F | CGCTCAACACCCCCTAAATA | 20 | 156 |
| SNRPN-R | GGTGGAGGTGGGTACATCAG | 20 | |
| GABRB3-F | CCTGCAACTTTACTGAATTTAGC | 23 | 207 |
| GABRB3-R | GGAATCTCACTTTCACCACTGG | 22 | |
| qPCR primer 1.0 | AATGATACGGCGACCACCGAGAT | 23 | NA |
| qPCR primer 2.0 | CAAGCAGAAGACGGCATACGA | 21 | NA |
Asterisk * indicates a phosphorothiate linkage, P indicates a phosphate group and N indicates index code.
NA, not applicable.
2.1.4. MeDIP
2 M NaCl, dissolve 58.44 g of NaCl (Sigma-Aldrich; cat. no. S3014) in 500 ml of ultrapure water. Sterile-filter and store at room temperature.
0.2 M Na2HPO4, dissolve 28.4 g of Na2HPO4 (Sigma-Aldrich; cat. no. S7907) in 1,000 ml ultrapure water. Sterile-filter and store at room temperature.
0.2 M NaH2PO4, dissolve 24 g of NaH2PO4 (Sigma-Aldrich; cat. no. S8282) in 1,000 ml of ultrapure water. Sterile-filter and store at room temperature.
0.1 M Na2HPO4/NaH2PO4 (pH 7.0), mix 30.5 ml (0.2 M stock) of Na2HPO4 and 19.5 ml (0.2 M stock) of NaH2PO4, fill up to 100 ml with ultrapure water. Sterile-filter and store at room temperature.
10% Triton X-100, mix 10 ml of Triton X-100 (Sigma-Aldrich; cat. no. T8787) and 90 ml of ultrapure water. Sterile-filter and store at room temperature.
Monoclonal Antibody against 5-Methylcytidine (Eurogentec; cat no. BI-MECY-0100).
AffiniPure Rabbit Anti-Mouse IgG, Fcγ Fragment Specific (Jackson ImmunoResearch; cat. no. 315-005-008).
Protein A/G agarose beads (Fisher Scientific; cat. no. PI20421).
MeDIP wash buffer, mix 10 ml (0.1 M stock) of Na2HPO4/NaH2PO4 (pH7.0), 7 ml (2 M stock) of NaCl and 500 μl (10% stock) of Triton X-100 in a total volume of 100 ml (fill up with ultrapure water). Final concentration: 10 mM Na2HPO4/NaH2PO4, 140 mM NaCl and 0.05% Triton X-100. Prepare fresh on the day of use.
MeDIP elution buffer, mix 12.5 μl (20 mg/ml stock) of proteinase K and 12.5 μl (20% stock) of SDS in a total volume of 1,000 μl (fill up with TE buffer, Life Technologies; cat. no. AM9849). Final concentration: 0.25 mg/ml proteinase K and 0.25% SDS in TE. Prepare fresh on the day of use.
MinElute PCR Purification Kit for DNA purification (Qiagen; cat. no. 28004).
2.1.5. Library preparation II
Phusion High-Fidelity DNA Polymerase (NEB; cat. no. M0530L).
Deoxynucleotide Solution Mix (NEB; cat. no. N0447S).
- Indexed PCR primers used for adapter-modified PCR enrichment (HPLC purification, IDT; see Table 1).
- Spin down primer oligos and resuspend each oligo in ultrapure water to create 100 μM stocks. Dilute an aliquot ten fold in ultrapure water to create 10 μM dilutions. Store dilutions at − 20 °C until required.
Agencourt AMPure XP beads for DNA purification (Beckman Coulter; cat. no. A63881).
2.1.6. Library size selection
MinElute Gel extraction kit (Qiagen; cat. no. 28604).
Isopropanol (Sigma-Aldrich; cat. no. I9516).
2-Log DNA ladder (NEB; cat. no. N3200L).
2% agarose TAE gel (wt/vol).
Gel electrophoresis system for size selection (Thermo Scientific, Kalamazoo, MI).
Gel Doc Imaging System (Bio-Rad, Hercules, CA).
2.1.7. Library QC
Primers (SNRPN, GABRB3) for validation of human MeDIP-seq libraries (IDT; see Table 1).
qPCR primers for identification of libraries (IDT; see Table 1).
0.1% Tween-20, mix 100 μl of Tween-20 (Sigma-Aldrich; cat. no. P9416) and 99.9 ml of ultrapure water. Sterile-filter and store at room temperature.
iTaq universal SYBR Green supermix (2×, Bio-Rad; cat. no. 172-5121).
Thermal cycler CC007277 CFX (qPCR, Bio-Rad, Hercules, CA).
Qubit fluorometer for quantification (Life Technologies, Carlsbad, CA).
Bioanalyzer (Agilent, Wilmington, DE).
2.1.8. Next-generation sequencing
Illumina HiSeq2500 (Illumina, San Diego, CA).
2.2. MRE-seq
2.2.1. Genomic DNA extraction
Same as 2.1.1.
2.2.2. DNA fragmentation
- Restriction enzymes for DNA digestion.
- HpaII (NEB; cat. no. R0171S).
- HinP1I (NEB; cat. no. R0124S).
- AciI (NEB; cat. no. R0551S).
- HpyCH4IV (NEB; cat. no. R0619S).
- Bsh1236I (Thermo Scientific; cat. no. ER0921).
Gel electrophoresis system for size selection (Thermo Scientific, Kalamazoo, MI).
Gel Doc Imaging System (Bio-Rad, Hercules, CA).
2.2.3. Library preparation I
Same as 2.1.3, except that only Klenow fragment is used for end repair.
2.2.4. Library preparation II
Same as 2.1.5.
2.2.5. Library size selection
Same as 2.1.6.
2.2.6. Library QC
Same as 2.1.7, except that MeDIP-seq specific primers are not used.
2.2.7. Next-generation sequencing
Same as 2.1.8.
2.3. Computational environment for running M&M and methylCRF
2.3.1. System requirements
Program executions are demonstrated in a Linux/Unix environment. Typical Linux system should have Python and Perl installed already. In the software section, we recommend adding directory or file to PATH environment. Setting up this variable makes access to the computational programs easier. For more information on PATH variable in a Linux system, please consult this page: http://www.linfo.org/path_env_var.html. Please also notice software version might change. Newest version is always recommended.
Command lines are numbered if they broken into more than one line to avoid confusion.
2.3.2. Software
2.3.2.1. Cutadapt (optional)
Description: adapter trimming and quality filtering of raw reads.
Website: https://code.google.com/p/cutadapt/.
Documentation: https://code.google.com/p/cutadapt/wiki/documentation.
Installation instructions:
Using following command to install cutadpt;
easy_install cutadapt
Or using pip command instead:
pip install cutadapt
2.3.2.2 BWA
Description: Align raw or filtered reads to corresponding genome assembly.
Website: http://bio-bwa.sourceforge.net/.
Documentation: http://bio-bwa.sourceforge.net/bwa.shtml.
Installation instructions:
Download BWA from http://sourceforge.net/projects/bio-bwa/files/, latest version is recommended (here we used 0.7.10 as example).
Uncompressed the downloaded file:
tar jxvf bwa-0.7.10.tar.bz2
Go the new generated folder, type make command to generate bwa binary file:
make
(optional) move the bwa binary file to you PATH (require admin privilege):
sudo mv bwa /usr/local/bin/
2.3.2.3 Samtools
Description: Operating aligned result files.
Website: http://samtools.sourceforge.net/.
Documentation: http://samtools.sourceforge.net/SAM1.pdf.
Installation instructions:
Download samtools from http://sourceforge.net/projects/samtools/files/samtools/, latest version is recommended (here we used version 0.7.19 as example).
Decompressed the downloaded file:
tar jxvf samtools-0.1.19.tar.bz2
Go the newly created folder, type make command to generate samtools binary file:
make
(optional) Move the samtools binary file to you PATH (require admin privilege), for example:
sudo mv samtools /usr/local/bin/
2.3.2.4 R
Description: Statistical computing environment.
Website: http://methylqa.sourceforge.net/.
Documentation: http://cran.r-project.org/manuals.html.
Installation instructions:
R installation steps may vary from different Linux systems; users could follow documentation listed at http://www.r-project.org/.
2.3.2.5 methylQA
Description: Parsing aligned results, generating bed files and bedGraph files.
Website: http://methylqa.sourceforge.net/.
Documentation: http://methylqa.sourceforge.net/tutorial.php.
Installation instructions:
Download from http://sourceforge.net/projects/methylqa/files/, latest version is recommended (here we used 0.1.5 as example).
Decompressed the downloaded file:
tar zxvf methylQA-0.1.5.tar.gz
Go the newly created folder, type make command to generate methylQA binary file:
make
(optional) move the methylQA binary file to you PATH (require admin privilege):
sudo mv methylQA /usr/local/bin/
2.3.2.6 methylMnM
Description: Calculating differentially methylated region (DMR) between two samples by integrating MeDIP-seq and MRE-seq data.
Website: http://epigenome.wustl.edu/MnM/.
Documentation: http://epigenome.wustl.edu/MnM/methylMnM.pdf.
Installation instructions:
Go to R environment by typing R command. Enter an R interactive interface. Install methylMnM package from Bioconductor using biocLite command:
> source("http://bioconductor.org/biocLite.R")
> biocLite("edgeR")
> biocLite("statmod")
> biocLite("methylMnM")
Test loading methylMnM package using library command; Make sure there is no error message.
> library(methylMnM)
2.3.2.7 methylCRF
Description: Predicting methylation level at single CpG resolution by combining MeDIP-seq and MRE-seq data.
Website: http://methylcrf.wustl.edu/.
Documentation: http://methylcrf.wustl.edu/.
Installation instructions:
Download methylCRF package and decompress the downloaded file:
wget http://methylcrf.wustl.edu/methylCRF.tgz
tar -zxf methylCRF.tgz
Go to the newly created folder and type make command:
cd methylCRF
make
Add the methylCRF folder to your PATH environment variable.
Download and decompress methylCRF model and data files. These files are needed for methylCRF and should be stored in this methylCRF folder:
wget http://methylcrf.wustl.edu/h1es_mdl.tgz
tar -zxf h1es_mdl.tgz
wget http://methylcrf.wustl.edu/hg19/hg19_gdat.tgz
tar -zxf hg19_gdat.tgz
Download MRE fragment files, 3enz for three enzymes and 5enz for five enzymes:
1. wget
http://methylcrf.wustl.edu/hg19/MRE_frags/MRE_3enz_4_6000.bed
2. wget
http://methylcrf.wustl.edu/hg19/MRE_frags/MRE_5enz_4_6000.bed
3. Methods
3.1. MeDIP-seq
3.1.1. Genomic DNA extraction
High-quality, intact genomic DNA without degradation and denaturation, without protein and RNA contaminations is important for the success of library construction (see Note 3).
Resuspend cell pellets or finely sliced tissues in 1.5 ml centrifuge tube containing 100-600 μl of extraction buffer (see Note 4).
Pipette up and down immediately to ensure that sample suspends well (see Note 5).
Incubate tubes at 55 °C for 1 h or overnight if needed (see Note 6).
Centrifuge at maximum speed at 4 °C for 10 min.
Quickly transfer supernatant to a phase lock gel (pre-pellet phase lock gel (PLG) at 16000× g for 30 sec).
Add an equal volume of phenol/chloroform/isoamyl alcohol (PCI) directly to the PLG tube.
Thoroughly mix the organic and aqueous phases to form a transiently homogeneous suspension. Do not vortex.
Centrifuge at 16000× g for 5 min to separate the phases.
Carefully pipet upper phase to a fresh tube.
Add DNase-free RNaseA (10 mg/ml) 1 μl and incubate for 1 h at 37 °C.
Transfer the solution from step 10 to a new pre-pelleted phase lock gel and repeat steps 6-8 one more time.
Carefully transfer upper phase to a new pre-pelleted phase lock gel and repeat steps 6-9 one more time using chloroform instead of phenol/chloroform/isoamyl alcohol.
Precipitate with 1/10 volume of 3 M sodium acetate (pH 5.5) and 2.5 volumes of 100% ethanol. Invert tubes several times to mix.
A ‘ball’ of DNA should appear in the tube.
Incubate for 15 min at room temperature. If there in no “ball’ in step 14, incubate the tube at −20 °C for overnight.
Spin tubes at maximum speed for 30 min at 4 °C.
Wash DNA pellet with 70% ethanol and spin 5 min.
Resuspend DNA in a desired volume of elution buffer (Qiagen EB). Purified genomic DNA can be placed at −20 °C for long-term storage.
Quantitate DNA by NanoVue Spectrophotometer (see Note 7).
Validate DNA quality by running it on 1% TAE agarose gel (see Note 8).
3.1.2. DNA fragmentation
Resuspend 500-1,000 ng of intact genomic DNA (3.1.1.18) in 30 μl of EB in a 1.5ml sterile DNase/RNase free tube and seal the tube with parafilm.
Set 4 °C of the Diagenode Bioruptor Pico and prechill the sonicator water bath.
Sonicate for 10-15 min with 30-sec on/off. Fragmented DNA can be stored at − 20 °C until needed.
Run 3 μl of the sonicated DNA on 1% TAE agarose gel to validate DNA fragment size range (see Note 9).
3.1.3. Library preparation I
DNA purification is necessary after each reaction (see Note 10).
DNA end repair is performed to get blunt 5′-phosphorylated ends. The reaction is set up on ice in a 50 μl volume with 1× NEB T4 PNK buffer, fragmented DNA (3.1.2.3), 5 μl of 10 mM ATP, 2 μl of 10 mM dNTPs, 3 U of T4 DNA polymerase, 5 U of Klenow DNA polymerase and 10 U of T4 Polynucleotide Kinase. Incubate the mixture in a thermocycler at 20 °C for 30 min.
Spin briefly. Purify the DNA sample with AMPure XP beads. Elute in 34 μl of EB. Purified DNA can be stored at − 20 °C until needed.
dA-tailing reaction is set up in a 50 μl volume with 1× NEB klenow buffer 2, end-repaired DNA (3.1.3.2), 10 μl of 10 mM dATPs and 5 U of Klenow 3′-5′ exo nimus. Incubate the mixture in a heat block for 30 min at 37 °C.
Spin briefly. Purify the DNA sample with AMPure XP beads. Elute in 23 μl of EB. Purified DNA can be stored at − 20 °C until needed.
Adapter ligation is set up in a 50 μl volume with 1× Quick ligation reaction buffer, end-repaired, dA-tailed DNA (3.1.3.4), 1 μl of 10 μM pre-annealed adapter oligo mix (2.1.3.3) and 2,000 U of T4 DNA ligase. Incubate the mixture at room temperature for 15 min.
Purify the DNA sample with AMPure XP purification beads. Elute in 30 μl of EB. Purified DNA can be stored at − 20 °C until needed.
3.1.4. MeDIP
Denature the adapter-ligated DNA (3.1.3.6) at 95 °C for 10 min, then transfer immediately to ice to prevent re-annealing. Keep on ice for 10 min (see Note 11).
A pre-mix is set up on ice in a 500 μl volume with 50 μl of 0.1 M Na2HPO4/NaH2PO4, 35 μl of 2 M NaCl, 2.5 μl of 10% triton X-100 and 1 μl of anti-methylcytidine antibody (1 mg/ml).
Keep the mix on ice. Add the mix to the tube which contains the denatured adapter-ligated DNA (3.1.4.1). Incubate the reaction on a rotator at 4 °C overnight.
After overnight incubation, add 2 μl of secondary antibody of rabbit anti-mouse IgG (2.5 μg/μl) and 80 μl of protein A/G agarose beads. Incubate at 4 °C for 2 h on a rotator.
Centrifuge the sample at 2000× g for 1 min in 4 °C microfuge. Carefully discard supernatant using a p1000 tip.
Resuspend beads pellet in 1000 μl pre-cold MeDIP wash buffer (freshly prepared). Make sure that the pellet is fully resuspended.
Repeat steps 4 and 5 7-10 times.
For final wash, centrifuge at 5000× g for 2 min, remove and discard supernatant. Spin briefly and remove all remaining liquid with a p10 tip.
Add 200 μl of MeDIP elution buffer to the beads pellet. Resuspend thoroughly.
Incubate at 55 °C for 2 h, mixing occasionally.
Let the tube cool down to room temperature. Purify DNA with Qiagen MinElute PCR Purification Kit. Elute DNA in 30 μl EB (see Note 12). Purified DNA can be stored at −20 °C until needed.
3.1.5. Library preparation II
An adapter modified PCR is carried out on ice in a 50 μl volume with 1 × Phusion HF buffer, 15 μl of MeDIP DNA (3.1.4.10), 1 μl of 10 μM dNTP, 2.5 μl of PCR primer PE 1.0, 2.5 μl of PCR primer PE 2.0 and 0.5 U of Phusion DNA polymerase.
Perform PCR in a preheated thermocycler with conditions of a denaturation of 30 sec at 98 °C, followed by 12 cycles of 10 sec at 98 °C, 30 sec at 64 °C and 30 sec at 72 °C, with a final extension of 5min at 72 °C (see Note 13).
Purify the DNA sample with AMPure XP purification beads. Elute in 15 μl EB. Purified DNA can be stored at − 20 °C until needed.
3.1.6. Library size selection
A regular agarose gel extraction is performed for the final library size selection. Inserts of 100~400 bp are selected, which are around 220~520bp after the adapter ligation and PCR amplification. Gel selection excludes all the free adapters, primers, and dimerized oligonucleotides.
Prepare a 100 ml 2% TAE agarose gel containing ethidium bromide.
Mix the PCR amplified DNA (3.1.5.3) with 3 μl of 6× loading dye and load in the gel, leaving space between the ladder and sample wells.
Carry out gel electrophoresis in 1× TAE buffer at 120 V until the orange dye runs to the two thirds of the gel.
After gel electrophoresis, transfer the gel tray onto the gel doc imaging system under UV light, cut out 220-520 bp size range with a clean blade.
Purify each gel slice with MinElute Gel DNA Extraction kit and elute in 15 μl EB buffer (see Note 14).
Assess 2 μl of size-selected DNA on Qubit Fluorometer using Qubit dsDNA High-Sensitivity Assay kit and tubes according to the manufacturer’s instructions to determine the concentration of each library. Purified libraries can be stored at − 20 °C until needed.
3.1.7. Library QC
To assure libraries quality before sequencing, two independent qPCR reactions including one positive control (SNRPN promoter) and one negative control (a CpG-less sequence in the intron of GABRB3) are performed for MeDIP-seq libraries to confirm enrichment of methylated DNA and depletion of unmethylated DNA. Another qPCR quantification step is applied using the primers which match sequences within the linkers flanking library inserts. This step measures templates that have linker sequences on both ends. They will subsequently form clusters on a flowcell.
Two sets of primers are designed to test for MeDIP enrichment for human samples (Table 1).
qPCRs are set up in triplicates in 20 μl volume with 1× iTaq universal SYBR Green supermix, 2 μl of MeDIP library (3.1.6.5, prediluted to 10 nM in EB) (see Note 15) and 0.8 μl of 10 μM primer mix (SNPRN or GABRB3).
Perform qPCR in thermocycler CFX with conditions of a denaturation of 30 sec at 95 °C, followed by 50 cycles of 5 sec at 95 °C and 5 sec at 60 °C.
- Calculation of the fold enrichment for methylated sequences is as the follow:
Where E is primers efficiency which can be calculated from a serial dilution standard curve of a genomic DNA (E=10(−1/slope) – 1) and Ct is the cycle threshold (see Note 16). Primers for another qPCR quantification are designed according to linker sequences which match both ends sequences of the adapter-modified PCR primers (Table 1).
A control MeDIP-seq library that has been successfully sequenced should be selected (see Note 17).
Before starting qPCR, the control template and libraries for quantification are diluted to 10 nM in EB buffer.
Add 2 μl of the control template (10 nM) to 198 μl of 0.1% Tween-20 solution to make a 100-fold dilution. Mix the dilution thoroughly.
Add 100 μl of the diluted template to 100 μl of 0.1% Tween-20 solution to make a titration curve of six 2× serial dilutions. This will give 7 control template dilutions in the range of 100-1.6 pM.
Mix the dilution thoroughly.
Repeat steps 7-10 to produce three independent serial dilutions of the control template (omit if the control template is limited).
Add 2 μl of each unknown library (10 nM) to 998 μl of 0.1% Tween-20 solution to make a 500-fold dilution. This will give an approximate concentration of 20 pM.
Mix the dilutions thoroughly.
Repeat steps 12-13 to produce three independent serial dilutions of each newly constructed library (omit if the newly constructed library is limited).
Set up qPCRs in triplicates in 20 μl volume with 1× iTaq universal SYBR Green supermix, 2 μl of diluted control templates (step 9) or unknown libraries (step 12), 0.4 μl of 10 μM qPCR primer 1.0 and 0.4 μl of 10 μM qPCR primer 2.0.
Perform qPCR in thermocycler CFX with conditions of a denaturation of 30 sec at 95 °C, followed by 40 cycles of 5 sec at 95 °C and 5 sec at 60 °C.
Generate a standard curve from the control template dilutions by plotting the Ct values (Y axis) against the log initial concentration (X axis).
Ensure that the efficiency of the standard curve in step 17 is 90-110% and that the R2>0.9.
Lock the threshold fluorescence based on the standard curve, calculate the initial concentration of the newly constructed libraries.
The concentration of newly constructed libraries should be close to that of the control library. Determine samples’ loading concentration based on the control template’s loading and cluster density.
3.1.8. Next-generation sequencing
Indexed MeDIP-seq libraries quantified by a Qubit fluorometer are pooled after QC and are quantified again on an Agilent 2100 Bioanalyzer. 101-bp paired-end sequencing is run for MeDIP-seq libraries following Illumina’s standard protocol. On Illumina Hi-Seq 2500 platform, typically 150~200 million raw reads per lane can be obtained. Three MeDIP-seq libraries can be typically pooled per lane.
3.2. MRE-seq
3.2.1. Genomic DNA extraction
Same as 3.1.1.
3.2.2. DNA fragmentation
Five methylation-sensitive restriction endonuclease are used in DNA digestion for fragmentation (see Note 18). All five enzymes are sensitive to CpG methylation. Sequencing 5′ end of these digested fragments therefore provides information for unmethylated CpG.
Transfer 500 ng of genomic DNA to a 1.5 ml sterile DNase/RNase free tube for each reaction mix. A pre-mix is set up in a 20 μl volume with 1× restriction enzyme buffer and 2.5 U of restriction enzyme (HpaII, HinP1I, AciI, HpyCH4IV or Bsh1236I). Keep the mixture on ice. Incubate reaction in a heat block at 37 °C for 3 h. Five digests for each sample can be set up in parallel.
Add additional 2.5 U of enzymes to each reaction after 3 h of incubation. Mix and incubate for another 3 h at 37 °C.
After total 6 h digestion, incubate the reaction at 65 °C for 20 min to deactivate the all enzymes except for HpaII (NEB) which is deactivated at 80°C.
Combine the five reactions. Each sample should have a total volume of 100 μl.
Purify the DNA sample with AMPure XP purification beads (see Note 19). Elute in 15 μl EB. Purified DNA can be stored at − 20 °C until needed.
Prepare a 100 ml 1% TAE agarose gel containing ethidium bromide.
Mix the DNA (step 5) with 3 μl of 6× loading dye and load in the gel, leaving space between the ladder and sample wells.
Carry out gel electrophoresis in 1× TAE buffer at 120 V until the orange dye runs to the two third of the gel.
After gel electrophoresis, transfer the gel tray onto the gel doc imaging system under UV light, cut out 100-500 bp size range with a clean blade.
Purify each gel slice with MinElute Gel DNA Extraction kit and elute in 30 μl EB buffer (see Note 14).
3.2.3. Library preparation I
Same as 3.1.3, except that only Klenow fragment is used for end repair (see Note 20).
3.2.4. Library preparation II
Same as 3.1.5.
3.2.5. Library size selection
Same as 3.1.6., except gel electrophoresis should run until the orange dye runs to the bottom of the gel (see Note 21).
3.2.6. Library QC
Same as 3.1.7., starting from step 3 (see Note 22).
3.2.7. Next-generation sequencing
Indexed MRE-seq libraries quantified by a Qubit fluorometer are pooled after QC and are quantified again on an Agilent 2100 Bioanalyzer. 50-bp single-end sequencing is run for MRE-seq libraries following Illumina’s standard protocol. On the Illumina Hi-Seq 2500 platform, typically 150~200 million raw reads can be obtained per lane. Six MRE-seq libraries can be pooled per lane.
3.3. Integrative analysis of MeDIP-seq and MRE-seq
3.3.1. Obtaining sample data
We provided sample data to illustrate how to use M&M and methylCRF.
3.3.1.1 Working directory
Make a new directory as our working folder, for example, /workbench/example, using the mkdir command:
mkdir /workbench/example
All the following commands are ran under this directory:
cd /workbench/example
In this protocol, we start from aligning raw reads to the reference genome. For illustration purpose, we included MeDIP-seq and MRE-seq from two human samples – human embryonic stem cell H1 (H1ES), and human Brain. We included 1 million raw reads from each dataset. These sample reads were mostly derived from chromosome 6. Therefore, in alignment step, we used human chromosome 6 as our reference sequence.
3.3.1.2. Genomic annotation data
Genomic annotation files (CpG coordinates, restriction enzyme recognition sites, and chromosome sizes) are needed for data processing. In this example we created a directory named “ann” for downloading and storing the annotation files:
mkdir ann
cd ann
3.3.1.3. Getting genomic annotation files for methylQA
wget http://wang.wustl.edu/MeDIP-MRE/ann/hg19.size
wget http://wang.wustl.edu/MeDIP-MRE/ann/CpG.bed.gz
wget http://wang.wustl.edu/MeDIP-MRE/ann/TriMRE_frags.bed
wget http://wang.wustl.edu/MeDIP-MRE/ann/FiveMRE_frags.bed
File description:
• hg19.size is a simple 2-column file that indicates the size of human chromosomes;
• CpG.bed.gz contains all CpG sites in human genome (decompress after download);
• TriMRE_frags.bed contains all MRE fragments in human genome based on three MRE enzymes.
• FiveMRE_frags.bed file contains all MRE fragments in human genome based on five MRE enzymes.
3.3.1.4. Getting files genomic annotation files for MnM
1. wget http://wang.wustl.edu/MeDIP-MRE/ann/num500_allcpg_hg19.bed
2. wget http://wang.wustl.edu/MeDIP-MRE/ann/num500_Five_mre_cpg_hg19.bed
3. wget http://wang.wustl.edu/MeDIP-MRE/ann/num500_Three_mre_cpg_hg19.bed
File description:
• num500_allcpg_hg19.bed contains coordinates of all CpG sites in 500bp window of hg19 genome;
• num500_Five_mre_cpg_hg19.bed contains 5 MRE enzyme cut sites in 500bp window genome wide,
• num500_Three_mre_cpg_hg19.bed contains 3 MRE enzyme cut sites in 500bp window genome wide.
Note: downloading annotation files for methylCRF is described in software section of methylCRF (2.3.2.7).
After downloaded annotation files, go back to the working directory:
cd /workbench/example
3.3.1.5. Getting sample MeDIP- and MRE-seq data (raw reads)
Download sample data from table below (Please note the sample data came from Roadmap Epigenomics Project: http://roadmapepigenomics.org/):
|
| |||
| Sample | GEO# | Assay | URL |
|
| |||
| H1ES | GSM543016 | MeDIP-seq | http://wang.wustl.edu/MeDIP-MRE/H1Es_MeDIP.fq.gz |
|
| |||
| GSM428286 | MRE-seq | http://wang.wustl.edu/MeDIP-MRE/H1Es_MRE.fq.gz | |
|
| |||
| Brain | GSM669614 | MeDIP-seq | http://wang.wustl.edu/MeDIP-MRE/Brain_MeDIP.fq.gz |
|
| |||
| GSM669604 | MRE-seq | http://wang.wustl.edu/MeDIP-MRE/Brain_MRE.fq.gz | |
|
| |||
Use wget command to download the sample reads in the table above:
wget URL
3.3.1.6. Getting the genome assembly
Build genome index for BWA alignment (illustration purpose only. Users should choose their favorite short-read aligner):
Download compressed human genome sequence: wget http://wang.wustl.edu/MeDIP-MRE/hg19.fa.gz
-
Decompress the downloaded file:
gunzip hg19.fa.gz
-
Build BWA index:
bwa index -a bwtsw -p hg19 hg19.fa
3.3.2. MeDIP-seq data processing
3.3.2.1. Reads alignment
Use the following command lines to generate alignment result for H1ES:
1. bwa aln -t 4 -f Brain_MeDIP.fq.gz.sai hg19 Brain_MeDIP.fq.gz
2. bwa samse -n 10 -f Brain_MeDIP.sam hg19 Brain_MeDIP.fq.gz.sai Brain_MeDIP.fq.gz
3. samtools view -bS Brain_MeDIP.sam -o Brain_MeDIP_unsort.bam
4. rm -f Brain_MeDIP.sam
5. samtools sort Brain_MeDIP_unsort.bam Brain_MeDIP
6. rm -f Brain_MeDIP_unsort.bam
These command line operations will perform the following functions:
Generated suffix array file for sequence reads.
Generate alignment result in SAM format.
Convert SAM formatted result to BAM format, which is binary and smaller in size.
Remove the SAM file.
Sorting the BAM file.
Removed the unsorted BAM file.
Parameter description:
-t : the number of thread used for the alignment process
-n 10: maximum edit distance for alignment is 10. More details of edit distance can be found in: http://en.wikipedia.org/wiki/Edit_distance.
Similarly, Brain data can be aligned using following commands:
1. bwa aln -t 4 -f H1Es_MeDIP.fq.gz.sai hg19 H1Es_MeDIP.fq.gz
2. bwa samse -n 10 -f H1Es_MeDIP.sam hg19 H1Es_MeDIP.fq.gz.sai H1Es_MeDIP.fq.gz
3. samtools view -bS H1Es_MeDIP.sam -o H1Es_MeDIP_unsort.bam
4. rm -f H1Es_MeDIP.sam
5. samtools sort H1Es_MeDIP_unsort.bam H1Es_MeDIP
6. rm -f H1Es_MeDIP_unsort.bam
3.3.2.2. Process MeDIP-seq alignment file by methylQA
1. methylQA medip -m ann/CpG.bed ann/hg19.size H1Es_MeDIP.bam
2. methylQA medip -m ann/CpG.bed ann/hg19.size Brain_MeDIP.bam
The methylQA package processes the MeDIP alignment result file (.bam) to generate alignment quality report and files formatted for various downstream needs. Resulting files include .bed file (aligned read location), .bedGraph file (aligned read density), and .bigWig file (aligned read density, for display on a Genome Browser). The option -m specifies the annotation file for CpG genomic locations.
Figure 2 displays processed MeDIP-seq data on the Wash U EpiGenome Browser [12,36–39].
Figure 2. Visualizing MeDIP-seq data on a Genome Browser.
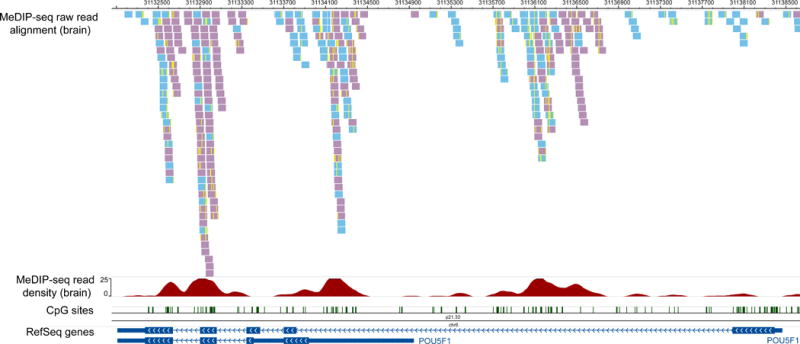
Processed MeDIP-seq data are displayed on the Wash U EpiGenome Browser. The genomic region encompassing POU5F1 (a.k.a. Oct4, an important stem cell specific gene) is shown. Four tracks are included. The first track displays MeDIP-seq reads that are uniquely aligned to this region, with redundant reads removed. Note that reads that are mapped to the forward strand and reverse strand are colored differently. Mismatches between each read and the genome assembly are also visible as yellow ticks with the read. The second track shows MeDIP-seq read density. The third track shows locations of CpG sites, and the last track display RefSeq genes, in this case two isoforms of POU5F1.
3.3.3. MRE-seq data processing
3.3.3.1. Align MRE-seq reads
1. bwa aln -t 4 -f H1Es_MRE.fq.gz.sai hg19 H1Es_MRE.fq.gz
2. bwa samse -n 10 -f H1Es_MRE.sam hg19 H1Es_MRE.fq.gz.sai H1Es_MRE.fq.gz
3. samtools view -bS H1Es_MRE.sam -o H1Es_MRE_unsort.bam
4. rm -f H1Es_MRE.sam
5. samtools sort H1Es_MRE_unsort.bam H1Es_MRE
6. rm -f H1Es_MRE_unsort.bam
1. bwa aln -t 4 -f Brain_MRE.fq.gz.sai hg19 Brain_MRE.fq.gz
2. bwa samse -n 10 -f Brain_MRE.sam hg19 Brain_MRE.fq.gz.sai Brain_MRE.fq.gz
3. samtools view -bS Brain_MRE.sam -o Brain_MRE_unsort.bam
4. rm -f Brain_MRE.sam
5. samtools sort Brain_MRE_unsort.bam Brain_MRE
6. rm -f Brain_MRE_unsort.bam
3.3.3.2. Process MRE-seq alignment file by methylQA
1. methylQA mre -m ann/CpG.bed ann/hg19.size ann/ TriMRE_frags.bed H1Es_MRE.bam
2. methylQA mre -m ann/CpG.bed ann/hg19.size ann/ TriMRE_frags.bed Brain_MRE.bam
The methylQA package processes the MRE alignment result file (.bam) to generate alignment quality report and files formatted for various downstream needs. Resulting files include .bed file (aligned read location), .bedGraph file (MRE score), and .bigWig file (MRE score, for display on a Genome Browser). The option -m specifies the annotation file for CpG genomic locations. Please note the MRE data used in this protocol were based on three enzymes, so all data MRE fragment file, MRE window file were from the 3-enzyme version. For experiments with different number or combination of enzymes, please use the corresponding annotation files.
Figure 3 displays processed MRE-seq data on a Genome Browser.
Figure 3. Visualizing MRE-seq data on a Genome Browser.
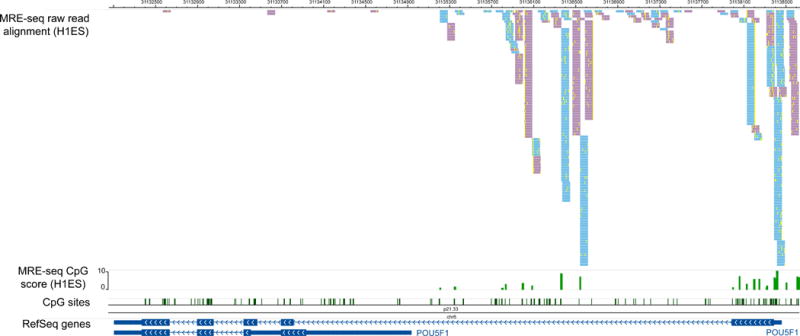
Processed MRE-seq data are displayed on the Wash U EpiGenome Browser, across the same genomic region as in Figure 2. Four tracks are included. The first track displays MRE-seq reads that are uniquely aligned to this region, and filtered by restriction enzyme recognition sites. Because independent enzymatic cleavage of the same site will result in identical sequencing reads, all reads are kept for analysis. Note that reads that are mapped to the forward strand and reverse strand are colored differently. Mismatches between each read and the genome assembly are also visible as yellow ticks with the read. The second track shows MRE-seq score, which is a normalized read count per enzyme at a given CpG site. The third and fourth tracks are identical to those from Figure 2.
3.3.4. Run methylMnM to predict DMRs between H1ES and Brian
In this example, we partition the genome into genomic bins of 500bp in size. M&M test is then performed for each genomic bin to generate a statistical assessment of the probability that the methylation levels of the two samples within each bin are different.
Use your favorite text editor, create an R script code “MnM.r” following the text box:
# Rscript MnM.r MeDIP_1 MeDIP_2 MRE_1 MRE_2 output_file
ts = proc.time()
args = commandArgs(TRUE)
(MeDIP_1 = args[1])
(MeDIP_2 = args[2])
(MRE_1 = args[3])
(MRE_2 = args[4])
(Out_file = args[5])
library(methylMnM)
cpg_bin = 'ann/num500_allcpg_hg19.bed'
mre_cpg_bin = 'ann/num500_Three_mre_cpg_hg19.bed'
Num500_MeDIP_1 = paste('num500_', MeDIP_1,sep = '')
Num500_MeDIP_2 = paste('num500_', MeDIP_2,sep = '')
Num500_MRE_1 = paste('num500_', MRE_1,sep = '')
Num500_MRE_2 = paste('num500_', MRE_2,sep = '')
countMeDIPbin(file.Medipsite = MeDIP_1,file.bin = cpg_bin,writefile = Num500_MeDIP_1, binlength = 500)
countMeDIPbin(file.Medipsite = MeDIP_2,file.bin = cpg_bin,writefile = Num500_MeDIP_2, binlength = 500)
countMREbin(file.MREsite = MRE_1,file.bin = cpg_bin,writefile = Num500_MRE_1, binlength = 500)
countMREbin(file.MREsite = MRE_2,file.bin = cpg_bin,writefile = Num500_MRE_2, binlength = 500)
# calculate p-value of each bin.
datafile = c(Num500_MeDIP_1,Num500_MeDIP_2,Num500_MRE_1,Num500_MRE_2)
pv_output = paste('pv_',Out_file,sep = '')
MnM.test(file.dataset = datafile,chrstring =”chr6”, file.cpgbin=cpg_bin,file.mrecpgbin=mre_cpg_bin,writefile=pv_output,mreratio=3/7,method="XXYY", psd=2,mkadded=1,a=1e-10,cut=100,top=500)
# calculate q-value of each bin
qv_output = paste('qv_',Out_file,sep = '')
MnM.qvalue(pv_output,qv_output)
qv = read.table(qv_output,header = T)
DMR_outfile = paste('DMRs_',qv_output,sep = '')
DMR_bg = paste(DMR_outfile,'.bedGraph',sep='')
dmr = MnM.selectDMR(qv,up = 1.45,down = 1/1.45,q.value = 1e-5,cutoff = 'q-value',quant = 0.9)
write.table(dmr,file=DMR_outfile,sep='\t',quote=F,row.names=F)
Dbg = dmr[,1:4]
Dbg[,4]= log10(dmr[,12]+1e-40)* (dmr[,11]/abs(dmr[,11]))
write.table(Dbg,file=DMR_bg,sep='\t',quote=F,row.names=F,col.names=F)
te = proc.time()
print('costing seconds:');te-ts
The main commands are described as following:
- CountMeDIPbin(): compute the total MeDIP-seq read count in each bin.
- Parameter file.Medipsite denotes the MeDIP-seq data.
- Parameter file.bin denotes CpG sites information in the 500bp windows.
- Parameter writefile denotes output file name of MeDIP-seq read counts in 500bp windows.
- Parameter binlength denotes the sliding window length. In this example, 500bp is used. Users can choose to use genomic bins of any arbitrary size, in which case the CpG sites information should be calculated by the countcpgbin function. Details can be found in the manual of methylMnM.
- CountMREbin(): compute the total MRE-seq read counts of each bin.
- Parameter file.MREsite denotes the MRE-seq data.
- Parameter file.bin denotes CpG sites information in 500bp windows.
- Parameter writefile denotes output file name of MRE-seq read counts in 500bp windows.
- Parameter binlength denotes the sliding window length. In this example, 500bp is used.
- MnM.test(): compute a p-value for each bin between two input samples.
- Parameter file.dataset denotes a vector, which contains the names of MeDIP-seq 500bp information and MRE-seq 500bp information
- Parameter chrstring denotes the chromosome used in calculation. When using parameter chrstring=NULL, calculation will performed for all chromosomes. In this example, we set chrstring=”chr6” to limit computation to chromosome 6.
- Parameter filecpg.bin denotes CpG sites information in 500bp windows.
- Parameter filemrecpg.bin denotes MRE CpG sites information in 500bp windows.
- Parameter writefile denotes output file name of p-value in 500bp windows.
MnM.qvalue(): estimate the q-values for a given set of p-values.
- MnM.selectDMR(): select significant DMRs based on given parameters.
- Parameter q-value denotes q-value cut-off, with default value being 1e-5.
- Parameter cutoff denotes q-value or p-value cutoff, with default being p-value.
-
3
Select DMRs.
1. Rscript MnM.r H1Es_MeDIP.extended.bed H1Es_MRE.filter.bed
Brain_MeDIP.extended.bed Brain_MRE.filter.bed H1Es_vs_Brain
The input files of methylMnM are methylQA processed alignment results in BED format.
This command generates several output result files:
qv_H1Es_vs_Brain: all q-values from the run.
DMRs_qv_H1Es_vs_Brain: statistically significant DMRs between H1ES and Brain based on q-value.
DMRs_qv_H1Es_vs_Brain.bedGraph: this file can be directly visualized on genome browsers. It can also be transformed to .bigWig file format for visualization.
The file DMR_qv_H1Es_vs_Brain looks like this:
1. chr   chrSt  chrEnd Medip1 Medip2 MRE1  MRE2  cg   mrecg
 pvalue Ts   qvalue
2. chr6 26756000 26756500 0.33604930970431
 0.0521568192129032 0.505034914010546 4.35538343254228 15 8
 1.54198003077371e-09 6.15213657535548 3.89125898336746e-07
3. chr6 27146500 27147000 0.0775498407009947
 0.48679697932043 6.81797133914237 1.61491745251568 22 11
 5.32321414472478e-09 -5.93993646148064 1.22580113946516e-06
4. chr6 27181000 27181500 0.310199362803979
 0.712809862576343 7.51239434590687 0.734053387507126 25 10
 2.19209717973469e-12 -7.17996054783314 8.76472716079456e-10
5. chr6 27181500 27182000 0.0775498407009947
 0.556339404937634 22.4740536734693 4.15963586254038 23 5
 4.25659507641285e-13 -7.24711688926306 1.89419388550094e-10
6. chr6 27250500 27251000 0.853048247710942 0 0 0
 15 0 4.01774138370403e-15 7.55689511636996
 4.77027539691851e-11
The 1st line is a header line, and the following lines represent identified DMRs, one DMR per line. Each column in the file has the following meaning:
1st column: chromosome of this DMR.
2nd column: start position of this DMR.
3rd column: end position of this DMR.
4th column: normalized MeDIP signal (RPKM) of this DMR from sample1 (H1ES here).
5th column: normalized MeDIP signal (RPKM) of this DMR from sample2 (Brain here).
6th column: normalized MRE signal (RPKM) of this DMR from sample1 (H1ES here).
7th column: normalized MRE signal (RPKM) of this DMR from sample2 (Brain here).
8th column: CpG site counts.
9th column: MRE CpG site counts.
10th column: p-value.
11th column: Ts value. Negative Ts represent hypermethylated DMRs in brain, and positive Ts represent hypomethylated DMRs in brain.
12th column: qvalue.
The file DMR_qv_H1Es_vs_Brain.bedGraph looks like this:
1. chr6 26756000 26756500 -6.4099098637
2. chr6 27146500 27147000 5.91157997928
3. chr6 27181000 27181500 9.05726159861
4. chr6 27181500 27182000 9.72257556963
5. chr6 27250500 27251000 -10.3214565476
Each column in the file has the following meaning:
1st column: chromosome of this DMR.
2nd column: start position of this DMR.
3rd column: end position of this DMR.
4th column: negative log10 transformed p-value. If the value is negative, it represents hypomethylation in sample 1 and hypermethylation in sample 2; if the value is positive, it represents hypermethylation in sample 1 and hypomethylation in sample 2.
Figure 4 displays a DMR between H1ES and brain, detected by M&M.
Figure 4. Visualizing M&M results.
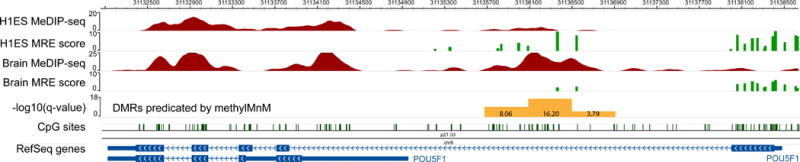
Differentially methylated regions between H1ES and brain are detected using the M&M program. Genomic region encompassing the POU5F1 gene is shown on the Wash U EpiGenome Browser. MeDIP-seq and MRE-seq data of H1ES and of the brain are displayed as the first four Browser tracks. The fifth track displays minus log10 transformed q-values, where q-values are resulted from M&M comparison between two samples at a 500bp resolution. Three genomic regions are detected as DMRs, with the middle region being the most statistically significant at a q-value 1e-16.2. The difference between H1ES and brain, and the complementary difference between MeDIP-seq and MRE-seq, can be visually appreciated. This DMR is biologically significant, and is directly linked to the regulation of POU5F1 which is expressed in embryonic stem cells but repressed in differentiated neuronal cells.
3.3.5. Predict single CpG methylation level for H1ES and Brain by methylCRF
Note: If your methylCRF folder is not at our working directory, please make a symbol link as:
ln -s /path/to/your/methylCRF/folder /workbench/example
3.3.5.1. Run methylCRF for H1ES
The input files of methylCRF are methylQA processed MeDIP-seq alignment file in BED format, and original MRE-seq alignment result in BAM format. Run the following commands:
1. awk '{OFS="\t"; print $1,$2,$3,".",1,$6}' H1Es_MeDIP.extended.bed > H1Es_MeDIP.extended.bed.crfdip
2. (samtools view H1Es_MRE.bam | methylCRF/sam2bed.pl -r -q 10 -) | methylCRF/MRE_norm.pl - methylCRF/MRE_3enz_4_6000.bed H1Es_MRE.bam.crfmre
3. methylCRF.pl methylCRF/h1es_mdl methylCRF/hg19_gdat H1Es_MeDIP.extended.bed.crfdip H1Es_MRE.bam.crfmre_MRE.bed methylCRF/MRE_3enz_4_6000_cpg.bin 750 H1Es
These commands will perform the following functions:
Convert the methylQA processed MeDIP-seq alignment result in BED format to required input format for methylCRF.
Filter MRE alignment result in BAM format by MRE cut sites. Perform quality filtering and normalization.
Run methylCRF main code to predict single CpG methylation level for H1 ES cell.
The code above will generate some intermediate files, and the final result file is named as H1ES_mCRF.bed, which looks like this:
chr6 60469 60471 chr6.1 0.89
chr6 60657 60659 chr6.2 0.91
chr6 60797 60799 chr6.3 0.95
chr6 60857 60859 chr6.4 0.90
chr6 60909 60911 chr6.5 0.90
Each line of this file represent methylation status of 1 CpG site, and each column of this file means:
1st column: chromosome of this CpG site
2nd column: start position of this CpG site
3rd column: end position of this CpG site
4th column: an internal id for CpG site in methylCRF, could be ignored
5th column: methylation value of this CpG site, 1 means totally methylated and 0 mean totally unmethylated.
3.3.5.2. Run methylCRF for Brain
Similar to predict CpG methylation level for H1 ES cell, just replace the input files with brain MeDIP-seq file in BED format and brain MRE-seq files in BAM format.
1. awk '{OFS="\t"; print $1,$2,$3,".",1,$6}' Brain_MeDIP.extended.bed > Brain_MeDIP.extended.bed.crfdip
2. (samtools view Brain_MRE.bam | methylCRF/sam2bed.pl -r -q 10 -) | methylCRF/MRE_norm.pl - methylCRF/MRE_5enz_4_6000.bed Brain_MRE.bam.crfmre
3. methylCRF.pl methylCRF/h1es_mdl methylCRF/hg19_gdat Brain_MeDIP.extended.bed.crfdip Brain_MRE.bam.crfmre_MRE.bed methylCRF/MRE_5enz_4_6000_cpg.bin 750 Brain
Figure 5 displays methylCRF transformed DNA methylation data for H1ES and brain.
Figure 5. Visualizing methylCRF results.
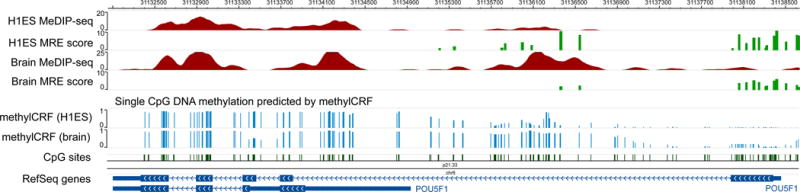
The same genomic region is represented on a Browser view. MeDIP-seq and MRE-seq data from H1ES and brain are displayed as in Figure 4. In addition, two methylCRF tracks are included, displaying DNA methylation levels at single CpG resolution. CpGs in the DMR displayed in Figure 4 has low methylation levels in H1ES, and high methylation levels in brain.
4. Notes
Usually each component is prepared as a stock solution. Proteinase K should be stored at −20 °C and should be added immediately before each use.
The 5-terminal phosphate in adapter PE 2.0 facilitates the ligation of annealed adapters to DNA inserts. The phosphorothiate linkage in adapter PE 1.0 prevents nuclease cleavage of the T overhang, which is required for the adapter and A-tailed DNA fragment ligation.
Compared with commercial kits and the original DNA isolation protocol [25], this optimized protocol can generate higher quality DNA, and can be easily adapted for the isolation of genomic DNA from various cells and tissue types.
Allow frozen tissue to warm up slightly (5-10 sec), and chop it in a petri dish. The quantity of extraction buffer is dependent on cell numbers and tissue size. For instance, 600 μl of buffer is sufficient to lyse 1-5 million cells or up to 20 mg of tissue. Alternatively, small samples can be resuspended in 100 μl extraction buffer.
Pipet gently! The DNA can be easily sheared by vigorous mixing or pipetting.
The solution should look homogenous following digestion. Inadequate digestion will lead to lower yield and lower DNA quality. If additional digestion is required, add more extraction buffer and incubate until homogenous.
Qubit fluorometer and dsDNA HS assay kit can also be used to get accurate quantification.
Intact DNA without random shearing should not appear as a smear.
DNA fragment size range should be 100-500 bp. Continue sonication if the desired range is not achieved.
A lot of commercial kits can be used for DNA purification. It was reported that AMPure XP beads can reduce DNA loss during purification when compared to Qiagen kit [30]. The beads selectively bind DNA fragments of 100bp and bigger, thus excess adapter fragments and primer dimmers can be removed.
DNA fragments need to be denatured to single strand for anti-methylcytosine immunoprecipitation. The denatured single-stranded DNA is not suitable for library construction. The immunoprecipitation step is therefore sandwiched between two library preparation steps.
We choose not to use AMPure XP beads in this step because the elution buffer used in immunoprecipitation affects binding of DNA to the beads, especially when the DNA fragments are shorter than 300 bp.
12 cycles is enough in this step. Higher cycle numbers will result in higher PCR bias.
We modified the Qiagen gel extraction protocol to melt agarose gel slices at 37 °C instead of at 50 °C to reduce G+C bias [40]. Use two Qiagen columns if a gel slice is over 400 mg and elute each column in 10 μl EB. Combine the two elutes.
- A non-MeDIPed sonicated input control should be included if sufficient material is available. The ng/μl concentration measured by Qubit fluorometer can be converted to nanomolar with the following formula:
It is recommended that the methylated fragments are at least 25-fold more enriched than the unmethylated fragments [33]. In practice our libraries show enrichment score higher than 2500. Non-MeDIPed sonicated input control should be exhibit any enrichment.
The control library should be as closely related as possible to the newly constructed libraries for quantification. For example, if you quantitate human MeDIP-seq libraries, you should use a human MeDIP-seq library as a control (from the same cell or tissue type if possible).
Three restriction endonucleases of HpaII (C↓CGG), HinP1I (G↓CGC) and AciI (C↓CGC) were used in the original protocol [25]. Five enzymes can be used to increase genome coverage.
AMPure XP beads are used in this step instead of phenol chloroform extraction which was used in the original protocol [25].
Restriction endonuclease digested fragments contain 5′-phosphorylated and 3′-terminal recessive ends. Therefore, a Klenow DNA polymerase is used to finish filling-in.
In MeDIP-seq, the unmethylated adapter cannot be precipitated, therefore there are no adapter dimers in its PCR product. In contrast, in MRE-seq, the dimerized oligonucleotides (~120bp in size) should be removed by running gel as long as possible.
The control library should be as similar as possible to the newly constructed libraries for quantification. For example, if you quantitate human MRE-seq libraries, you should to choose a human MRE-seq library as control (from the same cell or tissue type if possible).
In both M&M and methylCRF, The MRE CpG information should match experimental design, which may use either three, four or five enzymes.
In this chapter, both MeDIP-seq and MRE-seq data are single-end reads. For paired-end sequencing data, the alignment should follow instructions of alignment software that users choose.
For paired-end sequencing data, methylQA has different parameters to optimize processing result.
When comparing two samples with different MeDIP sequencing method (i.e. paired-end vs. single-end) by MnM, the paired-end data should be processed as single-end data for a fair comparison.
When comparing two samples with different MRE usage (i.e. 3MRE vs. 5MRE) by M&M, MRE data should be processed as if the same set of enzymes were used for both sample, with the limiting factor being the fewer of the two. For example, if one experiment used 5 MRE enzymes, then its data should be reduced to 3 MREs (i.e. data generated by the two additional enzymes should be filered) before compared to the experiment what used 3 MRE enzymes.
Both methylMnM and methylCRF work with either MeDIP-seq data or MRE-seq data alone. However this will result in increased false positives. Thus, we do not recommend using methylMnM and methylCRF with only MeDIP-seq data or only MRE-seq data.
Depending on total read counts from MeDIP-seq and MRE-seq data, methylMnM and methylCRF will need up to 20 CPU hours to finish calculation for a typical human experiment. We recommend using “nohup” to run the processes in the background.
methylCRF requires that MRE-seq data provided in BAM format for proper normalization.
Acknowledgments
We thank Joseph F. Costello, Ravi Nagarajan, Chibo Hong for developing experimental protocols described in this chapter. We thank Michael Stevens for developing methylCRF. We thank Nan Lin, Yan Zhou, Boxue Zhang for developing M&M. We thank members of the Wang laboratory for testing and improving various parts of the methods. This work was supported by NIH grant U01ES017154 (TW), R01HG007354 (TW), NIDA’s R25 program DA027995 (BZ), and American Cancer Society grant RSG-14-049-01-DMC (TW).
References
- 1.Bird A. DNA methylation patterns and epigenetic memory. Genes & development. 2002;16(1):6–21. doi: 10.1101/gad.947102. [DOI] [PubMed] [Google Scholar]
- 2.Ziller MJ, Muller F, Liao J, Zhang Y, Gu H, Bock C, Boyle P, Epstein CB, Bernstein BE, Lengauer T, Gnirke A, Meissner A. Genomic distribution and inter-sample variation of non-CpG methylation across human cell types. PLoS genetics. 2011;7(12):e1002389. doi: 10.1371/journal.pgen.1002389. [DOI] [PMC free article] [PubMed] [Google Scholar]
- 3.Lister R, Pelizzola M, Kida YS, Hawkins RD, Nery JR, Hon G, Antosiewicz-Bourget J, O’Malley R, Castanon R, Klugman S, Downes M, Yu R, Stewart R, Ren B, Thomson JA, Evans RM, Ecker JR. Hotspots of aberrant epigenomic reprogramming in human induced pluripotent stem cells. Nature. 2011;471(7336):68–73. doi: 10.1038/nature09798. [DOI] [PMC free article] [PubMed] [Google Scholar]
- 4.Ramsahoye BH, Biniszkiewicz D, Lyko F, Clark V, Bird AP, Jaenisch R. Non-CpG methylation is prevalent in embryonic stem cells and may be mediated by DNA methyltransferase 3a. Proceedings of the National Academy of Sciences of the United States of America. 2000;97(10):5237–5242. doi: 10.1073/pnas.97.10.5237. [DOI] [PMC free article] [PubMed] [Google Scholar]
- 5.Yan J, Zierath JR, Barres R. Evidence for non-CpG methylation in mammals. Experimental cell research. 2011;317(18):2555–2561. doi: 10.1016/j.yexcr.2011.08.019. [DOI] [PubMed] [Google Scholar]
- 6.Aran D, Sabato S, Hellman A. DNA methylation of distal regulatory sites characterizes dysregulation of cancer genes. Genome biology. 2013;14(3):R21. doi: 10.1186/gb-2013-14-3-r21. [DOI] [PMC free article] [PubMed] [Google Scholar]
- 7.Suzuki MM, Bird A. DNA methylation landscapes: provocative insights from epigenomics. Nature reviews Genetics. 2008;9(6):465–476. doi: 10.1038/nrg2341. [DOI] [PubMed] [Google Scholar]
- 8.Jones PA. Functions of DNA methylation: islands, start sites, gene bodies and beyond. Nature reviews Genetics. 2012;13(7):484–492. doi: 10.1038/nrg3230. [DOI] [PubMed] [Google Scholar]
- 9.Smith ZD, Meissner A. DNA methylation: roles in mammalian development. Nature reviews Genetics. 2013;14(3):204–220. doi: 10.1038/nrg3354. [DOI] [PubMed] [Google Scholar]
- 10.Robertson KD. DNA methylation and human disease. Nature reviews Genetics. 2005;6(8):597–610. doi: 10.1038/nrg1655. [DOI] [PubMed] [Google Scholar]
- 11.Bergman Y, Cedar H. DNA methylation dynamics in health and disease. Nature structural & molecular biology. 2013;20(3):274–281. doi: 10.1038/nsmb.2518. [DOI] [PubMed] [Google Scholar]
- 12.Irizarry RA, Ladd-Acosta C, Wen B, Wu Z, Montano C, Onyango P, Cui H, Gabo K, Rongione M, Webster M, Ji H, Potash JB, Sabunciyan S, Feinberg AP. The human colon cancer methylome shows similar hypo- and hypermethylation at conserved tissue-specific CpG island shores. Nature genetics. 2009;41(2):178–186. doi: 10.1038/ng.298. [DOI] [PMC free article] [PubMed] [Google Scholar]
- 13.Hon GC, Rajagopal N, Shen Y, McCleary DF, Yue F, Dang MD, Ren B. Epigenetic memory at embryonic enhancers identified in DNA methylation maps from adult mouse tissues. Nature genetics. 2013;45(10):1198–1206. doi: 10.1038/ng.2746. [DOI] [PMC free article] [PubMed] [Google Scholar]
- 14.Stadler MB, Murr R, Burger L, Ivanek R, Lienert F, Scholer A, van Nimwegen E, Wirbelauer C, Oakeley EJ, Gaidatzis D, Tiwari VK, Schubeler D. DNA-binding factors shape the mouse methylome at distal regulatory regions. Nature. 2011;480(7378):490–495. doi: 10.1038/nature10716. [DOI] [PubMed] [Google Scholar]
- 15.Zhang B, Zhou Y, Lin N, Lowdon RF, Hong C, Nagarajan RP, Cheng JB, Li D, Stevens M, Lee HJ, Xing X, Zhou J, Sundaram V, Elliott G, Gu J, Shi T, Gascard P, Sigaroudinia M, Tlsty TD, Kadlecek T, Weiss A, O’Geen H, Farnham PJ, Maire CL, Ligon KL, Madden PA, Tam A, Moore R, Hirst M, Marra MA, Zhang B, Costello JF, Wang T. Functional DNA methylation differences between tissues, cell types, and across individuals discovered using the M&M algorithm. Genome research. 2013;23(9):1522–1540. doi: 10.1101/gr.156539.113. [DOI] [PMC free article] [PubMed] [Google Scholar]
- 16.Ziller MJ, Gu H, Muller F, Donaghey J, Tsai LT, Kohlbacher O, De Jager PL, Rosen ED, Bennett DA, Bernstein BE, Gnirke A, Meissner A. Charting a dynamic DNA methylation landscape of the human genome. Nature. 2013;500(7463):477–481. doi: 10.1038/nature12433. [DOI] [PMC free article] [PubMed] [Google Scholar]
- 17.Schlesinger F, Smith AD, Gingeras TR, Hannon GJ, Hodges E. De novo DNA demethylation and noncoding transcription define active intergenic regulatory elements. Genome research. 2013;23(10):1601–1614. doi: 10.1101/gr.157271.113. [DOI] [PMC free article] [PubMed] [Google Scholar]
- 18.Xie M, Hong C, Zhang B, Lowdon RF, Xing X, Li D, Zhou X, Lee HJ, Maire CL, Ligon KL, Gascard P, Sigaroudinia M, Tlsty TD, Kadlecek T, Weiss A, O’Geen H, Farnham PJ, Madden PA, Mungall AJ, Tam A, Kamoh B, Cho S, Moore R, Hirst M, Marra MA, Costello JF, Wang T. DNA hypomethylation within specific transposable element families associates with tissue-specific enhancer landscape. Nature genetics. 2013;45(7):836–841. doi: 10.1038/ng.2649. [DOI] [PMC free article] [PubMed] [Google Scholar]
- 19.Cokus SJ, Feng S, Zhang X, Chen Z, Merriman B, Haudenschild CD, Pradhan S, Nelson SF, Pellegrini M, Jacobsen SE. Shotgun bisulphite sequencing of the Arabidopsis genome reveals DNA methylation patterning. Nature. 2008;452(7184):215–219. doi: 10.1038/nature06745. [DOI] [PMC free article] [PubMed] [Google Scholar]
- 20.Lister R, Pelizzola M, Dowen RH, Hawkins RD, Hon G, Tonti-Filippini J, Nery JR, Lee L, Ye Z, Ngo QM, Edsall L, Antosiewicz-Bourget J, Stewart R, Ruotti V, Millar AH, Thomson JA, Ren B, Ecker JR. Human DNA methylomes at base resolution show widespread epigenomic differences. Nature. 2009;462(7271):315–322. doi: 10.1038/nature08514. [DOI] [PMC free article] [PubMed] [Google Scholar]
- 21.Laurent L, Wong E, Li G, Huynh T, Tsirigos A, Ong CT, Low HM, Kin Sung KW, Rigoutsos I, Loring J, Wei CL. Dynamic changes in the human methylome during differentiation. Genome research. 2010;20(3):320–331. doi: 10.1101/gr.101907.109. [DOI] [PMC free article] [PubMed] [Google Scholar]
- 22.Meissner A, Gnirke A, Bell GW, Ramsahoye B, Lander ES, Jaenisch R. Reduced representation bisulfite sequencing for comparative high-resolution DNA methylation analysis. Nucleic acids research. 2005;33(18):5868–5877. doi: 10.1093/nar/gki901. [DOI] [PMC free article] [PubMed] [Google Scholar]
- 23.Meissner A, Mikkelsen TS, Gu H, Wernig M, Hanna J, Sivachenko A, Zhang X, Bernstein BE, Nusbaum C, Jaffe DB, Gnirke A, Jaenisch R, Lander ES. Genome-scale DNA methylation maps of pluripotent and differentiated cells. Nature. 2008;454(7205):766–770. doi: 10.1038/nature07107. [DOI] [PMC free article] [PubMed] [Google Scholar]
- 24.Weber M, Davies JJ, Wittig D, Oakeley EJ, Haase M, Lam WL, Schubeler D. Chromosome-wide and promoter-specific analyses identify sites of differential DNA methylation in normal and transformed human cells. Nature genetics. 2005;37(8):853–862. doi: 10.1038/ng1598. [DOI] [PubMed] [Google Scholar]
- 25.Maunakea AK, Nagarajan RP, Bilenky M, Ballinger TJ, D’Souza C, Fouse SD, Johnson BE, Hong C, Nielsen C, Zhao Y, Turecki G, Delaney A, Varhol R, Thiessen N, Shchors K, Heine VM, Rowitch DH, Xing X, Fiore C, Schillebeeckx M, Jones SJ, Haussler D, Marra MA, Hirst M, Wang T, Costello JF. Conserved role of intragenic DNA methylation in regulating alternative promoters. Nature. 2010;466(7303):253–257. doi: 10.1038/nature09165. [DOI] [PMC free article] [PubMed] [Google Scholar]
- 26.Serre D, Lee BH, Ting AH. MBD-isolated Genome Sequencing provides a high-throughput and comprehensive survey of DNA methylation in the human genome. Nucleic acids research. 2010;38(2):391–399. doi: 10.1093/nar/gkp992. [DOI] [PMC free article] [PubMed] [Google Scholar]
- 27.Kriukiene E, Labrie V, Khare T, Urbanaviciute G, Lapinaite A, Koncevicius K, Li D, Wang T, Pai S, Ptak C, Gordevicius J, Wang SC, Petronis A, Klimasauskas S. DNA unmethylome profiling by covalent capture of CpG sites. Nature communications. 2013;4:2190. doi: 10.1038/ncomms3190. [DOI] [PubMed] [Google Scholar]
- 28.Harris RA, Wang T, Coarfa C, Nagarajan RP, Hong C, Downey SL, Johnson BE, Fouse SD, Delaney A, Zhao Y, Olshen A, Ballinger T, Zhou X, Forsberg KJ, Gu J, Echipare L, O’Geen H, Lister R, Pelizzola M, Xi Y, Epstein CB, Bernstein BE, Hawkins RD, Ren B, Chung WY, Gu H, Bock C, Gnirke A, Zhang MQ, Haussler D, Ecker JR, Li W, Farnham PJ, Waterland RA, Meissner A, Marra MA, Hirst M, Milosavljevic A, Costello JF. Comparison of sequencing-based methods to profile DNA methylation and identification of monoallelic epigenetic modifications. Nature biotechnology. 2010;28(10):1097–1105. doi: 10.1038/nbt.1682. [DOI] [PMC free article] [PubMed] [Google Scholar]
- 29.Bock C, Tomazou EM, Brinkman AB, Muller F, Simmer F, Gu H, Jager N, Gnirke A, Stunnenberg HG, Meissner A. Quantitative comparison of genome-wide DNA methylation mapping technologies. Nature biotechnology. 2010;28(10):1106–1114. doi: 10.1038/nbt.1681. [DOI] [PMC free article] [PubMed] [Google Scholar]
- 30.Taiwo O, Wilson GA, Morris T, Seisenberger S, Reik W, Pearce D, Beck S, Butcher LM. Methylome analysis using MeDIP-seq with low DNA concentrations. Nature protocols. 2012;7(4):617–636. doi: 10.1038/nprot.2012.012. [DOI] [PubMed] [Google Scholar]
- 31.Nair SS, Coolen MW, Stirzaker C, Song JZ, Statham AL, Strbenac D, Robinson MD, Clark SJ. Comparison of methyl-DNA immunoprecipitation (MeDIP) and methyl-CpG binding domain (MBD) protein capture for genome-wide DNA methylation analysis reveal CpG sequence coverage bias. Epigenetics : official journal of the DNA Methylation Society. 2011;6(1):34–44. doi: 10.4161/epi.6.1.13313. [DOI] [PubMed] [Google Scholar]
- 32.Pelizzola M, Koga Y, Urban AE, Krauthammer M, Weissman S, Halaban R, Molinaro AM. MEDME: an experimental and analytical methodology for the estimation of DNA methylation levels based on microarray derived MeDIP-enrichment. Genome research. 2008;18(10):1652–1659. doi: 10.1101/gr.080721.108. [DOI] [PMC free article] [PubMed] [Google Scholar]
- 33.Stevens M, Cheng JB, Li D, Xie M, Hong C, Maire CL, Ligon KL, Hirst M, Marra MA, Costello JF, Wang T. Estimating absolute methylation levels at single-CpG resolution from methylation enrichment and restriction enzyme sequencing methods. Genome research. 2013;23(9):1541–1553. doi: 10.1101/gr.152231.112. [DOI] [PMC free article] [PubMed] [Google Scholar]
- 34.Lafferty J, McCallum A, Pereira F. Conditional Random Fields: Probabilistic Models for Segmenting and Labeling Sequence Data. Departmental Papers CIS-159 2001 [Google Scholar]
- 35.Wallach H. Conditional Random Fields: An Introduction. Department of Computer and Information Science, University of Pennsylvania; 2004. (Technical Report MS-CIS-04-21). [Google Scholar]
- 36.Zhou X, Li D, Lowdon RF, Costello JF, Wang T. methylC Track: visual integration of single-base resolution DNA methylation data on the WashU EpiGenome Browser. Bioinformatics. 2014;30(15):2206–2207. doi: 10.1093/bioinformatics/btu191. [DOI] [PMC free article] [PubMed] [Google Scholar]
- 37.Zhou X, Lowdon RF, Li D, Lawson HA, Madden PA, Costello JF, Wang T. Exploring long-range genome interactions using the WashU Epigenome Browser. Nature methods. 2013;10(5):375–376. doi: 10.1038/nmeth.2440. [DOI] [PMC free article] [PubMed] [Google Scholar]
- 38.Zhou X, Wang T. Using the Wash U Epigenome Browser to examine genome-wide sequencing data. Current protocols in bioinformatics / editoral board, Andreas D Baxevanis [et al] 2012:10. doi: 10.1002/0471250953.bi1010s40. Chapter 10:Unit10. [DOI] [PMC free article] [PubMed] [Google Scholar]
- 39.Zhou X, Maricque B, Xie M, Li D, Sundaram V, Martin EA, Koebbe BC, Nielsen C, Hirst M, Farnham P, Kuhn RM, Zhu J, Smirnov I, Kent WJ, Haussler D, Madden PA, Costello JF, Wang T. The Human Epigenome Browser at Washington University. Nature methods. 2011;8(12):989–990. doi: 10.1038/nmeth.1772. [DOI] [PMC free article] [PubMed] [Google Scholar]
- 40.Quail MA, Kozarewa I, Smith F, Scally A, Stephens PJ, Durbin R, Swerdlow H, Turner DJ. A large genome center’s improvements to the Illumina sequencing system. Nature methods. 2008;5(12):1005–1010. doi: 10.1038/nmeth.1270. [DOI] [PMC free article] [PubMed] [Google Scholar]