Abstract
Ultrasound acoustic waves are demonstrated to assemble poly-3-hexylthiophene (P3HT) chains into nanofibers after they are fully dissolved in what are commonly considered to be ‘good’ solvents. In the absence of ultrasound, the polymer remains fully dissolved and does not self-assemble for weeks. UV-vis spectroscopy, ultra-small angle x-ray scattering (USAXS) and small angle neutron scattering (SANS) are used to characterize the induced assembly process and to quantify the fraction of polymer that forms nanofibers. It is determined that the solvent type, insonation time, and aging periods are all important factors affecting the structure and final concentration of fibers. The effect of changing polymer regio-regularity, alkyl chain length, and side chain to thiophene ratio are also explored. High intensity focused ultrasound (HIFU) fields of variable intensity are utilized to reveal the physical mechanisms leading to nanofiber formation, which is strongly correlated to cavitation events in the solvent. This in-situ HIFU cell, which is designed for simultaneous scattering analysis, is also used to probe for structural changes occurring over multiple length scales using USAXS and SANS. The proposed acoustic assembly mechanism suggests that, even when dispersed in ‘good’ solvents such as bromobenzene, dichlorobenzene and chloroform, P3HT chains are still not in a thermodynamically stable state. Instead, they are stabilized by local energy barriers that slow down and effectively prevent crystallization. Ultrasound fields are found to provide enough mechanical energy to overcome these barriers, triggering the formation of small crystalline nuclei that subsequently seed the growth of larger nanofibers.
Graphical abstract
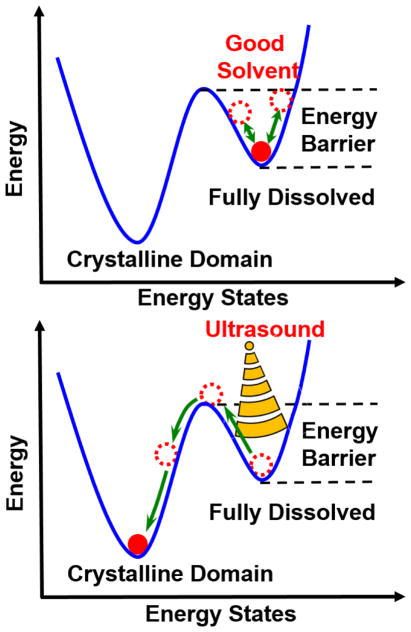
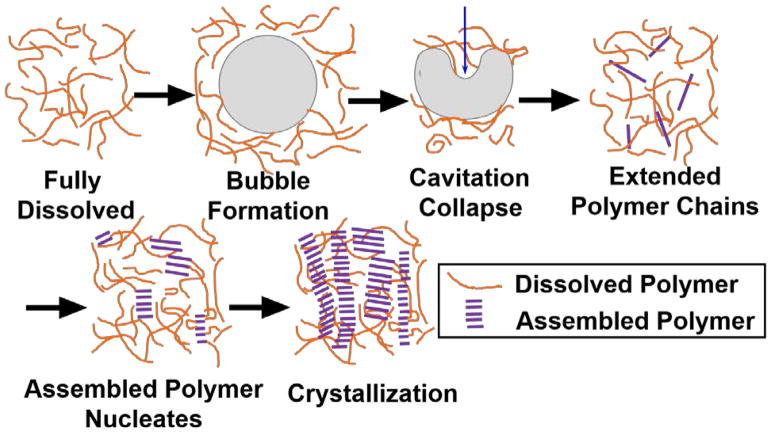
Possible mechanism of sonocrystallization of conjugated polymers is based on nucleation sites formation during bubble collapse under acoustic field.
Introduction
Conjugated polymers (CPs) have been extensively pursued as candidate materials for use in organic photovoltaics (OPVs), organic light emitting diodes (OLEDs), and organic field-effect transistors (OFETs).1–3 In addition to their (opto) electronic properties, properties such as flexibility, bio-compatibility, and highly tunable molecular design make them promising materials for novel sensors and bioelectronic devices.4,5 Unfortunately, limited electrical conductivity is still a major hindrance for the effective application of CPs in many applications. Frequently, amorphous polymer structures lead to inefficient inter-chain charge hopping that limits charge transport. This is often corrected by initiating the formation of ordered polymer phases that are driven by stacking π-orbitals orthogonal to the polymer backbone. The resulting formation of large crystalline structures facilitates inter-chain charge propagation, which enables transport over much longer distances and improves charge-carrier mobility by several orders of magnitude.6 Recently, much work has also been dedicated to further increasing conductivity by engineering polymer structures with external forces, including capillary,7 shear,8 gravitational,9 and electrostatic forces.10 In this work, the use of acoustic fields at ultrasound frequencies (>20 kHz) is investigated as an effective method to assemble polymer chains into fibers with long-range order.
In colloid and polymer science, ultrasound is most frequently used in a destructive way to mechanically break up aggregates, disperse particles, emulsify oils, and even to break up whole cells in a process known as sonofragmentation.11–14 However, and often counter-intuitively, in some cases ultrasound is also used to assemble molecules into highly ordered structures in a process known as sonocrystallization, where the wavelength of the acoustic wave (~cm) is several orders larger than the size of the molecules. Successful demonstrations of sonocrystallization usually involve small molecules, such as adipic acid,15 sulfamerazine,16 and glucose.17 In the above systems, ultrasound is typically applied to solutions with supersaturation to induce crystallization. Although the mechanism of crystallization under ultrasound is still ambiguous, it has been reported that ultrasound can effectively shorten the induction time (i.e. duration between achievement of supersaturation and appearance of detectable crystals). Recently, pioneering work provided evidence of the possibilities of inducing sonocrystallization on macromolecules including proteins18–20 and conjugated polymers.21–23 It was reported that poly(3-hexylthiophene) (P3HT) polymers chains can assemble into nanofibers that are micrometers long under ultrasound in chloroform or toluene.21–23 Early investigations of P3HT sonication in ‘good’ solvents (i.e. chlorobenzene and 1,2-dichlorobenzene) did not observe nanofibers formation, but they revealed that the solution’s specific viscosity decreased, which was hypothesized to correlate to a change in chain conformation. 23 The higher the concentration (namely supersaturation), the more obvious the changes are. Furthermore, the formation of nanofibers was demonstrated to enhance the charge carrier’s mobility by up to one order of magnitude due to more efficient inter-chain transport.21 On the other hand, spontaneous nanofiber formation in conjugated polymers is also routinely achieved by tuning solvent quality or changing temperature in the absence of any external fields.24–27 Therefore, there are still important questions remaining on the specific effect of ultrasound on polymer chains and how this relates to spontaneous self-assembly that may occur due to variations in solubility in the absense of ultrasound.
We hypothesize that the role of ultrasound in sonocrystallization of conjugated polymers, from a thermodynamics point of view, follows the energy diagram shown in Figure 1. For ideal good solvents, the dissolved state is supposed to be a global energy minimum within the energy landscape, which means once it is dissolved, it should stay in the thermodynamically favored dissolution state without assembly. However, in reality polymer chains that appear to be fully dissolved in ‘good’ solvents, are instead confined to a local energy minimum created by an energy barrrier. This prevents them from achieving crystallization, which is a more energetically favorable state, in a reasonable time frame. As the solvent quality increases, the energy necessary to cross this stabilizing barrier is larger. This is analogous to the kinetic stabilization of colloidal particles that can remain suspended for long periods of time due to electrostatic repulsion. Although these particles may appear to be in an energetically stable state, the global energy minima is in the aggregated state, but a significant energy barrier prevents them from achieving this state in a reasonable time frame.
Figure 1.
Schematic of energy diagram of the thermodynamic process from polymers in a fully dissolved state to the formation of crystalline structures under ultrasound.
In sonocrystallization, ultrasound provides enough energy to allow molecules and polymers to overcome the stabilizing barrier resulting in the formation of crystalline nuclei that facilitate further crystallization. Still, a persistent question is by what mechanism is ultrasound triggering the crystallization process. We hypothesize that cavitation induces sonocrystallization by modifying the conformation of polymer chains to facilitate the formation of crystal nuclei for continued growth. In this process, the formation of cavitation events is strongly dependent on the applied acoustic field frequency and pressure. In order to quantitatively relate the acoustic field to the nucleation process, to shed light on the mechanism of conjugated polymer sonocrystallization, it is essential to use well-characterized acoustic fields to probe the system.
To accurately describe an acoustic wave, its pressure and frequency are typically utilized.28 When the pressure of the acoustic wave is lower than ambient pressure (i.e. in the so called negative pressure phase), it exerts a tension on the surrounding liquid medium that could induce the formation of a cavity if its magnitude is above a certain threshold.29 Cavitation is defined by Neppiras as the creation of new surface or cavity within the liquid.30 Cavitation thresholds depend on several factors including the frequency of the acoustic wave, the pressure amplitude, the surface tension, temperature and boiling point. At higher frequencies, larger pressure amplitudes are required to induce cavitation.31,32 The formation of a cavity favors growth under acoustic waves because of rectified diffusion. During expansion (negative pressure), liquid molecules diffuse into vapor bubbles to form a larger gaseous phase. In contrast, vapors condense into the liquid in response to the compression force that is induced at the positive pressure stage of the wave.31 Importantly, the transport into and out of the cavity is not balanced because the bubble surface area during the expansion stage is much larger than that during compression. This results in the growth of the cavity or bubble under continued insonation. When a bubble grows to a critical size, it will eventually resonate with the acoustic wave and this will lead to an abrupt collapse producing localized extreme conditions (i.e. temperature up to 5000 K and pressure up to 1000 atm) and ejecting high-speed jets (100–400 m/s) that mechanically act on the surrounding fluid and container.33–35 Subsequently, rapid cooling (107–1010 K/s) occurs and shock waves are generated.36 The extreme effects of thousands of these local cavitation events are largely responsible for the cleaning action and sample manipulation (e.g. emulsification) that makes ultrasound a valuable tool in the laboratory.
In this work, we provide a detailed mechanistic and structural analysis of the processes involved in the formation of organized crystalline domains (i.e. nanofibers) during the ultrasound activation of conjugated polymers dissolved in what are considered to be ‘good’ solvents for these materials. We use carefully characterized acoustic waves and perform cavitation and structural analyses to properly inform the mechanisms of fiber formation.
Experimental
Materials
All chemicals were used as received. Poly(3-alkylthiophene) (P3AT), including regio-regular, regio-random poly(3-hexylthiophene) (P3HT), and Poly(3-dodecylthiophene) (P3DDT) were purchased from Rieke Metals (Lincoln, NE, USA). Poly(3,3‴-didodecylquarterthiophene) (PQT-12) was purchased from Solaris Chem (Montreal, Quebec, Canada). Two lots of regio-regular P3HT with the same degree of polymerization, dispersity, and regioregularity were utilized: RMI-001E, lot# PTL 14-85 and lot# BS 23-49 (Mw=69 k, Đ=2.3, and regioregularity=96%). Lot# 14-85 was used to collect most of the data with the exception of samples analyzed with in-situ neutron scattering during ultrasound. The molecular weights and lot numbers of other conjugated polymers are summarized in Table S1 in Supporting Information. Hydrogenated solvents: chloroform (99.9%) and chlorobenzene were purchased from Fisher Scientific (Waltham, MA, USA). 1,2-dichlorobenzene (99%) were purchased from Sigma-Aldrich (St. louis, MO, USA). Deuterated solvents: d-chloroform (D, 99.8%), d5-chlorobenzene (D, 99%), d4-1,2-dichlorobenzene (D, 99%), and d5-bromobenzene (D, 99%) were purchased from Cambridge Isotope Laboratories (Cambridge, MA, USA).
Transmission Electron Microscopy
An FEI (Tecnai G2 F20, FEI company, Hillsboro, OR, USA) transmission electron microscope (TEM) was used in scanning mode to take images of conjugated polymer samples. Before analysis, solutions were diluted by 20 times (chloroform) or 40 times (dichlorobenzene) in the same solvent as that was used for sample preparation. The polymer samples were drop-cast onto a pure carbon grid (200 mesh Cu, Ted Pella Inc., Redding, CA, USA) placed on top of a filter paper and dried for at least a day in air.
UV-Vis spectroscopy
A Thermo (Evolution 300, Thermo Fisher Scientific Inc., Waltham, MA, USA) UV-Vis spectrometer was utilized to measure the absorbance spectra of polymer solutions between wavelength of 350 and 700 nm. A glass cuvette with a pathlength of 1 cm was used. After treatment with ultrasound, samples were diluted by ~ 500 times to measure time-dependent absorbance after aging over several days. The spectrum of reference samples that were not exposed to ultrasound were also recorded over the same aging time for comparison. All the spectra were normalized by concentration. The concentration was determined by using the absorption peak of the same polymer solution sample after re-heating and fully re-dissolving it.
Small angle neutron scattering (SANS)
Small angle neutron scattering (SANS) experiment were conducted at NIST center for Neutron Research (NCNR) on NGB 30. Three standard detector positions were used to cover a q-range of 0.003 Å−1 < q < 0.45 Å−1. Part of the scattering data was also collected in the GP-SANS instrument at Oak Ridge national laboratories with a configuration achieving a similar q-range. Standard sample cells with quartz windows and a 1 mm pathlength were used for samples that were insonated outside of the neutron beam in Branson (3510, 40 kHz, 160 W, Danbury, CT, USA) sonication bath. The SANS data was reduced by using standard Igor reduction protocols, 37 and SASView software was used to fit to appropriate models.38
Ultra-small angle x-ray scattering (USAXS)
Ultra-small angle x-ray scattering (USAXS) experiments were conducted at sector 9-ID-C beamline in Advanced Photon Source (APS) of Argonne National Laboratory.39 Standard configuration was used to cover the range of 0.0001 Å−1 < q < 0.3 Å−1. The energy of x-ray beam was 21 keV (λ=0.5904 Å). In-situ acoustic sample environment that allows in-situ scattering experiment under ultrasound is mounted along the beam path. The detailed description of the customized sample environment is described in the ultrasound insonation section below. The raw USAXS data was collected with Bonse-Hart camera and the Irena macro based on Igor Pro package was used to reduce the USAXS data. 40
Ultrasound Insonation
Polymers were fully dissolved in good solvents at elevated temperatures (~ 60 °C for chloroform samples and above 80 °C for those in 1,2-dichlorobenzne) until a homogeneous orange solution was formed. The solutions were then allowed to cool down to room temperature before use. These solutions were then used in sequential characterization with either ex-situ or in-situ application of ultrasound.
For ex-situ experiment using a sonication bath, fully dissolved samples were then divided to explore different ultrasound conditions. This reduces any error that may be introduced by variations in concentration during preparations of different batches. Moreover, it ensures that aging conditions (i.e. time and temperature) for ultrasound treated and reference samples (i.e. without sonication) are the same. Data for samples in a sonication bath were collected with a Branson 5000 (40 kHz, 160W, Danbury, CT, USA) sonication bath.
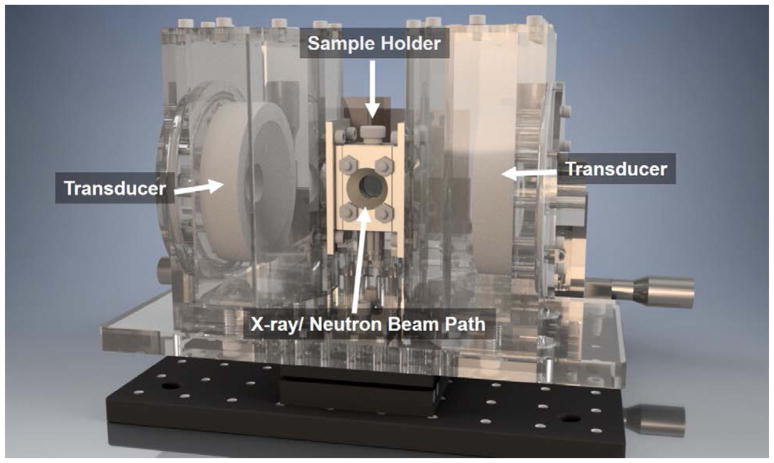
For in-situ experiments, the polymer solutions were injected into a customized sample environment that allows simultaneous application of High Intensity Focused Ultrasound (HIFU). The acoustic sample environment consisted of a central sample holder, two coaxially aligned transmitting focused transducers, and one broadband receiving transducer (Figure 2). Windows were formed from 100 μm thick Kapton films for both acoustic and neutron beam transmission.
Figure 2.
In-situ acoustic sample environment for simultaneous scattering measurement.
Two 1.24 MHz spherically focused transducers (H-102, 68 mm diameter, 63 mm focal length, f-number 0.95, Sonic-Concepts Inc., Bothell, WA, USA) coaxially aligned to the left and right of the sample environment were used to sonicate the sample under highly controlled fields in the absence of large reflections. The transducers, which were held in a degassed water chamber that was used as a coupling medium, were able to transmit up to 7.2 MPa of peak negative acoustic pressure. The transducer chambers were designed with angled walls to minimize shadowing of the scattered neutron beam while also accommodating the focusing beam geometry of the transducers. The transducer chamber dimensions ensured that the acoustic beam focus was within the sample holder. The bottom of the sample holder held a custom wide-band polyvinylidene difluoride (PVDF) transducer (28 μm thick) with a nearly constant bandwidth sensitivity at frequencies up to 40 MHz. Medical ultrasound gel was used to facilitate acoustic contact between all transducers and the sample environment.
During SANS, the scattering volume was defined by cadmium slits to form a 1 mm by 8 mm rectangle that matched the focal volume of the HIFU transducers. For USAXS, slits were not necessary because the beam size (<1 mm) was smaller than the ultrasound focal volume. The ultrasound focal volume was approximately 1.6 mm in the radial direction and 13.2 mm in the axial direction. The beam profiles of the ultrasound transducers were obtained using a needle hydrophone (HNC-1000, Onda Corp., Sunnvale, CA, USA) while the pressure output was calibrated using a fiber optic hydrophone (FOPH 2000, RPI Acoustics, Germany).
A laptop was used to control and acquire acoustic data from the acoustic sample environment using MATLAB (Mathworks Inc., Watham, MA, USA). The transducers were driven using short N-cycle sine-wave bursts generated from a two-channel arbitrary waveform generator (4154, BK Precision) amplified by 55 dB through a power RF amplifier (A150, ENI). The transducers were activated in an alternating configuration using a custom relay circuit, to avoid sonophoresis from a single transducer (i.e. sample depletion from acoustic radiation force) or sample enrichment at acoustic standing wave antinodes (i.e. during simultaneous transducer activation). The acoustic pressure amplitude, pulse duration, pulse repetition frequency, and transducer switching frequency could be controlled using the laptop through the arbitrary function generator. In general, the acoustic sample environment was driven using peak negative pressure amplitudes ranging from 0 to 7.2 MPa, a pulse duration of 40 cycles (32.3 μs pulse length), pulse repetition frequency of 6.2 KHz, and switching between each transducer at a rate of 1 Hz. The scattered acoustic data received from the PVDF transducer, which was used for cavitation detection, was preconditioned using a preamplifier (Precision Acoustics, Dorchester, UK). The cavitation signal was a differential ultrasound signal obtained by comparing the received signal to a background measurement. A 40 μs window starting from 43 μs after the transducer was fired, which was the one-way time of flight from transducer face to its focal point, was used for cavitation analysis. When the acoustic signal captured by the PVDF transducer was above a threshold value (in this study it is 9 times above the background noise), this was categorized as a cavitation event. The cavitation probability was then simply calculated from the total number of cavitation events that were generated from a given number of incident ultrasound pulses. This value is dependent on the solvent (lower boiling point solvents cavitate more readily) and also on the properties of the acoustic pulse (e.g. pressure, frequency). The acoustic waveforms were collected by a digital oscilloscope (2190D, BK Precision) and stored on a laptop for cavitation analysis. All acoustic data was time-stamped for possible co-registration with changes observed in scattering profiles.
Since ultrasound introduces energy into the system, the temperature of samples could also change depending on the ultrasound conditions and history. To control this, all experiments were conducted at room temperature and the duty cycle (on/off ratio) of the incident ultrasound was controlled to allow for heat dissipation to keep the temperature nearly constant. For samples sonicated in a water bath, the change in temperature is negligible due to the high heat capacity of water and the large volume of the bath. Increases in temperature of up to ~ 20 °C were observed towards the end of long experiments performed with the in-situ sample environment, which does not currently have active cooling capabilities, but these effects were minimized by controlling the duty cycle. Work is currently in progress to implement active cooling and temperature control schemes into the sample environment for future experiments.
Results
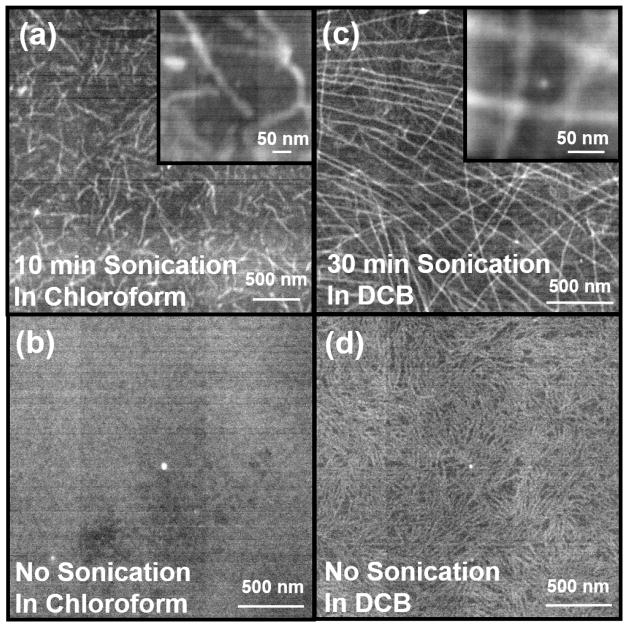
Scanning transmission electron microscopy (sTEM) was used to directly visualize the structural change induced by acoustic wave after 1 day of aging time in Figure 3. Regio-regular poly (3-hexylthiophene) (RR-P3HT) was fully dissolved in commonly used good solvents: chloroform (CF) (Figure 3(a) and (b)), and 1,2-dichlorobenzene (DCB) (Figure 3(c) and (d)). Acoustic insonation was then applied by placing the polymer solution vials in a commercial sonication bath for 10 min for the sample in CF (Figure 3(a)) and 30 min for that in DCB (Figure 3(c)). Fibers are formed in both solutions after sonication. It is interesting to note that the sample prepared in CF (Figure 3(a)) showed relatively short fibril lengths (< 1 μm), whereas DCB produces fibers that are tens of micrometers long (Figure 3(c)). The inset images are taken with higher magnification and the width of the nanofibers cross-sections are ~30 nm. In contrast, the sample without sonication does not show fiber formation (Figure 3(b)) in CF. In DCB, very different fibril structures with low contrast are observed for samples without ultrasound irradiation (Figure 3(d)), which also appears faintly in the background of the sonicated samples (Figure 3(c)). This effect could originate be from the slow drying process of DCB that is used for sample preparation. sTEM provides representative information on the nanofiber’s shape. However, due to the limit in sTEM sample preparation procedure, it cannot determine the overall fraction of fibers formed in the polymer solution. Also, it could be possible that drying, which is required for sTEM, could also induce supersaturation and crystallization. Therefore, in-situ techniques that can directly characterize the fiber formation processes in solution would be highly complementary to sTEM.
Figure 3.
sTEM images of RR-P3HT samples with acoustic waves applied in the following conditions: 4 mg/ml in CF (a) sonicated for 10 min and (b) without sonication. 10 mg/ml in DCB (c) sonicated for 30 min and (d) without sonication. The inset figures are the same sample with higher magnification.
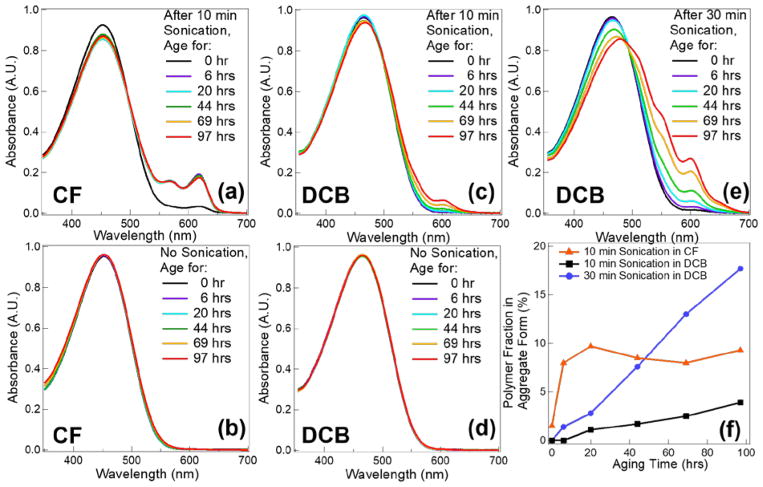
UV-vis spectroscopy was used to quantify the amount of RR-P3HT aggregates in solutions based on distinct absorption peaks of crystalline structures due to various vibrational states.41 Visually, solutions of fully dissolved polymers show a transparent orange color. In contrast, the formation of even small numbers of aggregates results in a very dark solution. Figure S1 in the Supporting Information shows an example of ultrasound induced color change of RR-P3HT solutions. Spectra are recorded in Figure 4 as a function of aging time after sonication of polymer solutions in both CF and DCB. In Figure 4(a), two new peaks at 566 and 618 nm start to emerge right after sonication in chloroform, which indicates formation of aggregates. The intensity of the two absorption peaks keeps increasing and they stay relatively constant after 6 hrs of aging. In contrast, the reference sample without acoustic treatment does not show aggregate formation even after 97 hrs of aging (Figure 4(b)). By switching solvent to DCB (Figure 4(c)), 10 min insonation does not result in any instantly observable change to the spectrum. Longer sonication time (30 min) induces a small peak at 607 nm for the initial spectrum after sonication (Figure 4(e)). Compared to CF, more absorption peaks emerge and more dramatic shifts in absorption peak positions are observed in DCB. Three distinct peaks at 512, 552, and 600 nm develop during this process. The major absorption peak also shows a red shift from 465 nm in the original spectra to 479 nm after 97 hrs of aging. Similar to samples in CF, RR-P3HT in DCB without ultrasound treatment does not exhibit any optical change due to aging (Figure 4(d)). Amorphous and aggregated peak absorption areas are used to convert the absorption spectrum to polymer aggregates fractions by considering the differences in extinction coefficient of fully dissolved polymers in those two forms. 41,42 The spectra after subtraction of the dissolved polymer fraction are shown in Figure S2 in the Supporting Information, where the peaks of lowest energy 0-0 transition (A0-0) and 0-1 first vibronic absorption transition (A0-1) are labeled. The relative strength of A0-0 and A0-1 can be used to determine the type of aggregates. 41,43 It is interesting to note that polymers form J-like aggregates (A0-0/A0-1 > 1) in CF, whereas H-like aggregates (A0-0/A0-1 < 1) are produced in DCB. This implies that intrachain coupling is stronger in CF and interchain coupling signal dominates in DCB. The aggregate fraction is plotted as a function of aging time in Figure 4(f). It is clear that the polymer fraction that forms aggregates quickly reaches steady-state at 9% in CF. In contrast, no sign of the stabilization of aggregate concentrations is observed for DCB even after 97 hrs in solution. The fraction of polymer chains in aggregates can be as high as ~ 17% with 30 min sonication time after 97 hrs of aging in DCB. Longer sonication times also results in sharper increases of the polymer fiber fraction.
Figure 4.
Evolution of UV-vis spectra of P3HT aging time with and without 10 min sonication in (a), (b) chloroform and in (c), (d) 1,2-dichlorobenzene, respectively. (e) shows the spectra of a sample under 30 min sonication time in 1,2-dichlorobenzene with various aging times. The corresponding aggregate fraction in different solvents under various sonication conditions is plotted in (f) as a function of aging time.
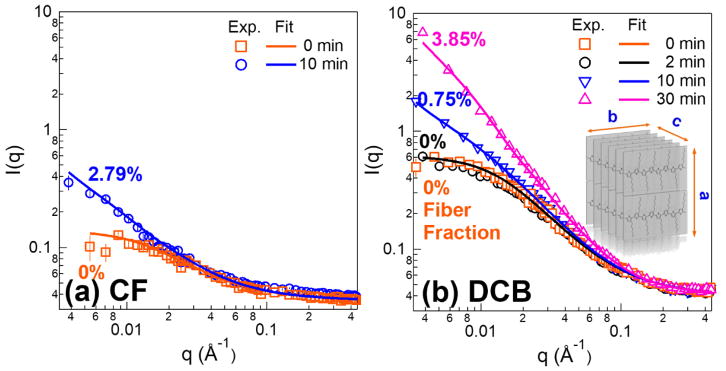
In addition to UV-vis measurements, small angle neutron scattering (SANS) was carried out to quantitatively analyze fiber formation in solution. Moreover, this is a sensitive technique that probes the system over multi-length scales and can provide information on the cross-sectional dimensions of these polymer fibers. It is important to note that fiber fractions from SANS resolves RR-P3HT portions in fibril form, whereas UV-vis probes total aggregate fraction that may or may not incorporate into fibers. Figure 5 shows the SANS profiles of RR-P3HT solution with various sonication times in both CF and DCB after approximately 1 day of aging. After ex-situ acoustic field irradiation, an increase in intensity at low-q range is observed in both solvents after sonication. In contrast, reference samples without ultrasonic treatment do not show fiber formation. The lack of assembly is also observed in the sTEM images shown in Figure 3. Also, the longer the insonation time, the more significant the enhancement of the SANS intensity (Figure 5(b)). A combined model, equation S1 in Supporting Information, is utilized to fit the scattering profiles to extrapolate the fiber fractions and cross-sectional dimensions. This model was successfully demonstrated by our group for nanofiber system containing dissolved polymers.26,27,44–46 Excluded volume effects (PPExV (q)) are considered when describing the dissolved polymers. 47,48 Meanwhile, the nanofibers are modeled by a long parallelepiped form factor with a rectangular cross-section (PPP(q)). 49,50 The details of the model and the corresponding equations are shown in the Supporting Information.
Figure 5.
Small angle neutron scattering profiles of (a) 4 mg/ml P3HT in Chloroform with 0 and 10 min sonication durations (b) 10 mg/ml RR-P3HT in 1,2-dichlorobenzene after sonicating for 0, 2, 10, and 30 min. The markers represent the experimental data and lines are the fittings based on combined model of parallelepiped and dissolved polymer model with excluded volume effect.
A schematic representation of the cross-sectional height (a), width (b), and fiber length (c) is illustrated in the inset schematic drawing of figure 5(b). Both a and b are left as fitting variables while c is fixed at 1 μm, since it is outside of the q-range SANS is probing and cannot be determined accurately. However, this length can be justified by the fiber lengths observed from sTEM images (Figure 3). The fiber fraction for P3HT in chloroform after sonication is 2.79%, which is less than the fiber fractions obtained from UV-vis measurement (~ 9%). The difference could be due to the fact that UV-vis is probing the total number of aggregates but some of them may not be in fiber forms. For samples in DCB, the fiber percentages associated with each insonation periods are labeled in Figure 5(b). Longer exposure time to ultrasound leads to higher amounts of fiber formed. The fiber fractions after 10 min and 30 min ultrasound application time are 0.75% and 3.85%, respectively. The cross-sectional dimensions, ‘a’ and ‘b’, of the nanofibers formed in those two solvents, as extracted from SANS fits, are also listed in Table 1. The nanofiber formed in CF has a similar size to that in DCB, but may be a little thinner. The dimensions in both solutions are consistent with what is observed from sTEM images in Figure 2. They are also similar in size to P3HT fibers formed using poor solvent induced self-assembly. 26,44,46
Table 1.
The fixed parameters used in combined model. The dimensions of the parallelepiped model and polymer excluded volume model for chloroform, chlorobenzene, and 1,2-dichlorobenzene.
| Parallelepiped | Dissolved Polymer | |||
|---|---|---|---|---|
|
| ||||
| Solvents | a (nm) | b (nm) | Porod Exponent | Rg (nm) |
| CF | 1.4 | 38.0 | 1.37 | 9.1 |
| DCB | 2.7 | 38.4 | 1.55 | 9.7 |
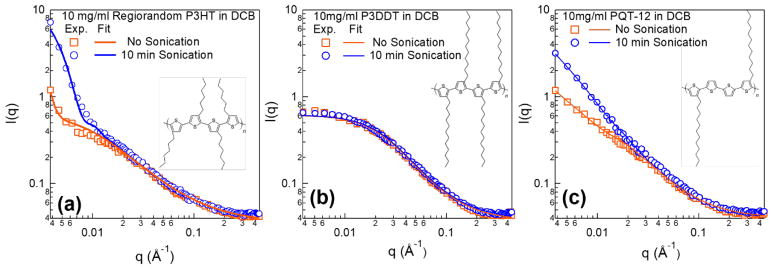
Acoustic fields can also affect the assembly of other conjugated polymers with different molecular structures. Side chain engineering is an important strategy in conjugated polymers to tune their solubility in solutions and molecular packing in films, which plays a critical role in affecting charge transport. It is also found that the final assembly structure is strongly dependent on side-chain arrangements. To gain insights into this, three polymers with variable regio-regularity, side chain length, and alkyl chain to thiophene ratio are chosen: regio-random P3HT (RRa-P3HT), P3DDT, and PQT-12. The molecular structures are depicted in the inset images in Figure 6. All the three polymers were dissolved in DCB at the same concentration (10 mg/ml). The samples are either not treated or exposed to 10 min ultrasound irradiation in the sonication bath.
Figure 6.
SANS profiles for 10 mg/ml (a) RRa P3HT, (b) P3DDT and (c) PQT-12 in 1,2-dichlorobenzene without and with 10 min sonication. The inset schematics show the molecular structure of each polymer. The models used for fitting the experimental data are the sphere model 51 combined with dissolved polymer with excluded volume for RRa P3HT and also a combined model of parallelepipeds 49,50 with dissolved polymer with excluded volume for PQT-12. The scattering profile of P3DDT is fit with just the dissolved polymer model with excluded volume. 47,48
The steep slope of the SANS profile in the low-q region of RRa P3HT in Figure 6(a) indicates the formation of large aggregates after the dissolution of the polymer. sTEM images in the Supporting Information Figure S3 also clearly show spherical clusters with sizes of several hundred nanometers are formed. A combined model of spheres, 51 describing the aggregates, and dissolved polymer was used to quantify the polymer fractions in aggregated form. The details of the model can also be found in the Supporting Information. The model fitting was performed by varying the radius of the sphere and the fraction of the polymers that form the spherical structures, while fixing the total concentration of polymers. The results are tabulated in Table 2. Based on the fits, sonication can break these clusters down to smaller sizes from 441 nm to 57 nm while, at the same time, a little over six times more polymer chains are assembled into these aggregated clusters of RRa polymer. It is worth mentioning that a small fraction of the RRa P3HT polymers form aggregates in solution even before sonication. Considering that the fit has an estimated uncertainty of ± 0.01%, this value is still much smaller than the aggregated polymer fraction that results after ultrasound.
Table 2.
The radius and fraction of spheres extrapolated from the scattering profile of regio-random P3HT by fitting into a combined model.
| r (nm) | Polymer fraction in aggregate form (%) | |
|---|---|---|
| No Sonication | 440.7 | 0.02 |
| 10 min Sonication | 57.4 | 0.13 |
In comparison, by increasing the side chain length from 6 carbons to 12 carbons (P3DDT), the scattering profile remains unchanged after sonication (Figure 6(b)). This suggests that P3DDT may be closer to a thermodynamically stable solution in these solvents due to a higher solubility imposed by the longer chains. A simple model of dissolved polymer with excluded volume is used to fit this data. The radius of gyration (Rg) is found to be 5.8 nm with Porod exponent being 1.8.
In contrast, SANS profiles of PQT-12, which has the same side chain length as P3DDT but half the number of side chains per chain length, shows significant ultrasound effects (Figure 6(c)). Interestingly, sonication changes the scattering profile by increasing intensity at low-q. sTEM images were also utilized to visualize the final structure formed by PQT-12 (Figure S4 in Supporting Information). Without sonication, PQT-12 itself has a strong tendency to self-assemble into complex structures. They can form short fibers that are >100 nm long, or spherulites that can be up to several micro-meters in diameter. After sonication, longer fibers are observed and the large spherulitic particles become more branched on the perimeter. To quantify the fraction and cross-sectional sizes of the fibril structure, the parallelepiped model combined with the dissolved polymer model was used once again. Since the spherulites are large in size, the SANS results in this q-range characterizes both the free-standing fibers and also the fibril shapes grouped radially within the spherulites. The fiber cross-sectional dimensions are similar in size, but the polymer fraction in fiber form is enhanced by about one order of magnitude from 0.03% to 0.3% after sonication. The fitting results are summarized in Table 3.
Table 3.
The cross-sectional sizes and polymer fractions in fiber form extrapolated from the scattering profile for 10 mg/ml PQT-12 in dichlorobenzene with and without sonication.
| Parallelepiped | Dissolved Polymer | ||||
|---|---|---|---|---|---|
|
| |||||
| a (nm) | b (nm) | Polymer fraction in fiber form (%) | Porod Exponent | Rg (nm) | |
| No Sonication | 44.7 | 44.7 | 0.03 | 1.55 | 8.4 |
| 10 min Sonication | 14.8 | 49.3 | 0.3 | ||
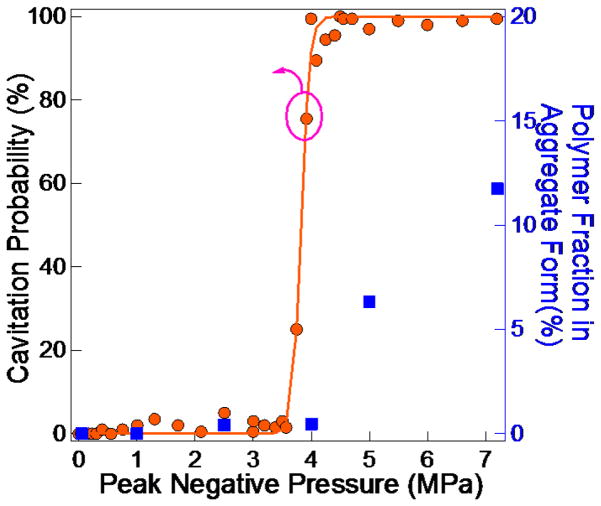
Well-characterized focused acoustic field experiments were also used to quantitatively draw mechanistic information. Typically, acoustic wave fields in laboratory sonication baths are chaotic and complex. This means that acoustic pressure distributions vary from place to place and may also change as a function of time. Moreover, sonication baths only operate at low frequencies (20–40 kHz) where cavitation is always present and also have poor power level control to sweep over acoustic pressures. In order to better control the incident acoustic field that is applied to the polymer solution, spherically focused transducers were utilized to systematically vary the applied acoustic pressures at the focal point and to reduce the influence of acoustic reflections. Samples in this setup were also characterized during ultrasound application to more effectively correlate the process of fiber formation to the acoustic field. Since polymer solutions in chloroform show instantaneous color change right after ultrasound application (Figure 4), UV-vis measurement was also used to calculate the aggregate fraction. The normalized UV-vis spectra are plotted in Figure S5 in the Supporting Information. The cavitation probability, which is defined as the probability of detecting a cavitation event from each acoustic pulse, for pure chloroform is shown in Figure 7 as a function of peak negative pressure. The threshold pressure for cavitation is at ~ 4 MPa, above which the cavitation dominates. Below this pressure, the sample is still exposed to the acoustic field and its effects, but not to the violent temperature and flow fluctuations that are induced by bubble cavitation.
Figure 7.
Cavitation probability curve of pure chloroform and aggregate percentage of 4 mg/ml P3HT in chloroform calculated from UV-vis measurements right after ultrasound application as a function of peak negative pressure.
Results (Figure 7) show that the cavitation pressure is closely related to the onset for fiber formation, below which the polymers stay fully dissolved. When the system is exposed to a pressure above threshold, the longer the irradiation time, the higher the amount of fibers formed. Figure S6 in the Supporting Information shows a series of UV-vis spectra collected under 7.2 MPa over different ultrasound durations. This shows that ~100 s of insonation is enough to induce fiber formation. On the other hand, 1500 s of sonication more than doubled the amount of fibers compared to that obtained with just 100 s. In contrast, if the peak negative pressure is below the threshold, 3 MPa for example, even four times longer ultrasound application time (6000 s) is not enough to result in any observable optical change (Figure S7 in the Supporting Information).
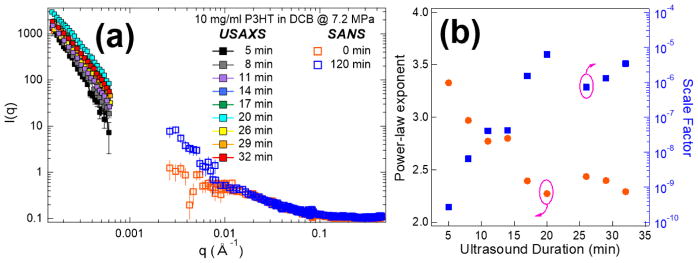
Compared to solutions in chloroform, the optical change right after ultrasound application in DCB is not as obvious (Figure 4). In order to probe the instantaneous structural change under ultrasound, a new sample environment was built to allow for in-situ characterization using scattering techniques (i.e. SANS, SAXS, USAXS). Figure 2 shows a schematic view of the setup. The sample holder is sandwiched between two identical transducers that operate alternatively to prevent accumulation of materials on either side of the container via sonophoresis. Thin Kapton films are used as front and back windows of the sample cell to provide transparent pathways for the x-ray or neutron beam. Figure 8(a) shows scattering profiles obtained from a combination of USAXS and SANS of RR-P3HT in DCB during sonication. Similar to ex-situ SANS results for samples exposed to ultrasound in a sonication bath (Figure 5), an increase in intensity is observed at the low-q range (< 0.01 Å−1) of the data after exposure to acoustic waves at 7.2 MPa, demonstrating the formation of fiber structures. USAXS allows probing of a much lower q-range (0.0001 Å−1 < q < 0.001 Å−1) and it was used to track simultaneous structural changes for polymer solution sunder ultrasound as a function of insonation time. Figure 8(a) shows a substantial increase of USAXS (i.e. low q) intensity after just 5 min of ultrasound application. The extension in sonication time lead to increased scattering intensities and decreased slopes. A power law model (Eq-1) is used to fit the USAXS data from 0.00014 to 0.0006 Å−1, where both the scale factor (B) and power-law exponents (A) are left as variables for fitting.
Figure 8.
(a) In-situ characterization of assembled structures in DCB under ultrasound using USAXS and SANS for different q-ranges. The legend indicates the integrated sonication time corresponding to each scattering profile. (b) The power-law exponents and scale factors extrapolated by power law fitting as a function of ultrasound application time.
| Eq-1 |
Figure 8(b) shows the fit results corresponding to both of the parameters in Eq-1 as a function of sonication time. The power-law exponent starts at ~3.3 and steadily decreased to ~2.3 at 17 min. It then plateaus with increased sonication time. The scale factor (B) is proportional to the fiber volume and the total amount of polymer that is forming assembled structures. This parameter increases and reaches steady state at the same time as the power-law exponents plateau. By fitting the SANS data at low-q range (0.003 to 0.01 Å−1), a similar power-law exponent (2.39) and scale factor (6.96×10⁻⁶) as in the USAXS data are obtained showing consistency in the results. All fit results are plotted with the corresponding scattering profile in Figure S9 in the Supporting Information.
Consistent with what is observed in P3HT samples in DCB that are insonated with sonication baths, no optical shift was observed when aging for a short time (10 hrs) (Figure S10(a) in Supporting Information), in spite of the obvious changes in the scattering profiles. After an extended time aging (108 days), crystallization is observed for polymer solutions with and without ultrasound treatment based on new absorption peak formation of UV-vis spectra (Figure S10(b) in Supporting Information). sTEM images also confirm that nanofibers are formed in both samples that were aged for 108 days. However, without ultrasound treatment the fibers are thick and short (typically under 500 nm) while nanofibers formed on sonicated samples are several micro-meters long.
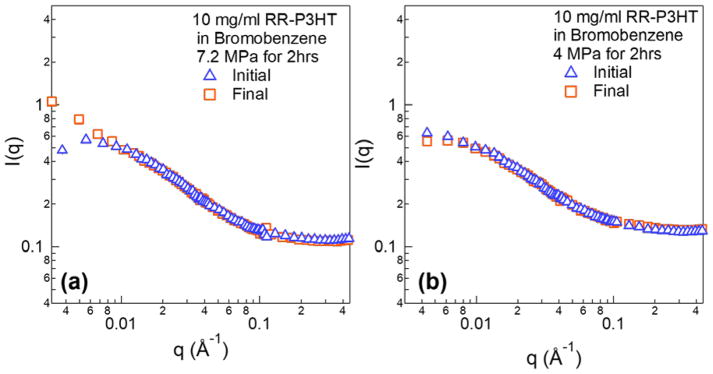
A question still remains as to whether ultrasound can provide enough energy to induce crystallization for samples dissolved in even better solvents. To do this we used bromobenzene, which is a much better solvent for P3HT. Bromobenzene has more than five times higher solubility than DCB and to the best of our knowledge is currently the best known solvent for P3HT. 52 In addition, deuterated bromobenzene also provides good neutron scattering contrast for P3HT. The polymer concentration and insonation time are kept the same as samples in DCB. Figure 9(a) shows SANS profiles of RR-P3HT in bromobenzene before and after ultrasound of 7.2 MPa treated for 2 hrs. Ultrasound induced an increase in scattering profile in low-q range, indicating the formation of large structures. In contrast, a lower peak negative pressure of 4 MPa, Figure 9(b), does not show any detectable change by SANS.
Figure 9.
(a) SANS profiles of 10 mg/ml RR-P3HT in bromobenzene before and right after application of 7.2 MPa ultrasound for 2 hrs. (b) The same concentration of polymer solution before and right after application of 4 MPa ultrasound for 2 hrs.
Discussion
Figure 10 summarizes the proposed mechanism of nanofiber formation resulting from cavitation events based on homogeneous nucleation. Polymers are in a coil conformation after they are fully dissolved at higher temperatures. 53,54 When the applied acoustic wave exceeds the cavitation threshold pressure for the solvent, bubbles form. Due to rectified diffusion into and out of the bubbles, ultrasound oscillation favors bubble growth until the bubbles grow large enough to resonate with the field and collapse under the positive pressure phase of acoustic waves.29 The large pressures generated during the bubble collapse process alters the polymer chains to induce a more planar configuration that is more favorable for π-π stacking. This is evidenced by the UV-vis data in Figure 4(a) that improved intrachain coupling is observed right after sonication in CF. It is possible that strong shear fields, which are produced by ultrasound induced cavitation, are able to stretch the chains allowing them to form extended conformations. If two extended polymers get close to each other, they could form larger structures that serve as nucleation sites for further crystallization into nanofibers. Another possibility is that the formation of a new bubble-liquid interface may also trigger the assembly of conjugated polymer nanofibers. When cavitation is generated, polymer chains can accumulate at the interface by adsorption. Since bubbles undergo a large volume expansion, they sweep through a large region of the solvent. This increases the opportunity for polymer chains to assemble when the bubble collapses and they are brought close to each other. Unfortunately, our current data is insufficient to unequivocally determine the dominating effect.
Figure 10.
Possible mechanism of nucleation sites formation based on bubble collapse under acoustic field. Nucleation sites serve as seeds for long fiber formation.
To provide evidence of nuclei formation under ultrasound at early stages, in-situ scattering characterization experiments were performed. USAXS data in figure 8(a) shows that nucleation sites are formed after very short time of sonication (within 5 min). The high power-law exponents at the beginning of the sonication process in Figure 8(b) indicates that the initial structures are highly branched. Those fractal dimensions are typical values that are also observed in P3HT colloidal and gel system.10,44 The decrease of the power-law exponents can be attributed to the favored growth of fibril structure due to one-dimensional sonocrystallization (Figure 10) or the breakup of the large aggregates into small anisotropic fibrils. At the same time, the scale factor of the power law model increased with longer time of sonication. The scale factor is proportional to the volume fraction of fibers in solution and the increase can be explained by the integrated energy that is placed into the system by continued ultrasound insonation. An equilibrium is eventually established at around 17 min of sonication, which could be a steady-state process involving the growth of new fibers induced by ultrasound, the mechanical fracture of larger fibers and the re-dissolution of fibers through dissipated heat. In a much better solvent, such as in bromobenzene (Figure 9), the initial nucleation is also observed with ultrasound but it is not as obvious as in 1,2-dichlorobenzene. This could be due to a larger energy barrier for inducing sonocrystallization. Since bromobenzene is a better solvent, it should be easier to re-dissolve the nucleation sites and limit the equilibrium concentration of nucleation sites. During the scattering experiment, the energy input from ultrasound could also potentially raise the sample temperature and affect the crystallization. However, an increase in temperature would act in reverse to the process of assembly since it would further increase the solubility of the polymer in the solvent. Therefore, it is conclusive that the nucleation of fibers that is observed in scattering experiments originates from ultrasound induced cavitation.
In all the ‘good’ solvents that were investigated in this work, nucleation and growth of fibers still resulted from application of ultrasound. It is important to note that this suggests that none of the samples were ‘good’ solvents in a thermodynamic sense (i.e. where the solvated state is a minimum free energy configuration). Indeed, the crystalline nanofiber state represented a minimum energy configuration and the polymer samples were only kinetically stabilized (Figure 1). This argument is further supported by the formation of nanofibers from fully dissolved RR-P3HT in DCB after aging for 108 days (Figure S10 (c) in the Supporting Information). When the temperature is raised, polymers fully dissolve in a thermodynamic sense but, as the temperature is lowered to room temperature, the polymer chains are kinetically trapped in a local energy minimum and crystallization is slowed down. Ultrasound only accelerates the crystallization process by providing very high energy locally and in a short time to enable polymers to achieve other configurations.
Based on the above mechanism, ultrasound serves as the driving force for polymers to assemble into nucleation sites. At the same time, the high mechanical energy is also likely to break up larger structures (i.e. sonofragmentation). It is important to note that ultrasound does not break apart covalent bonds and cause polymer chain scission. This is proved by gel permeation chromatography (GPC) measurement that no obvious change is observed on P3HT samples before and after ultrasound application (Table S2 in the Supporting Information). The unaffected molecular weight by ultrasound is also reported by Amassian’s group. 25 For large structures, it has been demonstrated by kinetics experiment that the primary mechanism for sonofragmentation is based on shock waves. 55 The shock wave generated during cavitation collapse can break assembled nanofibers preventing them from growing too long. In systems with violent cavitation events, such as chloroform (i.e. low cavitation threshold) under high peak negative pressures, defects can be generated that are detrimental for producing high quality nanofibers. UV-vis results in chloroform show that very small amounts of fibers formed right after sonication (Figure 4) but growth continued after sonication was halted.
SANS data of RRa P3HT (Figure 6(a)) also reveals that large aggregates are broken into smaller sizes after sonication while at the same time the total fraction of polymers in aggregate form increased (Table 2). The decreased size can be attributed to sonofragmentation and the increased volume fraction of aggregates is due to sonocrystallization. For PQT-12 (Figure 6(c)), SANS also confirms that ultrasound assembles the polymer chains into fibers. On the other hand, sTEM results in Figure S4 (c) and (d) in Supporting Information suggest that smaller fibers are fragments produced by ultrasound breakup of branched spherulites. Although both processes are observed in polymer systems and caused by the ultrasound field, sonocrystallization is the desirable effect for improving charge transport by producing nanofibers for electronic applications. Thus, it is important to understand the underlying physics of both processes.
In sonocrystallization, after nucleation sites are initially formed, an aging process without any additional ultrasound produces larger fibers without an acoustic field to break the fibers (Figure 3). In chloroform, although fiber formation is observed by UV-vis right after sonication, the majority of the fibers (~ 4 times more) come from aging after cessation of ultrasound. In Figure 4(f), the quick establishment of a steady-state aggregate concentration in chloroform is due to the low cavitation threshold of the solvent (Figure S8 in Supporting Information), which results in more cavitation events and nucleation sites at a given acoustic input.
In contrast, P3HT in DCB has a higher cavitation threshold (Figure S8 in Supporting Information) and a larger energy barrier to confine polymers in the fully dissolved local minimum, creating fewer nucleation sites. Therefore, it does not form enough crystallites to cause optical shifts in UV-vis measurement right after ultrasound application without aging. This also results in a slower crystallization process, which produces longer fibers (Figure 3(c)). A longer sonication time in DCB also results in faster fiber growth because more energy input produces more crystalline nuclei. For this reason, both the UV-vis and SANS data show that longer sonication time screates more fibers (Figure 4(f) and Figure 5).
It is worth mentioning that the capability of tuning the excitonic coupling could be useful for changing the population of different spin states, thus controlling the photophysics. 41 For example, J-like aggregates have been shown to promote triplet formation that leads to stronger photoluminescence (PL) quenching as compared to H-like aggregates. 41 Not many reports exist on methods to form J-like aggregates. They are often formed in toluene and it requires polymers to have high regioregularity or low dispersity. 43,56,57 This work provides an alternative and simple method to reliably generate J-like aggregates from commercially available P3HT in chloroform. The aggregate type can also be tuned using different solvents. In Figure 4(a), polymers exhibit stronger intrachain coupling in CF (J-like aggregates), which indicates that π-π stacking is weaker than when compared to fibers formed in DCB (H-like aggregates). The stronger intrachain coupling in CF could also explain why the fiber length is shorter in CF as compared to DCB.
During the crystallization process, the interactions between polymer chains can alter the final assembled structures. This can be achieved by changing the polymer molecular structure, such as the side chains as shown in Figure 6. RRa-P3HT (Figure 6(a)) is known not to crystallize because of the steric hindrance imposed by randomly oriented side chains. Still, ultrasound promotes polymer chains to form aggregates (Table 2 and Figure S3 in Supporting Information). In contrast, RR polythiophenes with longer side-chains (i.e. 12 carbons in P3DDT) achieve a high solubility at room temperature so that ultrasound fields are unable to produce any fiber crystallization or induced-assembly. Interestingly, assembled structures can still be induced by ultrasound for PQT-12, which also has long side-chains (12 carbons) but fewer chains-per-monomer resulting in a lower solubility when compared to P3DDT. Therefore, the capacity to sonocrystallize a conjugated polymer seems to correlate best with its solubility.
Conclusions
In summary, it is demonstrated that P3HT can be assembled into nanofibers under ultrasound in solvents that are commonly believed to be ‘good’ solvents in a thermodynamic sense. Our results suggest that the dissolved state of these polymers is not a global minimum in the free-energy landscape. The formation of fiber in solution was quantified by both UV-vis and SANS measurements with consistent results. Ultrasound was determined to induce the formation of nucleation sites in the system and continued aging without acoustic insonation is crucial to achieve high fiber fractions. The molecular structure of the conjugated polymers was also found to be critical for ultrasound-directed polymer assembly. It was also shown via in-situ experiments that polymer assembly is strongly correlated to solvent cavitation. The mechanism of sonocrystallization is proposed to be based on nucleation-and-growth.
Supplementary Material
Acknowledgments
The primary funding source for this work was provided by the Department of Energy, Office of Basic Energy Sciences under award number DE-SC0010282. DSL acknowledges support from the National Institutes of Health under Grant R01HL125339. WKT and CKL also acknowledge financial support from NSF DMR-1708317. We thank the support from the National Institute of Standards and Technology, U.S. Department of Commerce, for providing facilities for neutron research. A portion of this work also utilized resources at the High Flux Isotope Reactor, a DOE office of Science User Facility operated by the Oak Ridge National Laboratory. The USAXS experiment was with the support from Advanced Photon Source, a U.S. Department of Energy (DOE) Office of Science User Facility operated for the DOE Office of Science by Argonne National Laboratory under Contract No. DE-AC02-06CH11357. The authors acknowledge the help from Yi-Ting Lee in collecting USAXS data. Part of this research was also conducted at the Molecular Analysis Facility (MAF) in the Molecular Engineering & Sciences Institute, a member of Nano-technology Infrastructure Network (NNIN).
References
- 1.Cho JH, Lee J, Xia Y, Kim B, He Y, Renn MJ, Lodge TP, Daniel Frisbie C. Printable Ion-Gel Gate Dielectrics for Low-Voltage Polymer Thin-Film Transistors on Plastic. Nat Mater. 2008;7(11):900–906. doi: 10.1038/nmat2291. [DOI] [PubMed] [Google Scholar]
- 2.Wu C-H, Chueh C-C, Xi Y-Y, Zhong H-L, Gao G-P, Wang Z-H, Pozzo LD, Wen T-C, Jen AK-Y. Influence of Molecular Geometry of Perylene Diimide Dimers and Polymers on Bulk Heterojunction Morphology Toward High-Performance Nonfullerene Polymer Solar Cells. Adv Funct Mater. 2015;25(33):5326–5332. doi: 10.1002/adfm.201501971. [DOI] [Google Scholar]
- 3.Sekine C, Tsubata Y, Yamada T, Kitano M, Doi S. Recent Progress of High Performance Polymer OLED and OPV Materials for Organic Printed Electronics. Sci Technol Adv Mater. 2014;15(3):34203. doi: 10.1088/1468-6996/15/3/034203. [DOI] [PMC free article] [PubMed] [Google Scholar]
- 4.Löffler S, Libberton B, Richter-Dahlfors A. Organic Bioelectronic Tools for Biomedical Applications. Electronics. 2015;4(4):879–908. doi: 10.3390/electronics4040879. [DOI] [Google Scholar]
- 5.Oh JY, Rondeau-Gagné S, Chiu Y-C, Chortos A, Lissel F, Wang G-JN, Schroeder BC, Kurosawa T, Lopez J, Katsumata T, Xu J, Zhu C, Gu X, Bae W-G, Kim Y, Jin L, Chung JW, Tok JB-H, Bao Z. Intrinsically Stretchable and Healable Semiconducting Polymer for Organic Transistors. Nature. 2016;539(7629):411–415. doi: 10.1038/nature20102. [DOI] [PubMed] [Google Scholar]
- 6.Noriega R, Rivnay J, Vandewal K, Koch FPV, Stingelin N, Smith P, Toney MF, Salleo A. A General Relationship between Disorder, Aggregation and Charge Transport in Conjugated Polymers. Nat Mater. 2013;12(11):1038–1044. doi: 10.1038/nmat3722. [DOI] [PubMed] [Google Scholar]
- 7.Luo C, Kyaw AKK, Perez La, Patel S, Wang M, Grimm B, Bazan GC, Kramer EJ, Heeger AJ. General Strategy for Self-Assembly of Highly Oriented Nanocrystalline Semiconducting Polymers with High Mobility. Nano Lett. 2014;14(5):2764–2771. doi: 10.1021/nl500758w. [DOI] [PubMed] [Google Scholar]
- 8.Diao Y, Tee BCK, Giri G, Xu J, Kim DH, Becerril Ha, Stoltenberg RM, Lee TH, Xue G, Mannsfeld SCB, Bao Z. Solution Coating of Large-Area Organic Semiconductor Thin Films with Aligned Single-Crystalline Domains. Nat Mater. 2013;12(7):665–671. doi: 10.1038/nmat3650. [DOI] [PubMed] [Google Scholar]
- 9.Li J-H, Xi Y, Pozzo LD, Xu J-T, Luscombe CK. Macroscopically Aligned Nanowire Arrays of π-Conjugated Polymers via Shear-Enhanced Crystallization. J Mater Chem C. 2017 doi: 10.1039/C7TC01419H. [DOI] [Google Scholar]
- 10.Xi Y, Pozzo LD. Electric Field Directed Formation of Aligned Conjugated Polymer Fibers. Soft Matter. 2017;13:3894–3908. doi: 10.1039/C7SM00485K. [DOI] [PubMed] [Google Scholar]
- 11.Cheng Q, Gregan E, Byrne H. Ultrasound-Assisted SWNTs Dispersion: Effects of Sonication Parameters and Solvent Properties Ultrasound-Assisted SWNTs Dispersion: Effects of Sonication Parameters and Solvent Properties. J Phys Chem C. 2010;114(19):8821–8827. [Google Scholar]
- 12.Gaikwad SG, Pandit AB. Ultrasound Emulsification: Effect of Ultrasonic and Physicochemical Properties on Dispersed Phase Volume and Droplet Size. Ultrason Sonochem. 2008;15(4):554–563. doi: 10.1016/j.ultsonch.2007.06.011. [DOI] [PubMed] [Google Scholar]
- 13.Brown RB, Audet J. Current Techniques for Single-Cell Lysis. J R Soc Interface. 2008;5(Suppl_2):S131–S138. doi: 10.1098/rsif.2008.0009.focus. [DOI] [PMC free article] [PubMed] [Google Scholar]
- 14.Czechowska-Biskup R, Rokita B, Lotfy S, Ulanski P, Rosiak JM. Degradation of Chitosan and Starch by 360-kHz Ultrasound. Carbohydr Polym. 2005;60(2):175–184. doi: 10.1016/j.carbpol.2004.12.001. [DOI] [Google Scholar]
- 15.Rossi D, Jamshidi R, Saffari N, Kuhn S, Gavriilidis A, Mazzei L. Continuous-Flow Sonocrystallization in Droplet-Based Microfluidics. Cryst Growth Des. 2015;15(11):5519–5529. doi: 10.1021/acs.cgd.5b01153. [DOI] [Google Scholar]
- 16.Kurotani M, Hirasawa I. Polymorph Control of Sulfamerazine by Ultrasonic Irradiation. J Cryst Growth. 2008;310(21):4576–4580. doi: 10.1016/j.jcrysgro.2008.08.002. [DOI] [Google Scholar]
- 17.Ruecroft G, Hipkiss D, Ly T, Maxted N, Cains PW. Sonocrystallization:? The Use of Ultrasound for Improved Industrial Crystallization. Org Process Res Dev. 2005;9(6):923–932. doi: 10.1021/op050109x. [DOI] [Google Scholar]
- 18.Zhang CY, Wang Y, Schubert R, Liu Y, Wang MY, Chen D, Guo YZ, Dong C, Lu HM, Liu YM, Wu ZQ, Betzel C, Yin DC. Effect of Audible Sound on Protein Crystallization. Cryst Growth Des. 2016;16(2):705–713. doi: 10.1021/acs.cgd.5b01268. [DOI] [Google Scholar]
- 19.Crespo R, Martins PM, Gales L, Rocha F, Damas AM. Potential Use of Ultrasound to Promote Protein Crystallization. J Appl Crystallogr. 2010;43(6):1419–1425. doi: 10.1107/S0021889810040951. [DOI] [Google Scholar]
- 20.Kitayama H, Yoshimura Y, So M, Sakurai K, Yagi H, Goto Y. A Common Mechanism Underlying Amyloid Fibrillation and Protein Crystallization Revealed by the Effects of Ultrasonication. Biochim Biophys Acta - Proteins Proteomics. 2013;1834(12):2640–2646. doi: 10.1016/j.bbapap.2013.09.016. [DOI] [PubMed] [Google Scholar]
- 21.Lee M, Jeon H, Jang M, Yang H. A Physicochemical Approach Toward Extending Conjugation and the Ordering of Solution-Processable Semiconducting Polymers. ACS Appl Mater Interfaces. 2016;8(7):4819–4827. doi: 10.1021/acsami.5b12552. [DOI] [PubMed] [Google Scholar]
- 22.Kleinhenz N, Persson N, Xue Z, Chu PH, Wang G, Yuan Z, McBride MA, Choi D, Grover MA, Reichmanis E. Ordering of Poly(3-Hexylthiophene) in Solutions and Films: Effects of Fiber Length and Grain Boundaries on Anisotropy and Mobility. Chem Mater. 2016;28(11):3905–3913. doi: 10.1021/acs.chemmater.6b01163. [DOI] [Google Scholar]
- 23.Hu H, Zhao K, Fernandes N, Boufflet P, Bannock JH, Yu L, de Mello JC, Stingelin N, Heeney M, Giannelis EP, Amassian A. Entanglements in Marginal Solutions: A Means of Tuning Pre-Aggregation of Conjugated Polymers with Positive Implications for Charge Transport. J Mater Chem C. 2015;3(28):7394–7404. doi: 10.1039/C5TC01425E. [DOI] [Google Scholar]
- 24.Lim JA, Liu F, Ferdous S, Muthukumar M, Briseno AL. Polymer Semiconductor Crystals. Mater Today. 2010;13(5):14–24. doi: 10.1016/S1369-7021(10)70080-8. [DOI] [Google Scholar]
- 25.Zhao K, Khan HU, Li R, Su Y, Amassian A. Entanglement of Conjugated Polymer Chains Influences Molecular Self-Assembly and Carrier Transport. Adv Funct Mater. 2013;23(48):6024–6035. doi: 10.1002/adfm.201301007. [DOI] [Google Scholar]
- 26.Newbloom GM, de la Iglesia P, Pozzo LD. Controlled Gelation of poly(3-Alkylthiophene)s in Bulk and in Thin-Films Using Low Volatility Solvent/poor-Solvent Mixtures. Soft Matter. 2014;10(44):8945–8954. doi: 10.1039/c4sm00960f. [DOI] [PubMed] [Google Scholar]
- 27.Iglesia PDLa, Pozzo DC. Effects of Supersaturation on the Structure and Properties of poly(9,9-Dioctyl Fluorene) Organogels. Soft Matter. 2013;9(47):11214. doi: 10.1039/c3sm51753e. [DOI] [Google Scholar]
- 28.Leighton TG. The Acoustic Bubble. Academic Press; 1997. [Google Scholar]
- 29.Caupin F, Herbert E. Cavitation in Water: A Review. Comptes Rendus Phys. 2006;7(9–10):1000–1017. doi: 10.1016/j.crhy.2006.10.015. [DOI] [Google Scholar]
- 30.Neppiras EA. Acoustic Cavitation Series: Part One. Acoustic Cavitation: An Introduction. Ultrasonics. 2017;22(1):3894–3908. doi: 10.1016/0041-624X(84)90057-X. [DOI] [Google Scholar]
- 31.Ahmadi F, McLoughlin IV, Chauhan S, Ter-Haar G. Bio-Effects and Safety of Low Intensity, Low Frequency Ultrasonic Exposure. Prog Biophys Mol Biol. 2012 doi: 10.1016/j.pbiomolbio.2012.01.004. [DOI] [PubMed] [Google Scholar]
- 32.Sponer J. Dependence of the Cavitation Threshold on the Ultrasonic Frequency. Czechoslov J Phys. 1990;40(10):1123–1132. doi: 10.1007/BF01597973. [DOI] [Google Scholar]
- 33.Dear JP, Field JE. A Study of the Collapse of Arrays of Cavities. J Fluid Mech. 1988;190(1):409. doi: 10.1017/S0022112088001387. [DOI] [Google Scholar]
- 34.Tomita Y, Shima A. Mechanisms of Impulsive Pressure Generation and Damage Pit Formation by Bubble Collapse. J Fluid Mech. 1986;169(1):535. doi: 10.1017/S0022112086000745. [DOI] [Google Scholar]
- 35.Suslick KS, Didenko Y, Fang MM, Hyeon T, Kolbeck KJ, McNamara WB, III, Mdleleni MM, Wong M. Acoustic Cavitation and Its Consequences. Philos Trans R Soc A. 1999;357(1927):335–353. doi: 10.1098/rsta.1999.0330. [DOI] [Google Scholar]
- 36.Ruecroft G, et al. Sonocrystallization: The Use of Ultrasound for Improved Industrial Crystallization. Org Proc Res Dev. 2005;9(6):923–932. [Google Scholar]
- 37.Kline SR. Reduction and Analysis of SANS and USANS Data Using IGOR Pro. J Appl Crystallogr. 2006;39(6):895–900. doi: 10.1107/S0021889806035059. [DOI] [Google Scholar]
- 38.Butler P, Alina G, Hernandez RC, Doucet M, Jackson A, Kienzle P, SK, JZ SASView for Small Angle Scattering Analysis. http://www.sasview.org/
- 39.Ilavsky J, Jemian PR, Allen AJ, Zhang F, Levine LE, Long GG. Ultra-Small-Angle X-Ray Scattering at the Advanced Photon Source. J Appl Crystallogr. 2009;42(3):469–479. doi: 10.1107/S0021889809008802. [DOI] [Google Scholar]
- 40.Ilavsky J, Jemian PR. Irena: Tool Suite for Modeling and Analysis of Small-Angle Scattering. J Appl Crystallogr. 2009;42(2):347–353. doi: 10.1107/S0021889809002222. [DOI] [Google Scholar]
- 41.Clark J, Chang JF, Spano FC, Friend RH, Silva C. Determining Exciton Bandwidth and Film Microstructure in Polythiophene Films Using Linear Absorption Spectroscopy. Appl Phys Lett. 2009;94(16):2007–2010. doi: 10.1063/1.3110904. [DOI] [Google Scholar]
- 42.Scharsich C, Lohwasser RH, Sommer M, Asawapirom U, Scherf U, Thelakkat M, Neher D, Köhler A. Control of Aggregate Formation in poly(3-Hexylthiophene) by Solvent, Molecular Weight, and Synthetic Method. J Polym Sci Part B Polym Phys. 2012;50(6):442–453. doi: 10.1002/polb.23022. [DOI] [Google Scholar]
- 43.Mazzio KA, Rice AH, Durban MM, Luscombe CK. Effect of Regioregularity on Charge Transport and Structural and Excitonic Coherence in Poly(3-Hexylthiophene) Nanowires. J Phys Chem C. 2015;119(27):14911–14918. doi: 10.1021/acs.jpcc.5b02914. [DOI] [Google Scholar]
- 44.Newbloom GM, Kim FS, Jenekhe Sa, Pozzo DC. Mesoscale Morphology and Charge Transport in Colloidal Networks of poly(3-Hexylthiophene) Macromolecules. 2011;44(10):3801–3809. doi: 10.1021/ma2000515. [DOI] [Google Scholar]
- 45.Newbloom GM, Weigandt KM, Pozzo DC. Electrical, Mechanical, and Structural Characterization of Self-Assembly in poly(3-Hexylthiophene) Organogel Networks. Macromolecules. 2012;45:3452–3462. doi: 10.1021/ma202564k. [DOI] [Google Scholar]
- 46.Newbloom GM, Weigandt KM, Pozzo DC. Structure and Property Development of poly(3-Hexylthiophene) Organogels Probed with Combined Rheology, Conductivity and Small Angle Neutron Scattering. Soft Matter. 2012;8(34):8854. doi: 10.1039/c2sm26114f. [DOI] [Google Scholar]
- 47.Hammouda B. SANS from Homogeneous Polymer Mixtures - A Unified Overview. Adv Polym Sci. 1993;106:87–133. [Google Scholar]
- 48.Benoit H. La Diffusion de La Lumiere Par Des Macromolecules En Chaines En Solution Dans Un Bon Solvant. Comptes Rendus. 1957;245:2244–2247. [Google Scholar]
- 49.Roman Nayuk KH. Form factors of Hollow and Massive Rectangular Parallelepipeds at Variable Degree of Anisometry. Zeitschrift für Phys Chemie. 2012;226:837–854. [Google Scholar]
- 50.Mittelbach PGP. X-Ray Low-Angle Scattering by Dilute Scattering Colloidal Systems. The Calculation of Scattering Curves of Parallelepipeds. Acta Phys Austriaca. 1961;14:185–211. [Google Scholar]
- 51.Guinier AGF. Small-Angle Scattering of X-Rays. John Wiley & Sons, Inc; 1955. [Google Scholar]
- 52.Machui F, Langner S, Zhu X, Abbott S, Brabec CJ. Determination of the P3HT:PCBM Solubility Parameters via a Binary Solvent Gradient Method: Impact of Solubility on the Photovoltaic Performance. Sol Energy Mater Sol Cells. 2012;100:138–146. doi: 10.1016/j.solmat.2012.01.005. [DOI] [Google Scholar]
- 53.Newbloom GM, Hoffmann SM, West AF, Gile MC, Sista P, Cheung HC, Luscombe CK, Pfaendtner J, Pozzo LD. Solvatochromism and Conformational Changes in Fully Dissolved Poly(3-Alkylthiophene)s. Langmuir. 2015;31(1):458–468. doi: 10.1021/la503666x. [DOI] [PubMed] [Google Scholar]
- 54.McCulloch B, Ho V, Hoarfrost M, Stanley C, Do C, Heller WT, Segalman RA. Polymer Chain Shape of poly(3-Alkylthiophenes) in Solution Using Small-Angle Neutron Scattering. Macromolecules. 2013;46(5):1899–1907. doi: 10.1021/ma302463d. [DOI] [Google Scholar]
- 55.Zeiger B, Suslick K. Sonofragmentation of Molecular Crystals: Observations and Modeling. Proc Meet Acoust. 2013;19:45089. doi: 10.1121/1.4800930. [DOI] [Google Scholar]
- 56.Thomas AK, Garcia JA, Ulibarri-Sanchez J, Gao J, Grey JK. High Intrachain Order Promotes Triplet Formation from Recombination of Long-Lived Polarons in poly(3-Hexylthiophene) J-Aggregate Nanofibers. ACS Nano. 2014;8(10):10559–10568. doi: 10.1021/nn5040026. [DOI] [PubMed] [Google Scholar]
- 57.Niles ET, Roehling JD, Yamagata H, Wise AJ, Spano FC, Moulé AJ, Grey JK. J-Aggregate Behavior in Poly-3-Hexylthiophene Nanofibers. J Phys Chem Lett. 2012;3(2):259–263. doi: 10.1021/jz201509h. [DOI] [Google Scholar]
Associated Data
This section collects any data citations, data availability statements, or supplementary materials included in this article.


