

Abstract
Background
Ischemia–reperfusion injury following ST‐segment–elevation myocardial infarction (STEMI) is a leading determinant of clinical outcome. In experimental models of myocardial ischemia, succinate accumulation leading to mitochondrial dysfunction is a major cause of ischemia–reperfusion injury; however, the potential importance and specificity of myocardial succinate accumulation in human STEMI is unknown. We sought to identify the metabolites released from the heart in patients undergoing primary percutaneous coronary intervention for emergency treatment of STEMI.
Methods and Results
Blood samples were obtained from the coronary artery, coronary sinus, and peripheral vein in patients undergoing primary percutaneous coronary intervention for acute STEMI and in control patients undergoing nonemergency coronary angiography or percutaneous coronary intervention for stable angina or non‐STEMI. Plasma metabolites were analyzed by targeted liquid chromatography and mass spectrometry. Metabolite levels for coronary artery, coronary sinus, and peripheral vein were compared to derive cardiac and systemic release ratios. In STEMI patients, cardiac magnetic resonance imaging was performed 2 days and 6 months after primary percutaneous coronary intervention to quantify acute myocardial edema and final infarct size, respectively. In total, 115 patients undergoing acute STEMI and 26 control patients were included. Succinate was the only metabolite significantly increased in coronary sinus blood compared with venous blood in STEMI patients, indicating cardiac release of succinate. STEMI patients had higher succinate concentrations in arterial, coronary sinus, and peripheral venous blood than patients with non‐STEMI or stable angina. Furthermore, cardiac succinate release in STEMI correlated with the extent of acute myocardial injury, quantified by cardiac magnetic resonance imaging.
Conclusion
Succinate release by the myocardium correlates with the extent of ischemia.
Keywords: ischemia–reperfusion injury, mitochondria, myocardial ischemia, myocardial metabolism
Subject Categories: Basic Science Research, Biomarkers, Ischemia, Metabolism, Myocardial Biology
Clinical Perspective
What Is New?
Mitochondrial dysfunction is a feature of ischemia–reperfusion injury, leading to generation of reactive oxygen species.
In experimental models of ischemia–reperfusion, mitochondrial reactive oxygen species generation is mediated by reversal of succinate dehydrogenase, leading to succinate accumulation.
On reperfusion, restoration of succinate dehydrogenase activity leads to rapid succinate oxidation, causing reactive oxygen species generation by reverse electron transport at mitochondrial complex I.
By measuring the concentration of succinate in coronary artery and coronary sinus blood in patients immediately after percutaneous coronary intervention for ST‐segment–elevation myocardial infarction, this study shows that increased myocardial production of succinate is a feature of acute ST‐segment–elevation myocardial infarction in humans.
What Are the Clinical Implications?
The observation of myocardial succinate release and the association between myocardial succinate release and area at risk, quantified by cardiac magnetic resonance imaging, suggests that succinate accumulation could be a specific metabolic signature of the extent of ischemia.
Targeting mitochondrial dysfunction causing myocardial succinate accumulation may be a potential therapeutic target in limiting ischemia‐reperfusion injury in patients with ST‐segment–elevation myocardial infarction.
Introduction
Acute ST‐segment–elevation myocardial infarction (STEMI) is a leading cause of cardiovascular death worldwide and remains the primary cause for the development of chronic heart failure.1 Immediate primary percutaneous coronary intervention (PPCI) reduces infarct size by reopening the occluded artery; however, myocardial injury caused by subsequent ischemia–reperfusion injury (IRI) remains a major clinical problem, leading to increased infarct size, arrhythmias, and heart failure. There are no clinical treatments to prevent or treat IRI.
Our group recently showed that mitochondrial respiratory chain function is impaired during ischemia, leading to an increase in the citric‐acid‐cycle intermediate succinate through reversal of succinate dehydrogenase. On reperfusion, restoration of forward succinate dehydrogenase activity leads to the rapid oxidation of succinate into fumarate and, ultimately, to the production of damaging reactive oxygen species by reverse electron transport at mitochondrial complex I.2 This work suggests that succinate accumulation could be a specific metabolic signature of the extent of ischemia and a potential therapeutic target in limiting IRI.2
Until now, these findings have been demonstrated only in animal models of ischemia–reperfusion; whether there is increased myocardial production of succinate in humans during acute STEMI is unknown.
In this study, we performed a comprehensive analysis of blood metabolites in STEMI patients and found that succinate is released by the myocardium into the blood. We also found that succinate release correlated with the extent of acute myocardial ischemic injury, quantified by T2‐weighted cardiac magnetic resonance imaging (cMRI). Our results suggest that succinate is an early marker of ischemic injury in STEMI patients.
Methods
The data and analytic methods will be made available to other researchers for purposes of reproducing the results. The data are available from the corresponding author upon reasonable request.
Patients
Patients undergoing emergency PPCI for STEMI were recruited as part of the OxAMI (Oxford Acute Myocardial Infarction) study. Diagnosis of STEMI was established on the basis of chest pain, ST‐segment elevation of 0.2 mV in at least 2 contiguous leads on ECG, and TIMI (Thrombolysis in Myocardial Infarction) grade 0 flow on initial angiography. Verbal consent for participation was obtained at the time of PPCI.3 Informed written consent for continued participation was obtained within the following 24 hours. The comparison population comprised patients referred for nonemergency coronary angiography or percutaneous coronary intervention (PCI) for angina or non‐STEMI (NSTEMI). The study protocols and consent processes were approved by the local research ethics committee (REC numbers 08/H0603/41 and 11/SC/0397).
Angiography and PCI
Patients with STEMI received aspirin (300 mg) and clopidogrel (600 mg) or ticagrelor (180 mg) loading before PPCI and were treated with intravenous bivalirudin and/or unfractionated heparin during the procedure. Coronary intervention was performed using a 6F guiding catheter via the radial artery. Epicardial coronary reperfusion was established using a thrombus aspiration catheter and/or balloon before dilatation. All patients received intracoronary glyceryl trinitrate (0.5–2 mg total over a variable number of boluses). The culprit lesion was treated with drug‐eluting stent deployment and dual antiplatelet therapy with aspirin and clopidogrel or ticagrelor for 12 months. Patients undergoing nonemergency angiography or PCI were treated with aspirin and clopidogrel and received unfractionated heparin (70 IU/kg) before PCI. Appropriate secondary prevention commenced with statins, angiotensin‐converting enzyme inhibitors, and beta blockers. The coronary sinus (CS) was catheterized using a 6F catheter via the femoral or antecubital vein. Blood from the CS, coronary artery (CA), and peripheral vein (PV) was sampled for metabolite quantification immediately after stent deployment. Blood oxygen tension was measured in CS, CA, and PV blood samples to validate sampling locations; samples were included in the analysis only if blood oxygen tension in CS blood was lower than blood oxygen tension in PV blood. All samples were immediately centrifuged to obtain platelet‐poor plasma, confirmed by platelet count,4 and stored at −80°C.
cMRI Quantification of Area At Risk and Infarct Size
STEMI patients underwent cMRI within 48 hours of admission and 6 months later. Left ventricular function and myocardial injury were assessed in matching short‐axis slices using steady‐state free precession, T2‐weighted, and late gadolinium enhancement imaging after the administration of 0.1 mmol/kg contrast agent (Dotarem [gadoterate meglumine]; Guerbet Groupe), as described previously.5, 6
Metabolite Quantification and Analysis
Quantification of metabolites was performed using liquid chromatography coupled to mass spectrometry analysis, as described previously.2 Before liquid chromatography–mass spectrometry, plasma was thawed and centrifuged at 16 000g for 15 minutes at 4°C. After liquid chromatography, the mass spectrometer (Thermo QExactive Orbitrap) was operated in full mass spectrometry and polarity switching mode. Samples were randomized to avoid bias due to machine drift. Spectra were analyzed using XCalibur Qual Browser and XCalibur Quan Browser software (Thermo Scientific) by referencing to an internal library of compounds. Absolute quantification of succinate was performed by interpolation of the corresponding standard curve obtained from serial dilutions of a reference standard that was run with the same batch of samples.
Cardiac release of metabolites was assessed by simultaneous sampling of CS and CA blood. This sampling protocol allowed computation of the cardiac release ratio for each metabolite by calculating the ratio of the difference between CS concentration and CA concentration to the CA concentration for each metabolite and each patient. Similarly, the systemic release ratio was calculated using the PV concentration of the considered metabolite and the CA concentration . Metabolites with significantly higher cardiac release ratios compared with systemic release ratios were assumed to be specifically released by the heart.
Statistical Analyses
All clinical parameters and metabolite concentrations were expressed as mean±SEM. Release ratios of metabolites were expressed as median and interquartile range.
The Wilcoxon–Mann–Whitney test was used for statistical comparison of positive release ratios for a given metabolite in STEMI patients. The Kruskal–Wallis test followed by pairwise multiple comparison with the Dunn method was used for comparison of succinate concentration between groups.
Association between succinate values and myocardial edema measured 2 days after PCI or infarct size measured 6 months after PCI were made by a nonparametric Spearman rank correlation test. We also measured the association with myocardial edema using a multiple linear regression model with succinate, sex, body surface area, and age as independent variables. In the latter, no significant effect was found, which suggests no confounding factors.
A P value of <0.05 was considered statistically significant. All statistical analyses have performed using Systat 13.1 software (Systat Software).
Results
In total, 115 patients undergoing emergency PCI for STEMI were recruited between September 2012 and July 2015. The median age was 64 years, and 97 (79.5%) of the patients were male (Table). The culprit vessel was the right CA in 55 patients (48%), the left anterior descending artery in 47 patients (41%), and the circumflex artery in 13 patients (11%). Median time between pain onset and procedure was 86±29 minutes. Forty‐four patients underwent cMRI within 2 days after PPCI. Among them, 26 presented with left coronary infarct (patients with culprit left anterior descending or circumflex artery).
Table 1.
Patient Characteristics
| General Characteristics | STEMI Patients n=115 | Angina or NSTEMI Patients n=26 | P Values Between Groups | ||
|---|---|---|---|---|---|
| Age, y, mean (range) | 64 | (36–88) | 65 | (37–84) | 0.719 |
| Male | 92 | (80) | 22 | (84.6) | 0.792 |
| Comorbidities | |||||
| Diabetes mellitus | 11 | (9.0) | 5 | (19.2) | 0.289 |
| Oral medication | 7 | (6.1) | 5 | (19.2) | 0.075 |
| Insulin | 2 | (2.5) | 1 | (0.4) | 0.936 |
| New diagnosis | 1 | (0.9) | 0 | (0) | 0.414 |
| Chronic kidney disease | 1 | (0.9) | 0 | (0) | 0.414 |
| Smoking | |||||
| Current smoker | 42 | (36.5) | 4 | (15.4) | 0.081 |
| Ex‐smoker | 42 | (36.5) | 14 | (53.8) | 0.159 |
| Lung disease | 12 | (10.4) | 0 | (0) | 0.183 |
| Coronary artery disease | 48 | (41.7) | 18 | (69.2) | 0.020 |
| Previous MI | 6 | (5.2) | 10 | (38.5) | <0.001 |
| Previous PCI | 7 | (6.1) | 9 | (34.6) | <0.001 |
| Previous CABG | 0 | (0.0) | 3 | (11.5) | 0.003 |
| Hypercholesterolemia | 37 | (32.2) | 18 | (69.2) | <0.001 |
| Hypertension | 46 | (40.0) | 16 | (61.5) | 0.075 |
| Peripheral vascular disease | 1 | (0.9) | 1 | (0.4) | 0.81 |
| Cerebrovascular disease | 3 | (2.6) | 4 | (11.5) | 0.027 |
| Valvular heart disease | 0 | (0.0) | 0 | (0) | ··· |
| Heart failure | 0 | (0.0) | 0 | (0) | ··· |
| Drugs on admissiona | |||||
| None | 35 | (30.4) | 5 | (19.2) | 0.366 |
| Aspirin | 10 | (8.7) | 17 | (65.4) | <0.001 |
| Clopidogrel | 0 | (0.0) | 11 | (42.3) | <0.001 |
| ACE inhibitor | 20 | (17.4) | 20 | (76.9) | <0.001 |
| Angiotensin receptor blocker | 7 | (6.1) | 12 | (46.1) | <0.001 |
| Beta blocker | 11 | (9.6) | 3 | (11.5) | 0.851 |
| Calcium channel blocker | 18 | (15.7) | 14 | (53.8) | <0.001 |
| Diuretic | 8 | (7.0) | 5 | (19.2) | 0.114 |
| Insulin | 3 | (2.6) | 4 | (15.4) | 0.027 |
| Oral hypoglycemic | 7 | (6.1) | 1 | (0.4) | 0.981 |
| Proton pump inhibitor | 25 | (21.7) | 5 | (19.2) | 0.986 |
| Statin | 25 | (21.7) | 10 | (38.5) | 0.126 |
| Procedural drugs | |||||
| Unfractionated heparin | 35 | (30.4) | 5 | (19.2) | 0.366 |
| Bivalirudin | 97 | (84.4) | 0 | (0) | <0.001 |
Data are shown as n (%) except as noted. Clinical details of patients with STEMI and the comparison group with NSTEMI or angina. Chronic kidney disease was defined as baseline creatinine value >200 μmol/L. ACE indicates angiotensin‐converting enzyme; CABG, coronary artery bypass grafting; MI, myocardial infarction; NSTEMI, non‐ST‐segment–elevation myocardial infarction; PCI, percutaneous coronary intervention; STEMI, ST‐segment–elevation myocardial infarction.
The term drugs on admission refers to medications taken regularly before admission and does not include loading doses of aspirin and ticagrelor/clopidogrel before PCI.
Twenty‐six patients undergoing nonemergency coronary angiography were recruited as a comparison group. These patients had demographic characteristics similar to the STEMI patients. Among them, 9 underwent PCI for NSTEMI or unstable angina and 11 for stable angina. Six of these PCI procedures (30%) were performed for plaque lesion in the right CA. Six patients underwent diagnostic angiography alone, without PCI.
Succinate Is Released From the Myocardium in STEMI Patients
Blood samples from the CA, CS, and PV were collected within 10 minutes of PPCI, and metabolite levels were measured using liquid chromatography–mass spectrometry. For each metabolite in STEMI patients, the cardiac release ratio was calculated from CA and CS concentrations (Figure 1). A positive cardiac release ratio indicates that the metabolite is released into the veins by the upstream myocardial tissue, which is dominated by cardiomyocytes but also includes arterial and venous endothelium and other cells, whereas negative release ratios indicate that the metabolite is consumed from the blood by the myocardial tissue. We also calculated the systemic release ratio, using the PV and CA concentrations of each metabolite, to evaluate nonspecific changes in metabolite levels. Strikingly, succinate was the only metabolite that exhibited a significantly higher cardiac release ratio compared with the systemic release ratio (Figure S1), suggesting a specific release of succinate by the heart during emergency PCI in STEMI patients.
Figure 1.
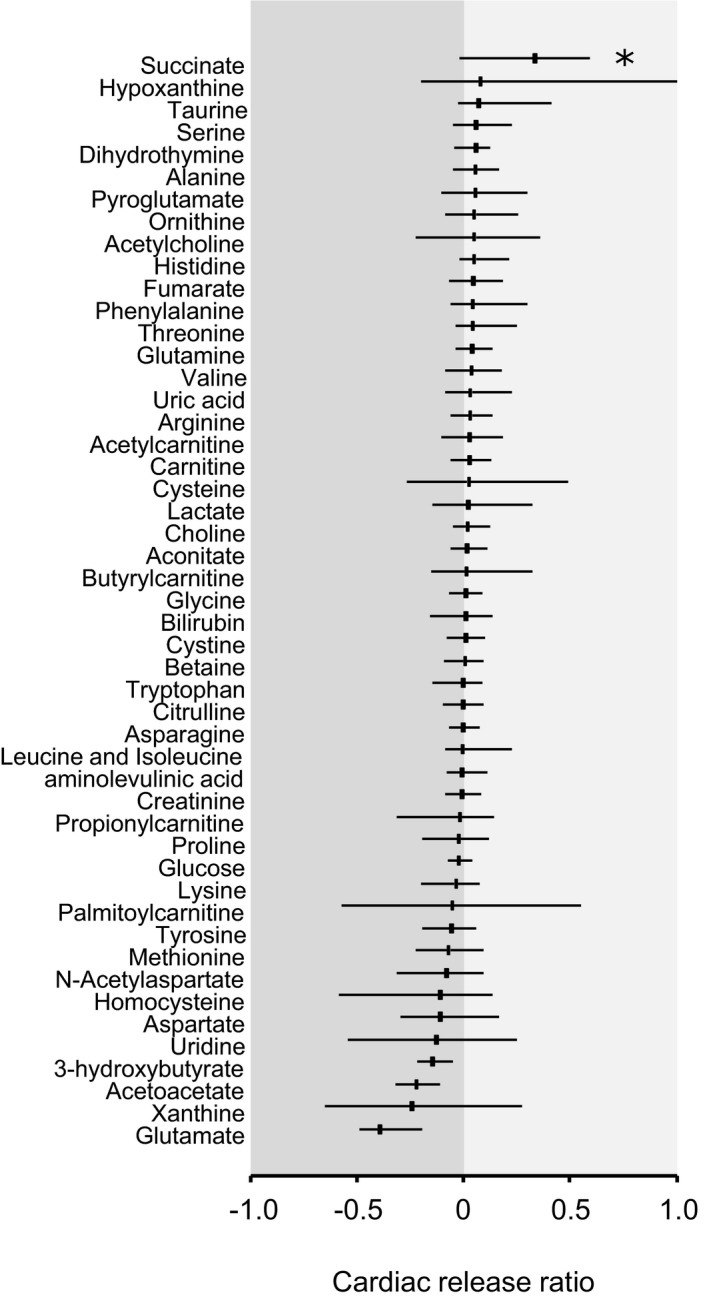
Specific release of metabolites from the heart in ST‐segment–elevation myocardial infarction. Metabolites were quantified by liquid chromatography and mass spectrometry in paired samples of coronary artery (CA) and coronary sinus (CS) blood. The cardiac release ratio was calculated from the difference between CA and CS concentration, divided by the CA concentration. Each bar represents the median and interquartile range of the cardiac release ratio. Positive values represent a release of the metabolite into the blood by the heart, whereas negative values represent consumption of the metabolite from the blood by the heart. For each metabolite, cardiac release ratio has been compared with systemic release ratio (presented in Figure S1). *P<0.05 for cardiac vs systemic release ratio.
We then compared the succinate concentrations in the blood between patients with STEMI and those with angina or NSTEMI (Figure 2A). In STEMI patients, blood succinate concentration was significantly increased in CA, CS, and PV, compared with patients with angina. Furthermore, succinate concentration was significantly higher in CA and CS blood in STEMI patients compared with NSTEMI patients. The greatest difference in succinate concentrations was observed in CS blood, with mean succinate concentrations of 1.38±0.14, 1.59±0.14, and 2.73±0.11 μmol/L in patients with angina, NSTEMI, and STEMI, respectively (P<0.05). The increase in CS succinate was seen only in patients undergoing PPCI; there was no effect of either diagnostic angiography or nonemergency PCI on succinate concentration (Figure 2B).
Figure 2.
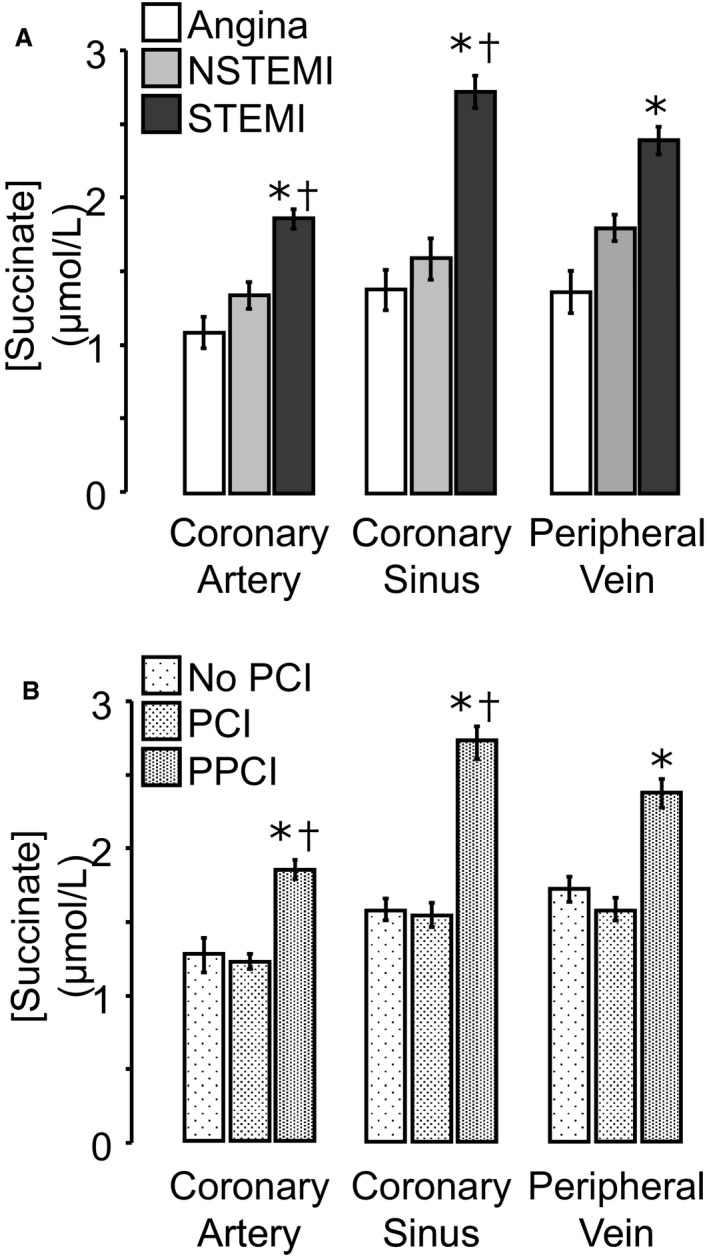
Blood succinate concentrations in patients with Angina, NSTEMI or STEMI. Absolute succinate concentrations in coronary artery, coronary sinus, and peripheral vein blood were compared for patients with angina, NSTEMI, or STEMI (A) and for patients undergoing coronary angiography without PCI, PCI for angina or NSTEMI, or PPCI for STEMI (B). A, *P<0.05 vs patients with angina; † P<0.05 vs NSTEMI patients for the corresponding sampling site. B, *P<0.05 vs patients with PCI patients; † P<0.05 vs no‐PCI patients for the corresponding sampling site. NSTEMI indicates non–ST‐segment–elevation myocardial infarction; PCI, percutaneous coronary intervention; PPCI, primary percutaneous coronary intervention; STEMI, ST‐segment–elevation myocardial infarction.
CS Succinate Concentration in STEMI Correlates With the Extent of Acute Myocardial Ischemic Injury
We next tested the relationship between myocardial succinate release and the extent of acute IRI, using cMRI quantification of acute myocardial edema after PPCI. Because the drainage of the right CA territory into the CS is variable, we analyzed STEMI patients with left anterior descending or circumflex CA occlusions. Performed within 2 days of PPCI, cMRI revealed a mean extent of acute myocardial edema of 37.3±16.2% of left ventricular mass. CS succinate concentration was significantly correlated with acute myocardial edema quantified by cMRI (Spearman R=0.43, P<0.05; Figure 3). In contrast, there was no significant correlation between CS succinate concentration and final myocardial infarct size assessed by cMRI 6 months after PPCI (R=0.136; P=0.08) or with troponin area under the curve (Figure S2), measured over 48 hours after PPCI, suggesting that myocardial succinate release is a specific biomarker of acute myocardial ischemic injury rather than a biomarker of irreversible myocardial necrosis.
Figure 3.
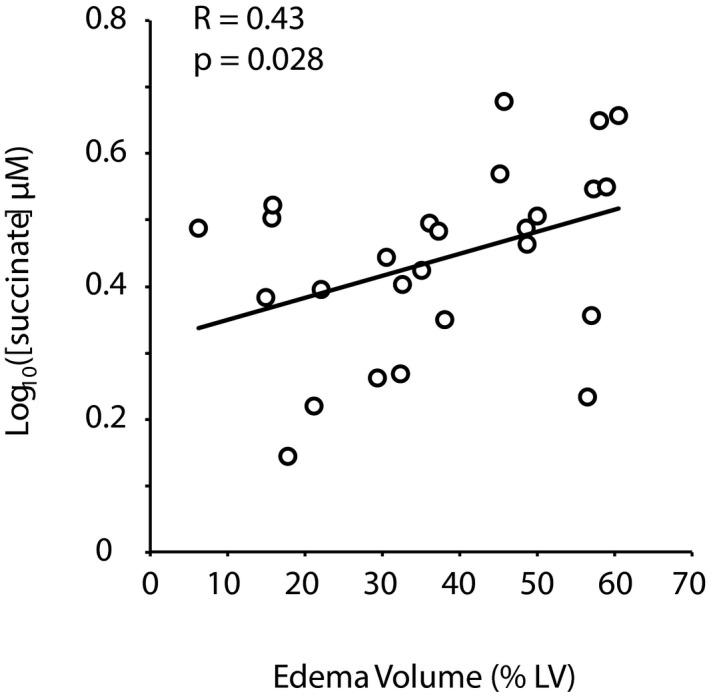
Correlation between coronary sinus succinate concentration and acute myocardial edema. Acute ischemia–reperfusion injury was quantified by T2 magnetic resonance imaging of edema within 2 days after primary percutaneous coronary intervention in patients with ST‐segment–elevation myocardial infarction due to left anterior descending or circumflex coronary artery occlusions. The extent of left ventricular (LV) myocardial edema, expressed as a percentage of LV mass, was correlated with coronary sinus succinate concentration.
Discussion
We used a metabolomics approach to quantify the changes in myocardial metabolite release in response to acute IRI in STEMI patients undergoing emergency PPCI. We analyzed blood sampled simultaneously from CS, CA, and PV during PPCI and demonstrated a specific increase in succinate release by the ischemic myocardium of STEMI patients compared with patients undergoing PCI for angina or NSTEMI. Cardiac succinate release leads to a significantly higher blood succinate concentration in STEMI patients compared with patients with less severe ischemia (angina or NSTEMI). Furthermore, we demonstrated that succinate concentration in CS blood correlates with the early extent of myocardial edema measured by cMRI, as a marker of acute ischemic injury.
We previously reported that cardiac IRI in rodent models is associated with an alteration of the mitochondrial respiratory chain leading to the specific accumulation of succinate in the heart.2 Other experimental studies also showed cellular accumulation of succinate during hypoxia in rabbits7 and on ischemia in the isolated, perfused mouse heart.8 In the current study, we report that cardiac‐specific release of succinate is a feature of human IRI in patients undergoing emergency PPCI for STEMI, most likely reflecting succinate accumulation during ischemia and subsequent release from ischemic myocardial tissue following reperfusion. The large metabolite analysis that we performed in this study also showed interesting variations in other metabolites and especially in the release ratios for glutamate and acetoacetate. For these 2 metabolites, the release ratio was lower, albeit not significantly decreased, compared with the systemic release ratio.
Consistent with a role for succinate in IRI, we demonstrated that succinate levels in the CS are associated with the extent of the acute ischemic injury, as quantified by the “area at risk” delineated by the area of acute myocardial ischemia on cMRI T2‐weighted imaging. Furthermore, the observation that NSTEMI is associated with lower levels of ischemia and reduced infarct size compared with STEMI9 is consistent with our findings that myocardial succinate release is lower in NSTEMI patients than in STEMI patients. Another reason for reduced myocardial succinate release was that NSTEMI patients underwent PCI (and, therefore, blood sampling) within 72 hours of hospital admission, which allowed time for succinate accumulation to resolve, unlike the STEMI patients, who underwent emergency PCI on arrival. Only 1 previous study described succinate concentration in PVs of myocardial infarction patients10. In that study, the peripheral blood succinate concentration was assessed in only 3 patients with acute myocardial infarction and was shown to be significantly higher than in healthy volunteers.
In STEMI patients with left anterior descending or circumflex CA occlusions, we found that succinate concentration in the CS correlated with the extent of myocardial edema on cMRI. Although myocardial edema as a marker of IRI remains controversial,11 the early edema quantified by cMRI has been shown to correlate well with the size of the area at risk after myocardial infarction.12, 13 These results suggest that succinate is associated with the extent of myocardial IRI in STEMI patients.
In our study, we did not detect any correlation between succinate release and the final infarct size, quantified 6 months after STEMI by late gadolinium enhancement on cMRI. Furthermore, myocardial succinate release did not correlate with troponin area under the curve in the 48 hours after STEMI, as a marker of myocardial necrosis. Thus, myocardial succinate release is a marker of acute IRI rather than irreversible myocardial injury or final infarct size.
There was no correlation between final infarct size and myocardial succinate release, which may be due to the undefined relationship between succinate released from myocardial cells into CS blood and the level of succinate that is retained by myocardial cells. In addition, final infarct size is determined by the extent of ischemia and the salvage of the myocardium by PPCI and other therapies. The discordance between the magnitude of acute IRI (area at risk) and the final infarct size is used to estimate the “salvage index” as an indicator of the effectiveness of coronary reperfusion. Consequently, infarct size at 6 months depends not only on the magnitude of the initial IRI but also on the efficacy and timing of the reperfusion therapy and other determinants of late myocardial remodeling after STEMI.14
Our study has several potential limitations. First, as demonstrated in animal models, tissue succinate levels return to baseline within the first few minutes of reperfusion.2 In PPCI patients, the timing between the onset of reperfusion and subsequent blood sampling is not well defined, given biological heterogeneity in the pathophysiology of ischemia–reperfusion in STEMI, for example, because of distal “no‐reflow,” side branch occlusion, or embolization. Technical considerations that impose variability and delay could also contribute to variation in succinate concentration. Nevertheless, we enriched the biological signal through (1) careful selection of STEMI patients with an occluded CA at presentation and matched blood sampling immediately after reperfusion and stent placement and (2) rigorous quality control to ensure high fidelity and consistent CS blood sampling.
We compared STEMI patients with NSTEMI and stable angina patients. In all of these groups, a certain degree of ischemia is expected. Even so, we found several differences between groups regarding the history of cardiovascular disease, cerebrovascular disease, and hypercholesterolemia. Even if those findings do not interact directly with the ischemic burden or succinate release, they could represent a limitation of the statistical analysis. In addition, the subsequent differences in anticoagulant and antiplatelet drugs administered could, in principle, interact with succinate levels and thereby contribute to differences between groups, although we note that there are no reports of such confounding effects in the literature. Because of ethical considerations, blood samples of the CS and aortic root could not be obtained from healthy volunteers; therefore, the level of succinate under these conditions is unknown. However, in a study that investigated the role of succinate in cardiac hypertrophy, the authors were unable to detect succinate in peripheral blood,10 suggesting that the succinate concentration in the CS and aortic root is likely to be low in healthy participants.
Conclusion
We demonstrated that succinate is released from the myocardium into the blood during acute STEMI and that myocardial succinate release correlates with the severity of IRI. Although CS concentration of succinate relates directly to cardiac succinate release, PV concentration of succinate may provide a more accessible biomarker of IRI in STEMI patients. These data show that the accumulation of succinate during ischemia, previously shown in rodents, also occurs in humans and thus suggests novel therapeutic targets for cardioprotective pharmacological strategies.
Sources of Funding
This work was supported by the Oxford British Heart Foundation (BHF) Centre of Research Excellence (RG/13/1/30181), BHF Chair Award (CH/16/1/32013), and the National Institute for Health (NIHR) Oxford Biomedical Research Centre. Frezza and Costa are funded by the Medical Research Council, core fund to the MRC Cancer Unit. Murphy is supported by the Medical Research Council UK (MC_U105663142) and by a Wellcome Trust Investigator Award (110159/Z/15/Z). Kohlhauer, Channon, and Krieg are supported by the European Union ITN RADOX grant (PITN‐GA‐2012‐316738).
Disclosures
None.
Supporting information
Figure S1. Systemic release of metabolites by peripheral tissue in blood. Each bar represents the median and interquartile range of the systemic release ratio. This ratio is the difference between concentrations in peripheral vein and coronary artery, divided by the coronary artery concentration. Positive values represent a release of metabolite in the blood and negative values represent a consumption of the metabolite.
Figure S2. Correlation between succinate concentration in the coronary sinus succinate and the area under the curve of troponin release during 48 hours after ST‐segment–elevation myocardial infarction.
(J Am Heart Assoc. 2018;7:e007546 DOI: 10.1161/JAHA.117.007546.)29626151
Contributor Information
Thomas Krieg, Email: tk382@medschl.cam.ac.uk.
Keith M. Channon, Email: keith.channon@cardiov.ox.ac.uk.
References
- 1. Cung T‐T, Morel O, Cayla G, Rioufol G, Garcia‐Dorado D, Angoulvant D, Bonnefoy‐Cudraz E, Guérin P, Elbaz M, Delarche N, Coste P, Vanzetto G, Metge M, Aupetit J‐F, Jouve B, Motreff P, Tron C, Labeque J‐N, Steg PG, Cottin Y, Range G, Clerc J, Claeys MJ, Coussement P, Prunier F, Moulin F, Roth O, Belle L, Dubois P, Barragan P, Gilard M, Piot C, Colin P, De Poli F, Morice M‐C, Ider O, Dubois‐Randé J‐L, Unterseeh T, Le Breton H, Béard T, Blanchard D, Grollier G, Malquarti V, Staat P, Sudre A, Elmer E, Hansson MJ, Bergerot C, Boussaha I, Jossan C, Derumeaux G, Mewton N, Ovize M. Cyclosporine before PCI in patients with acute myocardial infarction. N Engl J Med. 2015;373:1021–1031. [DOI] [PubMed] [Google Scholar]
- 2. Chouchani ET, Pell VR, Gaude E, Aksentijević D, Sundier SY, Robb EL, Logan A, Nadtochiy SM, Ord ENJ, Smith AC, Eyassu F, Shirley R, Hu C‐H, Dare AJ, James AM, Rogatti S, Hartley RC, Eaton S, Costa ASH, Brookes PS, Davidson SM, Duchen MR, Saeb‐Parsy K, Shattock MJ, Robinson AJ, Work LM, Frezza C, Krieg T, Murphy MP. Ischaemic accumulation of succinate controls reperfusion injury through mitochondrial ROS. Nature. 2014;515:431–435. [DOI] [PMC free article] [PubMed] [Google Scholar]
- 3. Sahan KM, Channon KM, Choudhury RP, Kharbanda RK, Lee R, Sheehan M. Refining the enrolment process in emergency medicine research. Eur J Cardiovasc Med. 2016;4:506–510. [DOI] [PMC free article] [PubMed] [Google Scholar]
- 4. Lee R, Antonopoulos AS, Alexopoulou Z, Margaritis M, Kharbanda RK, Choudhury RP, Antoniades C, Channon KM. Artifactual elevation of plasma sCD40L by residual platelets in patients with coronary artery disease. Int J Cardiol. 2013;168:1648–1650. [DOI] [PubMed] [Google Scholar]
- 5. Cuculi F, Dall'Armellina E, Manlhiot C, De Caterina AR, Colyer S, Ferreira V, Morovat A, Prendergast BD, Forfar JC, Alp NJ, Choudhury RP, Neubauer S, Channon KM, Banning AP, Kharbanda RK. Early change in invasive measures of microvascular function can predict myocardial recovery following PCI for ST‐elevation myocardial infarction. Eur Heart J. 2014;35:1971–1980. [DOI] [PubMed] [Google Scholar]
- 6. Patel N, Petraco R, Dall'Armellina E, Kassimis G, De Maria GL, Dawkins S, Lee R, Prendergast BD, Choudhury RP, Forfar JC, Channon KM, Davies J, Banning AP, Kharbanda RK. Zero‐flow pressure measured immediately after primary percutaneous coronary intervention for st‐segment elevation myocardial infarction provides the best invasive index for predicting the extent of myocardial infarction at 6 months: an OxAMI Study (Oxford Acute Myocardial Infarction). JACC Cardiovasc Interv. 2015;8:1410–1421. [DOI] [PubMed] [Google Scholar]
- 7. Taegtmeyer H. Metabolic responses to cardiac hypoxia. Increased production of succinate by rabbit papillary muscles. Circ Res. 1978;43:808–815. [DOI] [PubMed] [Google Scholar]
- 8. Ashrafian H, Czibik G, Bellahcene M, Aksentijević D, Smith AC, Mitchell SJ, Dodd MS, Kirwan J, Byrne JJ, Ludwig C, Isackson H, Yavari A, Støttrup NB, Contractor H, Cahill TJ, Sahgal N, Ball DR, Birkler RID, Hargreaves I, Tennant DA, Land J, Lygate CA, Johannsen M, Kharbanda RK, Neubauer S, Redwood C, de Cabo R, Ahmet I, Talan M, Günther UL, Robinson AJ, Viant MR, Pollard PJ, Tyler DJ, Watkins H. Fumarate is cardioprotective via activation of the Nrf2 antioxidant pathway. Cell Metab. 2012;15:361–371. [DOI] [PMC free article] [PubMed] [Google Scholar]
- 9. Xu J, Song YB, Hahn J‐Y, Chang S‐A, Lee S‐C, Choe YH, Choi S‐H, Choi J‐H, Lee SH, Oh JK, Gwon H‐C. Comparison of magnetic resonance imaging findings in non‐ST‐segment elevation versus ST‐segment elevation myocardial infarction patients undergoing early invasive intervention. Int J Cardiovasc Imaging. 2012;28:1487–1497. [DOI] [PubMed] [Google Scholar]
- 10. Aguiar CJ, Rocha‐Franco JA, Sousa PA, Santos AK, Ladeira M, Rocha‐Resende C, Ladeira LO, Resende RR, Botoni FA, Barrouin Melo M, Lima CX, Carballido JM, Cunha TM, Menezes GB, Guatimosim S, Leite MF. Succinate causes pathological cardiomyocyte hypertrophy through GPR91 activation. Cell Commun Signal. 2014;12:78. [DOI] [PMC free article] [PubMed] [Google Scholar]
- 11. Croisille P, Kim HW, Kim RJ. Controversies in cardiovascular MR imaging: T2‐weighted imaging should not be used to delineate the area at risk in ischemic myocardial injury. Radiology. 2012;265:12–22. [DOI] [PubMed] [Google Scholar]
- 12. Wright J, Adriaenssens T, Dymarkowski S, Desmet W, Bogaert J. Quantification of myocardial area at risk with T2‐weighted CMR: comparison with contrast‐enhanced CMR and coronary angiography. JACC Cardiovasc Imaging. 2009;2:825–831. [DOI] [PubMed] [Google Scholar]
- 13. Fernández‐Jiménez R, García‐Prieto J, Sánchez‐González J, Agüero J, López‐Martín GJ, Galán‐Arriola C, Molina‐Iracheta A, Doohan R, Fuster V, Ibáñez B. Pathophysiology underlying the bimodal edema phenomenon after myocardial ischemia/reperfusion. J Am Coll Cardiol. 2015;66:816–828. [DOI] [PubMed] [Google Scholar]
- 14. Hendriks T, Hartman MHT, Vlaar PJJ, Prakken NHJ, van der Ende YMY, Lexis CPH, van Veldhuisen DJ, van der Horst ICC, Lipsic E, Nijveldt R, van der Harst P. Predictors of left ventricular remodeling after ST‐elevation myocardial infarction. Int J Cardiovasc Imaging. 2017;33:1415–1423. [DOI] [PMC free article] [PubMed] [Google Scholar]
Associated Data
This section collects any data citations, data availability statements, or supplementary materials included in this article.
Supplementary Materials
Figure S1. Systemic release of metabolites by peripheral tissue in blood. Each bar represents the median and interquartile range of the systemic release ratio. This ratio is the difference between concentrations in peripheral vein and coronary artery, divided by the coronary artery concentration. Positive values represent a release of metabolite in the blood and negative values represent a consumption of the metabolite.
Figure S2. Correlation between succinate concentration in the coronary sinus succinate and the area under the curve of troponin release during 48 hours after ST‐segment–elevation myocardial infarction.