

Abstract
Fluorescent biosensors are important measurement tools for in vivo quantification of pH, concentrations of metal ions and other analytes, and physical parameters such as membrane potential. Both the development of these sensors and their implementation in examining cellular heterogeneity requires technology for measuring and sorting cells based on the fluorescence levels before and after chemical or physical perturbations. We developed a droplet microfluidic platform for the screening and separation of cell populations on the basis of the in vivo response of expressed fluorescence-based biosensors after addition of an exogenous analyte. We demonstrate the capability to resolve the responses of two genetically-encoded Zn2+ sensors at a range of time points spanning several seconds and subsequently sort a mixed-cell population of varying ratios with high accuracy.
Keywords: microfluidics, FRET, fluorescent proteins, biosensors, cellular imaging
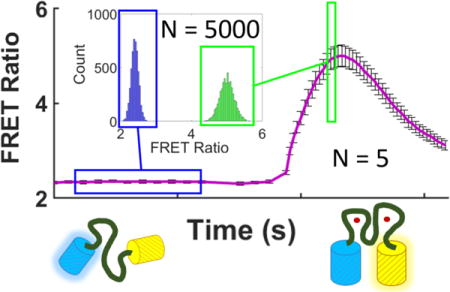
TOC image
Spatiotemporal investigations of molecular species are among the cornerstones on which the modern understanding of cellular function is built. Biosensors based on fluorescent proteins have been constructed to quantify free levels of nearly every important cellular analyte including Ca2+, pH, NAD+/NADH, ADP/ATP, cGMP, halides and many metal cations.1–4 Sensing is achieved by a number of mechanisms including, but not limited to Förster Energy Resonance Transfer (FRET) and emission intensity or wavelength shifts modulated by conformational changes and environmental sensitivity.5 Full characterization of a biosensor’s dynamic range, a critical parameter for determining its usefulness, requires fluorescence measurements prior to and after cellular perturbation. These fluorescence changes in vivo typically occur on the tens of milliseconds to several seconds timescale, for example in response to a signal cascade, such as Ca2+ and IP3 oscillations after stimulation by glutamate6 or cGMP production in response to NO7,8; transient perturbations in the cellular environment, such as cellular pH changes and reactive oxygen species bursts9,10; or changes in membrane potential.11,12 In addition to biosensing, cellular control via optogenetic tools instrinsically involves the measurement of transient responses. For example, when photoexcited at 488 nm, components of the CRY2 optogenetics system cluster on the second timescale and then revert to a diffuse state after exposure is terminated.13,14 In all these cases, quantifying the heterogeneity of these responses and determining whether it is intrinsic to the sensor or to genetic or epigenetic cell variability is a difficult subject of investigation which is impeded by the low-throughput microscopy techniques traditionally employed in this field. Beyond applications to existing biosensors, development of next-generation sensors and optogenetics tools would be facilitated by the high throughput screening and sorting of genetic libraries based on transient cellular response.
Fluorescence activated cell sorters (FACS) are highly optimized for speed, and single-time point, multi-wavelength excitation and emission measurements, but they are not suitable for introducing analytes and measuring transient biosensor responses on the msec-to-sec timescale. Commercial instruments operate at flow velocities of m/s, with a maximum delay of hundreds of microseconds between laser excitation points. Customized FACS instruments adapted for kinetic measurements on the order of ms to minutes have been developed.15–18 In these instruments, the addition of electronic timers, mixing networks during sample introduction, and nozzle modifications have enabled reagent mixing. These developments introduced the capability to measure population shifts as a function of delay time and reagent concentration by in-line dilution, but they do not offer cell-by-cell response measurements or sorting.
Plate-based colony screening platforms offer a robust method for determining and improving sensor dynamic range, but they are typically limited to screening or selection in bacterial or yeast cell lines. Plate screening technology typically measures the fluorescence intensity changes on the colony level through image analysis after chemical permeabilization and addition of ligands or chelators.19–21 While automation of colony plate screening offers the potential for measurements on large sensor libraries (> 103 clones), current technology employs manual chemical application and image capture which is inherently labor and time intensive. This technology does not permit measurements of single cells and averages out cell-to-cell variability, thereby decreasing overall sensitivity. Furthermore, techniques for uniformly and reproducibly applying solutions to the colonies are still under development. Depending on the application technique, reported coefficients of variation for the FRET ratio changes range from 67% when a manual sprayer was employed for dispensing ligand to 37% when a spraygun with a lasersight was used.19 Some of the limitations in plate screening technology could be improved with the use of high throughput-high content microscopy which could allow for single-cell measurements, though the implementation of cell selection in this technology is not straightforward. Finally, it is known that sensor performance varies between organisms,22 and even within different cellular compartments of the same organism.23 Technology for screening and selection of biosensors based on responses in mammalian cell lines has not yet been reported.
Droplet microfluidics flow cytometry provides throughput comparable to FACS while vastly expanding the types of single-cell measurements possible.24–26 Most efforts involving time-dependent phenomena capitalize on the stable encapsulation of cells to enable directed evolution of enzyme function, which requires incubation of single cells for minutes to hours, or drug toxicity assays also on timescales of hours.27 These assays employ single cell encapsulation, incubation, and droplet reinjection in separate devices,28,29 so responses are not individually tracked. Designs incorporating minute to hour-long delay lines for monitoring kinetics have been developed and implemented for enzymatic assays in picoliter reaction volumes, but thus far do not provide single-cell tracking and sorting.30–32 To our knowledge, there has been no report of a single microfluidic device that incorporates all three aspects required for biosensor characterization and development: on-chip mixing for initiation of a cellular response, interrogation before and after the reaction, and sorting based on the response of each cell.
Here, we describe a droplet microfluidic system that introduces each cell expressing a FRET sensor to the appropriate analyte, probes the baseline FRET level and the sensor response at multi-second time delays set by the geometry of the fluidic network and driving pressures, and then sorts on the basis of the response with dielectrophoresis (DEP). This work represents a significant advance over a previous study of cytosolic and extracellular-membrane-expressed D3cpV and D3pdD Ca2+ and ZapCY1 Zn2+ sensor response in HeLaS3 cells.33 Our previous study established that cellular response occurred on the ms-sec timescale in a two-dimensional hydrodynamic flow-focusing geometry. The response of cytosolic sensors was ~30 fold slower than those expressed on the cell surface (limited by cation transport across the plasma membrane) and heterogeneity in the ZapCY1 Zn2+ sensor response was also revealed. A major limitation of the instrument employed in our previous study was that signal post-processing was required to determine the single-cell response. Here, we demonstrate real-time signal processing and sorting with a microcontroller-based system, and clear measurement resolution and sorting based on the responses of two closely-related Zn2+ sensors. This new instrument provides a platform for directed evolution of new cellular sensors. Although we specifically optimized the system for screening genetically encoded Zn2+ FRET sensors, the technology is directly applicable to many other sensors.
EXPERIMENTAL SECTION
Microfluidic fabrication
Microfluidic devices are prepared using standard soft lithographic techniques. In short, SU8 photoresist (MicroChem) is spin-coated onto a silicon wafer and exposed to uniform UV illumination under an acetate mask printed with the inverted image of the device design (CAD/Art Services). The wafers are developed and hard-baked to complete the master, then exposed to (1H,1H,2H,2H-perfluorooctyl)trichlorosilane (TCS) for several hours under vacuum. Poly-dimethyl-siloxane (PDMS) pre-polymer and bonding agent (Sylgard 184, Dow Corning) are mixed in a 10:1 ratio and poured onto the master to achieve 4 mm thickness. PDMS slabs and clean No. 1.5 glass coverslips are O2 plasma treated, then pressed together to achieve an irreversible seal. Lastly the devices are treated with TCS in Novec 7500 (3M) to passivate the surface to the fluorinated continuous phase (Novec 7500), then blown out with air. The devices are then placed, one at a time, on a 150 °C hotplate and the electrode channels are filled with a low melting point In-Sn solder. Small pieces of wire are inserted and the assembly is sealed with epoxy to prevent liquids from entering the electrode inlets during the experiment. Devices are stored in an opaque container until use.
Device Design and Characteristics
Channels have a uniform height of 50 μm and widths vary from 50 μm in the input channels, to 100 μm in the middle section, and 200 μm in the outlets. The input channels use fluidic resistors to compensate for the output resistance of the chip. Resistance of the “keep” or sorted channel is 1.5 times higher than that of the “waste” channel to bias droplet flow away from the sorted channel. The sorting junction features several small islets to prevent resistance changes when a droplet occupies an outlet channel.34
Microfluidic Implementation
Three 25 PSI pressure regulators are connected via microtubing to three off-chip reservoirs to maintain buffer/solution isolation prior to mixing on-chip. The three reservoirs consist of the cell suspension/microfluidic buffer, the metal-ionophore solution, and fluorinated phase. Microtubing from the reservoirs is inserted into the microfluidic device (Figure S-1). Microtubing is inserted into the outlets of the device after it has been started and an approximate time delay has been set. The outlet tubing is inserted into collection vials maintained at ambient pressure.
Sample Preparation
HeLaS3 cells stably transfected by the PiggyBAC transposon system (SBI) with the desired genetically encoded Zn2+ sensor, NES-ZapCV2 co-transfected with mCherry-NLS or NES-ZapCV5, are grown in DMEM (Gibco) supplemented with 10% fetal bovine serum and 1% penicillin/streptomycin. They are harvested using 0.05% trypsin-EDTA in DMEM and resuspended in Ca2+, Mg2+, PO42− -free HEPES-buffered Hanks Balanced Salt Solution (HHBSS) prepared with chelex treated water. Cells are pre-treated with 50 μM N,N,N′,N′-tetrakis(2-pyridylmethyl)ethane-1,2-diamine (Sigma Aldrich), TPEN, for 10 minutes to generate the apo-form of the sensor prior to the experiment. Cells are washed twice with HHBSS, before being resuspended in a microfluidic HHBSS solution with 0.5 μM TPEN and 16% v/v OptiPrep (Sigma Aldrich) to prevent cell sedimentation during the course of the experiment. A solution of 50 μM ZnCl2 and 25 μM pyrithione (2-Mercaptopyridine N-oxide, Sigma Aldrich) in HHBSS for the reagent reservoir is prepared fresh at the same time. The fluorinated oil phase for droplet generation is Novec 7500 (3M) mixed with 10% BioRad droplet generator oil (which contains a surfactant to stabilize the droplet generation and prevent droplet merging). After sorting, 100-400 μL of phenol-free growth media is added to the droplets, along with a volume of 2,2,3,3,4,4,4-Heptafluoro-1-butanol (Sigma Aldrich) equal to 1% of the oil phase. After < 5 minutes of incubation, the emulsion is centrifuged at 150g for 1 min to break the droplet emulsion and extract cells into the aqueous phase, which is then collected for analysis.
Optical Layout
The optical layout is a standard inverted microscope utilizing epifluorescence capture. Excitation in two positions is provided by a 445 nm laser diode beam-shaped with a cylindrical lens to achieve a relatively flat beam profile across the width of the channel with a 1 μm focus and 1 kW/cm2 irradiance in the interrogation region of the microfluidic channel. As discussed previously, this beam shape minimizes signal variations due to variation in cell position across the channel width.35 Detector gains are adjusted to accommodate the diversity of cell brightness observed in these experiments such that droplet scatter/fluorescence is not observed, however it is evident that the background is constant from droplet to droplet by modifying the detector gain. The optical components are as follows, as they relate to Figure 2A: a) 50:50 beamsplitter, b) cylindrical lens, c) 445/20 nm bandpass, d) epifluorescence longpass filter, e) 580 nm camera longpass filter, f) 510 nm fluorescence dichroic filter, g) 483/32 nm CFP bandpass filter, h) 542/27 nm YFP bandpass filter, and i) 590 nm transmitted light longpass filter. Epifluorescence is collected with a 20X (0.75 N.A.) objective (Olympus) and passed through a series of dichroics to separate the emission from light used for excitation and visualization, ending with a dichroic to partition FRET donor (CFP) and acceptor (YFP) emission. The emission is split at the image plane by a pair of 1” broadband dielectric D-shaped mirrors. Emission is further selected by a bandpass filter on each PMT.
Figure 2.
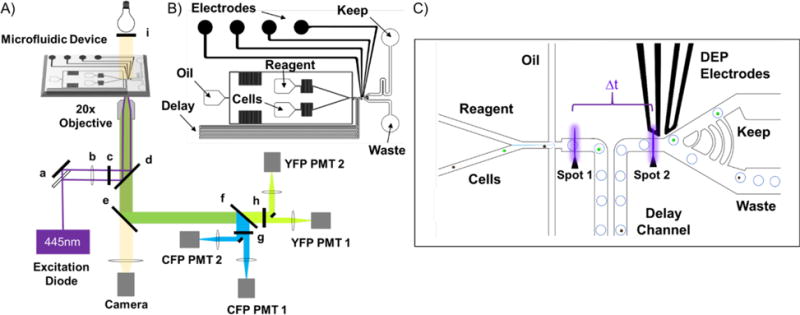
A) Epifluorescence microscope optical layout consisting of a) 50:50 beamsplitter, b) cylindrical lens, c) laser clean-up bandpass filter, d) epifluorescence longpass filter, e) camera longpass filter, f) fluorescence dichroic filter, g) CFP bandpass filter, h) YFP bandpass filter, and i) transmitted light longpass filter. B) Microfluidic device design used in this study. C) Close-up of analysis and sorting region of the microfluidic device.
Software and Data Acquisition
Signals from the two photomultiplier tubes (PMTs) are sampled at 50 kSamples/sec by an A/D converter on an LPC1769 microcontroller in a home built circuit. Parameters such as signal threshold, FRET ratio thresholds for the two measurement points R1 and R2 and the FRET ratio change, R2/R1, threshold, as well as timing parameters for the pair-matching and sorting signal are sent over a FSUSB connection to the microcontroller. Data are simultaneously collected by a National Instruments DAQ (NI 6251) board and processed by LabView software for calculations that are too CPU-intensive for the microcontroller. For example, compiling the signal timing histograms for determining delay times between interrogation regions requires operations on large arrays. Encapsulated cells with signals satisfying the gate conditions are sorted using dielectrophoresis. Sorting is triggered by a TTL pulse from the microcontroller to a function generator (Keysight Technologies) which sends a square wave pulse to a high voltage amplifier (TREK) connected to the electrodes on the microfluidic device. Typically, the sorting voltage is 400 V peak-peak at 30 kHz, and is delayed by 100 μs, on for 10 ms (depending on droplet speed) from the second measurement signal.
RESULTS
Sensor constructs
Two genetically-encoded Zn2+ sensors, ZapCV2 and ZapCV5, were chosen for study due to their structural similarity, yet differing dynamic ranges as would be expected for a library of these sensors. These sensors are comprised of a fluorescent protein FRET pair including a 11-residue truncated enhanced Cyan Fluorescent Protein (CFP) as the donor and circularly permuted Venus (cp173) as the acceptor. The FRET pair is connected by a Zn2+ binding domain (ZBD) consisting of the first two Zn-fingers in the Zap1 transcription factor adopted from S. cerevisiae. These sensors only differ by two mutations. The native Zn-finger contains two Cys and two His as coordinating ligands. In ZapCV2, one of these Cys residues is mutated to His in both fingers. In ZapCV5 all four Cys residues are mutated to His. Both constructs contain N-terminal nuclear exclusion sequences (NES) to achieve cytosolic localization. The FRET response is defined as the ratio of the acceptor to donor fluorescence intensities upon donor excitation, R = IFRET/ICFP. Upon Zn2+ binding, the donor-acceptor pair undergoes a conformational change and the value of R increases.36–38 The in vitro KD values (Hill coefficient, n) of the sensors are 2.3 nM (n = 0.53) and 0.3 μM (n = 0.55) in buffer (150 mM HEPES, 100 mM NaCl, 10% glycerol, pH 7.4) and the dynamic ranges (defined as the ratio Rmax/Rmin) are 2.1 and 1.5 for ZapCV2 and ZapCV5 respectively. A schematic of the Zn2+ sensors with sequence differences highlighted and the data used to obtain in vitro binding affinities can be found in Figure S-2.
The microfluidic system is designed to measure the sensor parameters which are conventionally obtained from low-throughput fluorescence microscopy. In a typical microscopy measurement (Figure 1) a resting FRET ratio, R, is observed and subsequently a cell permeable Zn2+ chelator (N,N,N′,N′-tetrakis(2-pyridylmethyl)ethane-1,2-diamine: TPEN) is added to desaturate the sensor and obtain an Rmin. The cell is then treated with an agent to permeabilize the plasma membrane or an ionophore, such as pyrithione, and ZnCl2 to saturate the sensor and establish an Rmax. After the full saturation of the sensor has been achieved, the Rmax signal in mammalian cells often diminishes by a currently unknown mechanism. The decay of the response may be due to cell death or homeostatic regulation of the Zn2+ levels. The transient nature of these signals define the requirements for the time-resolution of the cytometer.
Figure 1.
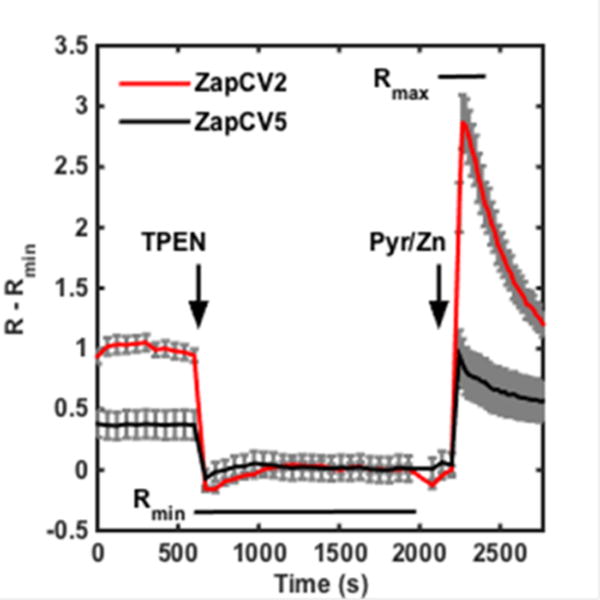
Representative calibration plots of ZapCV2 (red, n = 4 cells) and ZapCV5 (black, n = 9 cells). TPEN (150 μM) and Pyr/Zn (1 μM pyrithione and 50 μM ZnCl2) were added at the indicated times. Data are displayed as R – Rmin for each sensor, where R is the FRET ratio at each time point and Rmin is the minimum FRET ratio obtained after incubation with TPEN. Error bars are the standard error of the mean. Regions used to determine Rmin and Rmax are denoted with bars at the appropriate locations. Raw data shown in Figure S-3.
Microfluidics
A PDMS microfluidic device was designed to initiate the cell reaction with exogenous Zn2+, monitor the time-resolved response, and subsequently sort on the single cell response. HeLa cells pre-treated with TPEN to chelate free Zn2+ and desaturate the sensors enter the PDMS chip parallel to the input of a buffer containing a pre-defined concentration of ZnCl2 and pyrithione, a cell membrane permeable Zn2+ ionophore. As detailed in Figure 2C, the two channels meet at a Y-junction where mixing begins, followed by a flow focus junction droplet generator to create water-in-fluorinated-oil droplets stabilized by a fluorinated surfactant. Encapsulated cells pass an initial laser excitation spot to measure the unbound FRET state, R1 and flow along a delay channel outside the field of view. Cells return to the field of view at a later time defined by the channel geometry and input pressures, pass through a second interrogation spot to measure a bound FRET state, R2, with the time between the interrogation spots defining ∆t.
Sorting requires real-time analysis of cellular response based on the fluorescence signals from spatially and temporally separated points in the flow channel. We previously reported a simple post-processing algorithm with a sliding time window and linear velocity distribution for matching the response of each cell at two time-points (i.e. “pair-matching”) using a single pair of donor/acceptor PMTs The successful time-demultiplexing of signals into matched pairs from individual cells in a single PMT-pair arrangement is limited by the number of cells, ncrowd, that occupy the delay channel. The previous system suffers a loss in pair-matching accuracy for ncrowd > 5.33. Here, we implemented new signal collection and signal processing to enable real-time flow analysis and sorting. We spatially separated the signals from the two interrogation points, each of which is then directed into a pair of PMTs. This separation permits the sensor response from each cell to be tracked by a simple time window based pair-matching algorithm implemented on a microcontroller. Additionally, spatially segregated signals eliminate the problem of simultaneous cell arrival events at each interrogation region. This scheme would also generally apply to measurements with a larger number of interrogation beams. In the new scheme, there is no realistic limitation for the algorithm to the number of cells that can occupy the delay channel and is instead affected most by the presence of multiple cells per droplet or cell clumping, in which cell events are either potentially mismatched or must be discarded. In a properly dispersed single-cell emulsion, with the appropriate input cell density and droplet spacing (which is considered in the discussion), pair-matching efficiencies exceed 90% for cells that pass the signal threshold at both interrogation regions (likely due to either photobleaching at spot 1 or the increase in FRET signal due to a FRET change near the signal threshold at spot 2). For this study, ~5% of detected cells were discarded in this manner, with 98% pair-matching efficiency for the remaining events (% of those detected cells at spot 2 that were matched to a previous cell event at spot 1).
A flowchart describing the sorting logic is presented in Figure 3A. Emission from each single cell passing through an interrogation beam is observed to have a near-Gaussian time profile. The peak times are compiled into a histogram. Given the discrete and stable dynamics of droplet generation, there is a narrow distribution of droplet transit times between the two interrogation spots. For an elapsed run time the average time delay is determined from the difference in peak positions of the frequency histogram from spot 1 (from PMT#1) and spot 2 (from PMT#2). An example time-delay histogram is given in Figure 3B. The largest amplitude peak in the histogram, or the most frequent time difference between cells detected, indicates the time delay between interrogation spots. In the event of clusters of cells or frequent multiple cell droplet occupation due to incorrect calculation of input cell density, the timing histogram loses the clean, separated nature of peaks and we observe a broadening in the width of the timing delay, w∆t. This can have a detrimental effect on pair-matching, which stresses the need for single-cell encapsulation, as discussed later. To determine the time delay for a sorting run, a number of cells are screened prior to sorting. Once the time window has been established, every event detected on PMT#2 is checked against the history of PMT#1 peaks and matched if it falls within the established window. As shown in Figure 3A, if no match is made no action is taken. With this process the FRET ratio, R1, at spot 1 can be matched to the ratio, R2, at spot 2 to determine the ∆FRET, R2/R1. This parameter provides a very useful sorting gate because it permits identification and sorting of cells that have a large response, yet do not fall in the lowest portion of the unsaturated population and the highest portion of the saturated population as may be found in a heterogeneous sample such as a library.
Figure 3.
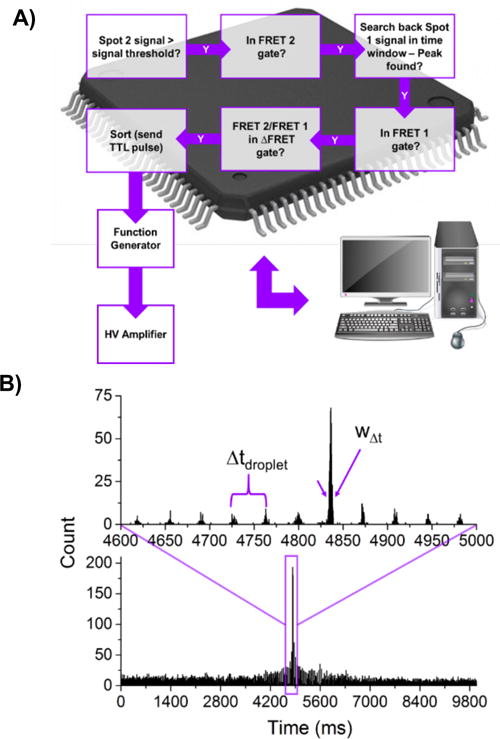
a.) Schematic data flow and sorting logic diagram, and b.) a typical histogram of cell event time differences observed between detection spots with annotations representing the droplet spacing in the time domain, ∆tdroplet, and the width of the delay time measurement, w∆t, around the largest peak which indicates the highest frequency time difference (i.e. time delay) used to determine the pair-matching time window gates. Top graph shows an expanded window of the same data set.
Time-resolved differentiation of ZapCV2/ZapCV5 sensor mixture
To demonstrate the kinetics of response to Zn2+, HeLa cells expressing ZapCV2 and ZapCV5 in the cytosol were run separately and the FRET changes were measured over a range of times achievable in a single device by tuning the input pressure (Figure 4). The rise time of the response does not significantly differ between sensors and is limited by the timescale for the Zn-ionophore complex to diffuse across the cellular membrane and equilibrate with the sensor pool. Sensor expression and hence concentration is similar for both cell lines. At time delays exceeding 5.5 seconds, the population peak FRET values exceed the width of the FRET distributions for reliable separability. Coefficients of variation for the measurements of these sensors are 9% for spot 1 measurements and range from 10-20% for spot 2 measurements.
Figure 4.
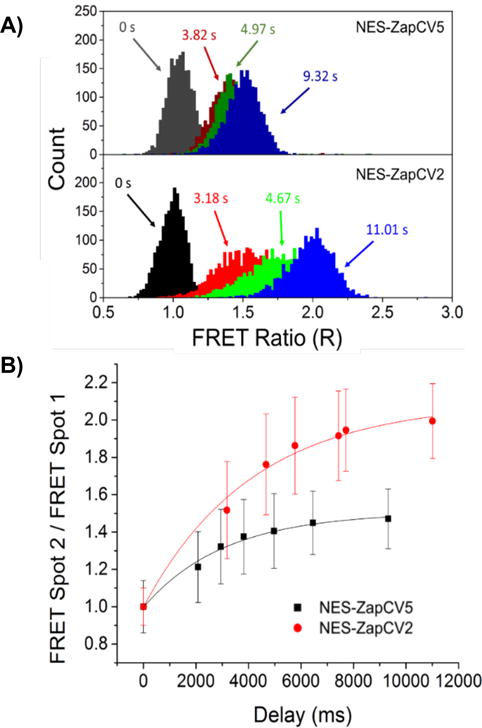
a) Histograms of peak FRET ratio (IFRET/ICFP) distribution for the two Zn2+ sensors at a selection of delay times, ∆t, between interrogation regions (each delay time is represented by a different color) and b) ratio of peak FRET ratio as a function of ∆t. Error bars indicate peak half width. Time points (2000 cells each) were obtained on a single device by varying only the pressure inputs. ∆t = 0 refers to FRET population at FRET spot 1.
Sorting of a mixed population
To verify sorting accuracy, a stable cell line of HeLaS3 cells was constructed in which NES-ZapCV2 was co-expressed with mCherry-NLS (nuclear-localization sequence). The fluorescence of mCherry falls outside the optical window for FRET detection and therefore does not contribute to the response. The two cell lines were mixed in either an 80:20 or 90:10 ratio (NES-ZapCV5:NES-ZapCV2), where cell numbers were estimated using a Neubaur hemocytometer. These mixtures were sorted to a target of 3500 cells over the course of 2 hours to enrich the lower percentage ZapCV2 population. Based on the response kinetics determined previously, the cells were sorted with a time delay of 5.6 seconds to provide a balance of resolution vs. sorting speed. Figure 5 displays a pair-matched scattergram for the sorting experiment with applied gates shown as colored lines and the sorting region shaded in red. After sorting, an aliquot of pre-sorted cells and sorted cells were imaged to quantify the ratio of NLS-mCherry tagged NES- ZapCV2 stable cells versus NES-ZapCV5 stable cells. Cell counts to determine enrichment25 were done manually and indiscernible particles/cells were reported as negatives, therefore reported sorting accuracies are likely artificially low. Example images used for determining sorting accuracy can be found in Figure S-5. Sorting parameters used for the experiments are summarized in the caption of Figure 1. Enrichment information is summarized in Table 1. For an estimation of maximum possible enrichment attainable in this experiment, results shown in Figure 5 were fit to 2D Gaussian peaks to estimate population overlap. We estimate the percent of ZapCV5 cells that match the gates applied to the sorting experiment have an upper bound of 2.5% of the total cells sorted (with 97.5% maximum ZapCV2 sorting potential or a 130-fold enrichment).
Figure 5.
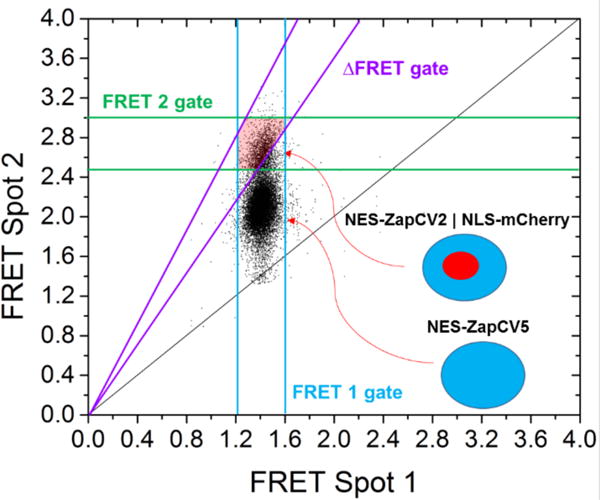
Time resolved pair-matched Ratio Spot 2 vs. Ratio Spot 1 for sensors in HeLaS3 cells (17,000 cells). FRET 1 Gate: 1.21 - 1.60, FRET 2 Gate: 2.50 - 3.00, ∆FRET Gate: 1.75 - 2.50, time delay: 5.6 ± 0.012 seconds with pair-matching gates applied at 5.6 ± 0.020 sec. The region corresponding to the cells sorted with the applied gates is shaded in red. Contour plot shown in Figure S-4.
Table 1.
Cell sorting results demonstrating enrichment of ZapCV2 from an initial mixture of ZapCV2 and ZapCV5. The enrichment, η, is defined as .
| Initial % NES-ZapCV2 | Sorted % NES-ZapCV2 | Enrichment (η) |
|---|---|---|
| 23 | 96 | 75.1 |
| 10 | 92 | 96.3 |
DISCUSSION
We now evaluate the scope of potential applications for this instrument in light of its design and operation characteristics. For quantifying heterogeneity of cellular response and for development of new sensors, measurement precision and number of cells screened per session are important performance metrics that are impacted heavily by the inter-dependent factors influencing droplet generation and loading, the time needed for sensor response (delay time), the timing parameters needed for successful pair-matching, and run-time. These factors in turn determine the sorting rate and accuracy, which are additional considerations for screening and sorting genetic libraries of sensors.
We begin with a discussion of the operational parameters governing droplet generation and the loading of single cells into the droplets, which linearly affects the screening rate of a given device. The factors contributing to droplet control have been discussed previously but will be described here briefly.39 The parameters used in the discussion of device performance are best illustrated in Figures 2 and 3. Droplet spacing, size, and speed can be adjusted by changing the ratio of aqueous inlet pressures to the oil inlet pressure, Pa/Po. Increasing the ratio decreases droplet speed and spacing while increasing droplet size. This control is critical for optimizing throughput while preventing droplet collision at the sorting junction, which causes droplets to incorrectly enter the sorted channel. As discussed later, controlling the droplet spacing is also key to successful sorting. The input cell concentration dramatically impacts both sort throughput and sort accuracy. Droplet occupancy, the average number of cells per droplet, follows Poisson statistics.40 For sorting operations, input cell concentration is chosen to ensure most droplets are empty, which maximizes the probability of single occupation. If the cells are too concentrated (>2×10⁶ cells/mL) such that a large number of droplets are doubly occupied, the sorting throughput decreases as potentially desirable cells will be discarded when gating or potentially undesirable cells will be sorted if one is below the set signal threshold which will decrease sorting purity. At the opposite extreme, the throughput will be low if the cell concentration is decreased (<1×10⁶ cells/mL). Occupancy also depends on the droplet size. Generally, the cell concentration is tuned such that 90% of droplets are unoccupied and therefore < 1% chance double or higher occupancy. For the measurements presented here, with a cell input concentration of ~1-1.5×10⁶ cells/mL, the droplet volume was ~ 200 pL with half of the volume taken by the cell input fraction.
To continue the discussion of throughput and to justify the use of this technique for a range of sensors, it is necessary to point out the factors in determining and setting the delay time for a given microfluidic device. The available range of delay times permitting the screening of alternate sensors that have much faster (> 50 ms) or moderately slower (< 15 sec) kinetics of response is determined by the input pressures and the device geometry. Longer delays are preferably achieved by increasing the length of the channel between the two interrogation regions. The increased output resistance is then compensated with an increase in the fluidic resistance of the input channels. Increasing the delay by decreasing input pressure, necessitates a decrease in fluid speed, which is undesirable because it decreases cell throughput given the limitation in cell concentration that can be used to maintain single cell droplet occupancy. Assuming cell concentration cannot be arbitrarily raised as discussed previously and delay line crowding is not a factor, by increasing the delay channel length, the throughput and delay time both increase. We found that delay channel lengths beyond 250 mm (> 15 seconds delay) pose operational challenges that limit performance. For example, longer channels present more opportunities for pressure fluctuations and vibrations to affect droplet spacing and thus the consistent flow of droplets between interrogation points. This becomes limiting at a point as it requires higher driving pressures to sustain desired time delays and stable flow: irreversible bonding of PDMS to borosilicate glass is rated for ~30-50 PSI input before delamination/failure.41 For the experiments presented in this work, a delay channel of 140 mm was used. Flow speeds in this device are adjustable from 10 mm/s to 250 mm/s with continuous phase driving pressures of 1 – 20 PSI. It should be noted that, while this delay length was chosen for this experiment, several lengths were tested and utilized, from a direct path between interrogation beams as might be ideal for rapid extracellular sensor response to the 250 mm device mentioned above, for sensor screening at a variety of ligand concentrations to observe heterogeneity and response timing. Select examples of device designs and sensor responses observed with other delay lengths can be found in Figure S-6. In adjusting pressures to generate a particular delay time it is important that cells do not dwell in the channel prior to the low FRET interrogation region, as increasing the droplet spacing will slow the aqueous phase flow velocity relative to the continuous phase. It important to limit pre-interrogation exposure to ensure proper assessment of the low FRET state ratio as arbitrarily slowing the flow speed can eventually exceed the time it takes for Zn-pyrithione to penetrate the cell membrane and begin equilibrating with the sensor, causing a rise in response at the first interrogation beam. The mixing times for the small ion-metal complex can be estimated for the short, straight channel after mixing but before droplet generation and we provide simulated results in Figure S-7. In short, within the operating range of flow velocities, mixing is incomplete prior to the cell reaching the droplet generator where cell position becomes highly variable and more complicated advection takes place within the droplet. It is reasonable at this point that the cell experiences saturating ligand concentrations due to the use of ligands concentrations several orders of magnitude above the KD of the sensors and the rise of the sensor response is expected to be dominated by membrane permeation. Under the concentrations and geometry used in this study, no increase in FRET is found for the first spot until flow speeds in the mixing region decrease below 2.5 mm/s or 120 ms spent in the mixing region. In practice, it is best to modulate the input pressure ratio and monitor the low FRET population to verify it does not show an increase at the across the desired delay times.
Lastly, the parameters necessary to obtain successful pair-matching and accurate determination of the timing variables are the most stringent and limiting with regards to throughput and are inextricably linked to the parameters discussed in previous paragraphs. The width of the time window for pair-matching and sorting is limited by the closest spacing between occupied droplets and the timing variation introduced by the cell position in the droplet. The spacing between droplets can be increased by increasing the pressure of the oil input to provide a time interval during which a cell event is not detected. The key to successful pair-matching is to maintain a droplet spacer larger than the variation in cell arrival time. The largest contributor to this variation is typically the variation in cell position in the droplet along the axis of flow. This spatial variation increases with the size of the droplet. For constant volume, the timing width scales linearly with the droplet speed. At the sorting speeds employed here, the contribution from cell position in the timing width is about 3 ms at 25 mm/s and a 5.6 s delay. Droplet spacing in the time domain is typically 15 ms or greater, owing to the large spacing required to prevent droplet collision at the sorting junction. This generally limits our potential cell sorting rates to < 7 s−1 at our cell concentrations and desired droplet occupation frequency (~9 %). For shorter delay lengths, faster responding sensors (i.e. extracellular sensors), and less stringent sorting accuracy the cell throughput can be raised.
A potentially powerful application of this instrument would be screening a library of sensors in mammalian cells and selecting winning sensors based on direct measurement of sensor response in the target environment of interest (i.e. mammalian cells). This could be accomplished by generating a library of sensor plasmids with mutations specifically targeting linker and ligand binding domains, and incorporating the library into mammalian cells by viral transduction. A low multiplicity of infection could be used to ensure that each mammalian cell is statistically likely to be infected by a single virion, and hence express only a single library member.42 Transduced cells could then be enriched, if necessary, by FACS or antibiotic selection markers. This heterogeneous population of cells, each expressing a single library clone, could then be screened with our instrument for ligand response. The diversity of FRET responses within a library is likely to far exceed the difference between the two sensors in the mixture reported here. Cells that respond above a designated threshold could be collected and analyzed for high dynamic range clones. Depending on the nature of the reagents, the cells could then be expanded and subjected to additional rounds of sorting or, if the reagent treatment renders cells non-viable, DNA could be immediately extracted and analyzed by deep sequencing.43,44 The sorter is set up to run with minimal interference for several hours with sorting rates typically on the order of 2-5 s−1, or up to 20,000 hr−1, facilitating the screening of libraries on the order of 104 with several-fold coverage over a run time of a few hours.
While the throughput is inherently limited by the timing parameters required to successfully make a measurement, we remark that it is orders of magnitude faster than the equivalent throughput for screening large numbers sensor variants in mammalian cells. This contrasts droplet technology for single time point fluorescence interrogation, which approaches FACS-like speeds on the order of kHz cell throughputs.28 Our instrument is comparable of sorting speeds on the order of 1-10 s−1 and 50-150 fold enrichment found in technologies utilizing optical trapping, electro-osmosis, and hydrodynamic mechanisms for cell sorting.45–52 Low coefficients of variation < 20% are achievable, likely due to the consistent and fast exposure each cell experiences to the saturating ligand and ionophore complex. This offers an improvement to the plate-based technologies for FRET sensors mentioned in the introduction.
CONCLUSIONS
This work presents a cell sorter for the screening and enrichment of biological systems that exhibit transient intensity signal or ratiometric signal changes on a millisecond to second timescale. Due to the flexibility of microfluidic technology, the idea can be easily extended to other systems that do not require mixing steps, but rather other methods of signal modulation (i.e. optical photoswitching or clustering events) or require more time points.
Supplementary Material
Acknowledgments
This work was supported by the NSF Physics Frontier Center at JILA, NIH R01 GM084027 (to A.E.P), and K99/R00 EB017289 (to Y.Q.). K.P.C. was supported by T32GM008732. RJ is a staff member in the Quantum Physics Division of the National Institute of Standards and Technology (NIST). Certain commercial equipment, instruments, or materials are identified in this paper in order to specify the experimental procedure adequately. Such identification is not intended to imply recommendation or endorsement by the NIST, nor is it intended to imply that the materials or equipment identified are necessarily the best available for the purpose.
Footnotes
Supporting information is available free of charge on the ACS publications website.
AUTHOR CONTRIBUTIONS
The manuscript was written with contributions from all authors. All authors have given approval to the final version of the manuscript.
References
- 1.Tsien RY. Annu Rev Biochem. 1998;67:509–544. doi: 10.1146/annurev.biochem.67.1.509. [DOI] [PubMed] [Google Scholar]
- 2.Frommer WB, Davidson MW, Campbell RE. Chem Soc Rev. 2009;38:2833. doi: 10.1039/b907749a. [DOI] [PMC free article] [PubMed] [Google Scholar]
- 3.Sample V, Mehta S, Zhang J. J Cell Sci. 2014;127:1151–1160. doi: 10.1242/jcs.099994. [DOI] [PMC free article] [PubMed] [Google Scholar]
- 4.Newman RH, Fosbrink MD, Zhang J. Chem Rev. 2011;111:3614–3666. doi: 10.1021/cr100002u. [DOI] [PMC free article] [PubMed] [Google Scholar]
- 5.Palmer AE, Qin Y, Park JG, McCombs JE. Trends Biotechnol. 2011;29:144–152. doi: 10.1016/j.tibtech.2010.12.004. [DOI] [PMC free article] [PubMed] [Google Scholar]
- 6.Matsu-ura T, Michikawa T, Inoue T, Miyawaki A, Yoshida M, Mikoshiba K. J Cell Biol. 2006;173:755–765. doi: 10.1083/jcb.200512141. [DOI] [PMC free article] [PubMed] [Google Scholar]
- 7.Nausch LWM, Ledoux J, Bonev AD, Nelson MT, Dostmann WR. Proc Natl Acad Sci U S A. 2008;105:365–370. doi: 10.1073/pnas.0710387105. [DOI] [PMC free article] [PubMed] [Google Scholar]
- 8.Russwurm M, Mullershausen F, Friebe A, Jäger R, Russwurm C, Koesling D. Biochem J. 2007;407:69–77. doi: 10.1042/BJ20070348. [DOI] [PMC free article] [PubMed] [Google Scholar]
- 9.Cano Abad MF, Di Benedetto G, Magalhães PJ, Filippin L, Pozzan T, Abad MFC. J Biol Chem. 2004;279:11521–11529. doi: 10.1074/jbc.M306766200. [DOI] [PubMed] [Google Scholar]
- 10.Wang W, Fang H, Groom L, Cheng A, Zhang W, Liu J, Wang X, Li K, Han P, Zheng M, Yin J, Wang W, Mattson MP, Kao JPY, Lakatta EG, Sheu S-S, Ouyang K, Chen J, Dirksen RT, Cheng H. Cell. 2008;134:279–290. doi: 10.1016/j.cell.2008.06.017. [DOI] [PMC free article] [PubMed] [Google Scholar]
- 11.Chen T-W, Wardill TJ, Sun Y, Pulver SR, Renninger SL, Baohan A, Schreiter ER, Kerr RA, Orger MB, Jayaraman V, Looger LL, Svoboda K, Kim DS. Nature. 2013;499:295–300. doi: 10.1038/nature12354. [DOI] [PMC free article] [PubMed] [Google Scholar]
- 12.Abdelfattah AS, Farhi SL, Zhao Y, Brinks D, Zou P, Ruangkittisakul A, Platisa J, Pieribone VA, Ballanyi K, Cohen AE, Campbell RE. J Neurosci. 2016;36:2458–2472. doi: 10.1523/JNEUROSCI.3484-15.2016. [DOI] [PMC free article] [PubMed] [Google Scholar]
- 13.Taslimi A, Vrana JD, Chen D, Borinskaya S, Mayer BJ, Kennedy MJ, Tucker CL. Nat Commun. 2014;5:4925. doi: 10.1038/ncomms5925. [DOI] [PMC free article] [PubMed] [Google Scholar]
- 14.Taslimi A, Zoltowski B, Miranda JG, Pathak GP, Hughes RM, Tucker CL. Nat Chem Biol. 2016;5:425–430. doi: 10.1038/nchembio.2063. [DOI] [PMC free article] [PubMed] [Google Scholar]
- 15.Beumer T, Lenssinck H, Pennings A, Haanen C. Cytometry. 1984;5(6):648–651. doi: 10.1002/cyto.990050615. [DOI] [PubMed] [Google Scholar]
- 16.Scampavia LD, Blankenstein G, Ruzicka J, Christian GD. Anal Chem. 1995;67:2743–2749. doi: 10.1021/ac00113a004. [DOI] [PubMed] [Google Scholar]
- 17.Blankenstein G, Scampavia LD, Ruzicka J, Christian GD. Cytometry. 1996;25:200–204. doi: 10.1002/(SICI)1097-0320(19961001)25:2<200::AID-CYTO9>3.0.CO;2-K. [DOI] [PubMed] [Google Scholar]
- 18.Nolan JP, Posner RG, Martin JC, Habbersett R, Sklar LA. Cytometry. 1995;21:223–229. doi: 10.1002/cyto.990210302. [DOI] [PubMed] [Google Scholar]
- 19.Litzlbauer J, Schifferer M, Ng D, Fabritius A, Thestrup T, Griesbeck O. PLoS One. 2015;10:e0119860. doi: 10.1371/journal.pone.0119860. [DOI] [PMC free article] [PubMed] [Google Scholar]
- 20.Ibraheem A, Yap H, Ding Y, Campbell RE. BMC Biotechnol. 2011;11:105. doi: 10.1186/1472-6750-11-105. [DOI] [PMC free article] [PubMed] [Google Scholar]
- 21.Belal ASF, Sell BR, Hoi H, Davidson MW, Campbell RE. Mol Biosyst. 2014;10:191–195. doi: 10.1039/c3mb70402e. [DOI] [PubMed] [Google Scholar]
- 22.Zhao YY, Abdelfattah AS, Zhao YY, Ruangkittisakul A, Ballanyi K, Campbell RE, Harrison DJ. Integr Biol. 2014;6:714. doi: 10.1039/c4ib00039k. [DOI] [PubMed] [Google Scholar]
- 23.Chabosseau P, Tuncay E, Meur G, Bellomo EA, Hessels A, Hughes S, Johnson PRV, Bugliani M, Marchetti P, Turan B, Lyon AR, Merkx M, Rutter GA. ACS Chem Biol. 2014;9:2111–2120. doi: 10.1021/cb5004064. [DOI] [PMC free article] [PubMed] [Google Scholar]
- 24.Teh S-Y, Lin R, Hung L-H, Lee AP. Lab Chip. 2008;8:198. doi: 10.1039/b715524g. [DOI] [PubMed] [Google Scholar]
- 25.Mazutis L, Gilbert J, Ung WL, Weitz DA, Griffiths AD, Heyman JA. Nat Protoc. 2013;8:870–891. doi: 10.1038/nprot.2013.046. [DOI] [PMC free article] [PubMed] [Google Scholar]
- 26.Clausell-Tormos J, Lieber D, Baret J-C, El-Harrak A, Miller OJ, Frenz L, Blouwolff J, Humphry KJ, Köster S, Duan H, Holtze C, Weitz DA, Griffiths AD, Merten CA. Chem Biol. 2008;15:427–437. doi: 10.1016/j.chembiol.2008.04.004. [DOI] [PubMed] [Google Scholar]
- 27.Agresti JJ, Antipov E, Abate AR, Ahn K, Rowat AC, Baret J-C, Marquez M, Klibanov AM, Griffiths AD, Weitz DA. Proc Natl Acad Sci. 2010;107:4004–4009. doi: 10.1073/pnas.0910781107. [DOI] [PMC free article] [PubMed] [Google Scholar]
- 28.Baret J-C, Miller OJ, Taly V, Ryckelynck M, El-Harrak A, Frenz L, Rick C, Samuels ML, Hutchison JB, Agresti JJ, Link DR, Weitz Da, Griffiths AD. Lab Chip. 2009;9:1850–1858. doi: 10.1039/b902504a. [DOI] [PubMed] [Google Scholar]
- 29.Clausell-Tormos J, Griffiths AD, Merten CA. Lab Chip. 2010;10:1302–1307. doi: 10.1039/b921754a. [DOI] [PubMed] [Google Scholar]
- 30.Frenz L, Blank K, Brouzes E, Griffiths AD. Lab Chip. 2009;9:1344–1348. doi: 10.1039/b816049j. [DOI] [PMC free article] [PubMed] [Google Scholar]
- 31.Huebner A, Olguin LF, Bratton D, Whyte G, Huck WTS, de Mello AJ, Edel JB, Abell C, Hollfelder F. Anal Chem. 2008;80:3890–3896. doi: 10.1021/ac800338z. [DOI] [PubMed] [Google Scholar]
- 32.Huebner A, Srisa-Art M, Holt D, Abell C, Hollfelder F, DeMello AJ, Edel JB. Chem Commun (Camb) 2007;2:1218–1220. doi: 10.1039/b618570c. [DOI] [PubMed] [Google Scholar]
- 33.Ma H, Gibson EA, Dittmer PJ, Jimenez R, Palmer AE. J Am Chem Soc. 2012;134:2488–2491. doi: 10.1021/ja2101592. [DOI] [PMC free article] [PubMed] [Google Scholar]
- 34.Cristobal G, Benoit J-P, Joanicot M, Ajdari A. Appl Phys Lett. 2006;89(3):34104. [Google Scholar]
- 35.Lubbeck JL, Dean KM, Ma H, Palmer AE, Jimenez R. Anal Chem. 2012;84:3929–3937. doi: 10.1021/ac202825z. [DOI] [PMC free article] [PubMed] [Google Scholar]
- 36.Qin Y, Dittmer PJ, Park JG, Jansen KB, Palmer AE. Proc Natl Acad Sci U S A. 2011;108:7351–7356. doi: 10.1073/pnas.1015686108. [DOI] [PMC free article] [PubMed] [Google Scholar]
- 37.Miranda JG, Weaver AL, Qin Y, Park JG, Stoddard CI, Lin MZ, Palmer AE. PLoS One. 2012;7:e49371. doi: 10.1371/journal.pone.0049371. [DOI] [PMC free article] [PubMed] [Google Scholar]
- 38.Park JG, Qin Y, Galati DF, Palmer AE. ACS Chem Biol. 2012;7:1636–1640. doi: 10.1021/cb300171p. [DOI] [PMC free article] [PubMed] [Google Scholar]
- 39.Abate AR, Ahn K, Rowat AC, Baret C, Marquez M, Klibanov AM, Grif AD, Weitz DA, Aga GAL. Proc Natl Acad Sci. 2010;107:6550–6550. doi: 10.1073/pnas.0910781107. [DOI] [PMC free article] [PubMed] [Google Scholar]
- 40.Collins DJ, Neild A, DeMello A, Liu A-Q, Ai Y. Lab Chip. 2015;15:3439–3459. doi: 10.1039/c5lc00614g. [DOI] [PubMed] [Google Scholar]
- 41.McDonald JC, Duffy DC, Anderson JR, Chiu DT, Wu H, Schueller OJ, Whitesides GM. Electrophoresis. 2000;21:27–40. doi: 10.1002/(SICI)1522-2683(20000101)21:1<27::AID-ELPS27>3.0.CO;2-C. [DOI] [PubMed] [Google Scholar]
- 42.Dean KM, Davis LM, Lubbeck JL, Manna P, Friis P, Palmer AE, Jimenez R. Anal Chem. 2015;87:5026–5030. doi: 10.1021/acs.analchem.5b00607. [DOI] [PMC free article] [PubMed] [Google Scholar]
- 43.Matochko WL, Chu K, Jin B, Lee SW, Whitesides GM, Derda R. Methods. 2012;58:47–55. doi: 10.1016/j.ymeth.2012.07.006. [DOI] [PubMed] [Google Scholar]
- 44.Glanville J, D’Angelo S, Khan TA, Reddy ST, Naranjo L, Ferrara F, Bradbury ARM. Curr Opin Struct Biol. 2015;33:146–160. doi: 10.1016/j.sbi.2015.09.001. [DOI] [PMC free article] [PubMed] [Google Scholar]
- 45.Sung Hwan Cho, Chen CH, Tsai FS, Yu-Hwa Lo. 2009 Annual International Conference of the IEEE Engineering in Medicine and Biology Society. IEEE; 2009. pp. 1075–1078. [DOI] [PMC free article] [PubMed] [Google Scholar]
- 46.Davis LM, Lubbeck JL, Dean KM, Palmer AE, Jimenez R. Lab Chip. 2013;13:2320–2327. doi: 10.1039/c3lc50191d. [DOI] [PMC free article] [PubMed] [Google Scholar]
- 47.Fu AY, Spence C, Scherer A, Arnold FH, Quake SR. Nat Biotechnol. 1999;17:1109–1111. doi: 10.1038/15095. [DOI] [PubMed] [Google Scholar]
- 48.Wolff A, Perch-Nielsen IR, Larsen UD, Friis P, Goranovic G, Poulsen CR, Kutter JP, Telleman P. Lab Chip. 2003;3:22–27. doi: 10.1039/b209333b. [DOI] [PubMed] [Google Scholar]
- 49.Wang MM, Tu E, Raymond DE, Yang JM, Zhang H, Hagen N, Dees B, Mercer EM, Forster AH, Kariv I, Marchand PJ, Butler WF. Nat Biotechnol. 2005;23:83–87. doi: 10.1038/nbt1050. [DOI] [PubMed] [Google Scholar]
- 50.Dittrich PS, Schwille P. Anal Chem. 2003;75:5767–5774. doi: 10.1021/ac034568c. [DOI] [PubMed] [Google Scholar]
- 51.Dolega ME, Jakiela S, Razew M, Rakszewska A, Cybulski O, Garstecki P. Lab Chip. 2012;12:4022. doi: 10.1039/c2lc40174f. [DOI] [PubMed] [Google Scholar]
- 52.Fu AY, Chou HP, Spence C, Arnold FH, Quake SR. Anal Chem. 2002;74:2451–2457. doi: 10.1021/ac0255330. [DOI] [PubMed] [Google Scholar]
Associated Data
This section collects any data citations, data availability statements, or supplementary materials included in this article.