

Abstract
Smooth muscle cell (SMC) heterogeneity plays an important role in vascular remodeling, a life-threatening hallmark of many vascular diseases. However, the characterization of SMCs at the single cell level is stymied by drawbacks of contemporary single-cell protein measurements, including antibody probe cross-reactivity, chemical fixation artifacts, limited isoform-specific probes, low multiplexing and difficulty sampling cells with irregular morphologies. To scrutinize healthy vessels for subpopulations of SMCs with proliferative-like phenotypes, we developed a high-specificity, multiplexed single-cell immunoblot for unfixed, uncultured primary cells. We applied our assay to demonstrate maturation stage profiling of aortic SMCs freshly isolated from individual mice. After ensuring unbiased sampling of SMCs (80 – 120 µm in length), we performed single-SMC electrophoretic protein separations, which resolve protein signal from off-target antibody binding, and immunoblotted for differentiation markers α-SMA, CNN-1 and SMMHC (targets ranging from 34 kDa to 227 kDa). We identified a subpopulation of immature-like SMCs, supporting the recently-established mechanism that only a subset of SMCs is responsible for vascular remodeling. Furthermore, the low sample requirements of our assay enable single-mouse resolution studies, which minimizes animal sacrifice and experimental costs while reporting animal-to-animal phenotypic variation, essential for achieving reproducibility and surmounting the drawbacks of pooling primary cells from different animals.
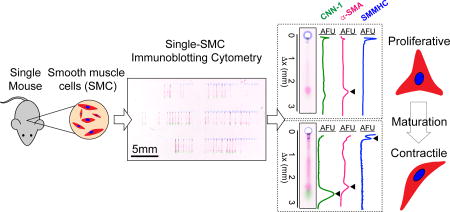
Graphical abstract
Introduction
Understanding cell-to-cell phenotypic heterogeneity is crucial for elucidating the biological mechanisms of multicellular organisms.1 Currently, the most prevalent single-cell studies involve transcriptomic analysis of cultured cells, which are readily available and can be expanded without limitation.2–4 However, culturing cells often leads to the loss of their in vivo molecular phenotype.2,5 Furthermore, while single-cell nucleic acid tools have led to tremendous advances, mRNA levels do not necessarily correlate with protein expression.6 Immunofluorescence (IF) is the de facto standard for detecting and measuring protein expression of unmodified endogenous proteins in primary single cells.7–9 Although invaluable, quantitative IF presents major drawbacks. Variable non-specific background signal results from ubiquitous antibody cross-reactivity10,11, and accessing intracellular markers with antibody probes requires fixation of cells, which introduces critical artifacts, including epitope masking, changes in cell morphology and disruption of molecular binding events due to generation of diffusional gradients as fixation occurs.12,13 Furthermore, image analysis algorithms used to segment tissue micrographs into individual cells yield variable results when cell morphologies are complex14, when borders between cells are low-contrast15 or when samples contain crowded cells, such as the closely associated SMCs in the blood vessel wall.9,16,17 Other widely used techniques that release cells from tissues, such as fluorescence activated cell sorting (FACS), also suffer from low antibody selectivity and require large sample sizes (thousands to millions of cells), often requiring pooling of samples from multiple animals. Although sample pooling can help reach these high sample requirements, it can also lead to: (a) biological averaging, where the assumption that protein expression in the pooled sample is equivalent to the mean of individual samples does not hold for all genes, (b) variance reduction, where sample pooling can hide relevant biological variance, and (c) dilution effects, where proteins showing high expression in individual samples can be diluted or lost when pooling with other samples.18–20 Consequently, a critical gap exists in high-selectivity, single-cell resolution protein analysis tools suitable for profiling of sparingly available primary cells from a single donor.
In the field of vascular biology, single-cell IF studies of mouse aortas revealed an important milestone in our understanding of vascular remodeling. Vascular remodeling is the disruption of the discrete layers of blood vessels due to the abnormal proliferation of vascular smooth muscle cells (SMCs), and is a hallmark of numerous vascular diseases such as hypertension, diabetic macroangiopathy and atherosclerosis.21–24 The established paradigm depicted SMCs as a homogeneous population exhibiting high contractility and low proliferation, that in response to injury, de-differentiate into a proliferative phenotype.5 However, this generally accepted theory was recently challenged by IF studies that discovered a subpopulation of SMCs with proliferative capabilities.25 In these studies, culturing primary SMCs revealed that only a subset of cells is capable of proliferating, and that this subpopulation of proliferative SMCs has a distinct phenotype in their native tissue; high expression of early stage differentiation marker α smooth muscle actin (α-SMA), and low or negative expression of middle and late-stage differentiation markers calponin 1 (CNN-1) and smooth muscle myosin heavy chain (SMMHC), respectively. Lineage tracing studies of blood vessels in transgenic mice further confirmed that proliferation of the smooth muscle layer is not a unified and escalating process among SMCs, as previously speculated, but results from the proliferation of just one or two single SMCs.26,27 Given this paradigm shift, new questions arise over whether these proliferative SMCs exist as a subpopulation in the healthy vessel wall, as well as whether this subset of SMCs can be characterized through protein expression of key markers. Endeavoring to answer these questions requires that primary SMCs be derived and directly analyzed from tissue for single-cell protein expression profiles. However, no single-cell technique capable of analyzing the heterogeneity of SMCs in native blood vessels addresses the challenges of (a) low antibody selectivity or (b) low sample availability.
To enhance selectivity beyond IF, researchers commonly perform an electrophoretic protein separation, which separates proteins by molecular mass, upstream of immunoassays. This assay, known as an immunoblot or western blot, spatially resolves proteins to discriminate signal contributions by molecular mass. Although western blots grant superior selectivity compared to IF, until recently the assay has lacked the analytical sensitivity needed for single-cell resolution.9 Microfluidic technologies have advanced single-cell measurement capabilities by working with micrometer scales suitable for handling minute sample volumes, comparable to the size of single cells.28 We recently introduced microfluidic single-cell lysate electrophoresis (EP) and immunoblotting for highly specific protein measurements.29–32 However, existing systems have been primarily designed for spherical cell morphologies, and use gravity-based settling9,29–32 and/or use cell-isolation in microwells for cell selection by size to ensure one-cell-per-microwell occupancies.32,33 Analysis of primary cells is hindered by low sample availability and non-spherical cellular morphologies.
To directly analyze SMC heterogeneity in native blood vessels at the single-cell level, we designed an assay for high-specificity protein profiling of primary cells. We applied our assay to freshly-isolated murine aortic SMCs in search of distinct subpopulations, to support or refute the existence of cells that are preconditioned to proliferate in response to injury. We assayed SMCs for markers α-SMA, CNN-1 and SMMHC, characterizing early, middle and late differentiation stages. We demonstrate high-selectivity measurements of protein expression in sparse cell populations (starting cell populations of 100s of SMCs) to report single-SMC profiling of individual mouse aortas, eliminating the need for sample pooling or cell expansion through in vitro culture. The straightforward integration of the microfluidic device with ubiquitous micromanipulation systems shows promise as a widespread bioanalytical method in biological laboratories.
Materials and methods
Chemical reagents
Tetramethylethylenediamine (TEMED, T9281), ammonium persulfate (APS, A3678), β-mercaptoethanol (M3148), and 30%T, 2.7%C acrylamide/bis-acrylamide (37.5:1) (A3699), bovine serum albumin (BSA, A9418) were purchased from Sigma-Aldrich. Triton X-100 (BP-151), phosphate-buffered saline (PBS, ph 7.4, 10010023) and Dulbeccos’s phosphate-buffered saline (PBS, 14190144) were purchased from ThermoFisher Scientific. Premixed 10X tris-glycine EP buffer (25 mM Tris, pH 8.3; 192 mM glycine; 0.1% SDS) was purchased from BioRad. Tris buffered saline with Tween-20 (prepared from 20X TBST, sc-24953, Santa Cruz Biotechnology, Dallas, TX, USA). Deionized water (18.2 MΩ) was obtained using an Ultrapure water system from Millipore. N-[3-[(3-Benzoylphenyl)formamido]propyl] meth- acrylamide (BPMAC) was custom synthesized by Pharm-Agra Laboratories (Brevard, NC, USA).
Device Fabrication
Devices were fabricated using SU-8 wafers as previously reported.30 Microwells were 100 µm in diameter and 80 µm deep. Each device was fabricated with an array of 120 microwells, with lateral spacing between microwells of 1 mm, and vertical spacing of 5 mm. The 5-mm gaps served as the separation lane length. Polyacrylamide precursor solution (7%T acrylamide/bis-acrylamide, 3 mM BPMAC) was chemically polymerized with 0.08% APS and 0.08% TEMED.
Enzymatic digestion of mouse aorta to dissociate SMCs
All experimental procedures with mice were approved by the ACUC committee at UC Berkeley and carried out according to institutional guidelines. All efforts were made to minimize the suffering and number of animals used. Before experiments, SMMHC-CreERT2/LoxP-tdTomato adult mice were given daily intraperitoneal injections of 2 µg of tamoxifen in 100 µL of corn oil for 5 days and used for analysis a week afterward. Mice were euthanized via CO2 exposure with a CO2 flow rate of 2 L/min for 5 min. Mice were then inspected for cessation of movement and respiration for at least 1 min. A secondary form of euthanasia, cervical dislocation, was performed. After harvesting, the aorta was submerged in a dish of cold sterile PBS and stripped of the outer tunica adventitia layer consisting of fibroblasts and connective tissue. The inner endothelial cell layer was denudated by passing the rounded tip of a surgical wire through the vessel back and forth 3 times. The remaining tunica media layer comprised of smooth muscle cells (SMCs) was cut into short segments and placed in a microcentrifuge tube filled with cold sterile PBS. To isolate SMCs from the aorta, the vessel segments were first incubated in a solution of 1 mg/mL collagenase in DPBS containing calcium and magnesium for 10 min. The solution was then discarded, as preliminary digestion of the aorta with collagenase served to minimize contamination of SMCs by other cell types. Next, the aorta was incubated in a solution of 1 mg/mL collagenase and 0.125 mg/mL elastase in DPBS containing calcium and magnesium. During digestion, the aorta was agitated on an orbital shaker set to 50 rpm at 37 °C for 50 min. The solution was pipetted up and down to further disperse the digested extracellular matrix and spun down at 1500 rpm for 5 min. The cell pellet was then resuspended in PBS and passed through a cell strainer with 40 µm pores to remove ECM debris and cell clusters.
Cell settling & single-cell lysate separations
The final cell suspension contained ~1,000 tdTomato-positive SMCs, 50–100 of which were sampled into each device, depending on whether SMCs from one or two mice were sampled onto the same chip
To place single tdTomato-expressing SMC into microwells, we used a micromanipulator (Transferman®, Eppendorf, Germany) under an inverted epifluorescence microscope (Zeiss AxioObserver, Carl Zeiss MicroImaging GmbH, Germany). In situ cell lysis was performed by pouring lysis buffer (25 mM Tris-glycine buffer at pH 8.3 with 1% SDS, 0.5% sodium deoxycholate, and 1% Triton X-100) warmed to 55°C. An electric field (E = 40 V / cm) was applied to separate the proteins (PowerPac™ Basic Power Supply, Bio-Rad Laboratories). Protein bands were immobilized by UV activation of the benzophenone moieties (Lightningcure LC5, Hamamatsu, Japan). Slides were probed with antibodies and scanned with a fluorescence microarray scanner (Genepix 4300A, Molecular Devices, CA, USA).
Antibodies
Antibodies employed for analysis of SMCs include: rabbit anti-β-Tubulin (ab6046), mouse anti-SMMHC (ab683), mouse anti-α-SMA (ab7817), rabbit anti-CNN-1 (ab46794) from Abcam, Cambridge, MA. Donkey secondary antibodies AlexaFluor 647-conjugated anti-mouse (A31571), AlexaFluor 594-conjugated anti-mouse (A21203) and AlexaFluor 488-conjugated anti-rabbit (A21206) were purchased from ThermoFisher Scientific CA, USA. All antibodies were used at 1:10 dilution in 2% BSA in TBST.
Image processing, separation performance quantification, statistical analysis and clustering
Quantification of fluorescence signal in protein blots employed in-house scripts written in MATLAB (R2017a, Mathworks). Parameters such as peak location and peak width were obtained by fitting Gaussian curves to protein bands using MATLAB’s Curve Fitting Toolbox. Gamma distribution fitting, goodness of fit tests, agglomerative hierarchical clustering, and clustergram heatmap rendering were performed with the Matlab Statistics and Machine Learning Toolbox. Statistical tests (d’Agostino & Pearson normality tests, Mann Whitney U tests) were performed using GraphPad Prism 7.0b. Fiji was used to false-color fluorescence micrographs and overlay channels to create composite images. Any differences in final cell number reported per mouse arise from the sampling step (i.e., the number of SMCs initially sampled onto the device) and post-assay analysis of immunoblots, where some separation lanes contained particulates that prevented accurate Gaussian fitting and area-under-the-curve-analysis of the fluorescence intensity profile.
Results and discussion
Design of a single-cell tool for scrutinizing the maturation stage of primary SMCs
Differentiation of SMCs into a mature, contractile state can be traced by three maturation markers: α-SMA, CNN-1 and SMMHC (Fig. 1A). To overcome artifacts introduced by poor antibody selectivity when measuring endogenous proteins, we designed a workflow for assaying primary SMCs that prepends a molecular mass-based separation to the immunoaffinity measurements.
Fig. 1.

Immunoblotting cytometry profiles aortic SMCs freshly dissociated from a single mouse aorta. (A) Schematic of SMC differentiation. Onset of expression of three proteins mark the differentiation of SMCs to contractile phenotype (α-SMA, CNN-1 and SMMHC). (B) Schematic of cell isolation and sampling. The aorta of a single mouse is enzymatically digested. tdTomato-positive aortic SMCs are then placed with a micromanipulator into microwells (100 µm diameter) of a thin polyacrylamide (PA) gel (80 µm height) grafted onto a glass microscope slide. (C) Fluorescence micrographs of freshly isolated tdTomato-positive SMCs in cell suspension (left) and sampled into microwells (right). Arrows indicate SMCs, microwells are traced with dashed line. Scale bars are 100 µm. (D) Immunoblotting cytometry stages. SMCs are lysed and solubilized proteins are electrophoresed across the PA gel layer by application of an electric field. UV light immobilizes migrated proteins into the PA gel by activation of photoactive benzophenone methacrylamide moeities in the gel matrix. Gel is incubated with solutions of fluorescently- labeled antibodies and area-under-the-curve (AUC) analysis is performed on protein band fluorescence intensity profiles to quantify protein expression. (E) On left, false-colored micrograph of PA gel immunoprobed for all three differentiation markers, from which a single separation lane is shown (center) along with corresponding fluorescence intensity profiles. Black arrows mark position of protein bands and peaks. On right, clustergram of α-SMA, CNN-1 and SMMHC expression for all single SMCs analyzed from an individual mouse. Asterisks mark subpopulations identified and mapped back to maturation stage in panel (A).
The SMC analysis workflow (Fig. 1B) begins with isolation of SMCs from the aorta of one mouse. Enzymatically dissociated SMCs are then sampled into individual microwells patterned onto a thin (80 µm) polyacrylamide (PA) gel layer using a micromanipulator (Fig. 1B). Care was taken to ensure unbiased sampling of SMCs into microwells. Namely, cells were sampled if they appeared as a completely dissociated individual cell, independently of their size (Fig. 1C). Furthermore, to prevent contamination of microwells with other vascular cell types, we used transgenic mice labeled with tdTomato under the control of the SMMHC promoter (specific for SMCs) and fluorescence microscopy to select only tdTomato-positive cells. If the use of non-transgenic mice is required, the multiplexing capability of the immunoblot allows for probing of cell-specific markers to rule out contamination with other cell types.
With a buffer exchange step, settled SMCs are treated with ionic and non-ionic detergents to achieve in situ cell lysis and protein solubilization (Fig. 1D). Application of an electric field causes injection of proteins through the PA gel interface at the microwell wall and migration of proteins through the sieving gel matrix. Each microwell has an associated 5 mm long separation lane, or area of gel in which proteins are separated by molecular mass. Exposure to UV light activates benzophenone methacrylamide moieties incorporated in the hydrogel matrix, which covalently capture the separated proteins. Covalent protein immobilization facilitates the buffer exchanges necessary for immunoprobing, while minimizing dilution and protein losses. Area-under-the-curve (AUC) analysis of proteins bands is performed to quantify expression of SMC maturation markers and allows identification of SMC subpopulations based on variable expression of α-SMA, CNN-1 and SMMHC (Fig. 1E). We verified a log-linear relation between protein molecular mass and migration distance (R2 = 0.99), consistent with SDS-PAGE separations (Fig. S1), and achieved separation of proteins with molecular mass range of 34 to 227 kDa. To assess cross-contamination between immunoblots on neighboring microwells, immunoblotting of the contents of empty microwells are employed as negative controls. For all devices, we observed no detectable immunoblot signal for the microwells with zero cells per microwell occupancy (Fig. S2). To facilitate investigating inter-mouse and intra-mouse heterogeneity in SMC maturation stage, the workflow is designed to assay single-SMCs from starting populations of just 100s of SMCs from a single mouse aorta.
Microfluidic Cell Preparation and Immunoblot Development for Single-SMC Lysate
To enable profiling of SMC differentiation stage, we designed our single-cell immunoblot to address a pair of contradictory constraints, namely, the need to minimize dilution of protein lysate while: (a) providing microwell geometries that are large enough for isolation of large, anisotropic SMCs, and (b) providing sufficient protein solubilization and EP durations to size large molecular mass maturation marker proteins.
In satisfying our first constraint on microwell geometry and lysate dilution, we observed that primary SMCs conserved their spindle-shaped morphology and displayed a range of cell lengths (80 to 120 um) (Fig. 2A). To isolate individual cells, cylindrical microwells are well-suited for capturing spherical cells of similar diameters, such as isolation of cells from suspensions of dissociated cultured cells. Size exclusion from the microwells ensures occupancies of one-cell-per-microwell30. However, settling spindle-shaped SMCs into cylindrical microwells requires large microwell diameters to accommodate the long axis of the SMCs, which leads to settling of multiple SMCs into the same microwell. We discarded the use of non-cylindrical microwells, such as a projection of an oblong feature, as these would reduce the probability of sampling due to limited ability to orient cells during sedimentation. To ensure one-cell-per-microwell occupancies, we actively seated individual SMCs into microwells using a micromanipulator, following established protocols for microtransfer of single cells.33,34 We observed micromanipulation allowed seating all SMCs in a minimum microwell diameter of 100 µm, where cell deformability and microwell height (80 µm) aided in settling SMCs with lengths exceeding 100 µm.
Fig. 2.

Numerical simulation of protein losses during lysis and EP determine final concentrations of target markers remain above the LOD. (A) Histogram of SMC length (N = 105). Fluorescence micrographs show representative tdTomato-tagged SMCs with lengths of 60 µm, 70 µm and 100 µm. Scale bars are 50 µm. (B) Numerical simulation of CNN-1 protein diffusion during lysis and EP migration. Schematic of microwell and separation lane (top). Heatmaps of CNN-1 concentration after 40 seconds of lysis and 50 seconds of EP, computed with Comsol® Multiphysics (bottom). White arrows mark location of microwell. (C) Scatter plot of retained CNN-1 proteins in the PA gel (normalized to initial protein copy number) during EP. Immunoblot LOD of 27,000 molecules is represented in the plot by red dotted line.
During cell lysis, solubilized lysate diffuses both in-plane (into microwell volume and surrounding PA gel layer) and out-of-plane (buffer layer above PA gel layer). While thermodynamic partitioning helps confine cell lysate to the microwell (0.001 < K < 0.1 for 7 %T, or total monomer concentration in g / 100 mL)35, a ~60× dilution occurs as the ~10 pL SMC lysate fills the 628 pL microwell volume (100 µm diameter × 80 µm tall). Consequently, we selected cell lysis conditions to rapidly lyse SMCs and quickly solubilize even large proteins in SMC lysate. To assess protein solubilization, we monitored electromigration of α-SMA into the PA gel comprising the microwell walls, with electromigration as a proxy for solubilization. For lysis buffer composition, we fixed lysis and EP conditions (lysis duration 25 s, electromigration duration 25 s, E = 40 V/cm, 55°C) and determined performance with the commonly employed RIPA buffer (25 mM Tris-glycine buffer at pH 8.3, 0.5 % SDS, 0.1 % Triton X-100) and a more concentrated buffer previously optimized for lysis-hardy cells (25 mM Tris-glycine buffer at pH 8.3 with 1% SDS, 0.5% sodium deoxycholate, and 1% Triton X-10033). While we observed no noticeable electromigration of α-SMA from the microwell and into the PA with RIPA buffer, under the same conditions we observed full electromigration of the α-SMA from the microwell and into the PA gel layer for the harsher buffer (Fig. S3). Given the composition of the latter, we anticipate notable Joule heating during EP of each single-SMC lysate, which exacerbates both in-plane and out-of-plane diffusional losses of lysate proteins.
To satisfy our second constraint on protein marker dilution, protein solubilization, EP duration, and the limit of detection (LOD) of the single-cell immunoblot, we numerically simulated the transport of CNN-1 during in-microwell cell lysis, electromigration into the EP sieving gel, and subsequent EP analysis (Fig. 2B). The LOD was previously determined by partitioning dilutions of purified protein solutions into PA gels and using fluorescently labeled antibodies to probe for captured proteins.29 For this analysis, we considered CNN-1, as the species has the lowest molecular mass (34 kDa) of the maturation marker set and thus, the highest diffusivity. We set the lysis time to 40 s (experimentally determined as time required for full lysis of SMCs using the harsher buffer warmed to 55 °C) and the EP time to 50 s (time required at an E = 40 V / cm for injection of MHC, the protein target with highest molecular mass, 227 kDa and thus, slowest electrophoretic mobility). Based on the simulation results, we estimate a ~ 50% loss of protein during lysis in the open microwell geometry. Nevertheless, after the 40 s cell lysis period and 50 s of elapsed EP separation time, the CNN-1 protein copy number remains above the LOD of the open fluidic immunoblot assay (Fig. 2C).
Protein Separations from Single Aortic SMCs Grant High-Selectivity Measurements of Differentiation Markers
We experimentally verified our simulation results by assaying single SMCs under the simulated conditions (100 µm-diameter microwells, 40 sec lysis, 50 sec EP) and successfully separating and detecting CNN-1, α-SMA and SMMHC. The triad of protein markers – α-SMA, CNN-1 and SMMHC – were assayed in SMC populations from individual aortas at an average of 65 ± 19 SMCs per device (mean ± S.D. for N = 3 separate devices). Upon performing single-SMC protein separations, we observed a spurious band associated with the α-SMA antibody (Fig. 3A), consistent with several reports in which the use of the same antibody showed non-specific bands at higher molecular masses36. Interestingly, we observed that this off-target signal appeared only in a subset of cells, and with varying intensity (Fig. 3B). To determine if the off-target signal was correlated with the α-SMA protein band signal, we quantified both bands for a set of single SMCs (Fig. 3C, N = 47). When plotting the protein band AUC against the off-target signal AUC, we observed a low positive correlation (R2 = 0.65, Fig. 3C). This low correlation suggests that an assay that uses immuno-affinity alone, such as IF, could lead to inaccurate measurements of protein expression. For instance, as shown in Fig. 3B, while Cell 1 and Cell 3 have similar α-SMA expression (Cell 3 to Cell 1 ratio = 1.09), if we add the non-specific band signal contribution is to the α-SMA signal, Cell 3 appears to have a 2.3-fold increase in α-SMA signal.
Fig. 3.

Immunoblotting cytometry detects SMC-to-SMC variation in off-target antibody signal. (A) False-colored micrographs and corresponding intensity profiles for three analyzed SMCs showing varying non-specific band intensity (black arrows). (B) Stacked bar graph of quantified α-SMA bands (magenta) and non-specific bands (white) for three SMCs shown in (A). (C) Bivariate scatter plot illustrating the poor linear correlation (R2 = 0.65) between the AUC of the α-SMA and the non-specific bands (N = 47 single SMCs for one independent experiment with an individual mouse).
These results emphasize the need to perform thorough antibody validation experiments while taking into account how different sample preparation methods can mask epitopes or modify binding affinities. Namely, caution must be taken when validating antibodies by one method and then applying them to an assay with different sample preparation. For instance, validation of an antibody by western blotting, where proteins are usually denatured and treated with reducing agents, does not guarantee its application in IF, where proteins not only maintain their native structure, but may also be subject to artifacts due to cell fixation, like epitope masking due to methylene bridge formation when using paraformaldehyde.11,37
Single-Mouse Resolution Provides Valuable Data on Inter-Mouse Variation
Low sample requirements of 100s of cells allow us to assay SMCs from individual mice and examine mouse-to-mouse variation. We first validated run-to-run reproducibility to ensure we could compare data collected on different devices. To perform this analysis, we compared the protein band peak width of SMCs assayed on two separate devices. Because the final peak width of a protein band will depend on (a) injection dispersion, which is affected by the degree of protein solubilization, and (b) diffusive band broadening that occurs during EP, which is a function of gel pore size, we used this separation performance metric to validate run-to-run lysis efficiency and gel-to-gel reproducibility. We thus assayed SMCs from one mouse on two different devices, and compared the peak width distributions of CNN-1, the marker with highest diffusivity. The peak width was calculated as 4σ, where σ is evaluated by fitting a Gaussian curve to the fluorescence intensity profile. The two devices showed peak widths of 627 ± 66.7 µm and 591 ± 66.8 µm, which were not significantly different, demonstrating reproducibility between gels and similar levels of solubilization between runs (mean ± S.D., N = 22 and 11 SMCs, Mann Whitney U Test, P value threshold 0.05, P value = 0.2381).
Next, to investigate if differences in protein distribution exist between mice, we assayed SMCs from two different mice for maturation markers CNN-1, α-SMA and SMMHC. We first validated that protein expression distributions for all protein markers fit a gamma distribution, consistent with single cell protein expression profiles reported for mammalian cells and which results from stochasticity in transcription and translation.38,39 For Mouse 1, the expression distributions of all markers were well described by gamma distributions, as determined by fitting a gamma distribution to each data set and performing a Chi Squared Goodness of Fit Test between the data and the fitted Gamma distribution (P values above the threshold of 0.1005, 0.4247 and 0.2158 for α-SMA, CNN-1 and SMMHC, respectively). For Mouse 2, while CNN-1 and SMMHC expression distributions were well described by a Gamma distribution (P values of 0.2070 and 0.1866, respectively), the distribution of α-SMA was poorly described by a Gamma distribution (P value = 0.0169). For both mice, the lower P values for α-SMA suggest that α-SMA is a stronger classifier of subpopulations of SMCs, as compared to other protein markers studied here. Given that α-SMA is a marker of earlier differentiation, these results suggest the existence of immature-like SMCs in the healthy aortic wall and support the theory of subpopulations of SMCs being responsible for proliferation.
Next, we calculated the coefficient of variation (CV = S.D. / average × 100) for each protein marker in order to validate the detection of biological variation, and not technical noise. CVs for α-SMA and CNN-1 were similar for both mice: 70.9 % and 70.4 % for α-SMA and 60.9 % and 60.2 % for CNN-1, for Mice 1 and 2, respectively. Mouse 1 showed a higher CV for SMMHC than Mouse 2 (80.5 % and 66.6%, respectively). All CV values were above the technical variation threshold CV 32.4 % determined previously.33 Briefly, this threshold was calculated by running single-cell separations with GFP-expressing cells, binning cells with < 5 % difference in initial GFP fluorescence and calculating the CV of the probed signal. CV values are all above this threshold, indicating that the variation detected is true biological variation and not technical noise.
We investigated mouse-to-mouse heterogeneity by comparing expression distributions for Mouse 1 and Mouse 2. α-SMA expression did not show a significant difference between mice (Mann Whitney U Test, P value = 0.114). CNN-1 and SMMHC, however, showed different expression distributions in Mouse 1 compared with Mouse 2 (P values < 0.0001 and 0.0004 for CNN-1 and MHC, respectively). To determine whether the pooled distribution is representative of SMCs within the individual mice, we compared each protein expression distribution to the pooled distribution. α-SMA was the only marker for which distributions were not significantly different (P values for Mann Whitney U test between pooled distribution and Mice 1 and 2 were 0.1144 and 0.3720, respectively). For CNN-1 and SMMHC, however, the pooled distribution was significantly different from the individual protein expression distributions (Mann Whitney U test, P values for pooled distribution vs. Mouse 1 were < 0.0001 for CNN-1 and 0.0004 for SMMHC, and for pooled distribution vs. Mouse 2 were 0.0040 for CNN-1 and 0.0466 for SMMHC) (Fig. 4A). These results highlight the importance of performing analyses at the single-mouse resolution, as for two out of three markers studied here, CNN-1 and SMMHC, pooling samples would result in distributions that are not representative of SMCs within the aorta of the two individual mice.
Fig. 4.

Mouse-specific expression of maturation stage markers reveal mouse-to-mouse heterogeneity, which cannot be recovered when samples are pooled. (A) Violin plots displaying the protein expression (AUC) of CNN-1, α-SMA, and SMMHC of SMCs isolated from two mice, shown individually and pooled. Horizontal black lines represent the mean and mean ± SD. ‘*’, ‘**’, ‘***’ and ‘****’ indicate Mann-Whitney U Tests that resulted in P values of < 0.05, < 0.01, < 0.001 and < 0.0001, respectively. An independent experiment was conducted for each individual mouse. Mice 1 and 2 had N = 45 and 48 single SMCs, respectively. (B) Three-dimensional scatter plot showing standardized expression of CNN-1, α-SMA and SMMHC by single SMCs for Mice 1 and 2. (C) K means clustering (cosine similarity, k = 2) was performed on pooled, standardized CNN-1, α-SMA and SMMHC expression data. Resulting clusters, shown by open “o” or gray filled “•” circles on the three-dimensional scatter plot of CNN-1, α-SMA and SMMHC expression, demonstrate a low classification accuracy (Rand Index of 0.495).
Finally, we tested whether inter-mouse variation could be recovered from a pooled sample. We standardized expression data for all three markers for Mouse 1 and Mouse 2 (Fig. 4B) and performed clustering on pooled data (K means clustering, cosine similarity, with k = 2 clusters, clusters shown in Fig. 4C). For Mouse 1, 40.0% of SMCs were classified into Cluster 1 and 60.0% into Cluster 2. Similarly, 39.6% of SMCs from Mouse 2 were clustered into Cluster 1 and 60.4% into Cluster 2. To evaluate clustering accuracy, we calculated an external validation index, the Rand Index (RI). The values of RI range between 0 and 1, where values approaching 1 indicate a high level of agreement between clustering and the natural classes. For our clustering results, we obtained an RI of 0.495, indicating low accuracy when clustering the data pooled from two mice. These results demonstrate that mouse origin cannot be easily recovered once cells have been pooled. Single-mouse studies therefore render valuable animal-to-animal phenotypic variation that cannot be recovered if cells from multiple mice are initially pooled.
Multiplexed Single-SMC Cytometry Identifies Subpopulations of SMCs
The quantitative and specific nature of immunoblotting – as compared with IF – provides insight into subtle differences among single SMCs. To investigate if SMCs showed distinct subpopulations, we performed agglomerative hierarchical clustering on SMCs from an individual mouse aorta (Fig. 5A). In order to exclude any effects of cell size, we used cosine similarity as the distance metric. The majority of SMCs (92 %) were clustered into two major populations demonstrating similar levels of expression across all markers, consistent with the expected expression profile of a mature SMC. One of these populations shows generally high expression for all markers (Fig. 5A, top gray rectangle), while the other shows generally low expression across the three maturation markers (Fig. 5A, middle gray rectangle). A representative micrograph and corresponding fluorescence intensity profile for these two populations are displayed in Fig. 4B, marked with ‘*’ and ‘**’ for the high and low expression populations, respectively. In the second cluster, a minority of cells were segmented into a subgroup of SMCs exhibiting higher expression of α-SMA than SMMHC and CNN-1 (Fig. 5A, red rectangle). We observed a similar trend for SMCs from a different individual mouse aorta, where 6% of the population showed high α-SMA and low expression of CNN-1 and SMMHC, consistent with immature-like phenotype (Fig. S4). These results are consistent with immunofluorescence studies that demonstrated the existence of a subpopulation of proliferative SMCs, comprising less than 10% of the total SMC population.25 The representative micrograph and protein separation of this subpopulation (Fig. 5B, ‘***’), demonstrate the elevated expression of α-SMA with respect to CNN-1 and SMMHC. The identification of subpopulations with marked phenotypic differences indicates that an inherently heterogeneous population of SMCs exists within the normal blood vessel wall, even without injury. Furthermore, the detection of a subpopulation (<10%) with immature-like phenotype, namely, high expression of early-stage maturation marker α-SMA but low expression of late-stage maturation markers CNN-1 and SMMHC, corroborate findings that suggest that only subset of proliferative SMCs may be responsible for vascular remodeling25–27.
Fig. 5.

Hierarchical clustering of individual SMCs by expression of α-SMA, CNN-1 and SMMHC identifies SMC subpopulations. (a) Heat map of SMCs clustered by expression of α-SMA, CNN-1 and SMMHC. Cells are plotted on the y-axis, while protein markers are plotted on the x-axis (N = 48 single SMCs for one independent experiment). The majority (92 %) of SMCs are clustered into two major populations, one displaying generally high (top gray rectangle) and the other generally low (middle gray rectangle) expression of all three markers. The latter cluster includes a subpopulation of SMCs with high α-SMA and low CNN-1 and SMMHC expression (red rectangle). (b) False-colored micrographs and corresponding fluorescence intensity profiles for representative samples from the subpopulations marked in panel (a). Black arrows mark the position of protein peaks. Scale bars are 100 µm.
Although three protein markers were sufficient for profiling SMC maturation stage in this study, other biological questions may require profiling a larger panel of protein targets. To validate our multiplexing capability beyond 3 targets, we calculated the theoretical peak capacity, or maximum number of resolved peaks that fit in a separation lane. Considering the average peak width 798 ± 133 µm of the marker with highest diffusivity, CNN-1 (average ± S.D., N = 92) and total length of the separation lane, 5 mm, we obtained a peak capacity of 7.3. With 7 fully resolved theoretical peaks and four spectral channels of our current imaging system, we anticipate a multiplexing capability of > 30 markers. Furthermore, we can strip the gel of bound antibodies (by incubation with 2% SDS, 0.8% β-mercaptoethanol and 62.5 mM Tris base at 55°C) and re-probe for new targets. Multiplexing beyond 30 markers extends the applicability of our assay to answering complex biological questions that may require studying signaling pathways or screening large panels of protein markers.
Conclusions
Studying cell-to-cell phenotypic variation of unfixed, primary cells is a crucial capability, as culturing cells leads to losses in molecular phenotype. Here we introduce a high-selectivity, multiplexed immunoblotting cytometry assay for interrogating single primary cells. Using our assay, we demonstrate the detection of a population of SMCs with an immature phenotype (high α-SMA and low SMMHC and CNN-1), which supports the theory that healthy blood vessels harbor a subset of SMCs responsible for the abnormal proliferation of SMCs seen in numerous vascular diseases.
Beyond advancing knowledge in vascular biology, our key goal to minimize primary sample requirements lead to the important insight into variation in cell phenotype not only within the same donor, but also between different donors. Although human cell-based in vitro models are starting to gain importance, animal models remain the gold standard for both drug testing and biological discovery.40,41 However, isolating specific tissues or cell groups is difficult and often results in small yields. High sample requirements of protein assays (western blotting or FACS) often necessitate pooling cells from multiple mice, which not only obscures essential differences in individual responses, but also significantly increase the number of animals required. 16 billion dollars are spent annually on animal models,42 with low successful rates of translation- less than 8% in clinical cancer trials, for instance.43 Low reproducibility may also be connected with the inability of bulk assays to detect patterns or responses unique to individual organisms. Single-mouse resolution assays, such as the one described in this paper, will provide insight into mouse-to-mouse phenotypic variability, reduce the economic costs associated with animal models, and minimize animal lives sacrificed.
Supplementary Material
Acknowledgments
The authors acknowledge members and alumni of the Herr Lab for helpful discussions. Partial infrastructure support was provided by the QB3 Biomolecular Nanofabrication Center. This research was performed under a National Institutes of Health Training Grant awarded to the UCB/USCF Graduate Program in Bioengineering (5T32GM008155-29 to E.R.C.), a California Institute for Regenerative Medicine Predoctoral Fellowship (E.R.C.), an Obra Social “la Caixa” Fellowship (E.R.C.), a University of California, Berkeley Siebel Scholarship (E.R.C.), a National Science Foundation CAREER Award (CBET-1056035 to A.E.H.), a Tsinghua-Berkeley Institute fellowship (to T.D.) and National Institute of Health grants (1R01CA203018 to A.E.H.; 1R01HL117213 to S.L.). E.R.C. and T.D. performed experiments, E.R.C. performed simulations and data analysis. E.R.C., T.D., S.L. and A.E.H. conceived and designed the experiments. E.R.C. and A.E.H. wrote the manuscript.
Footnotes
Electronic Supplementary Information (ESI) available: [details of any supplementary information available should be included here]. See DOI: 10.1039/x0xx00000x
Conflicts of interest
All other authors have no conflicts to declare.
The authors declare financial interests. A.E.H. is a co-inventor on patents related to single-cell analysis tools and maintains a financial interest in commercialization efforts.
References
- 1.Oikawa A, Saito K. Plant J. 2012;70:30–38. doi: 10.1111/j.1365-313X.2012.04967.x. [DOI] [PubMed] [Google Scholar]
- 2.Pan C, Kumar C, Bohl S, Klingmueller U, Mann M. Mol. Cell. Proteomics. 2009;8:443–450. doi: 10.1074/mcp.M800258-MCP200. [DOI] [PMC free article] [PubMed] [Google Scholar]
- 3.Hakulinen JK, Klyszejko AL, Hoffmann J, Eckhardt-Strelau L, Brutschy B, Vonck J, Meier T. Proc. Natl. Acad. Sci. U. S. A. 2012;109:E2050–6. doi: 10.1073/pnas.1203971109. [DOI] [PMC free article] [PubMed] [Google Scholar]
- 4.Lee M-CW, Lopez-Diaz FJ, Khan SY, Tariq MA, Dayn Y, Vaske CJ, Radenbaugh AJ, Kim HJ, Emerson BM, Pourmand N. Proc. Natl. Acad. Sci. U. S. A. 2014;111:E4726–35. doi: 10.1073/pnas.1404656111. [DOI] [PMC free article] [PubMed] [Google Scholar]
- 5.Slomp J, Gittenberger-de Groot AC, Glukhova MA, Conny van Munsteren J, Kockx MM, Schwartz SM, Koteliansky VE. Arterioscler. Thromb. Vasc. Biol. 1997;17:1003–9. doi: 10.1161/01.atv.17.5.1003. [DOI] [PubMed] [Google Scholar]
- 6.Newman JRS, Ghaemmaghami S, Ihmels J, Breslow DK, Noble M, DeRisi JL, Weissman JS. Nature. 2006;441:840–6. doi: 10.1038/nature04785. [DOI] [PubMed] [Google Scholar]
- 7.Gosselin EJ, Cate CC, Pettengill OS, Sorenson GD. Am. J. Anat. 1986;175:135–160. doi: 10.1002/aja.1001750205. [DOI] [PubMed] [Google Scholar]
- 8.Burry RW. J Histochem. Cytochem. 2011;59:6–12. doi: 10.1369/jhc.2010.956920. [DOI] [PMC free article] [PubMed] [Google Scholar]
- 9.Yamauchi KA, Herr AE. Microsystems Nanoeng. 2017;3:16079. doi: 10.1038/micronano.2016.79. [DOI] [PMC free article] [PubMed] [Google Scholar]
- 10.Schnell U, Dijk F, Sjollema KA, Giepmans BNG. Nat. Methods. 2012;9:152–158. doi: 10.1038/nmeth.1855. [DOI] [PubMed] [Google Scholar]
- 11.Bordeaux J, Welsh AW, Agarwal S, Killiam E, Baquero MT, Hanna JA, Anagnostou VK, Rimm DL. Biotechniques. 2010;48:197–209. doi: 10.2144/000113382. [DOI] [PMC free article] [PubMed] [Google Scholar]
- 12.Teves SS, An L, Hansen AS, Xie L, Darzacq X, Tjian R. Elife. 2016;5:1–24. doi: 10.7554/eLife.22280. [DOI] [PMC free article] [PubMed] [Google Scholar]
- 13.Chatterjee S. J Oral Maxillofac Pathol. 2014;18:S111–S116. doi: 10.4103/0973-029X.141346. [DOI] [PMC free article] [PubMed] [Google Scholar]
- 14.Dorini LB, Minetto R, Leite NJ. XX Brazilian Symp. Comput. Graph. Image Process. 2007;294 [Google Scholar]
- 15.Chen S, Zhao M, Wu G, Yao C, Zhang J. Comput. Math. Methods Med. doi: 10.1155/2012/101536. [DOI] [PMC free article] [PubMed] [Google Scholar]
- 16.Carpenter AE, Jones TR, Lamprecht MR, Clarke C, Kang IH, Friman O, Guertin Da, Chang JH, Lindquist Ra, Moffat J, Golland P, Sabatini DM. Genome Biol. 2006;7:R100. doi: 10.1186/gb-2006-7-10-r100. [DOI] [PMC free article] [PubMed] [Google Scholar]
- 17.Kamentsky L, Jones TR, Fraser A, Bray M-A, Logan DJ, Madden KL, Ljosa V, Rueden C, Eliceiri KW, Carpenter AE. Bioinformatics. 2011;27:1179–80. doi: 10.1093/bioinformatics/btr095. [DOI] [PMC free article] [PubMed] [Google Scholar]
- 18.Diz AP, Truebano M, Skibinski DOF. Electrophoresis. 2009;30:2967–2975. doi: 10.1002/elps.200900210. [DOI] [PubMed] [Google Scholar]
- 19.Zhang SD, Gant TW. Bioinformatics. 2005;21:4378–4383. doi: 10.1093/bioinformatics/bti717. [DOI] [PubMed] [Google Scholar]
- 20.Rajkumar AP, Qvist P, Lazarus R, Lescai F, Ju J, Nyegaard M, Mors O, Børglum AD, Li Q, Christensen JH. BMC Genomics. 2015;16:548. doi: 10.1186/s12864-015-1767-y. [DOI] [PMC free article] [PubMed] [Google Scholar]
- 21.Hadrava V, Kruppa U, Russo R, Lacourcière Y, Tremblay J, Hamet P. Am Hear. J. 1991;122:1198–203. doi: 10.1016/0002-8703(91)90939-f. [DOI] [PubMed] [Google Scholar]
- 22.Chistiakov DA, Orekhov AN, Bobryshev YV. Acta Physiol. 2015;214:33–50. doi: 10.1111/apha.12466. [DOI] [PubMed] [Google Scholar]
- 23.Caplice NM, Bunch TJ, Stalboerger PG, Wang S, Simper D, Miller DV, Russell SJ, Litzow MR, Edwards WD. Proc. Natl. Acad. Sci. U. S. A. 2003;100:4754–9. doi: 10.1073/pnas.0730743100. [DOI] [PMC free article] [PubMed] [Google Scholar]
- 24.Haas S, Jahnke H-G, Glass M, Azendorf R, Schmidt S, Robitzki AA. Lab Chip. 2010;10:2965. doi: 10.1039/c0lc00008f. [DOI] [PubMed] [Google Scholar]
- 25.Tang Z, Wang A, Yuan F, Yan Z, Liu B, Chu JS, Helms Ja, Li S. Nat. Commun. 2012;3:1–13. doi: 10.1038/ncomms1867. [DOI] [PMC free article] [PubMed] [Google Scholar]
- 26.Feil S, Fehrenbacher B, Lukowski R, Essmann F, Schulze-Osthoff K, Schaller M, Feil R. Circ. Res. 2014;115:662–667. doi: 10.1161/CIRCRESAHA.115.304634. [DOI] [PubMed] [Google Scholar]
- 27.Chappell J, Harman JL, Narasimhan VM, Yu H, Foote K, Simons BD, Bennett MR, Jørgensen HF. Circ. Res. 2016;119:1313–1323. doi: 10.1161/CIRCRESAHA.116.309799. [DOI] [PMC free article] [PubMed] [Google Scholar]
- 28.Yang M, Nelson R, Ros A. Anal. Chem. 2016;88:6672–6679. doi: 10.1021/acs.analchem.5b03419. [DOI] [PubMed] [Google Scholar]
- 29.Hughes AJ, Spelke DP, Xu Z, Kang C-C, Schaffer DV, Herr AE. Nat. Methods. 2014;11:749–55. doi: 10.1038/nmeth.2992. [DOI] [PMC free article] [PubMed] [Google Scholar]
- 30.Kang C-C, Yamauchi KA, Vlassakis J, Sinkala E, Duncombe TA, Herr AE. Nat. Protoc. 2016;11:1508–1530. doi: 10.1038/nprot.2016.089. [DOI] [PMC free article] [PubMed] [Google Scholar]
- 31.Kang CC, Lin JMG, Xu Z, Kumar S, Herr AE. Anal. Chem. 2014;86:10429–10436. doi: 10.1021/ac502932t. [DOI] [PMC free article] [PubMed] [Google Scholar]
- 32.Kim JJ, Sinkala E, Herr AE. Lab Chip. 2017;17:855–863. doi: 10.1039/c6lc01333c. [DOI] [PMC free article] [PubMed] [Google Scholar]
- 33.Sinkala E, Sollier-Christen E, Renier C, Rosàs-Canyelles E, Che J, Heirich K, Duncombe TA, Vlassakis J, Yamauchi KA, Huang H, Jeffrey SS, Herr AE. Nat. Commun. 2017 Mar 23;:14622. doi: 10.1038/ncomms14622. [DOI] [PMC free article] [PubMed] [Google Scholar]
- 34.Hannemann J, Meyer-Staeckling S, Kemming D, Alpers I, Joosse SA, Pospisil H, Kurtz S, Görndt J, Püschel K, Riethdorf S, Pantel K, Brandt B. PLoS One. doi: 10.1371/journal.pone.0026362. [DOI] [PMC free article] [PubMed] [Google Scholar]
- 35.Tong J, Anderson JL. Biophys. J. 1996;70:1505–13. doi: 10.1016/S0006-3495(96)79712-6. [DOI] [PMC free article] [PubMed] [Google Scholar]
- 36.Abcam, Western blot abreview for Anti-alpha smooth muscle Actin antibody.
- 37.Uhlen M, Bandrowski A, Carr S, Edwards A, Ellenberg J, Lundberg E, Rimm DL, Rodriguez H, Hiltke T, Snyder M, Tadashi Y. Nat. Methods. 2016;13:823–827. doi: 10.1038/nmeth.3995. [DOI] [PMC free article] [PubMed] [Google Scholar]
- 38.Cohen AA, Kalisky T, Mayo A, Geva-Zatorsky N, Danon T, Issaeva I, Kopito RB, Perzov N, Milo R, Sigal A, Alon U. PLoS One. doi: 10.1371/journal.pone.0004901. [DOI] [PMC free article] [PubMed] [Google Scholar]
- 39.Furusawa C, Suzuki T, Kashiwagi A, Yomo T, Kaneko K. Biophysics (Oxf) 2005;1:25–31. doi: 10.2142/biophysics.1.25. [DOI] [PMC free article] [PubMed] [Google Scholar]
- 40.Esch EW, Bahinski A, Huh D. Nat. Rev. Drug Discov. 2015;14:248–260. doi: 10.1038/nrd4539. [DOI] [PMC free article] [PubMed] [Google Scholar]
- 41.Ghaemmaghami AM, Hancock MJ, Harrington H, Kaji H, Khademhosseini A. Drug Discov Today. 2013;17:173–181. doi: 10.1016/j.drudis.2011.10.029. [DOI] [PMC free article] [PubMed] [Google Scholar]
- 42.Peggs K. Animals. 2015;5:624–642. doi: 10.3390/ani5030376. [DOI] [PMC free article] [PubMed] [Google Scholar]
- 43.Mak IW, Evaniew N, Ghert M. Am. J. Transl. Res. 2014;6:114–8. [PMC free article] [PubMed] [Google Scholar]
Associated Data
This section collects any data citations, data availability statements, or supplementary materials included in this article.