Abstract
Obesity-induced metabolic disease involves functional integration among several organs via circulating factors, but little is known about crosstalk between liver and visceral adipose tissue (VAT)1. In obesity, VAT becomes populated with inflammatory adipose tissue macrophages (ATMs)2,3. In obese humans, there is a close correlation between adipose tissue inflammation and insulin resistance4,5, and in obese mice, blocking systemic or ATM inflammation improves insulin sensitivity6–8. However, processes that promote pathological adipose tissue inflammation in obesity are incompletely understood. Here we show that obesity in mice stimulates hepatocytes to synthesize and secrete dipeptidyl peptidase 4 (DPP4), which acts with plasma factor Xa to inflame ATMs. Silencing expression of DPP4 in hepatocytes suppresses inflammation of VAT and insulin resistance; however, a similar effect is not seen with the orally administered DPP4 inhibitor sitagliptin. Inflammation and insulin resistance are also suppressed by silencing expression of caveolin-1 or PAR2 in ATMs; these proteins mediate the actions of DPP4 and factor Xa, respectively. Thus, hepatocyte DPP4 promotes VAT inflammation and insulin resistance in obesity, and targeting this pathway may have metabolic benefits that are distinct from those observed with oral DPP4 inhibitors.
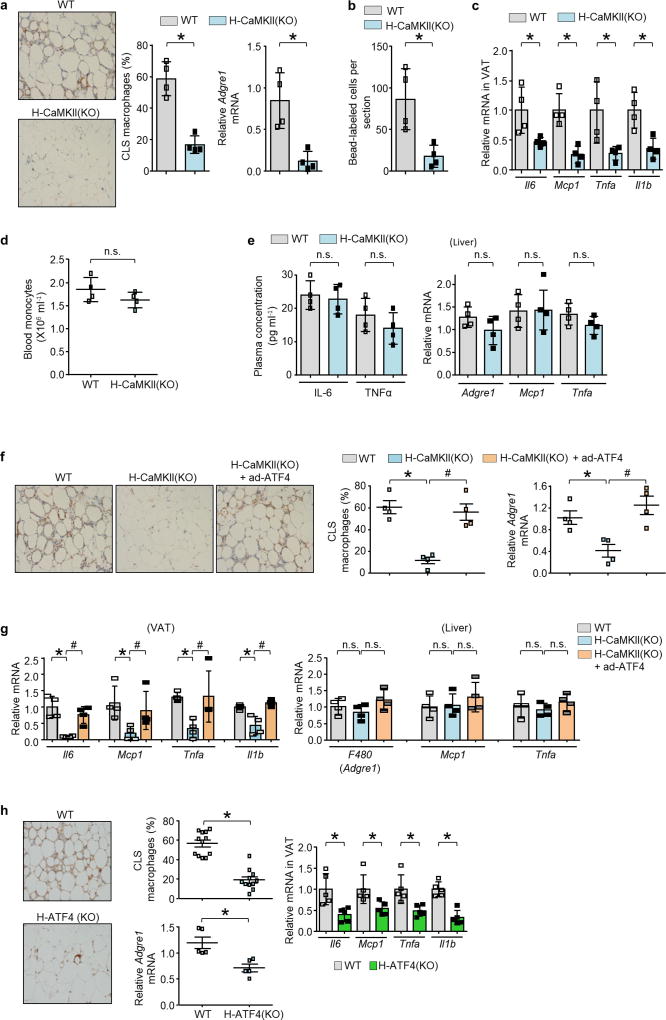
In obese mice and humans, a pathway in hepatocytes involving Ca2+–calmodulin-dependent protein kinase II (CaMKII) contributes to both excessive hepatic glucose production and impaired hepatic insulin signalling9–11. Inhibition of this pathway by hepatocyte-specific deletion of CaMKIIγ in diet-induced obese (DIO) mice (Camk2gfl/fl mice infected with AAV8-TBG-cre, hereafter referred to as H-CaMKII(KO) mice, improves glucose and insulin tolerance9,10. Notably, the VAT of these mice had fewer ATMs in crown-like structures (CLS) and decreased Adgre1 mRNA (which encodes the F4/80 glycoprotein) in comparison to VAT of control Camk2gfl/fl DIO mice (Extended Data Fig. 1a). There was also decreased infiltration of inflammatory Ly6Chi monocytes and lower inflammatory cytokine expression in the VAT of H-CaMKII(KO) mice, with no significant change in blood monocyte number, plasma IL6 or TNFα, or liver inflammation (Extended Data Fig. 1b–e). ATF4 expression is regulated downstream of CaMKII signalling and is decreased in the hepatocytes of H-CaMKII(KO) DIO mice10. Restoring ATF4 expression in the livers of mice deficient in hepatocyte CaMKII using an adenovirus vector restored VAT inflammation without affecting liver inflammation (Extended Data Fig. 1f, g). Conversely, hepatocyte-specific deletion of ATF4 in DIO mice lowered VAT inflammation (Extended Data Fig. 1h). Therefore, we hypothesized that, in obesity, activation of CaMKII and ATF4 in hepatocytes induces the secretion of a circulatory factor (a ‘hepatokine’) that promotes VAT inflammation.
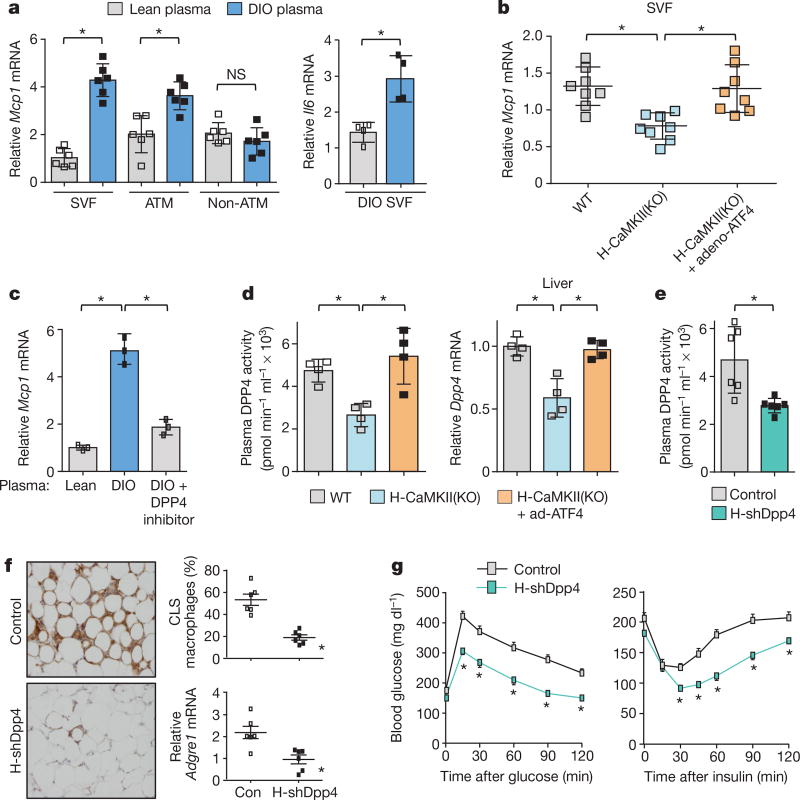
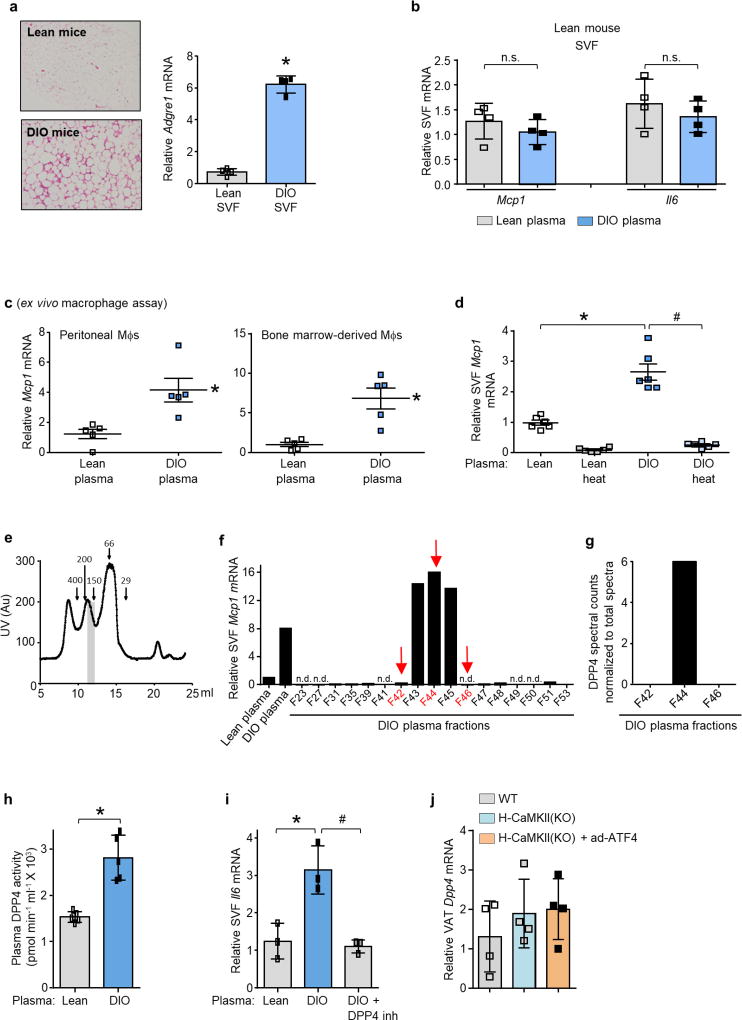
To test this hypothesis, we developed an ex vivo assay in which cells from the stromal vascular fraction (SVF) of VAT are incubated with plasma from the above mouse models, and Mcp1 (also known as Ccl2) and Il6 mRNA are quantified as markers of inflammation. Because VAT macrophages are a likely target of the putative hepatokine, we predicted that cells from the SVF of VAT from obese mice, which harbour more of these macrophages4,5 (Extended Data Fig. 2a), would show an increased response in this assay in comparison to SVF cells from lean mice. Plasma from obese mice would also be expected to evoke a more potent response in the assay than plasma from lean mice. Consistent with this hypothesis, plasma from DIO mice induced higher expression of both Mcp1 and Il6 mRNA than plasma from lean mice in SVF cells from DIO mice, but did not have this effect on SVF cells from lean mice. Furthermore, the inflammatory activity of plasma from DIO mice was due to the macrophage component of SVF cells (Fig. 1a and Extended Data Fig. 2b). DIO mouse plasma was also able to induce Mcp1 expression in peritoneal and bone marrow-derived macrophages (BMDMs; Extended Data Fig. 2c). Most importantly, plasma from H-CaMKII-(KO) DIO mice was less able to induce Mcp1 expression in SVF than plasma from either wild-type DIO mice or H-CaMKII(KO) mice in which hepatic ATF4 expression was restored (Fig. 1b). These data suggest that, in obesity, activation of hepatocyte CaMKII and ATF4 induce one or more secretory factors that promote VAT-macrophage inflammation.
Figure 1. Hepatocyte-specific DPP4 silencing suppresses VAT inflammation and improves insulin sensitivity in DIO mice.
a, VAT SVF cells from DIO mice, and ATMs and non-ATMs isolated from SVF, were incubated for 4 h with medium containing 10% (vol/vol) plasma from lean or DIO mice and then assayed for Mcp1 or Il6 mRNA (n = 4–6 mice per group; *P < 0.05 by two-tailed Student’s t-test). b, VAT SVF cells from DIO mice were incubated with plasma from the three DIO models described in Extended Data Fig. 1f, g and then assayed for Mcp1 mRNA. WT, wild type. n = 8 mice per group; mean ± s.e.m.; *P < 0.05 by one-way analysis of variance (ANOVA). c, SVF cells from DIO mice were incubated with lean or DIO mouse plasma that was pre-treated for 1 h with or without 10 µM DPP4 inhibitor KR62436 and then assayed for Mcp1 mRNA (n = 3 technical replicates; mean ± s.e.m.; *P < 0.05 by one-way ANOVA). d, The three groups of mice from Extended Data Fig. 1f, g were assayed for plasma DPP4 activity and hepatic Dpp4 mRNA (n = 4 mice per group; mean ± s.e.m.; *P < 0.05 by one-way ANOVA). e–g, Sixteen-week-old mice previously fed the DIO diet for 10 weeks were injected intravenously with AAV8-H1-shDpp4 (H-shDpp4) or control AAV8-H1 vector (control; or con, in f). The mice were analysed after four weeks as follows. e, Plasma DPP4 activity. f, CLS macrophages and Adgre1 mRNA in VAT, with representative images of F4/80-stained VAT. g, Blood glucose after intraperitoneal glucose or insulin (n = 6 mice per group; mean ± s.e.m.; *P < 0.05 by two-tailed Student’s t-test).
The Mcp1-inducing factor in DIO mouse plasma was heat labile (Extended Data Fig. 2d), suggesting that it may be a protein. We performed size-exclusion gel-filtration fast protein liquid chromatography (FPLC) with DIO mouse plasma (Extended Data Fig. 2e) and tested eluted fractions for their ability to induce Mcp1 expression in SVF cells. There was a peak of activity in three fractions in the 125–200 kDa range (Extended Data Fig. 2f). The active fraction F44 and inactive fractions F42 and F46 were analysed by liquid chromatography–tandem mass spectrometry (LC–MS/MS) to identify peptides that were more abundant in F44 than in F42 and F46 (Supplementary Table 2a). Peptides corresponding to DPP4 (CD26) met these criteria (Extended Data Fig. 2g). DPP4 is a dipeptidyl protease that can exist as either a cell membrane protein or a soluble plasma protein12. DPP4 concentration correlates with body mass index and insulin resistance in humans13,14, and we found that DPP4 activity was higher in the plasma of DIO mice than in that of lean mice (Extended Data Fig. 2h).
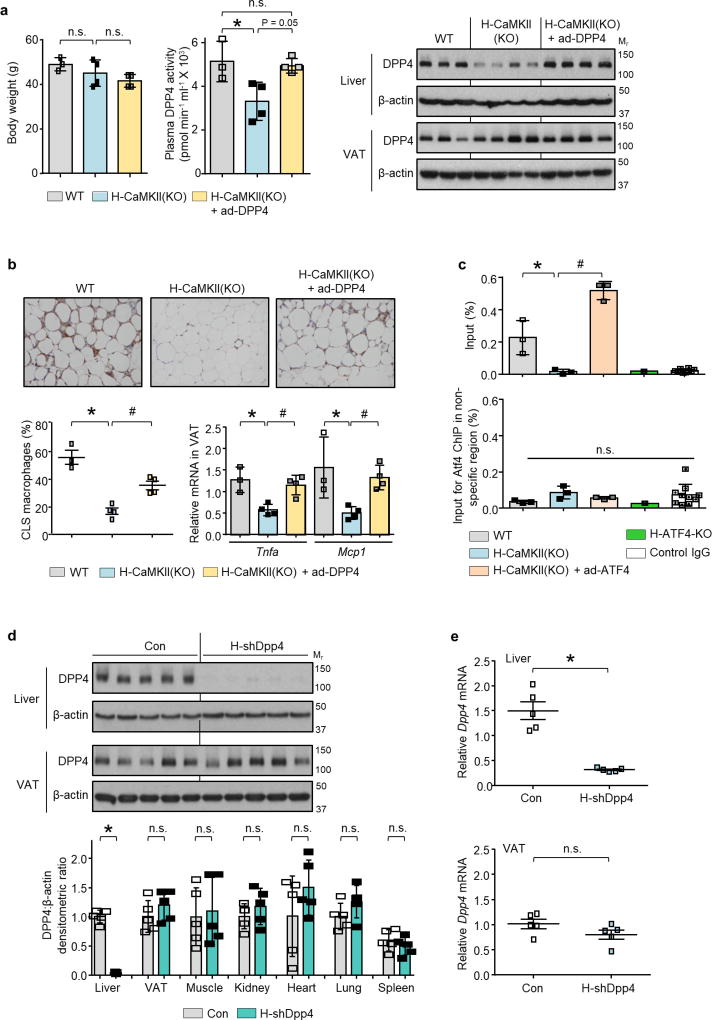
Consistent with a role for DPP4, the Mcp1- and Il6-inducing activity of DIO mouse plasma could be suppressed by an inhibitor of DPP4 (Fig. 1c and Extended Data Fig. 2i). Furthermore, DPP4 activity in plasma and Dpp4 mRNA expression in liver, but not in VAT, correlated exactly with VAT inflammation in vivo and plasma SVF-inflammatory activity ex vivo in wild-type and H-CaMKII(KO) mice as well as in H-CaMKII(KO) mice in which hepatic ATF4 expression was restored (Fig. 1d and Extended Data Fig. 2j). Moreover, restoration of hepatic DPP4 expression in H-CaMKII(KO) mice restored DPP4 activity in plasma and VAT inflammation without changing body weight (Extended Data Fig. 3a, b). Consistent with the role of ATF4, we found an ATF4-consensus site in exon 1 of the Dpp4 gene. Chromatin immunoprecipitation (ChIP) analysis revealed lower levels of ATF4 occupancy at this site in the livers of H-CaMKII(KO) DIO mice versus those of wild-type DIO or H-CaMKII(KO) DIO mice in which hepatocyte ATF4 expression was restored (Extended Data Fig. 3c).
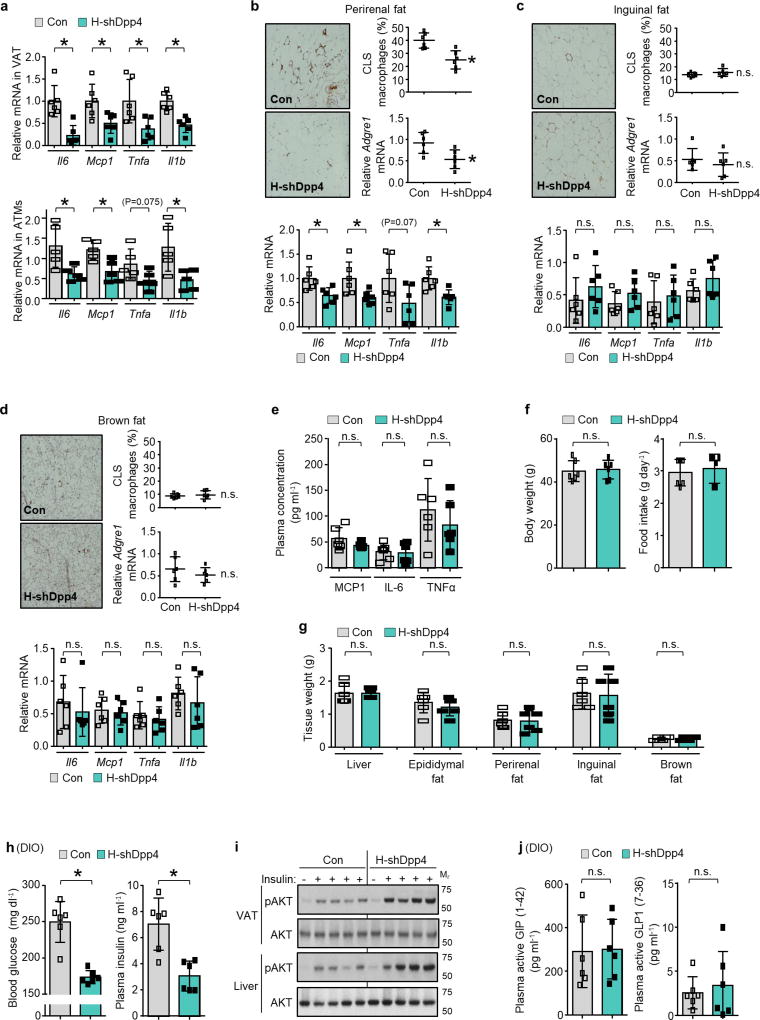
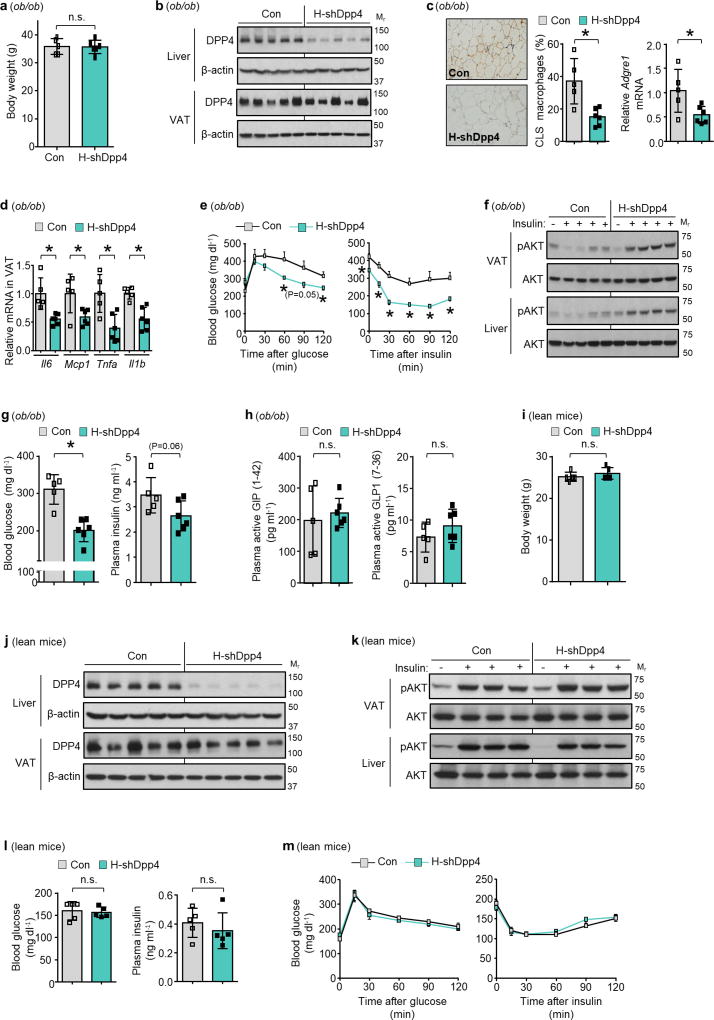
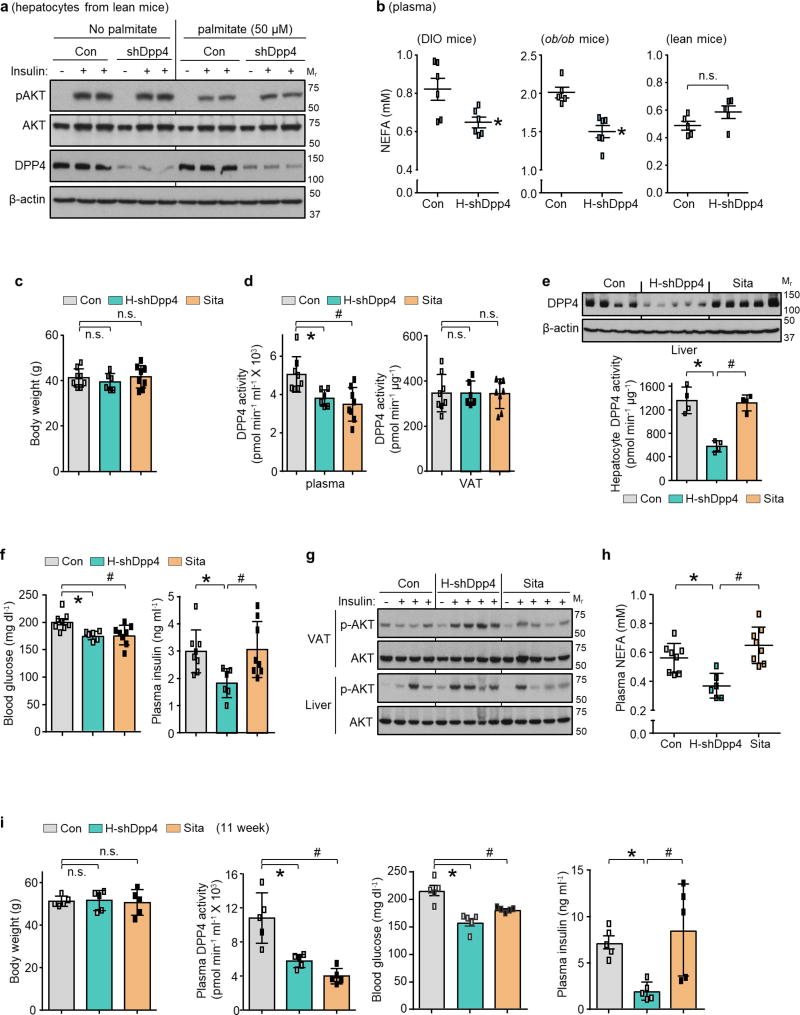
We infected DIO mice with an adeno-associated virus 8 (AAV8) that encoded a short hairpin RNA (shRNA) construct targeting mouse Dpp4 driven by the H1 promoter. AAV8-H1-shDpp4 specifically silences DPP4 in hepatocytes but not in VAT or other tissues (Extended Data Fig. 3d, e); we refer to the vector as H-shDpp4 to reflect its hepatocyte specificity. H-shDpp4-treated DIO mice had significantly decreased plasma DPP4 activity (Fig. 1e), indicating that hepatocytes are a source of circulating DPP4 in obesity. H-shDpp4-treated DIO mice also had decreased numbers of CLS macrophages in the VAT and decreased levels of inflammatory cytokine mRNAs in VAT and VAT ATMs (Fig. 1f and Extended Data Fig. 4a, b). However, these mice did not differ from control vector-treated DIO mice with regard to inflammation in inguinal or brown fat, plasma cytokines, body weight, food intake or liver or adipose tissue weight (Extended Data Fig. 4c–g). H-shDpp4-treated DIO mice also exhibited improved glucose homeostasis and increased insulin-induced AKT phosphorylation (p-AKT) in VAT and liver (Fig. 1g and Extended Data Fig. 4h, i). Unlike DPP4 inhibition15, silencing of hepatocyte DPP4 did not increase levels of active plasma incretins (Extended Data Fig. 4j). Similar data were obtained when ob/ob mice were treated with the H-shDpp4 (Extended Data Fig. 5a–h). By contrast, treatment of lean mice with the H-shDpp4 had no effect on metabolism (Extended Data Fig. 5i–m), and DPP4 silencing did not improve insulin signalling in palmitate-treated primary hepatocytes (Extended Data Fig. 6a). Moreover, consistent with the idea that adipocyte-derived non-esterified fatty acids (NEFA) may contribute to inflammation-induced insulin resistance16, H-shDpp4 treatment lowered plasma NEFA in obese but not in lean mice (Extended Data Fig. 6b). These combined data suggest that the improvement in metabolism in DIO mice treated with H-shDpp4 is caused by suppression of VAT inflammation, which improves insulin signalling in hepatocytes and VAT as a secondary effect rather than via a direct effect on insulin signalling in hepatocytes.
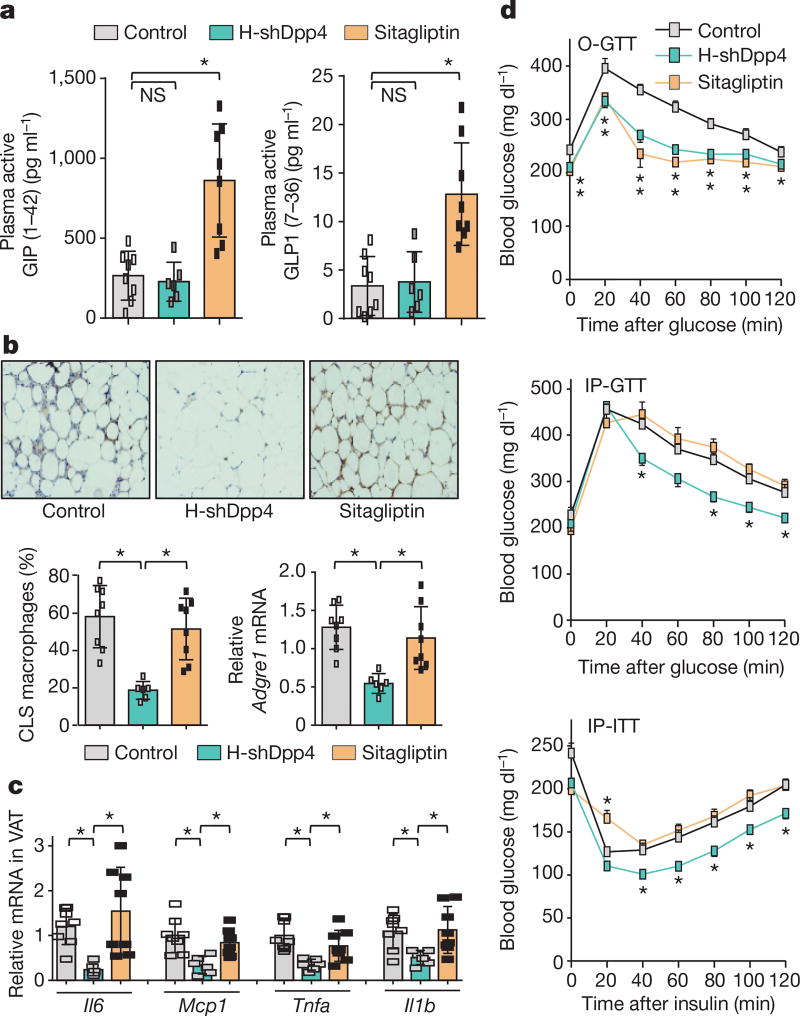
Oral DPP4 inhibitors do not lower plasma insulin in insulin-resistant, hyperinsulinaemic subjects17–22. A recent study suggested that in obese mice, oral DPP4 inhibitors function by inhibiting gut endothelial DPP423. We tested the hypothesis that oral DPP4 inhibition and hepatocyte DPP4 silencing have fundamentally different effects on adipose inflammation and glucose metabolism: we directly compared treatment with the oral DPP4 inhibitor sitagliptin with silencing of hepatocyte DPP4 in DIO mice. After four weeks, neither treatment affected body weight; both treatments lowered plasma DPP4 activity to a similar degree and neither treatment affected DPP4 activity in VAT (Extended Data Fig. 6c, d). However, H-shDpp4, but not sitagliptin, decreased hepatic DPP4 protein and hepatocyte DPP4 activity (Extended Data Fig. 6e). Conversely, sitagliptin, but not H-shDpp4, increased plasma incretins (Fig. 2a), consistent with our shDpp4 data and the known action of oral DPP4 inhibitors. Notably, H-shDpp4, but not sitagliptin, suppressed VAT inflammation (Fig. 2b, c), and although both treatments lowered blood glucose and improved oral glucose tolerance, only H-shDpp4 lowered plasma insulin, improved glucose response to intraperitoneal glucose and insulin, showed evidence of increased insulin-induced p-AKT in VAT and liver and lowered plasma NEFA (Fig. 2d and Extended Data Fig. 6f–h). Consistent with these results, both sitagliptin and H-shDpp4 treatments lowered plasma DPP4 activity and blood glucose, but only H-shDpp4 decreased plasma insulin levels after 11 weeks, without a change in body weight (Extended Data Fig. 6i). Thus, DPP4 inhibition by orally administered sitagliptin and hepatocyte DPP4 silencing have fundamentally different effects on VAT inflammation and metabolism.
Figure 2. Silencing of hepatocyte DPP4, but not treatment with the oral DPP4 inhibitor sitagliptin, lowers VAT inflammation and improves metabolism in DIO mice.
a–d, Control, H-shDpp4- and sitagliptin-treated mice from those described in Extended Data Fig. 6c–h were analysed as follows. a, Plasma active GIP (1–42) and GLP1 (7–36). NS, not significant. b, CLS macrophages and Adgre1 mRNA in VAT, with representative images of F4/80-stained VAT. c, Il6, Mcp1, Tnfa and Il1b mRNA in VAT. d, Blood glucose after oral glucose (O-GTT), intraperitoneal glucose (IP-GTT), or intraperitoneal insulin (IP-ITT). Data are mean ± s.e.m., *P < 0.05 by one-way ANOVA.
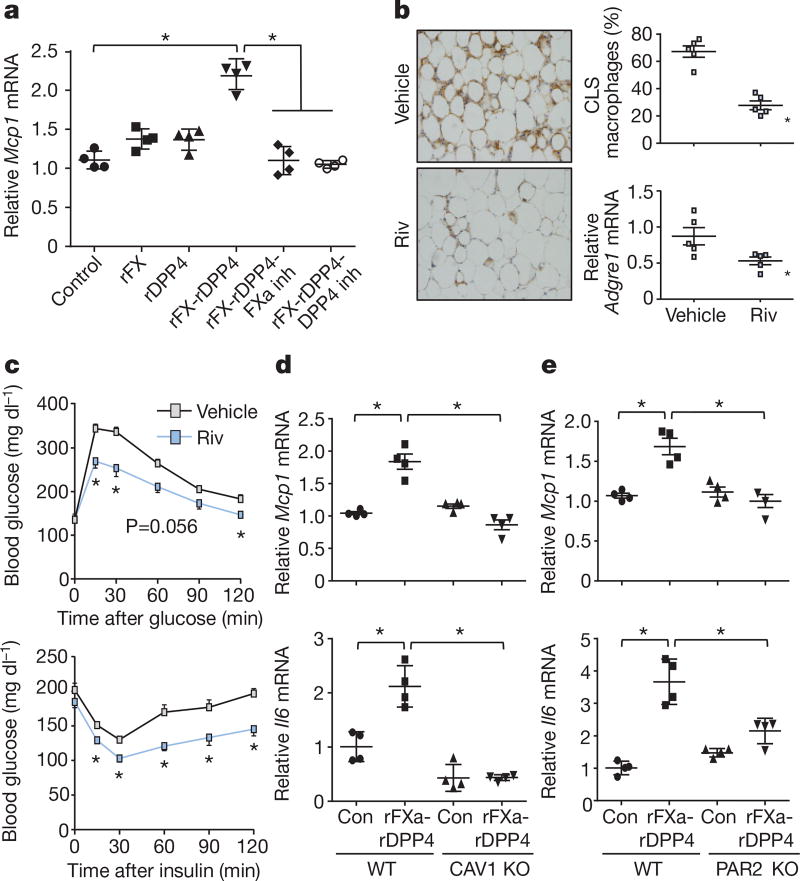
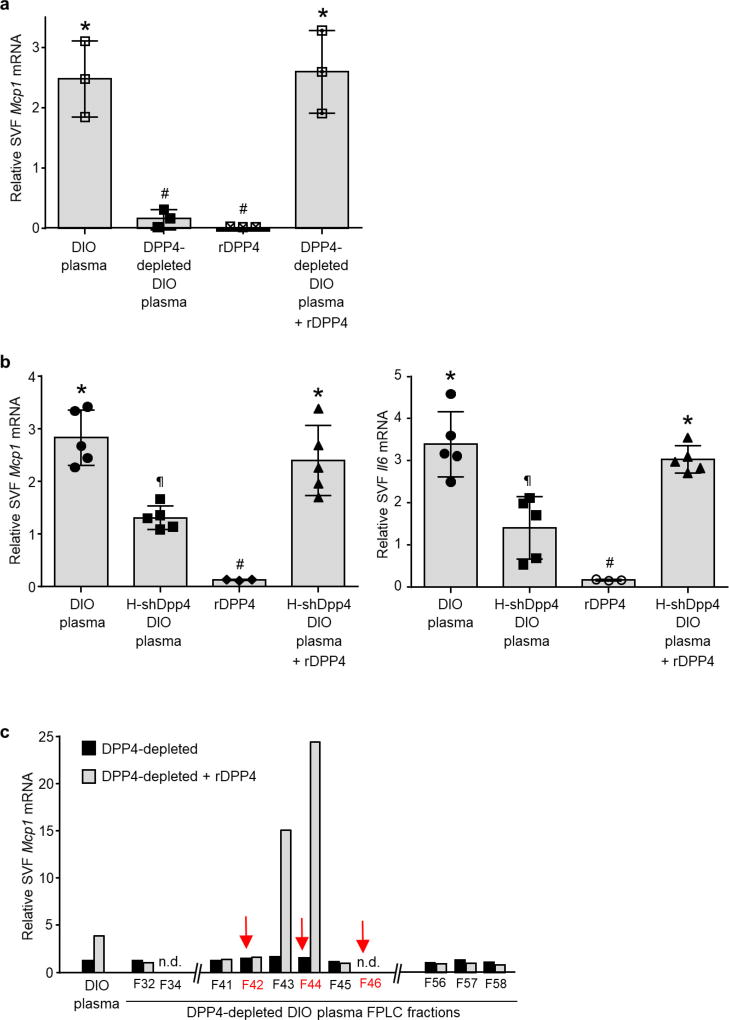
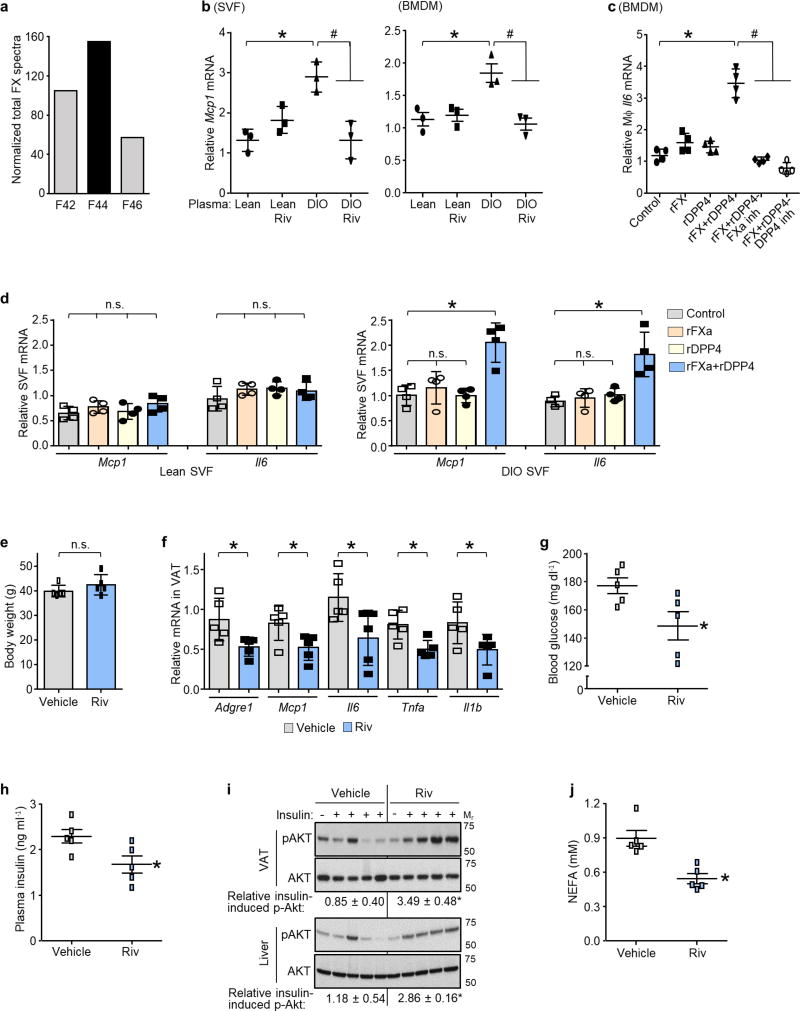
Next, we investigated the mechanism of DPP4-induced VAT macrophage inflammation. Although recombinant DPP4 (rDPP4) alone was unable to induce Mcp1 or Il6 expression in SVF, it did so when added to either DIO mouse plasma that had been immunodepleted of DPP4 or plasma from DIO mice that had been treated with H-shDpp4 (Extended Data Fig. 7a, b). To determine whether an additional plasma factor was needed for DPP4 to promote SVF inflammation, plasma from DIO mice was immunodepleted of DPP4 and then fractionated using FPLC. Two fractions (F43 and F44) were able to induce Mcp1 in SVF cells in the presence of rDPP4, but not in its absence (Extended Data Fig. 7c). Fraction F44 and the inactive fractions F42 and F46 were then analysed by LC–MS/MS to identify peptides that were more abundant in F44 versus F42 and F46 (Supplementary Table 2b). Peptides corresponding to plasma factor X met these criteria (Extended Data Fig. 8a). Factor X can trigger inflammation in endothelial cells and leukocytes24,25, and we found that the ability of DIO plasma to induce Mcp1 expression in SVF cells or macrophages was abrogated by rivaroxaban, an inhibitor of factor Xa (FXa) (Extended Data Fig. 8b). Furthermore, whereas recombinant factor X (rFX) or rDPP4 alone led to only very small increases in Mcp1 and Il6 expression in macrophages, combined treatment with both rFX and rDPP4 was much more potent, and this inflammatory activity was inhibited by either rivaroxaban or a DPP4 inhibitor (Fig. 3a and Extended Data Fig. 8c). These data also imply that factor X is converted to FXa by macrophages26. Using recombinant FXa (rFXa) directly, we showed that rFXa and rDPP4 together were able to induce Mcp1 and Il6 expression in DIO mouse SVF cells but not in lean mouse SVF cells (Extended Data Fig. 8d). Treatment of DIO mice with rivaroxaban lowered VAT inflammation and plasma NEFA, and improved metabolism, without affecting body weight (Fig. 3b, c and Extended Data Fig. 8e–j).
Figure 3. DPP4 and FXa synergistically activate inflammatory signalling in macrophages.
a, BMDMs were pretreated with or without 10 µM FXa inhibitor rivaroxaban or 10 µM DPP4 inhibitor KR62436, followed by incubation for 4 h with rFX or rDPP4 alone or in combination. Mcp1 mRNA was then quantified. n = 4 technical replicates per group; mean ± s.e.m.; *P < 0.05 by one-way ANOVA. b, c, Sixteen-week-old mice previously fed the DIO diet for 10 weeks were treated for 20 days with 2 mg kg−1 oral rivaroxaban twice daily (Riv) or vehicle control and analysed as follows. b, CLS macrophages and Adgre1 mRNA in VAT, with representative images of F4/80-stained VAT. c, Blood glucose after intraperitoneal glucose or insulin (n = 5 mice per group; mean ± s.e.m.; *P < 0.05 by two-tailed Student’s t-test). d, e, BMDMs from wild-type, CAV1 knockout (CAV1 KO) or PAR2 knockout (PAR2 KO) mice were incubated for 4 h with or without rFXa and rDPP4 and then assayed for Mcp1 and Il6 mRNA. n = 4 technical replicates per group; mean ± s.e.m.; *P < 0.05 by two-way ANOVA.
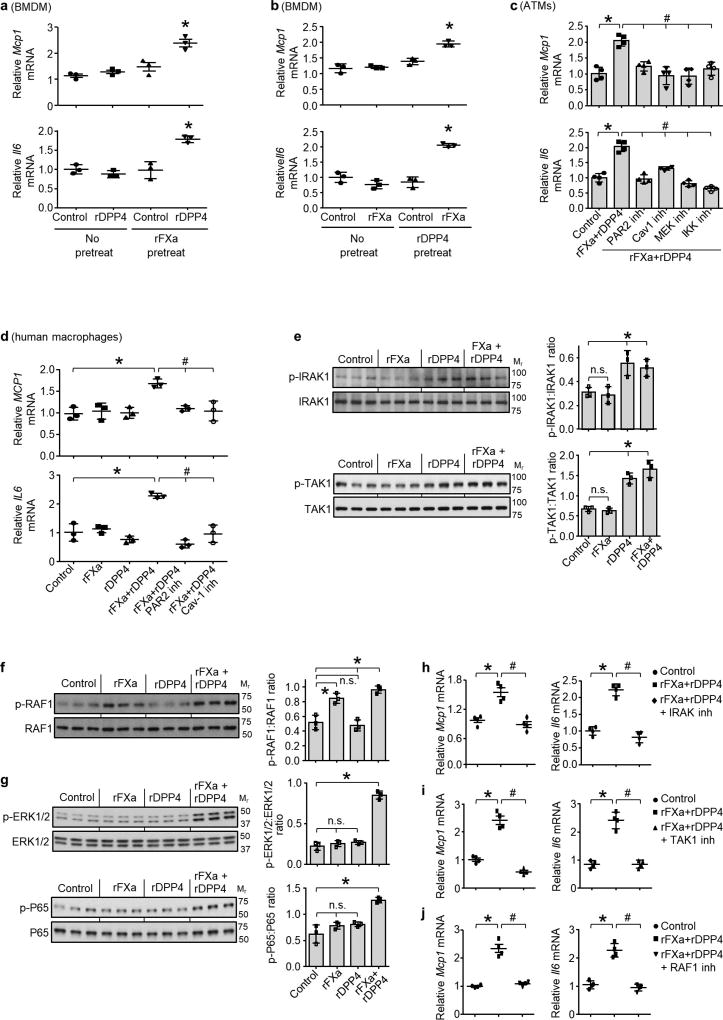
To understand how the combination of DPP4 and FXa induces Mcp1 expression, we pre-treated macrophages with rFXa and then, after removing the rFXa and inhibiting residual activity with rivaroxaban, treated the cells with rDPP4. We also conducted the reverse experiment by pre-treating the cells with rDPP4 and then, after removing the rDPP4 and inhibiting residual activity with a DPP4 inhibitor, treated the cells with rFXa. Both protocols increased Mcp1 and Il6 mRNA expression (Extended Data Fig. 9a, b), suggesting that neither a complex between FXa and DPP4 nor a specifically ordered priming event is needed. We therefore hypothesized that each factor alone partially activates inflammatory signalling to a sub-threshold level, and that the threshold is reached only when both factors are present. Inflammation induced by rDPP4 and rFXa was markedly reduced in macrophages from mice lacking either caveolin-1 (CAV1), which mediates the inflammatory effects of DPP4 on antigen-presenting cells27, or PAR2, a cell-surface receptor that mediates the inflammatory effects of FXa in macrophages28 (Fig. 3d, e). Similar results were observed in VAT-derived ATMs from DIO mice, and human macrophages treated with inhibitors of CAV1 or PAR2 (Extended Data Fig. 9c, d). Consistent with the signalling-threshold hypothesis, rDPP4 alone increased phosphorylation of two reported CAV1 signalling intermediates, IRAK1 and TAK1 (Extended Data Fig. 9e), and rFXa alone increased phosphorylation of the PAR2 signalling intermediate RAF1 (Extended Data Fig. 9f), but only combined treatment with rDPP4 and rFXa was able to activate two distal inflammatory signalling molecules, ERK1/2 and NF-κB (Extended Data Fig. 9g). Pharmacological inhibition of these signalling molecules abolished rDPP4–rFXa-induced Mcp1 and Il6 expression (Extended Data Fig. 9c, h–j). Together, these data suggest that DPP4 and FXa activate two separate upstream pathways that synergistically stimulate ERK1/2 and NF-κB to induce Mcp1 and Il6 in ATMs.
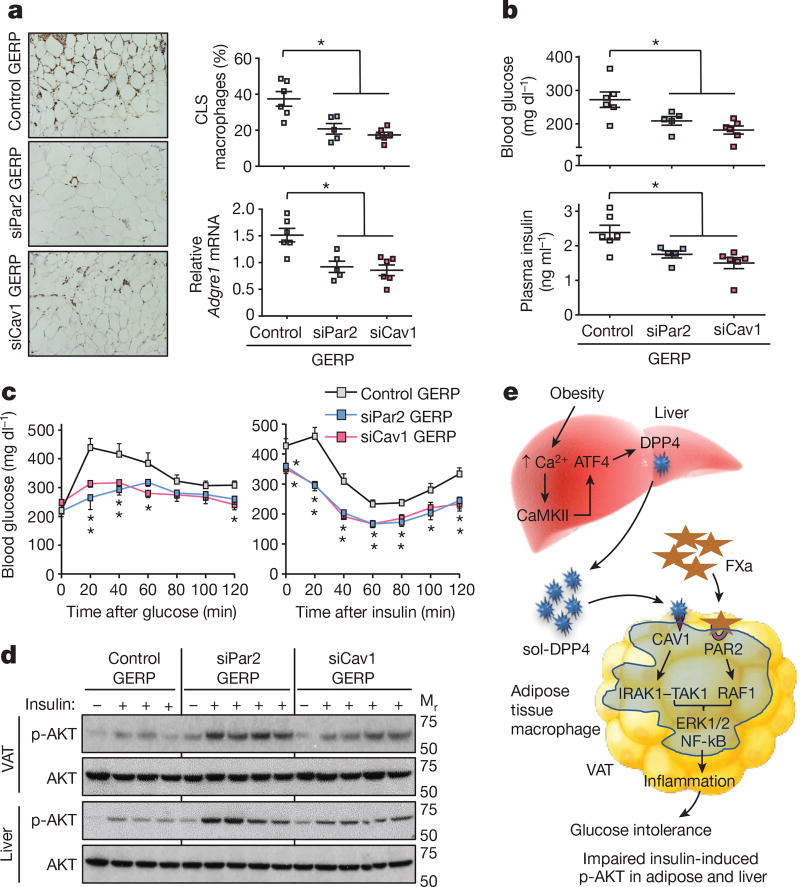
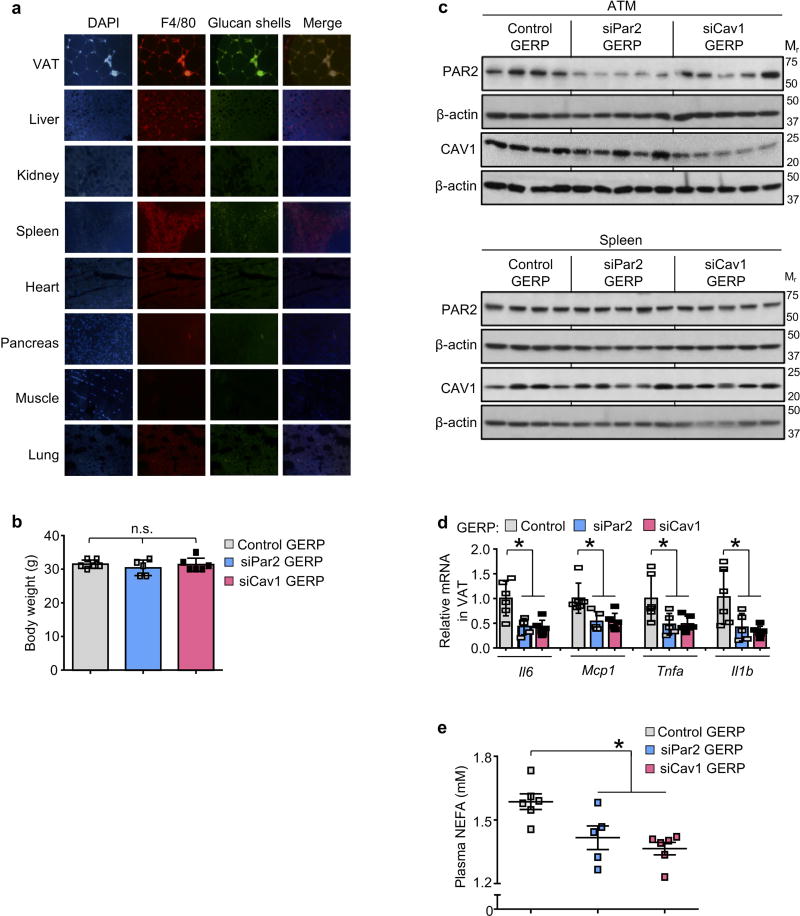
Next, we determined whether inhibition of the above pathways in ATMs could ameliorate VAT inflammation and improve metabolism in obese mice. Genes can be silenced specifically in ATMs in ob/ob mice by intraperitoneal administration of short interfering RNA (siRNA) encapsulated in micrometer-sized glucan shells, referred to as glucan-encapsulated siRNA particles (GERPs)8. Using this method, we determined the effect of decreasing Par2 and Cav1 expression in ATMs on VAT inflammation and glucose metabolism in ob/ob mice. In a pilot experiment using FITC-labelled glucan shells in ob/ob mice, we verified their increased localization to macrophages in VAT (ATMs) relative to macrophages in other organs (Extended Data Fig. 10a). We then treated ob/ob mice with GERPs containing scrambled RNA (control), or siRNA targeting PAR2 or CAV1, over a 12-day period. Body weight was similar in all three cohorts (Extended Data Fig. 10b). PAR2 and CAV1 levels were decreased by the respective GERPs in ATMs but not in spleen (Extended Data Fig. 10c). Notably, both GERPs lowered VAT inflammation, improved glucose intolerance, increased insulin-induced p-AKT in VAT and liver and decreased plasma NEFA (Fig. 4a–d and Extended Data Fig. 10d, e).
Figure 4. Silencing PAR2 or CAV1 in ATMs in obese mice lowers VAT inflammation and improves response to insulin.
a–d, Five-week-old, chow-fed ob/ob mice were injected intraperitoneally once a day for 12 days with 0.2 mg GERPs containing scrambled siRNA (control), Par2 siRNA (siPar2) or Cav1 siRNA (siCav1). Twenty-four hours after the last injection, the mice were analysed as follows. a, CLS macrophages and Adgre1 mRNA in VAT, with representative images of F4/80-stained VAT. b, Blood glucose and plasma insulin 5 h after food withdrawal. c, Blood glucose after intraperitoneal glucose or insulin. d, Total AKT and p-AKT in VAT and liver after portal vein insulin injection. n = 5–6 mice per group; *P < 0.05 by two-tailed Student’s t-test for each siRNA GERP versus control GERP. For gel source data, see Supplementary Fig. 1. e, Summary scheme: obesity triggers a Ca2+–CaMKII–ATF4 pathway in hepatocytes, leading to induction of DPP4 and secretion of soluble DPP4 (sol-DPP4). Soluble DPP4 activates a CAV1–IRAK1–TAK1 pathway in ATMs, which, in combination with PAR2–RAF1 activation by FXa in ATMs, promotes ERK1/2–NF-kB-mediated inflammation. VAT inflammation exacerbates glucose intolerance, impaired insulin signalling in adipose and liver and hyperinsulinaemia.
These findings emphasize the important role of crosstalk between hepatocytes and adipose tissue in metabolic disease (Fig. 4e) and the distinct effects of silencing hepatocyte DPP4 expression versus DPP4 inhibition by oral inhibitors, which are widely used to treat type 2 diabetes. Although sitagliptin has been reported to lower adipose inflammation in obese mice29, the drug was administered to young mice when they started receiving a high-fat diet, leading to an approximately 25% decrease in body weight in comparison to untreated mice. In our study, the drug was given to adult mice after obesity and VAT inflammation had developed, and it had no effect on body weight. We speculate that inhibition of circulating DPP4 activity does not block VAT inflammation in adult obese mice because some other action of oral DPP4 inhibition in that setting, perhaps related to the increase in plasma insulin30, counteracts the anti-inflammatory effect of lowering plasma DPP4 activity. While future work is needed to understand the role of the hepatocyte DPP4–FXa pathway in obese, insulin-resistant humans, we have preliminary data that shows that a high percentage of obese subjects with fat inflammation and a high homeostasis model assessment (HOMA) index have inflammatory activity in their plasma that is dependent on DPP4, FXa and PAR2, whereas plasma from obese subjects without fat inflammation and insulin resistance do not show this dependency. In conclusion, the identification of this pathway provides insight into how organ crosstalk can exacerbate metabolic disarray in obesity and raises the possibility that therapeutic silencing of hepatocyte DPP4— via hepatocyte-targeted siRNA31, for example—may have benefits for obesity-induced insulin resistance that are not achievable through currently available oral DPP4 inhibitors.
Online Content Methods, along with any additional Extended Data display items and Source Data, are available in the online version of the paper; references unique to these sections appear only in the online paper.
Methods
Reagents and antibodies
Recombinant mouse and human DPP4 (catalogue no. 954-SE and 9168-SE, respectively) and anti-DPP4 antibody (AF954) were from R&D Systems. The PAR2 inhibitor GB83 was from Axon Medchem (1622). Recombinant FX (233282) and FXa (233526), and the MEK inhibitor PD98059 (513000) were from Millipore. The FXa inhibitor rivaroxaban (S3002) was from Selleckchem. IRAK1–4 inhibitor I (A3505) and sitagliptin phosphate monohydrate (A4036) were from ApexBio. Tri reagent (T9424), sodium palmitate (P9767), collagenase (C2139), liberase (5401020001), insulin (I9278), the DPP4 inhibitor KR-62436 hydrate (K4264), the caveolin-1 inhibitor daidzein (D7802), PS-1145, IKK inhibitor (P6624), the TAK1 MAPKKK inhibitor 5Z-7-oxozeaenol (O9890), anti-phospho-Thr209-IRAK1 (SAB4504246), and anti-β-actin antibody (A3854) were from Sigma. Anti-phospho-S473-AKT (4060), anti-AKT (4691), antiphospho-Thr202/Tyr204-ERK1/2 (8544), anti-ERK (9194), anti-phospho-S536-NF-κB p65 (3033), anti-NF-κB p65 (8242), anti-phospho-S412-TAK1 (9339), anti-TAK1 (5206), anti-phospho-S338-cRAF1 (9427), anti-cRAF1 (53745) and anti-caveolin-1 (3267) antibodies were from Cell Signaling. Anti-PAR2 antibody (817201) was from Biolegend. The DIO high-fat diet (60% kcal from fat) (D12492) was from Research Diets. Adenoviral Atf4 (adeno-Atf4) was a gift from R. J. Kaufman (Sanford–Burnham Medical Research Institute), adenoviral Dpp4 (adeno-Dpp4) was purchased from Vector Biolabs, and adeno-associated virus 8 (AAV8) containing either hepatocyte-specific TBG-Cre recombinase (AAV8-TBG-cre) or the control vector (AAV8-TBG-lacZ) were purchased from the Penn Vector Core. All adenoviruses were amplified by Viraquest. The AAV8-H1-shRNA construct targeting murine DPP4 was made by annealing complementary oligonucleotides and then ligating them into the pAAV-RSV-GFPH1 vector, as described previously32. The resultant constructs were amplified by Salk Institute Gene Transfer, Targeting, and Therapeutics Core. siRNA sequences against murine Par2 were purchased from GE Dharmacon and siRNA sequences against mouse Cav1 were purchased from Integrated DNA Technologies.
Mouse experiments
Camk2gfl/fl mice were generated as previously described10 and crossed onto the C57BL6/J background. Atf4fl/fl mice were generated as previously described33. Male Camk2gfl/fl or Atf4fl/fl mice were fed a high-fat, high-calorie diet (HFD, 60% kcal from fat) for 13 weeks starting at three weeks of age and were maintained on a 12-h light–dark cycle. Fifteen-week-old high-fat-diet-fed obese mice (DIO) that had been fed with HFD for nine weeks, four-week old chow-fed ob/ob mice, or sixteen-week-old chow-fed wild-type C57BL/6J mice were purchased from Jackson Laboratories and maintained for one week in the animal facility before commencement of experiments. Sixteen-week-old DIO Camk2gfl/fl mice that had been fed with HFD for 13 weeks were treated with adeno-associated viruses (AAV) for expression of either hepatocyte-specific TBG-cre34 or TBG-lacZ (the control vector) for three weeks to obtain H-CaMKII(KO) and wild-type mice. To obtain ATF4-restored H-CaMKII(KO) or DPP4-restored H-CaMKII(KO) mice, TBG-cre-treated Camk2gfl/fl mice received either adeno-Atf4 (H-CaMKII(KO) plus adeno-Atf4) or adeno-DPP4 (H-CaMKII(KO) plus adeno-Dpp4), while the remaining mice received adeno-lacZ. Similarly, sixteen-week-old Atf4fl/fl DIO mice that had been fed with HFD for 13 weeks were treated with AAV8-TBG-cre or AAV8-TBG-lacZ to obtain hepatocyte-ATF4 KO (H-ATF4(KO)) and wild-type mice. Sixteen-week-old wild-type DIO mice, four-week old ob/ob and sixteen-week-old wild-type C57BL/6J mice were treated with AAV8–H1-shDpp4 or AAV8–H1-control to obtain hepatocyte-specific DPP4 silencing (H-shDpp4) or control mice, respectively. In all mouse experiments, recombinant adenovirus (1 × 10⁹ plaque-forming units per mouse) or adeno-associated virus (1 × 10¹¹ genome copies per mouse) was delivered by tail vein injection, and experiments were commenced after 7–28 days or, for the experiment in Extended Data Fig. 6i, after 11 weeks. DIO mice were treated with oral rivaroxaban (2 mg/kg) twice daily for 20 days. DIO mice were treated for four or seven weeks with sitagliptin by adding it to the drinking water at 0.3 mg/ml, which results in a dose of ~30–45 mg/kg/day. Mouse plasma samples were collected from lean or obese mice after 4–5h of food withdrawal, with free access to water. Blood glucose was measured after 4–5h of food withdrawal in mice using a glucose meter (One Touch Ultra, Lifescan). Plasma insulin levels were measured using the Ultrasensitive Mouse Insulin ELISA Kit (Crystal Chem, 90080) and plasma MCP1, IL6 and TNFα levels were measured using mouse ELISA kits from RayBiotech (ELM-MCP1-1; ELM-IL6-1; ELM-TNFα-1). For gastric inhibitory polypeptide (GIP) and glucagon-like peptide-1 (GLP-1) measurements, mice were fasted overnight and then fed for 4–5 h before collecting plasma samples into a tube containing DPP4 inhibitor (5 µM). Plasma active GIP was measured using Sandwich mouse active GIP (1–42) ELISA Kit (Crystal Chem, 81511) and GLP-1 was assayed in plasma samples using mouse active GLP-1 (7–36) ELISA kit (Eagle Biosciences, GP121-K01). Plasma non-esterified fatty acids (NEFA) were assayed using an enzymatic kit from Wako Diagnostics (HR Series NEFA-HR(2)-Colour Reagent A, 999-34691; Solvent A, 995-34791; Colour Reagent B, 991-34891; Solvent B, 993-35191; and NEFA standard solution, 276-76491). Intraperitoneal-glucose tolerance tests were performed by intraperitoneal injection of glucose (1 g/kg body weight for DIO, 0.5 g/kg body weight for ob/ob and 2 g/kg body weight for lean mice) following an overnight fast. Oral glucose tolerance tests were conducted by delivering a 2-g/kg glucose bolus orally via gavage to DIO mice after a 5-h fast. Insulin tolerance tests were performed in mice that were fasted for 4–5 h, by intraperitoneal insulin injection (0.6 IU/kg body weight for DIO, 2 IU/kg body weight for ob/ob and 0.5 IU/kg body weight for lean mice) and by assaying blood glucose at various time points. Previous studies and pilot experiments formed the basis of power calculations for the various studies. Depending on the experiment, calculations indicated that 3–12 mice per group would enable the testing of our hypotheses based on an expected 25–30% coefficient of variation and an 80% chance of detecting a 33% difference in the key specified endpoints (P < 0.05). For all experiments, male mice of the same age and similar weight were randomly assigned to experimental and control groups. On occasion, we analysed a subset of mice for a particular parameter, and the subset was chosen randomly from a full cohort. Pre-specified exclusion criteria were weight loss 10% of initial body weight or signs of illness or injury requiring euthanasia. According to these pre-specified criteria, the maximum number of mice removed before analysis was three, but was more typically between zero and two. Animal studies were conducted in accordance with the Columbia University Animal Research Committee. Moreover, because switching mice from group caging to single caging, improper handling and placing mice in a restrainer affect stress-sensitive metabolic parameters including plasma DPP4 levels and adipose tissue inflammation (D.S.G., L.O. and I.T., unpublished observations), all experimental mice were housed in groups to avoid stress from isolation and handled with extra care to avoid stress during blood glucose measurement and blood collection.
F4/80 immunostaining of VAT
VAT samples were fixed in 10% (v/v) formalin solution for 24 h, followed by incubation with 70% ethanol (v/v) for 24 h and then embedding in paraffin. Six-micrometre sections were mounted on charged glass slides, incubated at 60 °C for 20 min, and deparaffinized using three washes with xylene. Antigen retrieval was carried out by treating the sections with proteinase K (1:1,000) (Invitrogen, AM2546) at 37 °C for 25 min. The sections were then rinsed and blocked using 5% serum, followed by incubation overnight at 4 °C with anti-F4/80 biotin-conjugated primary antibody (1:100) (Miltenyi Biotec, 130-101-893). The sections were then incubated with streptavidin–HRP secondary antibody (1:200) (BD Pharmingen, 554066) and then developed in chromagen substrate 3,3′-diaminobenzidine (Cell Signaling, 8059) and counterstained with haematoxylin. For each mouse, 5–10 sections were analysed by microscopic imaging at 20× magnification. The total number of nuclei and the number of nuclei of F4/80-immunostained cells surrounding adipocytes in CLS were counted for each field. The data are expressed as mean percentage of CLS macrophages per total adipose tissue nuclei.
Portal vein insulin infusion and protein extraction from tissues
After 4–5 h of food withdrawal, mice were anaesthetized and insulin (0.6 IU/kg body weight for DIO, 2 IU/kg body weight for ob/ob and 0.5 IU/kg body weight for lean mice) or PBS was injected through the portal vein. Three minutes after injection, liver and adipose tissue were removed, frozen in liquid nitrogen, and kept at −80°C until processing. For protein extraction, tissue samples were cut into small pieces and transferred to tubes containing ice-cold RIPA buffer supplemented with Halt Protease and Phosphatase Inhibitor Cocktail (Thermo Scientific, 78440). Tissue segments were then homogenized on ice, lysates were centrifuged, and the supernatant fractions were used for immunoblot analysis.
Primary hepatocyte experiments
Wild-type C57BL/6J mice (8–10 weeks old) were injected with either control vector or AAV8-shDpp4 (H-shDpp4) via tail vein injection. Ten days after injection, primary mouse hepatocytes were isolated as previously described35. Hepatocytes were incubated with either BSA control or palmitate (50 µM) for 10 h, with the last 5 h in serum-free medium. The cells were then treated with 100 nM insulin or vehicle control for 5 min and immediately frozen in liquid nitrogen and kept at −80 °C until further processing. Cells were lysed using 2× Laemmli buffer supplemented with Halt Protease and Phosphatase Inhibitor Cocktail and lysates were used for immunoblotting.
Preparation of stromal vascular fraction cells and isolation of adipose tissue macrophages
SVF from lean or obese mice was prepared as previously described36. In brief, VAT was isolated in ice-cold PBS containing liberase (50 µg/ml) and minced into small segments. VAT was digested at 37 °C for 1 h with intermittent mixing. After digestion, the solution was centrifuged, buoyant adipocytes were removed, and the cell pellet was retrieved as SVF. SVF cells were then cultured in medium containing 10% (vol/vol) FBS or plasma from lean or obese mice. For isolation of ATMs, anti-F4/80 biotin-conjugated primary antibody (Miltenyi Biotec, 130-101-893) was added at a 1:10 dilution to 4 × 10⁶ SVF cells in 200 µl of PBS containing 5% of FBS (PBS–FBS), followed by incubation at 4 °C for 20 min. The SVF cells were pelleted by centrifugation, washed once with 1 ml of buffer, and resuspended in 200 µl of PBS–FBS. The cells were then incubated with streptavidin-conjugated magnetic microbeads (1:10) (Miltenyi Biotec, 130-048-101) at 4 °C for 20 min. The cells were rinsed once with PBS–FBS, and ATMs were isolated using magnetic separation columns (Miltenyi Biotec, 130-042-201) and cultured in medium containing 10% (vol/vol) FBS.
Immunoblotting
Proteins from tissue or cell lysates were resolved on 4–20% Tris–glycine gradient gels and then transferred to nitrocellulose membranes. The membranes were blocked using either 5% non-fat milk or 5% BSA followed by incubation with primary antibodies overnight. Blots were then washed thoroughly and probed with HRP-conjugated secondary antibodies for 1 h. Protein bands were detected with Supersignal West Pico enhanced chemiluminescent solution (Thermo Scientific, Cat. No. 34080) and analysed by ImageJ.
Quantitative reverse transcription–PCR
Total RNA was extracted from tissues or primary cell cultures using Tri-reagent (Sigma, T9424). cDNA was synthesized from 2 µg total RNA using oligo (dT) and Superscript II (Invitrogen, AM5730G and 18064014). Real time quantitative (q) PCR was performed with a 7500 Real-Time PCR System (Applied Biosystems) using SYBR Green master mix (Qiagen, 204145) and gene-specific primers. The sequences of gene-specific primers used for the qPCR assays are described in Supplementary Table 1.
DPP-4 immunodepletion from plasma
DPP-4 was immunodepleted from obese mouse plasma using bead-immobilized anti-DPP-4 antibody (R&D Systems, AF954) as previously described37. In brief, 10 µg of anti-DPP-4 antibody was conjugated with 1.5 mg of Protein-G Dynabeads (Invitrogen, 10004D) in 200 µl of binding buffer. After immobilization of anti-DPP4 antibody to beads, 40 µl of DIO mouse plasma and 60 µl of PBS were mixed with 40 µl of antibody-coated bead suspension. The resultant mixture was incubated for 2.5 h at 4 °C on a rotating wheel. After 2.5 h, Dynabeads were separated with a magnet and discarded. This was followed by one more round of immunocapture of DPP4 and discarding of beads. DPP-4 proteolytic activity assay was performed on immunodepleted plasma to confirm DPP-4 immunodepletion. For some experiments, DIO mouse plasma was incubated with anti-DPP4-conjugated or control IgG-conjugated beads, followed by elution of the bound material using 50 mM glycine buffer, pH 2.8.
Separation of plasma proteins using FPLC
Lean or obese mouse plasma (0.2 ml) was diluted 1:1 with PBS and injected onto a Superdex 200 Increase 10/300GL FPLC column (GE Healthcare, 28990944). Plasma proteins were eluted from the column at a constant flow of 0.3 ml/min with PBS (pH 7.4). The effluent was collected in 0.25-ml fractions. The collected fractions were frozen in dry ice and kept at –80 °C until further processing.
In-gel protein digestion
Inflammatory obese mouse plasma, DPP4-depleted obese mouse plasma fractions or DPP4 immunoprecipitated from obese mouse plasma (IP-DPP4) were resolved on a 4–20% Tris–glycine gradient gel and then stained with GelCode Blue Safe Coomassie stain (Thermo Scientific, 24594) for 2 h followed by de-staining with double distilled water overnight. The resolved proteins were excised and processed at Herbert Irving Comprehensive Cancer Center Proteomics Shared Resource, Columbia University. The excised gel pieces were rehydrated and digested in 80 µl of 12.5 ng/µl Trypsin Gold in 50 mM ammonium bicarbonate at 37 °C overnight. After digestion was complete, condensed evaporated water was collected from the tube walls by brief centrifugation using a benchtop microcentrifuge (Eppendorf). The gel pieces and digestion reaction were mixed with 50 µL 2.5% trifluoroacetic acid (TFA) and rigorously mixed for 15 min. The solution with extracted peptides was transferred into a fresh tube. The remaining peptides were extracted with 80 µl 70% acetonitrile–5% TFA mixture using rigorous mixing for 15 min. The extracts were pooled and dried to completion (1.5–2 h) in a SpeedVac. The dried peptides were reconstituted in 30 µl 0.1% TFA by mixing for 5 min and stored in ice or at −20 °C before analysis.
LC–MS/MS analysis
The concentrated peptide mix was reconstituted in a solution containing 2% acetonitrile and 2% formic acid for mass spectrometry analysis. Peptides were eluted from the column using a Dionex Ultimate 3000 Nano liquid chromatography system with a 10-min gradient from 2% buffer B to 35% buffer B (100% acetonitrile, 0.1% formic acid). The gradient was switched from 35% to 85% buffer B over 1 min and held constant for 2 min. Finally, the gradient was changed from 85% buffer B to 98% buffer A (100% water, 0.1% formic acid) over 1 min, and then held constant at 98% buffer A for a further 5 min. The application of a 2.0-kV distal voltage electrosprayed the eluting peptides directly into the Thermo Fusion Tribrid mass spectrometer equipped with an EASY-Spray source (Thermo Scientific). Mass spectrometer-scanning functions and HPLC gradients were controlled by the Xcalibur data system (Thermo Finnigan).
Database search and interpretation of MS/MS data
Tandem mass spectra from raw files were searched against a mouse protein database using the Proteome Discoverer 1.4 software (Thermo Finnigan). The Proteome Discoverer application extracts relevant MS/MS spectra from the .raw file and determines the precursor charge state and the quality of the fragmentation spectrum. The Proteome Discoverer probability-based scoring system rates the relevance of the best matches found by the SEQUEST algorithm. The mouse protein database was downloaded as FASTA-formatted sequences from the Uniprot protein database (database released in September, 2014). The peptide mass search tolerance was set to 10 p.p.m. A minimum sequence length of seven amino acids residues was required. Only fully tryptic peptides were considered. To calculate confidence levels and false discovery rates (FDR), Proteome Discoverer generates a decoy database containing reverse sequences of the non-decoy protein database and performs the search against this concatenated database (non-decoy + decoy). Scaffold (Proteome Software) was used to visualize searched results. The discriminant score was set at less than 1% FDR, determined on the basis of the number of accepted decoy database peptides, to generate protein lists for this study. Spectral counts were used for estimation of relative protein abundance between samples.
Mouse liver nuclei preparation and chromatin immunoprecipitation assays
Mouse liver tissues were homogenized using a Dounce homogenizer (Wheaton) with the loose pestle in 1:10 (w:v) of ice-cold NP-40 lysis buffer supplemented with protease inhibitor cocktail. Liberation of nuclei was monitored by DAPI staining and fluorescence microscopy. To purify intact nuclei, lysates were then layered over a sucrose gradient consisting of 1 M sucrose overlaid with 0.68M sucrose and then centrifuged at 4000 r.p.m. for 20 min at 4 °C. Following a washing step, nuclear pellets were cross-linked with 1% fresh formaldehyde in PBS for 10 min at room temperature. Cross-linking was terminated by addition of 200 mM Tris-HCl (pH 9.4) and 1 mM DTT for 10 min followed by centrifugation at 2,500 r.p.m. for 10 min at 4 °C. Nuclear pellets were suspended in SDS lysis buffer containing protease inhibitors, incubated for 10 min on ice, and DNA was sheared in a cold water bath in a focused-ultrasonicator (Covaris, S2) to obtain DNA fragments with an average size of 500 bp. Fragmented chromatin was pre-cleaned by incubating with normal rabbit IgG (Santa Cruz, sc-2025) for 1 h at 4 °C, followed by 1 h of incubation with 50 µl protein G magnetic beads (Pierce) at 4 °C with rotation. A rabbit anti-ATF4 antibody (Cell Signaling, 11815) to pull down ATF4-binding complexes, and a control rabbit anti-haemagglutinin antibody (Santa Cruz) were used to pull down non-specific binding complexes. Immunoprecipitated chromatin fragments were reverse cross-linked, digested by proteinase K, and purified using QIAquick PCR Purification Kit (Qiagen, 28104). The presence of ATF4 in the Dpp4 exonic region was quantified by qPCR and expressed relative to the input genomic DNA. The sequences of primers used for the ChIP–qPCR assays are described in Supplementary Table 2.
Macrophage assays
ATMs, peritoneal macrophages or BMDMs were incubated for 4 h in medium containing 10% plasma from lean or obese mice and then assayed for Mcp1 or Il6 mRNA using quantitative reverse transcription–PCR (RT–qPCR). ATMs, bone marrow-derived macrophages or human macrophages were incubated for 4 h with 0.25 U/ml rFXa, 175 ng/ml rDPP4, or both proteins together. The cells were then assayed for Mcp1 or Il6 mRNA using RT–qPCR.
Glucan-encapsulated siRNA particle (GERP) study in ob/ob mice
FITC-labelled glucan shells (GS) containing non-targeting (control) siRNA or siRNAs against Par2 or Cav1 were prepared and loaded as previously described38,39. In brief, 2.4 mg of FITC-labelled glucan shells–lectin, 7.2 nmol of siRNA, and 120 nmol of endoporter were combined to form FITC-GERPs. Five-week old ob/ob mice received 12 daily doses of FITC-GERPs by intraperitoneal injection, which contained 0.2 mg FITC-GS, 0.6 nmol siRNA and 10 nmol endoporter. Glucose tolerance and insulin tolerance tests were performed on days seven and ten of GERP treatment, respectively. Mice were euthanized 24 h after the last injection.
Statistical analysis
All results are presented as mean ± s.e.m. For experiments with two groups, P values were calculated using the two-tailed Student’s t-test for normally distributed data and the Mann–Whitney rank sum test for nonnormally distributed data. For experiments with more than two groups, P values were calculated using one-way or two-way ANOVA for normally distributed data and the Kruskal–Wallis by ranks test for non-normally distributed data, with Student–Newman–Keuls or Dunn’s post hoc test. Error bars that appear to be absent from certain graph symbols signify s.e.m. values smaller than the graph symbols.
Data availability
The data that support the findings of this study are available from the corresponding author upon reasonable request.
Extended Data
Extended Data Figure 1. Hepatocyte-specific deletion of CaMKII or ATF4 in DIO mice lowers VAT inflammation.
a–c, Sixteen-week-old Camk2gfl/fl mice that had been previously fed the DIO diet for 13 weeks were injected intravenously with AAV8-TBG-cre (H-CaMKII(KO)) or AAV8-TBG-lacZ (wild-type, WT). Mice were analysed after three additional weeks on the DIO diet. a, Representative images of VAT immunostained for F4/80, with quantification of crown-like-structure (CLS) macrophages, and expression of Adgre1 mRNA, which encodes F4/80. b, As in a, except that the mice were injected with fluorescent beads using a procedure that labels circulating Ly6chi monocytes, and then bead-labelled cells were assayed in VAT sections. c, mRNAs for Il6, Mcp1, Tnf and Il1b in VAT. d, Blood monocyte count. e, Plasma IL6 and TNFα measured by ELISA, and quantification of Adgre1, Mcp1 and Tnfa mRNA in liver. In a–e, n = 4 mice per group; mean ± s.e.m.; *P < 0.05; n.s., not significant by two-tailed Student’s t-test. f, g, Mice similar to those in a–c, and from a third group in which Camk2gfl/fl mice were injected intravenously with adeno-Atf4 and AAV8-TBG-cre (H-CaMKII(KO) + adeno-Atf4). f, CLS macrophages and Adgre1 mRNA in VAT were quantified, with representative images of F4/80-stained VAT. g, Il6, Mcp1, Tnfa and Il1b mRNA in VAT and Adgre1, Mcp1 and Tnfa mRNA in liver were quantified. Note that the first two groups of mice received adeno-lacZ instead of adeno-Atf4. n = 4 mice per group; mean ± s.e.m.; *P < 0.05 by one-way ANOVA; n.s., not significant. h, AAV8-TBG-cre (H-ATF4(KO)) or AAV8-TBG-lacZ (wild-type) was injected intravenously into 16-week-old Aft4fl/fl mice previously fed the DIO diet for 13 weeks. After three further weeks on the DIO diet, VAT from these mice was immunostained for F4/80 to identify macrophages, the percentage of macrophages in CLS was quantified, and the VAT was assayed for Adgre1 and the indicated inflammatory mRNAs. Twelve wild-type and 11 H-ATF4(KO) mice was analysed for CLS macrophages, and a randomly selected subset of five wild-type and five H-ATF4(KO) mice was analysed for the VAT mRNAs. Mean ± s.e.m., *P < 0.05 by two-tailed Student’s t-test.
Extended Data Figure 2. DPP4 in the plasma of DIO mice induces Mcp1 and Il6 in SVF cells from the VAT of obese mice and in macrophages.
a, Representative images of haemotoxylin and eosin-stained VAT sections from lean and DIO mice and Adgre1 mRNA levels in SVF from lean and DIO mice. n = 4 mice per group; mean ± s.e.m.; *P < 0.05. b, SVF cells from the VAT of lean mice were incubated for 4 h in medium containing 10% (v/v) plasma from lean or DIO mice and then assayed for Mcp1 and Il6 mRNA. n = 4 mice per group; mean ± s.e.m.; *P < 0.05; n.s., not significant. c, Mcp1 mRNA was assayed in mouse peritoneal macrophages (Mφs) or bone marrow-derived macrophages that were incubated for 4 h with medium containing 10% (v/v) plasma from lean or DIO mice. n = 5 technical replicates per group; mean ± s.e.m.; *P < 0.05. d, Mcp1 mRNA levels in SVF cells that were incubated for 4 h with medium containing 10% (v/v) control or heat-inactivated (heat) plasma from the indicated groups of mice. n = 6 mice per group; mean ± s.e.m.; *P < 0.05. e, UV protein chromatogram obtained after fractionation of DIO mice plasma using gel-filtration FPLC; vertical grey bar depicts peak of activity shown in f. f, Obese mouse SVF cells were incubated with medium containing 10% lean or DIO mouse plasma or the indicated FPLC fractions from e and assayed for Mcp1 mRNA. n.d., Mcp1 mRNA not detected. Arrows indicate the fractions that were selected for LC–MS/MS analysis. g, LC–MS/MS normalized spectral counts corresponding to DPP4 in the FPLC fractions from f. h, DPP4 activity in the plasma of lean and DIO mice. n = 5 mice per group; mean ± s.e.m.; *P < 0.05. i, SVF cells from DIO mice were incubated for 4 h with medium containing 10% (v/v) lean or DIO mouse plasma that was pre-treated for 1 h with or without 10 µM DPP4 inhibitor KR62436. The cells were then assayed for Il6 mRNA. n = 3 technical replicates per group; mean ± s.e.m.; *P < 0.05. j, VAT from the mice in Extended Data Fig. 1f, g was assayed for Dpp4 mRNA (n = 4). Data in a–c and h were analysed by two-tailed Student’s t-test; data in i and j were analysed by one-way ANOVA (g, h); data in d were analysed by two-way ANOVA.
Extended Data Figure 3. Restoration of DPP4 in livers of H-CaMKII(KO) mice abrogates suppression of VAT inflammation in DIO mice; ATF4 ChIP of the Dpp4 gene; and AAV8-H1-shDpp4 treatment lowers hepatic DPP4.
Wild-type and H-CaMKII(KO) mice and a third group in which Camk2gfl/fl mice were injected intravenously with adeno-Dpp4 together with the AAV8-TBG-cre (H-CaMKII(KO) + adeno-Dpp4) were analysed as follows. a, Body weight, plasma DPP4 activity and liver and VAT DPP4 protein. b, Representative images of VAT immunostained with F4/80 antibody, with quantification of CLS macrophages and Tnfa and Mcp1 mRNA in VAT. Note that the first two groups of mice received adeno-lacZ instead of adeno-DPP4. In a and b, n = 3–4 mice per group; mean ± s.e.m.; *P < 0.05 by one-way ANOVA; n.s., non-significant. For gel source data, see Supplementary Fig. 1. c, Top, ChIP was performed with liver extracts from the indicated groups of mice using anti-ATF4 or control IgG antibodies. The region spanning the predicted ATF4-binding sequence in exon 1 of Dpp4 was amplified by RT–qPCR and normalized to the values obtained from the input. n = 3 ChIP assays for wild-type, H-CaMKII(KO), H-CaMKII(KO) + adeno-Atf4; n = 1 for H-ATF4(KO); n = 10 for control IgG; mean ± s.e.m.; #,*P < 0.05 by one-way ANOVA for groups 1–3. Bottom, per cent input for ATF4 ChIP using liver extracts from the indicated DIO mice and PCR primers for a region in the Dpp4 gene that does not contain a consensus sequence for ATF4 binding. n = 3 ChIP assays for wild type, H-CaMKII(KO), H-CaMKII(KO) + adeno-Atf4; n = 1 for H-ATF4(KO); n = 10 for control IgG; mean ± s.e.m.; n.s., non-significant by one-way ANOVA. d, e, Sixteen-week-old mice previously fed with the DIO diet for 10 weeks were injected intravenously with hepatocyte-specific AAV8-H1-shDpp4 (H-shDpp4) or control AAV8-H1 vector (con). After four additional weeks on DIO diet, the mice were analysed as follows. d, DPP4 immunoblot, with densitometric quantification of DPP4 protein in the indicated tissues; representative of three independent experiments. e, Dpp4 mRNA in liver and VAT. In d and e, n = 5 mice per group; mean ± s.e.m.; *P < 0.05; n.s., non-significant by two-tailed Student’s t-test. See Supplementary Fig. 1 for gel source data.
Extended Data Figure 4. Silencing of DPP4 in liver suppresses VAT inflammation and improves metabolism without increasing plasma incretins.
a, Top, 16-week-old mice previously fed with the DIO diet for 10 weeks were injected intravenously with AAV8-H1-shDpp4 (H-shDpp4) or control AAV8-H1 vector (con). After four weeks, the mice were assayed for Il6, Mcp1, Tnfa and Il1b mRNA in VAT. Bottom, control and H-shDpp4-treated mice similar to those above were analysed nine days after adenovirus injections for Il6, Mcp1, Tnfa and Il1b mRNA in ATMs. b–g, H-shDPP4 and control mice were analysed after four weeks. b–d, Representative images of adipose tissue immunostained with F4/80 antibody, with quantification of CLS macrophages, Adgre1 and inflammatory gene mRNA expression in perirenal, inguinal and brown fat. e, Plasma MCP1, IL6 and TNFα. f, Body weight and food intake. g, Weights of liver and the indicated adipose tissue depots. In a–g, n = 5–6 mice per group; mean ± s.e.m.; *P < 0.05; n.s., non-significant by two-tailed Student’s t-test. h–j, Mice similar to those in b–g were assayed. h, Blood glucose and plasma insulin. i, p-AKT and total AKT in VAT and liver after insulin injection into the portal vein. n = 1 PBS-injected, n = 4 insulin-injected mice per group; blots are representative of three independent experiments. Gel source data are shown in Supplementary Fig. 1. j, Plasma active GIP (1–42) and GLP1 (7–36). In h and j, n = 6 mice per group; mean ± s.e.m.; *P < 0.05; n.s., non-significant by two-tailed
Extended Data Figure 5. Hepatocyte-specific silencing of DPP4 improves glucose metabolism in ob/ob mice without increasing plasma incretins and does not affect VAT inflammation or glucose metabolism in lean mice.
a–h, Five-week-old chow-fed ob/ob mice were injected intravenously with AAV8-H1-shDpp4 (H-shDpp4) or AAV8-H1-control (con), and were assayed four weeks later. a, Body weight. b, Immunoblot of liver and VAT DPP4. c, Representative images of VAT immunostained with F4/80 antibody, with quantification of CLS macrophages and Adgre1 mRNA in VAT. d, Il6, Mcp1, Tnfa and Il1b mRNA in VAT. e, Blood glucose after challenge with intraperitoneal glucose or insulin. f, p-AKT and total AKT in VAT and liver extracts after portal vein insulin injection. g, Blood glucose and plasma insulin 5 h after food withdrawal. h, Plasma active GIP (1–42) and GLP1 (7–36). i–m, Sixteen-week-old chow-fed wild-type lean mice were injected intravenously with AAV8-H1-shDpp4 (H-shDpp4) or AAV8-H1-control (Con) and were analysed as follows. i, Body weight. j, Immunoblot of DPP4 in liver and VAT. k, p-AKT and total AKT in VAT and liver extracts after portal vein insulin injection. l, Blood glucose and plasma insulin 5 h after food withdrawal. m, Blood glucose after challenge with intraperitoneal glucose or insulin. In all panels, n = 5–6 mice per group; mean ± s.e.m.; n.s., non-significant by two-tailed Student's t-test. For gel source data, see Supplementary Fig. 1.
Extended Data Figure 6. Effect of DPP4 silencing on insulin-induced p-AKT in primary hepatocytes, on NEFA in obese or lean mice and on metabolism in comparison with sitagliptin in obese mice.
a, Wild-type or DPP4-silenced primary hepatocytes were treated with or without 50 µM palmitate for 10 h with the last 5 h in serum-free medium, and then stimulated with 100 nM of insulin for 5 min. p-AKT and total AKT and DPP4 were assayed by immunoblot. The data are representative of two independent experiments. b, Plasma samples from the following mice were assayed for non-esterified fatty acids (NEFA) four weeks after intravenous injection with AAV8-H1-shDpp4 (H-shDpp4) or control AAV8-H1 vector (con): 16-week-old mice fed the DIO diet for the last 10 weeks, 5-weekold chow-fed ob/ob mice, and 6-week-old chow-fed wild-type lean mice. n = 5–6 mice per group; mean ± s.e.m.; *P < 0.05 and n.s., non-significant by two-tailed Student's t-test. c–h, After 10 weeks on high-fat diet, control DIO mice, H-shDpp4 DIO mice and DIO mice were administered sitagliptin (sita) in drinking water to achieve a dose of ~30–45 mg/kg/ day. After 4 weeks of treatment, the mice were analysed as follows. c, Body weight. d, Plasma and VAT DPP4 activity. e, Hepatic DPP4 immunoblot and hepatocyte DPP4 activity. f, Blood glucose and plasma insulin 5 h after food withdrawal. g, p-AKT and total AKT in VAT and liver after portal vein insulin injection. h, Plasma non-esterified fatty acids (NEFA). For all quantified data panels except e, n = 6–8 mice per group; for e, n = 4 mice per group; mean ± s.e.m.; *,#P < 0.05 and n.s., non-significant by one-way ANOVA. For gel source data, see Supplementary Fig. 1. i, DIO mice were treated with AAV8-H1-con, AAV8-H1-shDpp4 or sitagliptin (+ AAV8- H1-con) exactly as above, except the mice were analysed after 11 weeks of treatment instead of after 4 weeks. n = 5 mice per group; mean ± s.e.m.; *,# P < 0.05 and n.s., non-significant by one-way ANOVA.
Extended Data Figure 7. DPP4 requires a plasma factor to induce inflammation in SVF.
a, Mcp1 mRNA was assayed in SVF cells that were incubated for 4 h with medium containing 10% (v/v) DIO mouse plasma; DIO mouse plasma immunodepleted of DPP4; recombinant DPP4 (rDPP4) alone; or rDPP4 plus DIO mouse plasma immunodepleted of DPP4. n = 3 technical replicates per group;. mean ± s.e.m. b, As a, except plasma from H-shDPP4 DIO mice were used instead of DPP4-depleted obese mouse plasma, and both Mcp1 and Il6 were assayed (n = 5 technical replicates per group; mean ± s.e.m.). In a and b, groups with different symbols are different from each other (P < 0.05 by one-way ANOVA). c, DPP4-depleted plasma from DIO mice was fractionated by Superdex-200 FPLC. Each fraction, as well as unfractionated DIO mouse plasma, was incubated with SVF cells with or without rDPP4, followed by assay of Mcp1 mRNA. n.d., Mcp1 mRNA not detected. The fraction numbers in red (arrows) were selected for LC–MS/MS analysis. The data are from a single experiment.
Extended Data Figure 8. DPP4 and FXa synergistically promote VAT inflammation, and inhibition of FXa improves glucose metabolism.
a, LC–MS/MS normalized spectral counts corresponding to FX in the indicated FPLC fractions from Extended Fig. 7c. b, SVF cells or BMDMs were pre-incubated for 1 h with or without 10 µM FXa inhibitor rivaroxaban (riv) and then incubated with medium containing 10% (v/v) plasma from lean or DIO mice and assayed for Mcp1 mRNA. n = 3 technical replicates per group; mean ± s.e.m.; *,#P < 0.05 by twoway ANOVA. c, BMDMs were pretreated with or without 10 µM FXa inhibitor rivaroxaban (riv) or 10 µM DPP4 inhibitor KR62436, followed by incubation for 4 h with rFX or rDPP4 alone or both together. Il6 mRNA was then quantified. n = 4 technical replicates per group; mean ± s.e.m.; #,*P < 0.05 by one-way ANOVA. d, SVF cells from lean or DIO mice were treated with rFX or rDPP4 alone or in combination for 4 h, and then Mcp1 and Il6 mRNA levels were assayed (n = 4 technical replicates per group; mean ± s.e.m.; *P < 0.05 and n.s., non-significant by one-way ANOVA). e–j, The control and rivaroxaban-treated mice from Fig. 3b, c were assayed. e, Body weight. f, Adgre1, Mcp1, Il6, Tnfa and Il1b mRNA in VAT. g, h, Blood glucose and plasma insulin 5 h after food withdrawal. i, p-AKT and total AKT in VAT and liver after portal vein insulin injection. j, Plasma non-esterified fatty acids (NEFA). In e–h and j, n = 5 mice per group; mean ± s.e.m.; *P < 0.05 and n.s., non-significant by two-tailed Student’s t-test. In i, the mean fold increases of the plus-insulin values relative to the minus-insulin value, based on the densitometric ratio of p-AKT:total AKT, are shown below the blots (n = 1 PBS-injected and n = 4-insulin injected mice per group; mean ± s.e.m.; *P < 0.05). For gel source data, see Supplementary Fig. 1.
Extended Data Figure 9. DPP4 and FXa synergistically induce inflammatory signalling pathways in macrophages.
a, BMDMs were pretreated for 4 h with or without 0.25 U rFXa, medium was then removed, cells were washed and treated with 10 µM rivaroxaban (riv) to inhibit residual FXa activity. The cells were then incubated for 4 h with or without 70 ng rDPP4 and assayed for Mcp1 and Il6 mRNA. b, BMDMs were pre-treated for 4 h with or without 70 ng rDPP4, medium was then removed, cells were washed and treated with 10 µM KR62436 to inhibit residual DPP4 activity. The cells were then incubated for 4 h with or without 0.25 U rFXa and assayed for Mcp1 and Il6 mRNA. In a and b, n = 3 technical replicates per group; mean ± s.e.m.; *P < 0.05 versus all other groups by one-way ANOVA. c, ATMs were pre-treated for 1 h with or without 10 µM of the PAR2 inhibitor GB83, 25 µM of the CAV1 inhibitor daidzein, 10 µM of the MEK inhibitor PD98059 or 10 µM of the IKK inhibitor PS-1145. The cells were then incubated for 4 h with or without rFXa and rDPP4 and assayed for Mcp1 and Il6 mRNA. n = 4 technical replicates per group; mean ± s.e.m.; *,#P < 0.05 by one-way ANOVA. d, Human monocyte-derived macrophages were pre-treated for 1 h with or without 10 µM PAR2 inhibitor (GB83) or 25 µM CAV1 inhibitor (daidzein) and then incubated for 4 h with or without rFXa, rDPP4 or both and assayed for MCP1 and IL6 mRNA. n = 3 technical replicates; mean ± s.e.m.; #,*P < 0.05 versus all other groups by one-way ANOVA. e–g, Bone marrow-derived macrophages were incubated for 10 min with or without 0.25 U rFXa, 70 ng rDPP4 or rFXa plus rDPP4 and then assayed by immunoblot for phosphorylated and total IRAK1, TAK1, RAF1, ERK1/2 and P65, followed by densitometric quantification. The data are representative of two (e, f) or three (g) independent experiments. For all panels, n = 3 technical replicates per group; mean ± s.e.m.; *P < 0.05 versus other groups and n.s., not significant by one-way ANOVA. h–j, Bone marrow-derived macrophages were pretreated for 1 h with or without the following inhibitors. h, IRAK-1/4 inhibitor-I, 0.5 µM. i, TAK1 MAPKKK inhibitor Z-7-oxozeaenol, 0.1 µM. j, RAF1 inhibitor GW5074, 1 µM. Cells were then incubated for 4 h with or without rFXa plus rDPP4 and assayed for Mcp1 and Il6 mRNA. n = 4 technical replicates per group; mean ± s.e.m.; *P < 0.05 by one-way ANOVA.
Extended Data Figure 10. Supporting data for GERP experiments.
a, Five-week-old chow-fed ob/ob mice were treated daily by intraperitoneal injection of FITC-labelled glucan shells for 12 days and then assayed by DAPI staining, F4/80 immunofluorescence and glucan shell fluorescence in the indicated tissues. b–e, Five-week-old chow-fed ob/ob mice were injected intraperitoneally once daily for 12 days with 0.2 mg GERPs containing scrambled siRNA (control), Par2 siRNA or Cav1 siRNA. The mice were analysed 24 h after the last injection. b, Body weight. c, Immunoblots of PAR2 and CAV1 in ATMs and splenic extracts. d, Il6, Mcp1, Tnfa and Il1b mRNA in VAT. e, Plasma non-esterified fatty acids (NEFA). In b, d and e, n = 5–6 mice per group; *P < 0.05 and n.s., non-significant by two-tailed Student’s t-test for each siRNA GERP versus control GERP. For gel source data, see Supplementary Fig. 1.
Supplementary Material
Acknowledgments
We thank F. S. Katz for assistance with FPLC; R. Kaufman for adeno-ATF4; C. Adams and S. Bullard for Atf4fl/fl mice; and A. Ferrante, S. Ramakrishnan, J. Weitz and T. McGraw for discussions. E.C. was supported by NIH grant 5P30CA013696-42. I.T. was funded by grants from the NIH (HL087123 and HL075662) and by a grant from the Merck Investigator Studies Program. L.O. was funded by the NIH grant DK106045 and a grant from the Columbia University Diabetes Research Center (P30 DK063608). Y.S., S.M.N. and M.P.C. were funded by NIH grant DK103047. M.B. was funded by the Deutsche Forschungsgemeinschaft grant SFB1052.
Footnotes
Supplementary Information is available in the online version of the paper.
Author Contributions D.S.G., L.O. and I.T. designed the study, analysed data and wrote the manuscript. D.S.G., L.O. and Z.Z. conducted the experiments. S.M.N., Y.S. and M.P.C. made the glucan-encapsulated siRNA particles (GERPs) and helped design these experiments and analyse the data. E.C. conducted the LC–MS/MS studies and assisted with data analysis. M.B. helped with interpretation of data.
The authors declare no competing interests.
References
- 1.Dasgupta S, et al. NF-κB mediates lipid-induced fetuin-A expression in hepatocytes that impairs adipocyte function effecting insulin resistance. Biochem. J. 2010;429:451–462. doi: 10.1042/BJ20100330. [DOI] [PubMed] [Google Scholar]
- 2.Weisberg SP, et al. Obesity is associated with macrophage accumulation in adipose tissue. J. Clin. Invest. 2003;112:1796–1808. doi: 10.1172/JCI19246. [DOI] [PMC free article] [PubMed] [Google Scholar]
- 3.Xu H, et al. Chronic inflammation in fat plays a crucial role in the development of obesity-related insulin resistance. J. Clin. Invest. 2003;112:1821–1830. doi: 10.1172/JCI19451. [DOI] [PMC free article] [PubMed] [Google Scholar]
- 4.Hardy OT, et al. Body mass index-independent inflammation in omental adipose tissue associated with insulin resistance in morbid obesity. Surg. Obes. Relat. Dis. 2011;7:60–67. doi: 10.1016/j.soard.2010.05.013. [DOI] [PMC free article] [PubMed] [Google Scholar]
- 5.Blüher M. Adipose tissue inflammation: a cause or consequence of obesity-related insulin resistance? Clin. Sci (Lond.) 2016;130:1603–1614. doi: 10.1042/CS20160005. [DOI] [PubMed] [Google Scholar]
- 6.Hotamisligil GS, Shargill NS, Spiegelman BM. Adipose expression of tumor necrosis factor-α: direct role in obesity-linked insulin resistance. Science. 1993;259:87–91. doi: 10.1126/science.7678183. [DOI] [PubMed] [Google Scholar]
- 7.Lumeng CN, Saltiel AR. Inflammatory links between obesity and metabolic disease. J. Clin. Invest. 2011;121:2111–2117. doi: 10.1172/JCI57132. [DOI] [PMC free article] [PubMed] [Google Scholar]
- 8.Aouadi M, et al. Gene silencing in adipose tissue macrophages regulates whole-body metabolism in obese mice. Proc. Natl Acad. Sci. USA. 2013;110:8278–8283. doi: 10.1073/pnas.1300492110. [DOI] [PMC free article] [PubMed] [Google Scholar]
- 9.Ozcan L, et al. Calcium signaling through CaMKII regulates hepatic glucose production in fasting and obesity. Cell Metab. 2012;15:739–751. doi: 10.1016/j.cmet.2012.03.002. [DOI] [PMC free article] [PubMed] [Google Scholar]
- 10.Ozcan L, et al. Activation of calcium/calmodulin-dependent protein kinase II in obesity mediates suppression of hepatic insulin signaling. Cell Metab. 2013;18:803–815. doi: 10.1016/j.cmet.2013.10.011. [DOI] [PMC free article] [PubMed] [Google Scholar]
- 11.Ozcan L, et al. Hepatocyte DACH1 is increased in obesity via nuclear exclusion of HDAC4 and promotes hepatic insulin resistance. Cell Reports. 2016;15:2214–2225. doi: 10.1016/j.celrep.2016.05.006. [DOI] [PMC free article] [PubMed] [Google Scholar]
- 12.Boonacker E, Van Noorden CJ. The multifunctional or moonlighting protein CD26/DPPIV. Eur. J. Cell Biol. 2003;82:53–73. doi: 10.1078/0171-9335-00302. [DOI] [PubMed] [Google Scholar]
- 13.Kirino Y, Sei M, Kawazoe K, Minakuchi K, Sato Y. Plasma dipeptidyl peptidase 4 activity correlates with body mass index and the plasma adiponectin concentration in healthy young people. Endocr. J. 2012;59:949–953. doi: 10.1507/endocrj.ej12-0158. [DOI] [PubMed] [Google Scholar]
- 14.Lamers D, et al. Dipeptidyl peptidase 4 is a novel adipokine potentially linking obesity to the metabolic syndrome. Diabetes. 2011;60:1917–1925. doi: 10.2337/db10-1707. [DOI] [PMC free article] [PubMed] [Google Scholar]
- 15.Drucker DJ, Nauck MA. The incretin system: glucagon-like peptide-1 receptor agonists and dipeptidyl peptidase-4 inhibitors in type 2 diabetes. Lancet. 2006;368:1696–1705. doi: 10.1016/S0140-6736(06)69705-5. [DOI] [PubMed] [Google Scholar]
- 16.Guilherme A, Virbasius JV, Puri V, Czech MP. Adipocyte dysfunctions linking obesity to insulin resistance and type 2 diabetes. Nat. Rev. Mol. Cell Biol. 2008;9:367–377. doi: 10.1038/nrm2391. [DOI] [PMC free article] [PubMed] [Google Scholar]
- 17.Ristic S, Byiers S, Foley J, Holmes D. Improved glycaemic control with dipeptidyl peptidase-4 inhibition in patients with type 2 diabetes: vildagliptin (LAF237) dose response. Diabetes Obes. Metab. 2005;7:692–698. doi: 10.1111/j.1463-1326.2005.00539.x. [DOI] [PubMed] [Google Scholar]
- 18.Aschner P, et al. Effect of the dipeptidyl peptidase-4 inhibitor sitagliptin as monotherapy on glycemic control in patients with type 2 diabetes. Diabetes Care. 2006;29:2632–2637. doi: 10.2337/dc06-0703. [DOI] [PubMed] [Google Scholar]
- 19.Raz I, et al. Efficacy and safety of the dipeptidyl peptidase-4 inhibitor sitagliptin as monotherapy in patients with type 2 diabetes mellitus. Diabetologia. 2006;49:2564–2571. doi: 10.1007/s00125-006-0416-z. [DOI] [PubMed] [Google Scholar]
- 20.Kutoh E, Ukai Y. Alogliptin as an initial therapy in patients with newly diagnosed, drug naïve type 2 diabetes: a randomized, control trial. Endocrine. 2012;41:435–441. doi: 10.1007/s12020-012-9596-0. [DOI] [PubMed] [Google Scholar]
- 21.Kadowaki T, Kondo K. Efficacy, safety and dose-response relationship of teneligliptin, a dipeptidyl peptidase-4 inhibitor, in Japanese patients with type 2 diabetes mellitus. Diabetes Obes. Metab. 2013;15:810–818. doi: 10.1111/dom.12092. [DOI] [PubMed] [Google Scholar]
- 22.Jung CH, et al. A randomized, double-blind, placebo-controlled, phase II clinical trial to investigate the efficacy and safety of oral DA-1229 in patients with type 2 diabetes mellitus who have inadequate glycaemic control with diet and exercise. Diabetes Metab. Res. Rev. 2015;31:295–306. doi: 10.1002/dmrr.2613. [DOI] [PMC free article] [PubMed] [Google Scholar]
- 23.Mulvihill EE, et al. Cellular sites and mechanisms linking reduction of dipeptidyl peptidase-4 activity to control of incretin hormone action and glucose homeostasis. Cell Metab. 2017;25:152–165. doi: 10.1016/j.cmet.2016.10.007. [DOI] [PubMed] [Google Scholar]
- 24.Senden NH, et al. Factor Xa induces cytokine production and expression of adhesion molecules by human umbilical vein endothelial cells. J. Immunol. 1998;161:4318–4324. [PubMed] [Google Scholar]
- 25.Busch G, et al. Coagulation factor Xa stimulates interleukin-8 release in endothelial cells and mononuclear leukocytes: implications in acute myocardial infarction. Arterioscler. Thromb. Vasc. Biol. 2005;25:461–466. doi: 10.1161/01.ATV.0000151279.35780.2d. [DOI] [PubMed] [Google Scholar]
- 26.McGee MP, Wallin R, Wheeler FB, Rothberger H. Initiation of the extrinsic pathway of coagulation by human and rabbit alveolar macrophages: a kinetic study. Blood. 1989;74:1583–1590. [PubMed] [Google Scholar]
- 27.Ohnuma K, et al. CD26 mediates dissociation of Tollip and IRAK-1 from caveolin-1 and induces upregulation of CD86 on antigen-presenting cells. Mol. Cell. Biol. 2005;25:7743–7757. doi: 10.1128/MCB.25.17.7743-7757.2005. [DOI] [PMC free article] [PubMed] [Google Scholar]
- 28.Zuo P, et al. Factor Xa induces pro-inflammatory cytokine expression in RAW 264.7 macrophages via protease-activated receptor-2 activation. Am. J. Transl. Res. 2015;7:2326–2334. [PMC free article] [PubMed] [Google Scholar]
- 29.Dobrian AD, et al. Dipeptidyl peptidase IV inhibitor sitagliptin reduces local inflammation in adipose tissue and in pancreatic islets of obese mice. Am. J. Physiol. Endocrinol. Metab. 2011;300:E410–E421. doi: 10.1152/ajpendo.00463.2010. [DOI] [PMC free article] [PubMed] [Google Scholar]
- 30.Pedersen DJ, et al. A major role of insulin in promoting obesity-associated adipose tissue inflammation. Mol. Metab. 2015;4:507–518. doi: 10.1016/j.molmet.2015.04.003. [DOI] [PMC free article] [PubMed] [Google Scholar]
- 31.Fitzgerald K, et al. A highly durable RNAi therapeutic inhibitor of PCSK9. N. Engl. J. Med. 2017;376:41–51. doi: 10.1056/NEJMoa1609243. [DOI] [PMC free article] [PubMed] [Google Scholar]
- 32.Lisowski L, et al. Selection and evaluation of clinically relevant AAV variants in a xenograft liver model. Nature. 2014;506:382–386. doi: 10.1038/nature12875. [DOI] [PMC free article] [PubMed] [Google Scholar]
- 33.Ebert SM, et al. Stress-induced skeletal muscle Gadd45a expression reprograms myonuclei and causes muscle atrophy. J. Biol. Chem. 2012;287:27290–27301. doi: 10.1074/jbc.M112.374777. [DOI] [PMC free article] [PubMed] [Google Scholar]
- 34.Mu X, et al. Hepatocellular carcinoma originates from hepatocytes and not from the progenitor/biliary compartment. J. Clin. Invest. 2015;125:3891–3903. doi: 10.1172/JCI77995. [DOI] [PMC free article] [PubMed] [Google Scholar]
- 35.Shimano H, et al. Overproduction of cholesterol and fatty acids causes massive liver enlargement in transgenic mice expressing truncated SREBP-1a. J. Clin. Invest. 1996;98:1575–1584. doi: 10.1172/JCI118951. [DOI] [PMC free article] [PubMed] [Google Scholar]
- 36.Orr JS, Kennedy AJ, Hasty AH. Isolation of adipose tissue immune cells. J. Vis. Exp. 2013;22:e50707. doi: 10.3791/50707. [DOI] [PMC free article] [PubMed] [Google Scholar]
- 37.Nazarian A, et al. Inhibition of circulating dipeptidyl peptidase 4 activity in patients with metastatic prostate cancer. Mol. Cell. Proteomics. 2014;13:3082–3096. doi: 10.1074/mcp.M114.038836. [DOI] [PMC free article] [PubMed] [Google Scholar]
- 38.Aouadi M, et al. Orally delivered siRNA targeting macrophage Map4k4 suppresses systemic inflammation. Nature. 2009;458:1180–1184. doi: 10.1038/nature07774. [DOI] [PMC free article] [PubMed] [Google Scholar]
- 39.Cohen JL, et al. Peptide- and amine-modified glucan particles for the delivery of therapeutic siRNA. Mol. Pharm. 2016;13:964–978. doi: 10.1021/acs.molpharmaceut.5b00831. [DOI] [PMC free article] [PubMed] [Google Scholar]
Associated Data
This section collects any data citations, data availability statements, or supplementary materials included in this article.
Supplementary Materials
Data Availability Statement
The data that support the findings of this study are available from the corresponding author upon reasonable request.


