

ABSTRACT
Due to the rise of drug-resistant forms of tuberculosis, there is an urgent need for novel antibiotics to effectively combat these cases and shorten treatment regimens. Recently, drug screens using whole-cell analyses have been shown to be successful. However, current high-throughput screens focus mostly on stricto sensu life/death screening that give little qualitative information. In doing so, promising compound scaffolds or nonoptimized compounds that fail to reach inhibitory concentrations are missed. To accelerate early tuberculosis (TB) drug discovery, we performed RNA sequencing on Mycobacterium tuberculosis and Mycobacterium marinum to map the stress responses that follow upon exposure to subinhibitory concentrations of antibiotics with known targets, ciprofloxacin, ethambutol, isoniazid, streptomycin, and rifampin. The resulting data set comprises the first overview of transcriptional stress responses of mycobacteria to different antibiotics. We show that antibiotics can be distinguished based on their specific transcriptional stress fingerprint. Notably, this fingerprint was more distinctive in M. marinum. We decided to use this to our advantage and continue with this model organism. A selection of diverse antibiotic stress genes was used to construct stress reporters. In total, three functional reporters were constructed to respond to DNA damage, cell wall damage, and ribosomal inhibition. Subsequently, these reporter strains were used to screen a small anti-TB compound library to predict the mode of action. In doing so, we identified the putative modes of action for three novel compounds, which confirms the utility of our approach.
KEYWORDS: RNA sequencing, antibiotics, mycobacteria, stress responses
INTRODUCTION
Tuberculosis (TB) is caused by the human pathogen Mycobacterium tuberculosis. Annually, 10 million new TB cases are reported worldwide, according to the WHO (1). In total, 1.7 million people died of the consequences of TB infection in 2016, placing M. tuberculosis at the top of the list of deadliest bacterial pathogens known to humankind. Patients diagnosed with drug-susceptible forms of TB can be cured with a 6-month treatment regimen that includes four different drugs, i.e., pyrazinamide, isoniazid, ethambutol, and rifampin (1). Treatment is complicated when M. tuberculosis is resistant to one or more first-line anti-TB agents. These cases are classified as multidrug-resistant TB (MDR-TB) or extensively drug-resistant TB (XDR-TB). As a result, the length of treatment is increased dramatically to 24 to 48 months (2, 3). Moreover, these forms of TB require second- and/or third-line anti-TB drugs, which are generally more prone to cause side effects due to drug toxicity (4). This toxicity leads to an increase in adverse events and a concomitant decrease in patient compliance. As a result, patients undergo intermittent treatment, which likely contributes to the increase in observed drug resistance. Overall, this leads to an increase in the heterogeneity of mycobacterial populations within patients (5, 6).
The identification of new anti-TB drugs has proven to be a challenge. One of the reasons for this is the intrinsic resistance of M. tuberculosis to drug treatment. Mycobacteria possess a lipid-rich and thick cell wall containing very hydrophobic long-chained fatty acids known as mycolic acids (7). In addition, the presence of effective efflux pumps and a chromosomally encoded beta-lactamase also significantly reduce the intracellular half-lives of compounds, and thus, drug activity (8). Despite these difficulties, high-throughput screening (HTS) using a whole-cell assay can be successful in the identification of compounds that inhibit growth of or kill the bacterium (9). Examples of these are diarylquinolines (bedaquiline) and the more recently discovered benzothiazinones (10, 11). However, compared to other didermic bacteria, the overall hit rate is low, and specific chemical moieties are overrepresented, indicative of a scaffold exhaustion within current life/death screenings. Moreover, there is no direct insight into the mode of action (MoA) in HTS approaches, which requires the tedious process of finding resistant mutants in a target which might not always reflect the MoA accurately. Although it is the ultimate goal to find a strong and potent inhibitor of mycobacterial growth, in reality, compounds or even compound scaffolds are likely far from their optimal forms. This is usually due to suboptimal potency and/or affinity that require optimization by directed chemical modification. Because chemical scaffolds rarely reach their MICs, promising lead compounds might be missed in classical HTS approaches. Moreover, compounds that synergize with current treatment or compounds that potentiate treatment to existing antibiotics, like the recently discovered SMARt-420 compound that reverses ethionamide resistance, could be missed (12).
Whole-cell-based screens with a different readout than life/death have already proven to be successful in the identification of ESX-1 inhibitors which block the virulence of this bacterium (13). A different approach to increase the sensitivity of an HTS, and to acquire more qualitative information from screens, is to analyze the induction of stress responses upon treatment with currently used antibiotics. So-called reporter strains with fluorescent or bioluminescent reporters will allow screening for new compounds which have a similar target or mode of action. An example of such a system is the iniBAC operon, which is highly induced when antibiotics targeting mycobacterial cell envelope biogenesis are applied. An iniBAC reporter has been used by our group and other groups as a tool to swiftly obtain information on the possible MoA of new potential drugs (14–16). To identify more candidate stress reporters, we decided to map the bacterial stress responses that follow upon treatment with currently used antibiotics, with a defined MoA and target. Although individual data sets have previously been reported, a complete overview is missing (17). To bridge this gap in knowledge, we performed RNA sequencing on both M. marinum and M. tuberculosis treated with the following first- and second-line antibiotics: ciprofloxacin, which inhibits DNA unwinding; ethambutol and isoniazid, both which target the mycobacterial cell wall; streptomycin, which inhibits ribosomes; and rifampin, which inhibits RNA polymerase. We show that M. marinum has a far more defined stress fingerprint upon exposure to these antibiotics than M. tuberculosis and argue that this distinctive power of M. marinum allows more clear-cut assays for quick MoA determination. We subsequently constructed stress reporters based on these data and confirmed the upregulation found in our RNA sequencing data.
RESULTS
RNA sequencing reveals that M. tuberculosis and M. marinum overlap in SOS response activation.
To map the bacterial stress responses upon antibiotic treatment, we decided to utilize RNA sequencing, a powerful and unbiased tool to map the complete pool of mRNAs present at a certain time point. We chose to include M. marinum, which is a well-established model for tuberculosis virulence research due to its genetic similarity with M. tuberculosis (>85% nucleotide identity), its relative ease of handling, and its relatively high growth rate compared with M. tuberculosis (18). We used five different first-line antibiotics, ethambutol, isoniazid, pyrazinamide, rifampin, streptomycin, and 1 second-line drug, the fluoroquinolone ciprofloxacin. Pyrazinamide was excluded from the subsequent experiments, as activity was difficult to reproduce in vitro. RNA was isolated at two different time points, i.e., at 4 h and 24 h after exposure. As a control, the RNA of untreated cultures was isolated to serve as a reference for differential gene expression. Before the isolation of RNA, we made sure that the antibiotic concentrations that we used to treat the mycobacteria were not bactericidal. We aimed at a concentration that caused a slight growth defect, as determined by optical density (M. marinum, shown in Fig. S1). After RNA isolation, RNA integrity numbers (RIN) were determined to be >9 for all samples. High reproducibility between replicates was observed, as indicated in Fig. S2. Analysis comparing the reproducibility between replicates was performed, and results are shown for M. tuberculosis (Fig. S2A) and for M. marinum (Fig. S2B). We also visualized the correlation for untreated and ciprofloxacin-treated cells for M. tuberculosis (Fig. S3A) and M. marinum (Fig. S3B). The highest overall correlation between untreated samples of M. tuberculosis was 0.98. For ciprofloxacin, the correlation between samples was 0.97. In M. marinum, these respective values are 0.95 and 0.96.
We decided to examine the reliability of our RNA sequencing data by comparing our ciprofloxacin stress profile with previously published data on ciprofloxacin induction and the SOS regulon members in M. tuberculosis (19, 20). In Fig. 1A, the expression profiles of M. marinum and M. tuberculosis are compared with their respective untreated controls 4 h after treatment. Only genes with an M. marinum orthologue were included in the analysis. Generally, the concordance between the expression levels of M. marinum and M. tuberculosis in response to ciprofloxacin and the concordance with published members of the SOS response were high. In the study by Smollett et al., 23 genes were predicted to have binding sites for the major SOS response regulator LexA in their promoter region (20). Although the presence of this binding site does not predict upregulation or downregulation, we found differential expression in our RNA sequencing for 21/22 of these genes in M. tuberculosis and for 17/18 of the predicted orthologues in M. marinum. Moreover, we confirmed 13/16 of the upregulated genes that were identified in the paper from O'Sullivan et al. for M. tuberculosis and upregulation of 12/15 of the alleged orthologues for M. marinum (19). Minor differences can be observed between M. marinum and M. tuberculosis at the 4-h time point. However, the overlap between the two species further increased at the 24-h time point (Fig. 1B). Based on these data, it is likely that it takes M. tuberculosis longer than M. marinum to mount a stress response to ciprofloxacin. These different early time point responses could be due to the difference in growth speeds between the two species. In conclusion, we observe a strong correlation between previously identified SOS response members and our RNA sequencing data set for both M. marinum and M. tuberculosis, indicating that our analysis is reliable. Moreover, M. marinum shows a high resemblance to M. tuberculosis in terms of SOS response activation upon antibiotic treatment, supporting its use as a model system.
FIG 1.

RNA sequencing of M. tuberculosis and M. marinum reveals a clear induction of known SOS response genes after ciprofloxacin treatment. Shown is a comparison of our ciprofloxacin stress profiles with previously published data on ciprofloxacin induction and the SOS regulon members in M. tuberculosis (19, 20). (A) M. marinum and M. tuberculosis expression profiles (4 h after treatment) are compared with their respective untreated controls. Red indicates upregulation, whereas green indicates downregulation. Color intensity indicates relative higher upregulation and downregulation, respectively. (B) Same correlation as in panel A for the 24-h time point. Only genes that have an orthologue in both species were selected based on the publications of Smollett et al. (20) and O'Sullivan et al. (19). The concordance between the expression levels of M. marinum and M. tuberculosis in response to ciprofloxacin and the concordance with published members of the SOS response were high.
M. marinum mounts an antibiotic stress response specific for antibiotic subclasses.
One of the open questions was whether mycobacteria mount a more general stress response or if they activate specialized repair mechanisms to counteract a specific type of damage (i.e., mistranslation or cell wall damage) caused by the encountered antibiotic. The ciprofloxacin analysis indicated that known members of the SOS response are induced, but it also showed notable differences between M. marinum and M. tuberculosis. Possibly, these two strains respond differently to antibiotic stress. To visualize this, we looked at the overlap of the induced genes at 4 h and 24 h for both M. marinum and M. tuberculosis. Surprisingly, M. tuberculosis induced a large number of identical genes in response to antibiotics with very different cellular targets, leading to a significant overlap in the observed transcriptional response (Fig. 2A). These genes include nonspecific, and more general, stress genes, like hspX, acr, and hrp1. In contrast, M. marinum seems to mount a stress response that is highly specific for the type of antibiotic used and thus for the type of damage, showing virtually no overlap between the different antibiotics (Fig. 2B). This is also visible when the data are sorted based on Gene Ontology (GO) groups. The results for 4 h after treatment and 24 h after treatment provide a very specific stress fingerprint (Fig. 3). For M. tuberculosis, the Gene Ontology groups overlap more between antibiotics (Fig. S4). From these combined data, we conclude that because of the specific transcriptional response to antibiotics, M. marinum is a better organism to investigate the mode of action of new antibiotics by stress reporters.
FIG 2.

There is overlap in up- and downregulated genes for both M. tuberculosis and M. marinum. Combined Venn diagrams were made based on combined (4 and 24 h after treatment) transcriptional responses. (A) Number of genes for M. tuberculosis that are upregulated (left) or downregulated (right). (B) Number of genes for M. marinum that are upregulated (left) or downregulated (right). Colors indicate the antibiotic CIP (blue), EMB (brown), INH (red), RIF (green), and STR (yellow).
FIG 3.

M. marinum shows a specific stress fingerprint for each type of antibiotic. The stress fingerprint of M. marinum visualized per antibiotic for selected Gene Ontology (GO) terms. The type of gene product that a gene encodes determines the GO term. The size of the dot reflects the P value (see key on the right).
Constructing reporter strains based on the M. marinum antibiotic stress responses.
Since M. marinum mounts a more rapid and specific stress response, we decided to construct stress reporters based on the generated data set of M. marinum in response to antibiotics. Genes were selected based on the induction levels for a specific antibiotic, exclusively responding to that antibiotic, and also on the total RNA levels upon induction, to ensure that the promoter strength is strong enough to produce ample levels of reporter proteins. For the response to the two antibiotics that target cell envelope biogenesis, i.e., ethambutol (EMB) and isoniazid (INH), there was an extensive overlap in response. Therefore, we decided to allow an overlap in induction for these two antibiotics. Previous studies showed that the selected genes were not expressed upon exposure to environmental stresses or host signals, like hypoxia, starvation, or during macrophage infection (21–25). In total, we selected 10 genes and cloned the promoter regions (Table S1) in front of a reporter gene encoding the green fluorescent protein (GFP) variant mEos3.2 (26). The selected genes (Table S2) included responders to rifampin (2 genes), ciprofloxacin (2 genes), streptomycin (3 genes), and isoniazid (3 genes). Of these genes, only the following three produce proteins that have been previously described in the literature: hflX, found to be upregulated by streptomycin, is a GTPase gene that functions as a ribosome-binding protein in Escherichia coli (27); eis, an acetyltransferase gene, was induced by streptomycin and was secreted during macrophage infection (28); and the gene mmpR5, which encodes a regulator of the efflux components MmpL5 and MmpS5, was previously found to be induced by clofazimine and bedaquiline (29, 30). We included the previously published iniBAC reporter for EMB/INH, which served as a positive control in the subsequent experimental procedures (15).
Flow cytometry confirms the functionality of INH-rep, STR-rep, and CIP-rep stress reporters.
In order to confirm that the stress reporters were functional, flow cytometry experiments were performed. In these assays, cultures were followed over time, and fluorescence induction was measured after the addition of antibiotics. Of the 10 stress reporters, three reporters were found to have a reproducible upregulation upon antibiotic exposure strong enough to be measured by flow cytometry (Fig. S5). These constructs contained promoter regions from MMAR_1007 (250 bp from the 5′ end of the gene), MMAR_2946 (300 bp from the 5′ end of the gene), and MMAR_4645 (1,000 bp from the 5′ end of the gene). Here, we refer to the constructs containing these promoters as INH-rep, STR-rep, and CIP-rep, respectively. (Details on the promoter regions of these reporters can be found in Supplemental Data Set S1.) Although marginally so, INH-rep responded to isoniazid treatment, as measured by flow cytometry. When corrected for the untreated control, the INH-rep was upregulated 1.7-fold (Fig. 4). Flow cytometry analysis of our STR-rep strain revealed that the reporter has high background fluorescence. However, upon the addition of a sublethal concentration of streptomycin, there was a reproducible 3-fold induction 3 days after treatment (Fig. 4). CIP-rep was the most highly induced reporter, with an upregulation of 34-fold after 1 day of ciprofloxacin treatment. The reporter further induced to a maximum of 46-fold after 2 days (Fig. 4). The strain showed a low background signal and a clear fluorescence induction after the addition of antibiotics. In conclusion, we managed to construct functional stress reporters for ciprofloxacin-, isoniazid-, and streptomycin-induced stresses in M. marinum experiments. However, because of the high dynamic range and obvious potential of the CIP-rep, we decided to focus on this reporter.
FIG 4.
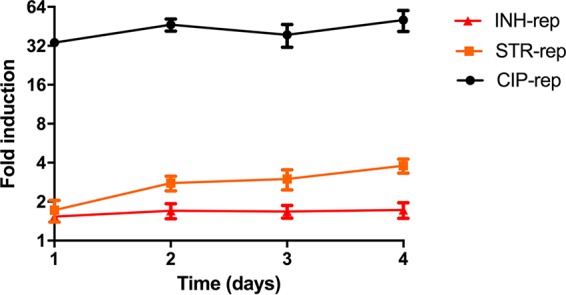
Three separate reporters for DNA damage caused by ciprofloxacin, inhibition of protein translation by streptomycin, and cell wall damage by isoniazid are functional. Cultures of CIP-rep (MMAR_4645 promoter construct, black), STR-rep (MMAR_2946 promoter construct, orange), and INH-rep (MMAR_1007 promoter construct, red) cultures were monitored for fluorescence induction over time compared to their untreated counterparts. The fold inductions were calculated relative to the corresponding untreated parent reporter strain culture (MFI treated divided by MFI untreated). Experiments were performed in triplicate. Standard deviations are indicated with the error bars.
Time-lapse imaging of our CIP-rep strain reveals two different induction phenotypes in response to ciprofloxacin.
In addition to flow cytometry experiments, we performed time-lapse microscopy on our CIP-rep strain to examine the induction kinetics and address induction heterogeneity. Here, we followed fluorescence induction over time before treatment (16 h), during treatment with 1× the MIC of ciprofloxacin (30 h), and in recovery from treatment (24 h) (Movie S1). Stills of the induction experiment can be found in Fig. S6. Our previously constructed iniBAC reporter was taken along as a positive control and showed a clear fluorescence induction in the system (Movie S2).
Quantification of the fluorescence induction for single CIP-rep cells was performed for both ciprofloxacin-tolerant cells and drug-susceptible cells. A cell was classified as ciprofloxacin tolerant if it either resumed growth during the recovery period or produced at least one daughter cell that resumed growth. Both tolerant and susceptible cells showed an average increase in fluorescence intensity over the course of treatment (see thick blue and orange lines for averages in Fig. 5A). However, we observed that cells with a strong induction pattern (as early as 20 h into the treatment window; Fig. 5B; P < 0.05 by rank sum) are susceptible, whereas cells with a moderate induction were either susceptible or tolerant. We also observed that tolerant cells continue to induce reporter expression well into the recovery period (Fig. 5A). In conclusion, the reporter for ciprofloxacin shows a high induction phenotype during batch culture, as well as during single-cell time-lapse experiments. These single-cell data suggest that drug-tolerant and drug-susceptible cells exhibit distinct induction dynamics.
FIG 5.

Time-lapse microscopy on the CIP-rep strain reveals two different induction phenotypes. A pretreatment phase (16 h) was followed by a treatment phase with 1× the MIC ciprofloxacin (30 h) and subsequent recovery (24 h). (A) Average fluorescence intensities of single cells are plotted. The gray shaded area indicates the treatment phase. A separation between drug-tolerant (blue lines) and drug-susceptible (orange lines) populations was made. A cell was classified as ciprofloxacin tolerant if it either resumed growth during the recovery period or produced at least one daughter cell that resumed growth. The thick blue and orange lines indicate population averages. (B) Violin plots showing the fluorescent fold intensity changes of tolerant cells compared with susceptible cells 20 h into drug treatment. Each dot indicates one cell. The crosses indicate the mean and standard deviation. a.u., arbitrary unit.
CIP-rep is a functional stress reporter in RAW macrophages.
The next step in the characterization of the stress reporters was to monitor induction in vitro in a cell infection assay. For this analysis, RAW macrophages were used to test the most promising reporter strains. From a preliminary infection experiment, we concluded that CIP-rep seemed to be induced in RAW macrophages 2 days postinfection and posttreatment with ciprofloxacin (Fig. S7A). However, both the INH-rep and STR-rep reporters did not show a distinguishable induction in a comparison of treated and untreated samples compared to our iniBAC control (Fig. S7B to D). Therefore, we decided to continue with the CIP-rep strain to quantify the response of the stress marker during cell infection to ciprofloxacin on days 1, 2, and 3 posttreatment. Thus, we infected RAW macrophages with the CIP-rep strain and added 0.5× the MIC and 1× the MIC of ciprofloxacin directly after infection. The iniBAC reporter was taken along as a positive control, and 1× the MIC of EMB was added as an inducing agent (15). After infection, the RAW macrophages were stained with a fluorescent dye that can enter permeabilized cells to distinguish viable and nonviable cells. As a control, we stained uninfected macrophages with the viability marker (Fig. 6A). The gating strategies for RAW cell infection with the CIP-rep strain can be found in Fig. S8A. We quantified the fluorescence induction of the CIP-rep strain during infection by calculating the geometric mean fluorescence intensity (gMFI) of viable mEos-positive RAW cells. These are the cells that fall into the lower-right quadrant (Q3) of our flow cytometry plots. We corrected the gMFI for the fraction of cells that were found in Q3 as a proportion of the whole population, calculated by the MFI of cells in Q3/MFI of total cells. These numbers were calculated for untreated (Fig. 6B) versus ciprofloxacin-treated samples (Fig. 6C). Figure 6C shows that upon ciprofloxacin treatment, the cell population becomes more mEos3.2 positive than the untreated sample. In Fig. 6D, the gMFIs for Q3 are depicted in a graph for a triplicate of samples per time point and condition. There is a clear induction visible starting from day 2 onwards for both 0.5× the MIC (light-gray bar) and 1× the MIC (dark-gray bar) of ciprofloxacin in ciprofloxacin-treated infected RAW macrophages. This induction increased further on day 3. Moreover, our iniBAC reporter also showed a steady increase in fluorescence during RAW macrophage infection after treatment with EMB (Fig. S8B). This is in line with our previously published results for the iniBAC reporter when we performed similar induction studies in THP-1 macrophage and carp leukocyte cell (CLC) infection models (15). In conclusion, our ciprofloxacin reporter shows a clear induction after treatment during cell infection studies.
FIG 6.

CIP-rep is functional in RAW macrophages. Fluorescence intensities of the CIP-rep were analyzed in a RAW macrophage cell infection model over 3 days of infection. All cells were stained with a viability marker (on y axis in a.u.). (A) Uninfected RAW macrophages were used as a control and show no mEos3.2 positivity; only 50 events were found in Q3 (x axis). (B) Untreated RAW cells, 3 days after infection with the CIP-rep strain (Q3, 6,590 events). (C) A clear shift in mEos3.2 positivity can be seen when RAW macrophages are treated with ciprofloxacin, 3 days after infection and treatment (Q3, 10,314 events). (D) Quantification of all days of the RAW cell infection with the CIP-rep strain. Over time, a clear fluorescence induction as a result of ciprofloxacin treatment can be seen. On day 3, both 0.5× the MIC (0.5 μg/ml) and 1× the MIC (1 μg/ml) of ciprofloxacin show a clear mEos 3.2 signal. Error bars represent the standard deviation (SD). Each bar represents three independent samples.
Screening a compound library with 196 antimycobacterial compounds.
To provide proof of concept that the developed stress reporters can be used to accelerate drug discovery by identifying the MoA hit compounds, we tested a library of antimycobacterial compounds against two of our reporter strains. This library was a selection of compounds that showed activity against Mycobacterium bovis BCG and that were identified in two separate high-throughput screens from a library of over 2 million compounds (9, 31). Since the library was only tested against M. bovis BCG, we first tested the 196 compounds against M. marinum at three concentrations, 10 μM, 1 μM, and 0.1 μM. The cells were allowed to grow for 5 days before resazurin reduction was used to assess M. marinum cell viability, measured on day 6. At a concentration of 10 μM, 44% (87/196) of the compounds reached their MIC90 (Supplemental Data Set S2). As a reference, we performed the same experiment with M. tuberculosis H37Rv. We found that 38% (75/196) of the compounds reached the MIC90 after 7 days of incubation in our setup. Although the number of active compounds is significantly lower than that with the original analysis against M. bovis BCG, the results obtained for M. marinum and M. tuberculosis are comparable, again confirming the suitability of M. marinum as a model for M. tuberculosis. Next, we tested the complete set of compounds on our reporter strains, including the compounds that did not show antimicrobial activity at 10 μM in our first assay. In the initial screening, using a fluorescence plate reader, we found one compound that induced CIP-rep and six compounds that induced iniBAC. Upon retesting the compounds that induced the iniBAC reporter, we found the following two reproducible hits: GSK3011724A induced iniBAC at 1 μM and 2 μM, and GW623128X induced iniBAC at 5 μM and 10 μM (Fig. 7A). Interestingly, when we compared stress induction below the MIC, we noticed that compound GW623128X did induce the iniBAC reporter but did not affect the growth of M. marinum at these concentrations. Apparently, this compound is already inducing the iniBAC stress system at levels of compound that are significantly below the MIC value. Compound GSK3011724A behaved more as expected, as it induced the iniBAC reporter at lower concentrations (1.25 and 2.5 μM) and showed growth inhibition at a concentration of 5 μM (Fig. 7B).
FIG 7.
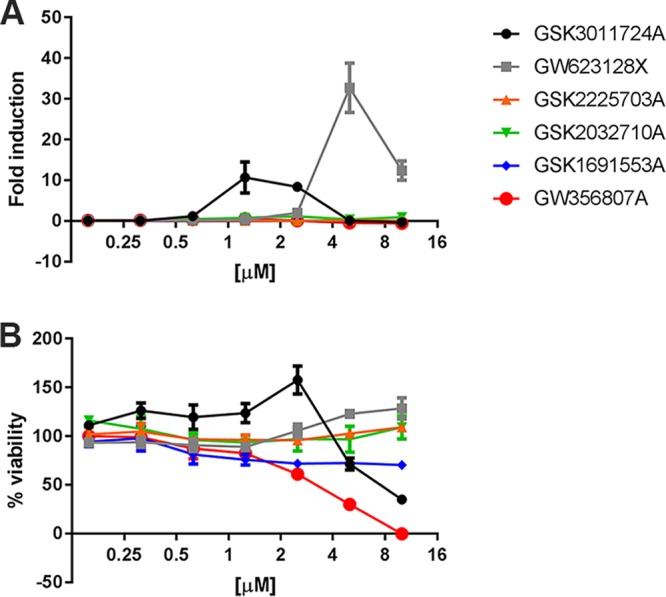
Two compounds show induction of the iniBAC reporter. In total, six compounds were selected for additional induction experiments in a concentration range from 0.1 to 10 μM. The names of the compounds can be found in the key. (A) The fold induction of the iniBAC reporter for the 6 tested compounds. Fold induction was calculated by dividing the mean fluorescence intensity (MFI) of the treated sample by the MFI of untreated controls (B) The bacterial viability for the range of concentrations that were used. The viability was determined by a resazurin viability assay. The percentages indicate the fraction of fluorescence compared to growth controls.
Compound GSK1519001B induced the CIP-rep close the limit of detection of our 96-well reporter assay using a plate reader. Therefore, we decided to retest this compound in a small culture and measure the induction with flow cytometry. We confirmed that the compound induced the stress reporter about 6-fold on day 3 at 10 μM (Fig. 8). We subsequently tested three different concentrations (0.1 μM, 1 μM, and 10 μM) and observed a dose-dependent induction of CIP-rep over time, to a maximum induction of 2-fold at 1 μM and 6-fold at 10 μM. In summary, we found two compounds that induce the iniBAC reporter and might therefore target mycobacterial cell wall, as well as one compound that potentially inhibits mycobacterial growth by targeting DNA replication, similar to ciprofloxacin. We showed that our developed stress reporter assay has the potential to identify antimycobacterial compounds with their corresponding MoA.
FIG 8.
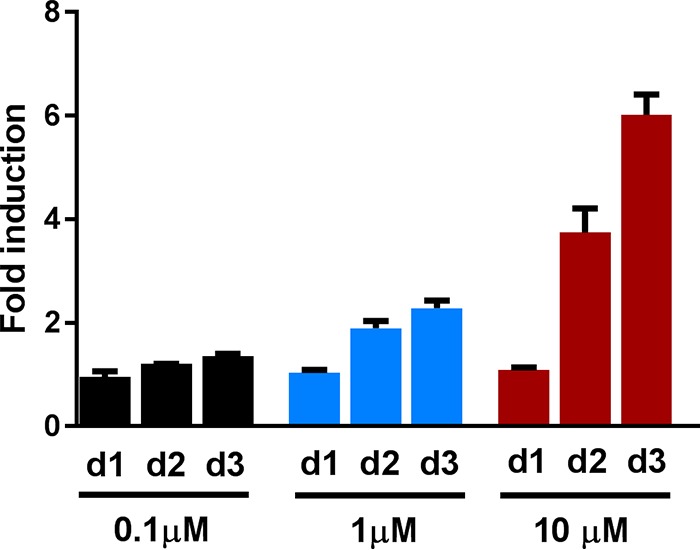
Compound GSK1519001B induces the ciprofloxacin reporter in a dose-dependent manner. Cultures were treated with 0.1 μM, 1 μM, or 10 μM compound GSK1519001B and compared to an untreated culture of the CIP-rep strain to compare fluorescence intensities (fluorescence intensity of mEos3.2). (A) A flow cytometry histogram of 30,000 gated cells per condition comparing untreated (black) to a culture treated with 1 μM or 10 μM compound. There is a concentration-dependent shift of the peak. (B) Fold induction over time of the three different concentrations. Fold induction was calculated by dividing the mean fluorescence intensity (MFI) of the treated sample by the MFI of untreated controls. Error bars indicate standard deviations. The experiments were performed in triplicate. d1, day 1; d2, day 2; d3, day 3.
DISCUSSION
In this study, the first comprehensive transcriptional data set is presented for both M. marinum and M. tuberculosis in response to clinically relevant antibiotics. We found that, in general, M. tuberculosis mounts a less specific stress response than M. marinum. We found that M. marinum displays a clear stress fingerprint in response to treatment, compared to M. tuberculosis. This fingerprint is unique for each type of damage caused by the antibiotic that was used.
In this study, we found a major transcriptional overlap in the responses of M. marinum and M. tuberculosis to ciprofloxacin (Fig. 2), although some genes that were already upregulated at 4 h for M. marinum showed a delayed induction in M. tuberculosis. These temporal differences could be explained by the differences in division times for the two species, i.e., the slow-growing M. marinum has a relatively short generation time of 4 to 6 h, compared to a generation time of approximately 20 to 24 h for M. tuberculosis. This growth difference perhaps also explains the more general stress response that is observed in M. tuberculosis, as opposed to a more specific stress fingerprint in M. marinum.
Remarkably, we do not observe any specific genes to be upregulated for the EMB samples in M. marinum. Only three genes (the iniBAC genes) are significantly upregulated, but these are also found for INH. For M. tuberculosis, we do see differential expression of EMB-specific genes (23 genes upregulated). The orthologous genes (20/23) of these in M. marinum do not show this upregulation. The lack of EMB-induced genes in M. marinum may be explained by the fact that EMB causes an early onset of the bacteriostatic effect that rapidly halts transcription and possibly degrades mRNA pools. However, another explanation might be that the concentration of EMB that we used was too low. As a result, the stress levels might have been insufficient to cause significant transcriptional changes, even though the iniBAC system was induced.
In our study, we describe three newly identified functional stress reporters that respond to DNA damage caused by ciprofloxacin, inhibition of protein translation by streptomycin, and cell wall damage by isoniazid. The promoters are those of genes MMAR_4645, MMAR_2946, and MMAR_1007, respectively. The most promising reporter is CIP-rep, based on the MMAR_4645 promoter. The MMAR_4645 gene is annotated as a conserved cytosolic protein. Its homologue in M. tuberculosis, Rv0887c, is regulated by the gene product of Rv3249c. The gene is not predicted to be regulated by the SOS regulon and seems to be a novel and unidentified player in the stress response to ciprofloxacin. Structural and homology predictions (Phyre 2) show that the gene likely encodes a glyoxalase (32). It would be interesting to see if MMAR_4645 directly responds to DNA damage or to the downstream consequences of ciprofloxacin treatment (e.g., radical formation). The CIP-rep is an excellent tool to study this and also to probe the genetic network revolving around this gene. The H37Rv homologue of MMAR_1007, Rv0678, encodes the transcriptional regulator MmpR5. MmpR5 regulates the efflux complex Mmps5-MmpL5 (33). Mutations in the mmpR5 promoter have been associated with increased clofazimine and bedaquiline resistance in mycobacteria (29, 30, 34). However, a role in isoniazid resistance has not been reported previously. MMAR_2946 encodes a short protein of unknown function that is not conserved in M. tuberculosis but can be found in Mycobacterium kansasii, Mycobacterium abscessus, Nocardia spp., and Streptomyces spp. (NCBI Protein BLAST). Phyre2 predictions do not reveal clear indications as to the function of the MMAR_2946 protein (32). In M. marinum, the MMAR_2946 gene is highly and specifically expressed upon the addition of streptomycin, making it a promising tool to study ribosomal inhibition in M. marinum.
We found that the reporters work well in bacterial culture, but in our microtiter plate assays, only CIP-rep and iniBAC could be used as functional reporters to predict the MoA of new antimycobacterial compounds. Upon screening a small compound anti-TB drug library of 196 compounds, we identified two compound hits with our iniBAC reporter, GSK3011724A and GW623128X. Both compounds have been described previously. GSK3011724A targets KasA, an enzyme required for the synthesis of long-chain fatty acids (35), whereas GW623128X is a compound that was shown to be effective in both cultured M. tuberculosis and in macrophage infection. The GW623128X compound is structurally related to compounds that inhibit MmpL3 (36–38). It would make sense that we find MmpL3 inhibitors with our iniBAC reporter, as it has previously been demonstrated by Degiacomi et al. that a knockdown model of mmpL3 showed increased iniBAC transcripts (39). In addition to these two compounds, upon retesting, we found one alleged compound hit for our CIP-rep strain with flow cytometry. The compound, GSK1519001B, induces the reporter in a dose-dependent manner. Therefore, we predict that this compound will (indirectly) induce DNA damage in mycobacteria.
Only a subset of selected stress reporters was functional (3 out of 10). One explanation for this relatively low success rate is that we did not include both activating and repressing regulatory elements in our cloning strategy. Therefore, it is possible that there is no transcription of the fluorescent reporter due to repression or a lack of transcriptional activation. Finally, we also produced reporters that were designed to respond to rifampin and streptomycin, antibiotics that inhibit transcriptional inhibition and ribosomal inhibition, respectively. Therefore, the production of a stress reporter for these antibiotics is probably highly precarious, as gene transcription and translation are required for reporter synthesis.
In summary, we present a large RNA sequencing data set that includes the responses to sublethal amounts of the currently used anti-TB drugs. With this, we hope to provide the TB community insights into the bacterial stress responses that follow on treatment, as well as tools to aid MoA identification to speed up TB drug discovery.
MATERIALS AND METHODS
Bacterial strains, plasmids, and culturing conditions.
Constructed plasmids were propagated in E. coli HST08 (Clontech). E. coli cultures were inoculated in standard LB and incubated at 37°C with the addition of hygromycin (50 μg/ml). M. marinum wild-type MUSA, as described by Abdallah et al. (40), was used for all the M. marinum experiments and grown at 30°C. M. tuberculosis mc26020 was used for RNA isolation, and this strain was routinely grown at 37°C (41) M. tuberculosis H37Rv was used in the resazurin plate assay. Mycobacterial cultures were grown in Middlebrook 7H9 supplemented with Middlebrook albumin-dextrose-catalase (ADC) and 0.05% Tween 80. Both mycobacterial cultures and plates were grown at 30°C. The MICs used for RNA isolation experiments and flow cytometry experiments were 1 μg/ml for ciprofloxacin, 1 μg/ml for ethambutol, 10 μg/ml for isoniazid, 2 μg/ml for streptomycin, and 1 μg/ml for rifampin for M. marinum (all purchased from Sigma). For M. tuberculosis, these values were 0.5 μg/ml for ciprofloxacin, 1 μg/ml for ethambutol, 0.05 μg/ml for isoniazid, 0.5 μg/ml for streptomycin, 0.25 μg/ml for rifampin, and 50 μg/ml for pyrazinamide. RAW264.7 mouse macrophages were cultured in Dulbecco's modified Eagle's medium (DMEM) with 10% fetal bovine serum (Gibco) and GlutaMAX (Gibco). RAW cells were grown in 37°C with 5% CO2.
RNA preparation for Illumina sequencing.
RNA isolation was performed with a NucleoSpin RNA kit (Macherey-Nagel). In total, 25 optical density (OD) units were spun down and used for isolation per sample. RNA was isolated from a biological triplicate of cultures. There was one deviation to the first step of the protocol with regard to lysis of the mycobacterial cell wall. Cells were disrupted by 0.1-mm zirconium beads in 500 μl buffer RA1 and 5 μl β-mercaptoethanol for 1 min. Subsequent steps were performed according to the protocol provided by the manufacturer. After RNA isolation, RNA concentrations were measured. RNA integrity numbers (RIN) were determined with a Bioanalyzer 2100 Expert machine (Agilent). The RIN value was measured for one sample per triplicate. All RIN values were >9. As rRNA comprises the vast majority of the extracted RNA population, depletion of these molecules through RiboMinus-based rRNA depletion was used in efforts to increase the coverage of mRNA and to reduce rRNA reads. For this mRNA enrichment, the Invitrogen RiboMinus prokaryotic kit was used according to the manufacturer's instructions. Briefly, 2 μg of total RNA samples was hybridized with prokaryotic rRNA sequence-specific 5′-biotin-labeled oligonucleotide probes to selectively deplete large rRNA molecules from the total RNA. Then, these rRNA-hybridized biotinylated probes were removed from the sample with streptavidin-coated magnetic beads. The resulting RNA sample was concentrated using the RiboMinus concentrate module, according to the manufacturer's protocol. The final RiboMinus RNA sample was subjected to thermal mRNA fragmentation using the Elute, Prime, Fragment mix from the Illumina TruSeq RNA sample preparation kit version 2 (low-throughput protocol). The fragmented mRNA samples were subjected to cDNA synthesis using the Illumina TruSeq RNA sample preparation kit (low-throughput protocol), according to the manufacturer's protocol. Briefly, cDNA was synthesized from enriched and fragmented RNA using SuperScript III reverse transcriptase (Invitrogen) and SRA RT primer (Illumina). The cDNA was further converted into double-stranded DNA (dsDNA) using the reagents supplied in the kit, and the resulting dsDNA was used for library preparation. To this end, cDNA fragments were end-repaired and phosphorylated, followed by adenylation of 3′ ends and adapter ligation. Twelve cycles of PCR amplification were then performed, and the library was finally purified with AMPure beads (Beckman Coulter), as per the manufacturer's instructions. A small aliquot (1 μl) was analyzed on the Invitrogen Qubit fluorometer and Agilent Bioanalyzer. The barcoded cDNA libraries were pooled in equal concentrations in one pool before sequencing on the Illumina HiSeq 2000 platform using the TruSeq SR cluster generation kit version 3 and TruSeq SBS kit version 3. Data were processed with the Illumina Pipeline software version 1.82.
Analysis of RNA sequencing data.
Sequencing read quality was assessed using the FastQC tool. Trimming of Illumina adapter sequences and low-quality reads was done using Trimmomatic (version 0.33), and reads were assessed again for quality (42). Quality-trimmed read sequences were mapped to M. tuberculosis H37Rv and M. marinum MUSA reference genomes using BWA (18, 43, 44). Gene expression estimates were made as raw read counts using the Python script ‘HTSeq-count’ (model type –union). Count data were converted to counts per million (cpm), and genes were filtered if they failed to achieve a value of 1 cpm in at least 30% of the libraries per condition. Normalization of raw read counts and differential expression analysis were performed using DeSeq2 (45). Genes with a fold change of ≥2 and false-discovery rate (FDR) of ≤0.05 were considered to be differentially expressed. M. tuberculosis and M. marinum Gene Ontology terms were downloaded from the UniProt Gene Ontology annotation database (https://www.ebi.ac.uk/GOA). Gene Ontology enrichment analysis was performed on differentially expressed genes using the GOstats R package (46). Comparisons of differentially expressed genes under different conditions and visualization were carried out using an online tool (http://bioinformatics.psb.ugent.be/webtools/Venn/).
Construction of reporter plasmids.
The primers that were used to amplify the promoter regions from M. marinum MUSA genomic DNA (gDNA) can be found in Table S1. For all 10 created stress reporters, the promoter region was amplified with primers that contained a 15-bp overlap with the target vector. The iProof 2× master mix (Bio-Rad) was used for PCR. The PCR products were loaded on a gel and purified. The target vector, pSMT3-iniB4-mEos3.2 (15), was digested with XbaI and BamHI, loaded on a gel, excised, and gel purified. The In-Fusion kit (Clontech) was used according to the manufacturer's protocol to ligate the obtained promoter regions into the target vector. Plasmids were transformed by heat shock to E. coli, and plasmids were isolated and digested to control for the correct insert. All obtained stress reporter sequences were confirmed by sequencing of the appropriate region (Macrogen).
Flow cytometry analysis.
Fluorescence induction of the reporter strains in culture was assessed on a BD Accuri C6 flow cytometer from BD Biosciences. For these experiments, the M. marinum reporter strains were grown at 30°C in 7H9 to logarithmic-growth phase and diluted to an OD of 0.2. Antibiotics were added where indicated at 1× the MIC, as previously indicated. At the indicated time intervals or time points, 1 ml of culture was spun down, washed, and resuspended in phosphate-buffered saline (PBS) plus 0.05% Tween 80. Flow cytometry analysis was performed with a 488-nm laser and 530/30-nm filter for mEos3.2. Per sample, 30,000 gated events were analyzed per time point, and data were analyzed and visualized using the BD CFlow software and GraphPad Prism 6. Fold inductions were calculated routinely by dividing the mean fluorescence intensity (MFI) of the treated samples by the MFI of the untreated controls.
Time-lapse microscopy on reporter strains.
The M. marinum stress reporter strains were cultured and loaded into custom microfluidic devices, thus enabling a constant flow of fresh medium and control of antibiotic treatment, as described previously (47–49). Time-lapse images were acquired every 40 min for a duration of 70 h using a widefield DeltaVision PersonalDV system (Applied Precision) with a hardware-based autofocus. During imaging, the cells were grown 16 h in the absence of antibiotics and then treated with antibiotics for 30 h in the presence of 1 μg/ml ciprofloxacin for the CIP-rep or 10 μg/ml isoniazid for iniB reporter strain, respectively. Following treatment, antibiotic-free medium was flowed through the devices for 24 h to allow cells to recover. Images were annotated using FIJI, ObjectJ, and custom MATLAB softwares. Violin plots were produced using the distributionPlot function by Jonas Dorn.
RAW cell infection assay.
For RAW cell infection, 1 × 10⁵ cells per well were seeded in 12-wells (Corning) and grown for 24 h to a confluence of 80% at 37°C. The M. marinum iniBAC and CIP-rep (MMAR_4645) reporter strains were grown at 30°C to an optical density at 600 nm (OD600) of 0.8 to 1 and washed in DMEM plus 10% fetal bovine serum (FBS) prior to infection. Bacterial cells were subsequently added at a multiplicity of infection of 2. RAW cells were incubated at 33°C. After 3 h, extracellular mycobacteria were removed by washing 3 times with PBS. Amikacin (Sigma) was added to a concentration of 200 μg/ml for 3 h to kill any remaining extracellular mycobacterial cells. Cell were then washed thrice with PBS, and the indicated antibiotics were added at their appropriate concentration and incubated at 33°C. This point was considered time point 0 h, and cells were subsequently harvested at 0, 24, 48, and 72 hours postinfection (hpi). Infected RAW cells were harvested by the addition of Accutase (Stemcell Technologies). Cells were then washed with PBS and resuspended in PBS with 0.5% bovine serum albumin. Subsequently, samples were stained with eFluor 780 viability dye (eBioscience) for 30 min on ice. After the staining procedure, cells were washed thrice with PBS and fixated for 24 h with 2% paraformaldehyde (PFA). After 24 h, the PFA was removed, and cells were washed three times with PBS and resuspended in PBS before flow cytometry analysis. A heat-killed RAW cell sample was taken along as a positive control for the viability dye, and uninfected RAW cells were used to gate in RAW cell populations. Samples were acquired on a CyAn advanced digital processing (ADP) flow cytometer (Beckman Coulter) equipped with a 488 nm laser and 530/40 nm, 545 nm data loss prevention (DLP) filter for mEos3.2 detection and a 640 nm laser and 750 nm DLP filter for eFluor 780 nm fixable viability dye detection. To determine the level of fluorescence in response to antibiotic treatment, the mEos3.2 geometric mean fluorescence intensity (gMFI) of live mEos-positive cells (in quadrant 3 [Q3]) was multiplied by the proportion of the Q3 cell population ([cells in Q3]/[total cells]). The infection experiment was performed in triplicate.
Microtiter plate reporter assays and resazurin microtiter plate assay.
The reporter strains of M. marinum (Table S2) and WT M. tuberculosis H37Rv were grown in Middlebrook 7H9 medium (Difco) supplemented with 10% ADS (0.5% albumin, 0.2% glucose, 0.085% NaCl), 0.2% glycerol, and 0.05% Tween 80 to mid-logarithmic phase and harvested by centrifugation. The cells were washed with 120 mM NaCl and 0.02% tyloxapol and filtered (pore size, 5 μm) to remove cell aggregates. The OD600 was adjusted to 0.002, and 100 μl of the cell suspension was added to wells of a 96-well plate containing 100 μl of medium with screening compound at 2-fold the final screening concentration. The lids of the plates were sealed with tape, and the plates were incubated under static conditions for 5 days at 30°C for M. marinum and 7 days at 37°C for M. tuberculosis. The fluorescence of the stress reporters was determined using a plate reader (BioTek; 485 nm excitation, 528 nm emission, bottom-reading mode). Control wells contained cells and dimethyl sulfoxide (DMSO) as a negative control or EMB and INH at 1× the MIC as a positive control. The positive controls consistently showed a >2-fold increased fluorescence compared to wells containing only DMSO. A tested compound was characterized as a hit when the fluorescence at the tested concentration was higher than the average fluorescence of all test wells by 3-fold the standard deviation of the positive-control wells. Afterward, the bacterial viability was determined using the resazurin microtiter assay (REMA). To each well, 25 μl of development solution (200 μM resazurin, 10% Tween 80) was added, and the plates were incubated overnight at 30°C for M. marinum or 37°C for M. tuberculosis. The fluorescence was determined using a plate reader (BioTek; 560 nm excitation, 590 nm emission, bottom-reading mode). Percent viability was defined as (test well fluorescence units [FU]/mean FU of triplicate drug-free wells) × 100. The lowest drug concentration inhibiting viability by ≥90% was considered the MIC.
Accession number(s).
The RNA sequencing data can be found under the GEO accession number GSE107884.
Supplementary Material
ACKNOWLEDGMENTS
We express our gratitude to Christina M. J. E. Vandenbroucke-Grauls for helpful discussions. We thank Francois Rustenburg and Coen Kuijl for technical assistance.
The research leading to these results has received funding from the Innovative Medicines Initiative Joint Undertaking under grant agreement 115337, the resources of which are composed of financial contribution from the European Union's Seventh Framework Programme (FP7/2007-2013) and EFPIA companies' in-kind contribution. The grant was awarded to W. Bitter. This work was additionally supported by NIH grants (grant 1DP2LM011952 to B. B. Aldridge and grant T32 AI 7329-23). This work was supported by the Netherlands Organization for Scientific Research (NWO) through a VENI grant (016.Veni.171.090) awarded to A. Speer.
The funders had no role in the study design, data collection and analysis, decision to publish, or preparation of the manuscript.
We declare no conflicts of interest with the contents of this article.
M. Boot, T. C. Smith II, B. B. Aldridge, A. Pain, A. Speer, and W. Bitter conceived and designed the experiments. M. Boot, S. Commandeur, A. K. Subudhi, M. Bahira, A. M. Abdallah, M. van Gemert, and A. Speer performed the experiments. M. Boot, S. Commandeur, A. K. Subudhi, M. Bahira, T. C. Smith II, J. Lelièvre, L. Ballell, B. B. Aldridge, A. Pain, A. Speer, and W. Bitter analyzed the data. M. Boot and W. Bitter wrote the paper with input from coauthors.
Footnotes
Supplemental material for this article may be found at https://doi.org/10.1128/AAC.00083-18.
REFERENCES
- 1.World Health Organization. 2017. Global tuberculosis report 2017. World Health Organization, Geneva, Switzerland: http://apps.who.int/iris/bitstream/handle/10665/259366/9789241565516-eng.pdf?sequence=1. [Google Scholar]
- 2.Coninx R, Mathieu C, Debacker M, Mirzoev F, Ismaelov A, de Haller R, Meddings DR. 1999. First-line tuberculosis therapy and drug-resistant Mycobacterium tuberculosis in prisons. Lancet 353:969–973. doi: 10.1016/S0140-6736(98)08341-X. [DOI] [PubMed] [Google Scholar]
- 3.Mitnick CD, Shin SS, Seung KJ, Rich ML, Atwood SS, Furin JJ, Fitzmaurice GM, Alcantara Viru FA, Appleton SC, Bayona JN, Bonilla CA, Chalco K, Choi S, Franke MF, Fraser HS, Guerra D, Hurtado RM, Jazayeri D, Joseph K, Llaro K, Mestanza L, Mukherjee JS, Muñoz M, Palacios E, Sanchez E, Sloutsky A, Becerra MC. 2008. Comprehensive treatment of extensively drug-resistant tuberculosis. Lancet 359:563–574. doi: 10.1056/NEJMoa0800106. [DOI] [PMC free article] [PubMed] [Google Scholar]
- 4.Saukkonen JJ. 2012. Monitoring for tuberculosis drug hepatotoxicity: moving from opinion to evidence. Am J Respir Crit Care Med 185:598–599. doi: 10.1164/rccm.201112-2174ED. [DOI] [PMC free article] [PubMed] [Google Scholar]
- 5.Sun G, Luo T, Yang C, Dong X, Li J, Zhu Y, Zheng H, Tian W, Wang S, Barry CE III, Mei J, Gao Q. 2012. Dynamic population changes in Mycobacterium tuberculosis during acquisition and fixation of drug resistance in patients. J Infect Dis 206:1724–1733. doi: 10.1093/infdis/jis601. [DOI] [PMC free article] [PubMed] [Google Scholar]
- 6.Liu Q, Via LE, Luo T, Liang L, Liu X, Wu S, Shen Q, Wei W, Ruan X, Yuan X, Zhang G, Barry CE III, Gao Q. 2015. Within patient microevolution of Mycobacterium tuberculosis correlates with heterogeneous responses to treatment. Sci Rep 5:17507. doi: 10.1038/srep17507. [DOI] [PMC free article] [PubMed] [Google Scholar]
- 7.Jankute M, Cox JA, Harrison J, Besra GS. 2015. Assembly of the mycobacterial cell wall. Annu Rev Microbiol 69:405–423. doi: 10.1146/annurev-micro-091014-104121. [DOI] [PubMed] [Google Scholar]
- 8.Balganesh M, Dinesh N, Sharma S, Kuruppath S, Nair AV, Sharma U. 2012. Efflux pumps of Mycobacterium tuberculosis play a significant role in antituberculosis activity of potential drug candidates. Antimicrob Agents Chemother 56:2643–2651. doi: 10.1128/AAC.06003-11. [DOI] [PMC free article] [PubMed] [Google Scholar]
- 9.Ballell L, Bates RH, Young RJ, Alvarez-Gomez D, Alvarez-Ruiz E, Barroso V, Blanco D, Crespo B, Escribano J, González R, Lozano S, Huss S, Santos-Villarejo A, Martín-Plaza JJ, Mendoza A, Rebollo-Lopez MJ, Remuiñan-Blanco M, Lavandera JL, Pérez-Herran E, Gamo-Benito FJ, García-Bustos JF, Barros D, Castro JP, Cammack N. 2013. Fueling open-source drug discovery: 177 small-molecule leads against tuberculosis. ChemMedChem 8:313–321. doi: 10.1002/cmdc.201200428. [DOI] [PMC free article] [PubMed] [Google Scholar]
- 10.Andries K, Verhasselt P, Guillemont J, Göhlmann HW, Neefs JM, Winkler H, Van Gestel J, Timmerman P, Zhu M, Lee E, Williams P, de Chaffoy D, Huitric E, Hoffner S, Cambau E, Truffot-Pernot C, Lounis N, Jarlier V. 2005. A diarylquinoline drug active on the ATP synthase of Mycobacterium tuberculosis. Science 307:223–227. doi: 10.1126/science.1106753. [DOI] [PubMed] [Google Scholar]
- 11.Makarov V, Manina G, Mikusova K, Möllmann U, Ryabova O, Saint-Joanis B, Dhar N, Pasca MR, Buroni S, Lucarelli AP, Milano A, De Rossi E, Belanova M, Bobovska A, Dianiskova P, Kordulakova J, Sala C, Fullam E, Schneider P, McKinney JD, Brodin P, Christophe T, Waddell S, Butcher P, Albrethsen J, Rosenkrands I, Brosch R, Nandi V, Bharath S, Gaonkar S, Shandil RK, Balasubramanian V, Balganesh T, Tyagi S, Grosset J, Riccardi G, Cole ST. 2009. Benzothiazinones kill Mycobacterium tuberculosis by blocking arabinan synthesis. Science 324:801–804. doi: 10.1126/science.1171583. [DOI] [PMC free article] [PubMed] [Google Scholar]
- 12.Blondiaux N, Moune M, Desroses M, Frita R, Flipo M, Mathys V, Soetaert K, Kiass M, Delorme V, Djaout K, Trebosc V, Kemmer C, Wintjens R, Wohlkönig A, Antoine R, Huot L, Hot D, Coscolla M, Feldmann J, Gagneux S, Locht C, Brodin P, Gitzinger M, Déprez B, Willand N, Baulard AR. 2017. Reversion of antibiotic resistance in Mycobacterium tuberculosis by spiroisoxazoline SMARt-420. Science 355:1206–1211. doi: 10.1126/science.aag1006. [DOI] [PubMed] [Google Scholar]
- 13.Rybniker J, Chen JM, Sala C, Hartkoorn RC, Vocat A, Benjak A, Boy-Röttger S, Zhang M, Székely R, Greff Z, Orfi L, Szabadkai I, Pató J, Kéri G, Cole ST. 2014. Anticytolytic screen identifies inhibitors of mycobacterial virulence protein secretion. Cell Host Microbe 16:538–548. doi: 10.1016/j.chom.2014.09.008. [DOI] [PubMed] [Google Scholar]
- 14.Alland D, Steyn AJ, Weisbrod T, Aldrich K, Jacobs WR Jr. 2000. Characterization of the Mycobacterium tuberculosis iniBAC promoter, a promoter that responds to cell wall biosynthesis inhibition. J Bacteriol 182:1802–1811. doi: 10.1128/JB.182.7.1802-1811.2000. [DOI] [PMC free article] [PubMed] [Google Scholar]
- 15.Boot M, Sparrius M, Jim KK, Commandeur S, Speer A, van de Weerd R, Bitter W. 2016. iniBAC induction is vitamin B12- and MutAB-dependent in Mycobacterium marinum. J Biol Chem 291:19800–19812. doi: 10.1074/jbc.M116.724088. [DOI] [PMC free article] [PubMed] [Google Scholar]
- 16.Naran K, Moosa A, Barry CE III, Boshoff HI, Mizrahi V, Warner DF. 2016. Bioluminescent reporters for rapid mechanism of action assessment in tuberculosis drug discovery. Antimicrob Agents Chemother 60:6748–6757. doi: 10.1128/AAC.01178-16. [DOI] [PMC free article] [PubMed] [Google Scholar]
- 17.Boshoff HI, Myers TG, Copp BR, McNeil MR, Wilson MA, Barry CE III. 2004. The transcriptional responses of Mycobacterium tuberculosis to inhibitors of metabolism: novel insights into drug mechanisms of action. J Biol Chem 279:40174–40184. doi: 10.1074/jbc.M406796200. [DOI] [PubMed] [Google Scholar]
- 18.Stinear TP, Seemann T, Harrison PF, Jenkin GA, Davies JK, Johnson PD, Abdellah Z, Arrowsmith C, Chillingworth T, Churcher C, Clarke K, Cronin A, Davis P, Goodhead I, Holroyd N, Jagels K, Lord A, Moule S, Mungall K, Norbertczak H, Quail MA, Rabbinowitsch E, Walker D, White B, Whitehead S, Small PL, Brosch R, Ramakrishnan L, Fischbach MA, Parkhill J, Cole ST. 2008. Insights from the complete genome sequence of Mycobacterium marinum on the evolution of Mycobacterium tuberculosis. Genome Res 18:729–741. doi: 10.1101/gr.075069.107. [DOI] [PMC free article] [PubMed] [Google Scholar]
- 19.O'Sullivan DM, Hinds J, Butcher PD, Gillespie SH, McHugh TD. 2008. Mycobacterium tuberculosis DNA repair in response to subinhibitory concentrations of ciprofloxacin. J Antimicrob Chemother 62:1199–1202. doi: 10.1093/jac/dkn387. [DOI] [PMC free article] [PubMed] [Google Scholar]
- 20.Smollett KL, Smith KM, Kahramanoglou C, Arnvig KB, Buxton RS, Davis EO. 2012. Global analysis of the regulon of the transcriptional repressor LexA, a key component of SOS response in Mycobacterium tuberculosis. J Biol Chem 287:22004–22014. doi: 10.1074/jbc.M112.357715. [DOI] [PMC free article] [PubMed] [Google Scholar]
- 21.Karakousis PC, Yoshimatsu T, Lamichhane G, Woolwine SC, Nuermberger EL, Grosset J, Bishai WR. 2004. Dormancy phenotype displayed by extracellular Mycobacterium tuberculosis within artificial granulomas in mice. J Exp Med 200:647–657. doi: 10.1084/jem.20040646. [DOI] [PMC free article] [PubMed] [Google Scholar]
- 22.Bacon J, James BW, Wernisch L, Williams A, Morley KA, Hatch GJ, Mangan JA, Hinds J, Stoker NG, Butcher PD, Marsh PD. 2004. The influence of reduced oxygen availability on pathogenicity and gene expression in Mycobacterium tuberculosis. Tuberculosis 84:205–217. doi: 10.1016/j.tube.2003.12.011. [DOI] [PubMed] [Google Scholar]
- 23.Voskuil MI, Visconti KC, Schoolnik GK. 2004. Mycobacterium tuberculosis gene expression during adaptation to stationary phase and low-oxygen dormancy. Tuberculosis (Edinb) 84:218–227. doi: 10.1016/j.tube.2004.02.003. [DOI] [PubMed] [Google Scholar]
- 24.Betts JC, Lukey PT, Robb LC, McAdam RA, Duncan K. 2002. Evaluation of a nutrient starvation model of Mycobacterium tuberculosis persistence by gene and protein expression profiling. Mol Microbiol 431:717–731. doi: 10.1046/j.1365-2958.2002.02779.x. [DOI] [PubMed] [Google Scholar]
- 25.Schnappinger D, Ehrt S, Voskuil MI, Liu Y, Mangan JA, Monahan IM, Dolganov G, Efron B, Butcher PD, Nathan C, Schoolnik GK. 2003. Transcriptional adaptation of Mycobacterium tuberculosis within macrophages: insights into the phagosomal environment. J Exp Med 198:693–704. doi: 10.1084/jem.20030846. [DOI] [PMC free article] [PubMed] [Google Scholar]
- 26.Zhang M, Chang H, Zhang Y, Yu J, Wu L, Ji W, Chen J, Liu B, Lu J, Liu Y, Zhang J, Xu P, Xu T. 2012. Rational design of true monomeric and bright photoactivatable fluorescent proteins. Nat Methods 9:727–729. doi: 10.1038/nmeth.2021. [DOI] [PubMed] [Google Scholar]
- 27.Ghosh A, Dutta D, Bandyopadhyay K, Parrack P. 2016. Characterization of the autophosphorylation property of HflX, a ribosome-binding GTPase from Escherichia coli. FEBS Open Bio 6:651–659. doi: 10.1002/2211-5463.12065. [DOI] [PMC free article] [PubMed] [Google Scholar]
- 28.Shin DM, Jeon BY, Lee HM, Jin HS, Yuk JM, Song CH, Lee SH, Lee ZW, Cho SN, Kim JM, Friedman RL, Jo EK. 2010. Mycobacterium tuberculosis Eis regulates autophagy, inflammation, and cell death through redox-dependent signaling. PLoS Pathog 6:e1001230. doi: 10.1371/journal.ppat.1001230. [DOI] [PMC free article] [PubMed] [Google Scholar]
- 29.Hartkoorn RC, Uplekar S, Cole ST. 2014. Cross-resistance between clofazimine and bedaquiline through upregulation of mmpl5 in Mycobacterium tuberculosis. Antimicrob Agents Chemother 58:2979–2981. doi: 10.1128/AAC.00037-14. [DOI] [PMC free article] [PubMed] [Google Scholar]
- 30.Milano A, Pasca MR, Provvedi R, Lucarelli AP, Manina G, Ribeiro AL, Manganelli R, Riccardi G. 2009. Azole resistance in Mycobacterium tuberculosis is mediated by the MmpS5-MmpL5 efflux system. Tuberculosis (Edinb) 89:84–90. doi: 10.1016/j.tube.2008.08.003. [DOI] [PubMed] [Google Scholar]
- 31.Rebollo-Lopez MJ, Lelièvre J, Alvarez-Gomez D, Castro-Pichel J, Martínez-Jiménez F, Papadatos G, Kumar V, Colmenarejo G, Mugumbate G, Hurle M, Barroso V, Young RJ, Martinez-Hoyos M, González del Río R, Bates RH, Lopez-Roman EM, Mendoza-Losana A, Brown JR, Alvarez-Ruiz E, Marti-Renom MA, Overington JP, Cammack N, Ballell L, Barros-Aguire D. 2015. Release of 50 new, drug-like compounds and their computational target predictions for open source anti-tubercular drug discovery. PLoS One 10:e0142293. doi: 10.1371/journal.pone.0142293. [DOI] [PMC free article] [PubMed] [Google Scholar]
- 32.Kelley LA, Mezulis S, Yates CM, Wass MN, Sternberg MJ. 2015. The Phyre2 web portal for protein modeling, prediction and analysis. Nat Protoc 10:845–858. doi: 10.1038/nprot.2015.053. [DOI] [PMC free article] [PubMed] [Google Scholar]
- 33.Wells RM, Jones CM, Xi Z, Speer A, Danilchanka O, Doornbos KS, Sun P, Wu F, Tian C, Niederweis M. 2013. Discovery of a siderophore export system essential for virulence of Mycobacterium tuberculosis. PLoS Pathog 9:e1003120. doi: 10.1371/journal.ppat.1003120. [DOI] [PMC free article] [PubMed] [Google Scholar]
- 34.Radhakrishnan A, Kumar N, Wright CC, Chou TH, Tringides ML, Bolla JR, Lei HT, Rajashankar KR, Su CC, Purdy GE, Yu EW. 2014. Crystal structure of the transcriptional regulator Rv0678 of Mycobacterium tuberculosis. J Biol Chem 289:16526–16540. doi: 10.1074/jbc.M113.538959. [DOI] [PMC free article] [PubMed] [Google Scholar]
- 35.Abrahams KA, Chung CW, Ghidelli-Disse S, Rullas J, Rebollo-López MJ, Gurcha SS, Cox JA, Mendoza A, Jiménez-Navarro E, Martínez-Martínez MS, Neu M, Shillings A, Homes P, Argyrou A, Casanueva R, Loman NJ, Moynihan PJ, Lelièvre J, Selenski C, Axtman M, Kremer L, Bantscheff M, Angulo-Barturen I, Izquierdo MC, Cammack NC, Drewes G, Ballell L, Barros D, Besra GS, Bates RH. 2016. Identification of KasA as the cellular target of an anti-tubercular scaffold. Nat Commun 7:12581. doi: 10.1038/ncomms12581. [DOI] [PMC free article] [PubMed] [Google Scholar]
- 36.Sorrentino F, Gonzalez del Rio R, Zheng X, Presa Matilla J, Torres Gomez P, Martinez Hoyos M, Perez Herran ME, Mendoza Losana A, Av-Gay Y. 2015. Development of an intracellular screen for new compounds able to inhibit Mycobacterium tuberculosis growth in human macrophages. Antimicrob Agents Chemother 60:640–645. doi: 10.1128/AAC.01920-15. [DOI] [PMC free article] [PubMed] [Google Scholar]
- 37.Li W, Sanchez-Hidalgo A, Jones V, de Moura VC, North EJ, Jackson M. 2017. Synergistic interactions of MmpL3 inhibitors with antitubercular compounds in vitro. Antimicrob Agents Chemother 61:e02399-16. doi: 10.1128/AAC.02399-16. [DOI] [PMC free article] [PubMed] [Google Scholar]
- 38.Grzegorzewicz AE, Pham H, Gundi VA, Scherman MS, North EJ, Hess T, Jones V, Gruppo V, Born SE, Korduláková J, Chavadi SS, Morisseau C, Lenaerts AJ, Lee RE, McNeil MR, Jackson M. 2012. Inhibition of mycolic acid transport across the Mycobacterium tuberculosis plasma membrane. Nat Chem Biol 8:334–341. doi: 10.1038/nchembio.794. [DOI] [PMC free article] [PubMed] [Google Scholar]
- 39.Degiacomi G, Benjak A, Madacki J, Boldrin F, Provvedi R, Palù G, Kordulakova J, Cole ST, Manganelli R. 2017. Essentiality of mmpL3 and impact of its silencing on Mycobacterium tuberculosis gene expression. Sci Rep 7:43495. doi: 10.1038/srep43495. [DOI] [PMC free article] [PubMed] [Google Scholar]
- 40.Abdallah AM, Verboom T, Hannes F, Safi M, Strong M, Eisenberg D, Musters RJ, Vandenbroucke-Grauls CM, Appelmelk BJ, Luirink J, Bitter W. 2006. A specific secretion system mediates PPE41 transport in pathogenic mycobacteria. Mol Microbiol 62:667–679. doi: 10.1111/j.1365-2958.2006.05409.x. [DOI] [PubMed] [Google Scholar]
- 41.Larsen MH, Biermann K, Chen B, Hsu T, Sambandamurthy VK, Lackner AA, Aye PP, Didier P, Huang D, Shao L, Wei H, Letvin NL, Frothingham R, Haynes BF, Chen ZW, Jacobs WR Jr. 2009. Efficacy and safety of live attenuated persistent and rapidly cleared Mycobacterium tuberculosis vaccine candidates in non-human primates. Vaccine 27:4709–4717. doi: 10.1016/j.vaccine.2009.05.050. [DOI] [PMC free article] [PubMed] [Google Scholar]
- 42.Bolger AM, Lohse M, Usadel B. 2014. Trimmomatic: a flexible trimmer for Illumina sequence data. Bioinformatics 30:2114–2120. doi: 10.1093/bioinformatics/btu170. [DOI] [PMC free article] [PubMed] [Google Scholar]
- 43.Cole ST, Brosch R, Parkhill J, Garnier T, Churcher C, Harris D, Gordon SV, Eiglmeier K, Gas S, Barry CE III, Tekaia F, Badcock K, Basham D, Brown D, Chillingworth T, Connor R, Davies R, Devlin K, Feltwell T, Gentles S, Hamlin N, Holroyd S, Hornsby T, Jagels K, Krogh A, McLean J, Moule S, Murphy L, Oliver K, Osborne J, Quail MA, Rajandream MA, Rogers J, Rutter S, Seeger K, Skelton J, Squares R, Squares S, Sulston JE, Taylor K, Whitehead S, Barrell BG. 1998. Deciphering the biology of Mycobacterium tuberculosis from the complete genome sequence. Nature 393:537–544. doi: 10.1038/31159. [DOI] [PubMed] [Google Scholar]
- 44.Li H, Handsaker B, Wysoker A, Fennell T, Ruan J, Homer N, Marth G, Abecasis G, Durbin R, 1000 Genome Project Data Processing Subgroup . 2009. The Sequence Alignment/Map format and SAMtools. Bioinformatics 25:2078–2079. [DOI] [PMC free article] [PubMed] [Google Scholar]
- 45.Love MI, Huber W, Anders S. 2014. Moderated estimation of fold change and dispersion for RNA-seq data with DESeq2. Genome Biol 15:550. doi: 10.1186/s13059-014-0550-8. [DOI] [PMC free article] [PubMed] [Google Scholar]
- 46.Huber W, Carey VJ, Long L, Falcon S, Gentleman R. 2007. Graphs in molecular biology. BMC Bioinformatics 8(Suppl 6):S8. doi: 10.1186/1471-2105-8-S6-S8. [DOI] [PMC free article] [PubMed] [Google Scholar]
- 47.Aldridge BB, Fernandez-Suarez M, Heller D, Ambravaneswaran V, Irimia D, Toner M, Fortune SM. 2012. Asymmetry and aging of mycobacterial cells lead to variable growth and antibiotic susceptibility. Science 335:100–104. doi: 10.1126/science.1216166. [DOI] [PMC free article] [PubMed] [Google Scholar]
- 48.Richardson K, Bennion OT, Tan S, Hoang AN, Cokol M, Aldridge BB. 2016. Temporal and intrinsic factors of rifampicin tolerance in mycobacteria. Proc Natl Acad Sci U S A 113:8302–8307. doi: 10.1073/pnas.1600372113. [DOI] [PMC free article] [PubMed] [Google Scholar]
- 49.Logsdon MM, Ho PY, Papavinasasundaram K, Richardson K, Cokol M, Sassetti CM, Amir A, Aldridge BB. 2017. A parallel adder coordinates mycobacterial cell-cycle progression and cell-size homeostasis in the context of asymmetric growth and organization. Curr Biol 27:3367–3374. doi: 10.1016/j.cub.2017.09.046. [DOI] [PMC free article] [PubMed] [Google Scholar]
Associated Data
This section collects any data citations, data availability statements, or supplementary materials included in this article.