

Abstract
Motivation
Biological knowledge is widely represented in the form of ontology-based annotations: ontologies describe the phenomena assumed to exist within a domain, and the annotations associate a (kind of) biological entity with a set of phenomena within the domain. The structure and information contained in ontologies and their annotations make them valuable for developing machine learning, data analysis and knowledge extraction algorithms; notably, semantic similarity is widely used to identify relations between biological entities, and ontology-based annotations are frequently used as features in machine learning applications.
Results
We propose the Onto2Vec method, an approach to learn feature vectors for biological entities based on their annotations to biomedical ontologies. Our method can be applied to a wide range of bioinformatics research problems such as similarity-based prediction of interactions between proteins, classification of interaction types using supervised learning, or clustering. To evaluate Onto2Vec, we use the gene ontology (GO) and jointly produce dense vector representations of proteins, the GO classes to which they are annotated, and the axioms in GO that constrain these classes. First, we demonstrate that Onto2Vec-generated feature vectors can significantly improve prediction of protein–protein interactions in human and yeast. We then illustrate how Onto2Vec representations provide the means for constructing data-driven, trainable semantic similarity measures that can be used to identify particular relations between proteins. Finally, we use an unsupervised clustering approach to identify protein families based on their Enzyme Commission numbers. Our results demonstrate that Onto2Vec can generate high quality feature vectors from biological entities and ontologies. Onto2Vec has the potential to significantly outperform the state-of-the-art in several predictive applications in which ontologies are involved.
Availability and implementation
Supplementary information
Supplementary data are available at Bioinformatics online.
1 Introduction
Biological knowledge is available across a large number of resources and in several formats. These resources capture different and often complementary aspects of biological phenomena. Over the years, researchers have been working on representing this knowledge in a more structured and formal way by creating biomedical ontologies (Bodenreider, 2008). Ontologies provide the means to formally structure the classes and relations within a domain and are now employed by a wide range of biological databases, webservices and file formats to provide semantic metadata (Hoehndorf et al., 2015).
Notably, ontologies are used for the annotation of biological entities such as genomic variants, genes and gene products or chemicals, to classify their biological activities and associations (Smith et al., 2007). An annotation is an association of a biological entity (or a class of biological entities) and one or more classes from an ontology, usually together with meta-data about the source and evidence for the association, the author and so on (Hill et al., 2008).
Due to the wide-spread use of ontologies, several methods have been developed to utilize the information in ontologies for data analysis (Hoehndorf et al., 2015). In particular, a wide range of semantic similarity measures has been developed (Pesquita et al., 2009) and applied to the similarity-based analysis of ontologies and entities annotated with them. Semantic similarity is a measure defined over an ontology and can be used to measure the similarity between two or more ontology classes, sets of classes or entities annotated with sets of ontology classes.
Semantic similarity measures can be classified into different types depending on how annotations (or instances) of ontology classes are incorporated or weighted, and the type of information from an ontology that is used to determine the similarity (Harispe et al., 2015; Pesquita et al., 2009). Most similarity measures treat ontologies as graphs in which nodes represent classes and edges an axiom involving the connected classes (Harispe et al., 2015; Pesquita et al., 2009). However, not all the axioms in an ontology can naturally be represented as graphs (Hoehndorf et al., 2010; Rodríguez-García and Hoehndorf, 2018; Smith et al., 2005). A possible alternative may be to consider all axioms in an ontology when computing semantic similarity; the challenge is to determine how each axiom should contribute to determine similarity beyond merely considering their syntactic similarity.
In addition to similarity-based analysis, ontology-based annotations are frequently used in machine learning approaches. Ontology-based annotations can be encoded as binary vectors representing whether or not an entity is associated with a particular class, and the semantic content in ontologies (i.e. the subclass hierarchy) can be used to generate ‘semantically closed’ feature vectors (Sokolov et al., 2013). Alternatively, the output of semantic similarity measures is widely used as features for machine learning applications, for example, in drug repurposing systems (Gottlieb et al., 2011) or identification of causative genomic variants (Boudellioua et al., 2017; Robinson et al., 2014). These approaches have in common that the features generated through them contain no explicit information about the structure of the ontology and therefore of the dependencies between the different features; these dependencies are therefore no longer available as features for a machine learning algorithm. In the case of semantic similarity measures, the information in the ontology is used to define the similarity, but the information used to define the similarity is subsequently reduced to a single point (the similarity value); in the case of binary feature vectors, the ontology structure is used to generate the values of the feature vector but is subsequently no longer present or available to a machine learning algorithm. Feature vectors that explicitly encode for both the ontology structure and an entity’s annotations would contain more information than either information alone and may perform significantly better in machine learning applications than alternative approaches.
Finally, semantic similarity measures are generally hand-crafted, i.e. they are designed by an expert based on a set of assumptions about how an ontology is used and what should constitute a similarity. However, depending on the application of semantic similarity, different features may be more or less relevant to define the notion of similarity. It has previously been observed that different similarity measures perform well on some datasets and tasks and worse on others (Kulmanov and Hoehndorf, 2017; Lord et al., 2003; Pesquita et al., 2008a, 2009), without any measure showing clear superiority across multiple tasks. One possible way to define a common similarity measure that performs equally well on multiple tasks may be to establish a way to train a semantic similarity measure in a data-driven way. While this is not always possible due to the absence of training data, when a set of desired outcomes (i.e. labeled data points) are available, such an approach may result in better and more intuitive similarity measures than hand-crafted ones.
We develop Onto2Vec, a novel method to jointly produce dense vector representations of biological entities, their ontology-based annotations and the ontology structure used for annotations. We apply our method to the gene ontology (GO) (Ashburner et al., 2000) and generate dense vector representations of proteins and their GO annotations. We demonstrate that Onto2Vec generates vectors that can outperform traditional semantic similarity measures in the task of similarity-based prediction of protein–protein interactions; we also show how to use Onto2Vec to train a semantic similarity measure in a data-driven way and use this to predict protein–protein interactions and distinguish between the types of interactions. We further apply Onto2Vec-generated vectors to clustering and show that the generated clusters reproduce Enzyme Commission numbers of proteins. The Onto2Vec method is generic and can be applied to any set of entities and their ontology-based annotations, and we make our implementation freely available at https://github.com/bio-ontology-research-group/onto2vec.
2 Results
2.1 Onto2Vec
We developed Onto2Vec, a method to learn dense, vector-based representations of classes in ontologies, and the biological entities annotated with classes from ontologies. To generate the vector representations, we combined symbolic inference (i.e. automated reasoning) and statistical representation learning. We first generated vector-based representations of the classes in an ontology and then extended our result to generate representations of biological entities annotated with these classes. The vector-based representations generated by Onto2Vec provide the foundation for machine learning and data analytics applications, including semantic similarity applications.
Our main contribution with Onto2Vec is a method to learn a representation of individual classes (and other entities) in an ontology, taking into account all the axioms in an ontology that may contribute to the semantics of a class, either directly or indirectly. Onto2Vec uses an ontology O in the OWL format and applies the HermiT OWL reasoner (Shearer et al., 2008) to infer new logical axioms, i.e. equivalent class axioms, subclass axioms and disjointness axioms (for technical details on automated reasoning, see Section 5.2). As an example, if axiom and axiom both occur in the original set of ontology axioms, the reasoner can infer axiom , which correctly describes the ontology, but does not exist in the initial set of the ontology axioms. We call the union of the set of axioms in O and the set of inferred axioms the deductive closure of O, designated . In contrast to treating ontologies as taxonomies or graph-based structures (Rodríguez-García and Hoehndorf, 2018), we assume that every axiom in O (and consequently in ) constitutes a sentence, and the set of axiom in O (and ) a corpus of sentences. The vocabulary of this corpus consists of the classes and relations that occur in O and the keywords used to formulate the OWL axioms (Grau et al., 2008; W3C OWL Working Group, 2009). Onto2Vec then uses a skip-gram model to learn a representation of each word that occurs in the corpus. The representation of a word in the vocabulary (and therefore of a class or property in O) is a vector that is predictive of words occurring within a context window Mikolov et al. (2013a,b) (see Section 5.3 for details).
Onto2Vec can also be used to learn vector-based representations of biological entities that use ontologies for annotation and combine information about the entities’ annotations and the semantics of the classes used in the annotation in a single representation. Trivially, since Onto2Vec can generate representations of single classes in an ontology, an entity annotated with n classes, , can be represented as a (linear) combination of the vector representations of these classes. For example, if an entity e is annotated with C1 and C2, and and are the representations of C1 and C2 generated through Onto2Vec, we can use as a representation of e. Alternatively, we can use Onto2Vec directly to generate a representation of e by extending the axioms in O with additional axioms that explicitly capture the semantics of the annotation. If is the ontology generated from annotations of e by adding new axioms capturing the semantics of the annotation relation to O, then e is a new class or instance in for which Onto2Vec will generate a representation (since e will become a word in the corpus of axioms generated from ).
As comprehensive use case, we applied our method to the GO and to a joint knowledge base consisting of GO and proteins with manual GO annotations obtained from the UniProt database. To generate the latter knowledge base, we added proteins as new entities and connected them using a has-function relation to their functions. We then applied Onto2Vec to generate vector representations for each class in GO (using a corpus based only on the axioms in GO) and further generate joint representations of proteins and GO classes (using a corpus based on the axioms in GO and proteins and their annotations). We further generated protein representations by combining (i.e. adding) the GO class vectors of the proteins’ GO annotations (i.e. if a protein p is annotated to and are the Onto2Vec-vectors generated for , we define the representation of p as ). In total, we generated 556 388 vectors representing proteins (each protein is represented three times, either as a set of GO class vectors, the sum of GO class vectors or a vector jointly generated from representing has-function relations in our knowledge base), and 43 828 vectors representing GO classes. Figure 1 illustrates the main Onto2Vec workflow to construct ontology-based vector representations of classes and entities. A heatmap illustrating the protein representation vectors generated by Onto2Vec is available in the Supplementary Material.
Fig. 1.

Onto2Vec Workflow. The blue-shaded part illustrates the steps to obtain vector representation for classes from the ontology. The purple-shaded part shows the steps to obtain vector representations of ontology classes and the entities annotated to these classes
2.2 Similarity-based prediction of biological relations
We applied the vectors generated for proteins and GO classes to the prediction of protein-protein interactions (PPIs) by functional, semantic similarity. As a first experiment, we evaluated the accuracy of Onto2Vec in predicting protein–protein interactions. For this purpose, we generated several representations of proteins: first, we used Onto2Vec to learn representations of proteins jointly with representations of GO classes by adding proteins and their annotations to the GO using the has-function relations; second, we represented proteins as the sum of the vectors representing the classes to which they are annotated; and third, we represented proteins as the set of classes to which they are annotated.
We used cosine similarity to determine the similarity between vectors. To compare sets of vectors (representing GO classes) to each other, we used the best match average (BMA) approach (Pesquita et al., 2009), where pairs of vectors are compared using cosine similarity. We term the approach in which we compared vectors generated from adding proteins to our knowledge base Onto2Vec; Onto_AddVec when using cosine similarity between protein vectors generated by adding the vectors of the GO classes to which they annotated; and Onto_BMA when using the BMA approach to compare sets of GO classes. To compare the different approaches for using Onto2Vec to the established baseline methods, we further applied the Resnik’s semantic similarity measure (Resnik et al., 1999) with the BMA approach, and we generated sparse binary vector representations from proteins’ GO annotations (Sokolov et al., 2013) and compared them using cosine similarity (termed Binary_GO). In addition to Resnik, we also compare to three additional semantic similarity measures: Lin’s measure (Lin et al., 1998) and Jiang andConrath’s measure (Jiang and Conrath, 1997) combined with the BMA approach as well as the ’s similarity measure (Pesquita et al., 2008b). Furthermore, to evaluate the contribution of using an automated reasoner to infer axioms, we also included the results of using the Onto2Vec approach without applying a reasoner. The similarity measures we employed are formally described in Section 5.4.
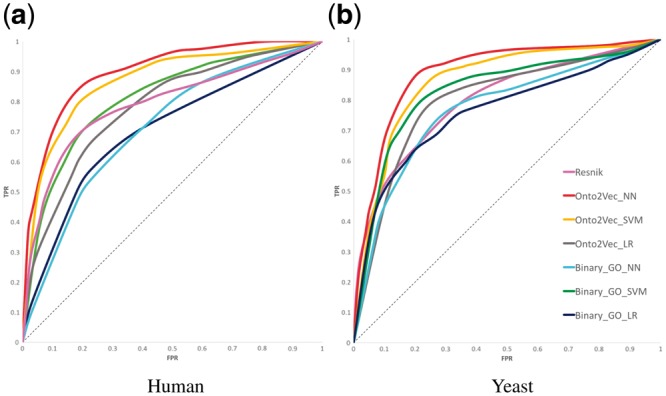
We evaluated the performance of our method using protein–protein interaction datasets in two species, human (Homo sapiens) and baker’s yeast (Saccharomyces cerevisiae). Figure 2 shows the ROC curves obtained for each approach on the human and the yeast datasets; the area under the ROC curve (ROCAUC) values are shown in Table 1 (for details on how the evaluation was performed, see Section 5.6). With the exception of Resnik’s measure, we found that the other semantic similarity measures perform worse than the Onto2Vec model. Therefore, for the sake of conciseness, we do only report the ROC curve of Resnik and not the other three measures. However, the ROCAUC values of all measures are reported in Table 1. We found that Resnik’s semantic similarity measure performs better than all other methods we evaluated, and that the Onto2Vec representation based on generating representations jointly from proteins and GO classes performs second best. These results demonstrate that Resnik’s semantic similarity measure, which determines similarity based on the information content (IC) of ontology classes and the ontology structure, is better suited for this application than our Onto2Vec representations using cosine similarity.
Fig. 2.

ROC curves for PPI prediction for the unsupervised learning methods
Table 1.
AUC values of ROC curves for PPI prediction
| Yeast | Human | |
|---|---|---|
|
0.7942 | 0.7891 |
|
0.7354 | 0.7222 |
| Jiang and Conrath | 0.7108 | 0.7027 |
| 0.7634 | 0.7594 | |
| 0.7701 | 0.7614 | |
| 0.7439 | 0.7385 | |
| 0.6912 | 0.6712 | |
| Onto_BMA | 0.6741 | 0.6470 |
| Onto_AddVec | 0.7139 | 0.7093 |
| 0.7959 | 0.7785 | |
| 0.8586 | 0.8621 | |
| 0.8869 | 0.8931 | |
| 0.7009 | 0.7785 | |
| 0.8253 | 0.8068 | |
| 0.7662 | 0.7064 |
Note: The best AUC value among all methods is shown in bold. Resnik, Lin, Jiang and Conrath and sim_GIC are semantic similarity measures; Onto2Vec is our method in which protein and ontology class representations are learned jointly from a single knowledgebase which is deductively closed; Onto2Vec_NoReasoner is identical to Onto2Vec but does not use the deductive closure of the knowledge base; Binary_GO represents a protein’s GO annotations as a binary vector (closed against the GO structure); Onto_BMA only generates vector representations for GO classes and compares proteins by comparing their GO annotations individually using cosine similarity and averaging individual values using the BMA approach; Onto_AddVec sums GO class vectors to represent a protein. The methods with suffix LR, SVM, and NN use logistic regression, a support vector machine, and an artificial neural network, respectively, either on the Onto2Vec or the Binary_GO protein representations.
However, a key feature of Onto2Vec representations is their ability to encode for annotations and the ontology structure; while cosine similarity (and the derived measures) can determine whether two proteins are similar, certain classes and axioms may contribute more to predicting protein–protein interactions than others. To test whether we can use the information in Onto2Vec representations in such a way, we used supervised machine learning to train a similarity measure that is predictive of protein–protein interactions. To this end, we used three different machine learning methods, logistic regression, support vector machines (SVMs) and neural networks (see Section 5.5 for details). To obtain a baseline comparison, we also trained each model using the Binary_GO protein representations.
Each model uses a pair of protein vectors as inputs and is trained to predict whether the proteins provided as input interact or not. Each supervised model also outputs intermediate confidence values and can therefore be considered to output a form of similarity. The ROC curves of all trained models using the Onto2Vec and binary representations of proteins are shown in Figure 3, and their ROCAUC values are reported in Table 1. We observed that the supervised models (i.e., the “trained” semantic similarity measures) using Onto2Vec protein representations outperform the use of pre-defined similarity measures in all experiments; while logistic regression performs comparable to Resnik semantic similarity, both SVMs and artificial neural networks (ANNs) can learn similarity measures that predict protein–protein interactions significantly better than any pre-defined similarity measure. Onto2Vec representations further outperform the sparse binary representations of protein functions, indicating that the combination of annotations and ontology axioms indeed results in improved predictive performance.
Fig. 3.
ROC curves for PPI prediction for the supervised learning methods, in addition to Resnik’s semantic similarity measure for comparison
We further tested whether the supervised models (i.e. the trained semantic similarity measures) can be used as similarity measures so that higher similarity values represent more confidence in the existence of an interaction. We used the confidence scores associated with protein–protein interactions in the STRING database and determined the correlation between the prediction score of our trained models and the confidence score in STRING. Table 2 summarizes the Spearman correlation coefficients for each of the methods we evaluated. We found that our trained similarity measures correlate more strongly with the confidence measures provided by STRING than other methods, thereby providing further evidence that Onto2Vec representations encode useful information that is predictive of protein–protein interactions.
Table 2.
Spearman correlation coefficients between STRING confidence scores and PPI prediction scores of different prediction methods
| Yeast | Human | |
|---|---|---|
| Resnik | 0.1107 | 0.1151 |
| 0.1067 | 0.1099 | |
| 0.1021 | 0.1031 | |
| 0.1424 | 0.1453 | |
| 0.2245 | 0.2621 | |
| 0.2516 | 0.2951 | |
| 0.1121 | 0.1208 | |
| 0.1363 | 0.1592 | |
| 0.1243 | 0.1616 |
Note: The highest absolute correlation across all methods is highlighted in bold.
Finally, we trained our models to separate protein–protein interactions into different interaction types, as classified by the STRING database: reaction, activation, binding and catalysis. For comparison, we also reported results when using sparse binary representations of proteins in the supervised models, and we reported Resnik semantic similarity and Onto2Vec similarity results (using cosine similarity). Table 3 summarizes the results. While Resnik semantic similarity and Onto2Vec similarity cannot distinguish between different types of interaction, we find that the supervised models, in particular the multiclass SVM and ANN, are capable when using Onto2Vec vector representations to distinguish between different types of interaction. In addition, the Onto2Vec representations perform better than sparse binary vectors, indicating further that encoding parts of the ontology structure can improve predictive performance.
Table 3.
AUC values of the ROC curves for PPI interaction type prediction
| Yeast |
Human |
|||||||
|---|---|---|---|---|---|---|---|---|
| Reaction | Activation | Binding | Catalysis | Reaction | Activation | Binding | Catalysis | |
| Resnik | 0.5811 | 0.6023 | 0.5738 | 0.5792 | 0.5341 | 0.5331 | 0.5233 | 0.5810 |
| 0.5738 | 0.5988 | 0.5611 | 0.5814 | 0.5153 | 0.5104 | 0.5073 | 0.6012 | |
| 0.7103 | 0.7011 | 0.6819 | 0.6912 | 0.7091 | 0.6951 | 0.6722 | 0.6853 | |
| 0.7462 | 0.7746 | 0.7311 | 0.7911 | 0.7351 | 0.7583 | 0.7117 | 0.7724 | |
| 0.7419 | 0.7737 | 0.7423 | 0.7811 | 0.7265 | 0.7568 | 0.7397 | 0.7713 | |
| 0.6874 | 0.6611 | 0.6214 | 0.6433 | 0.6151 | 0.6533 | 0.6018 | 0.6189 | |
| 0.7455 | 0.7346 | 0.7173 | 0.7738 | 0.7246 | 0.7132 | 0.6821 | 0.7422 | |
| 0.7131 | 0.6934 | 0.6741 | 0.6838 | 0.6895 | 0.6803 | 0.6431 | 0.6752 | |
Note: The best AUC value for each action is shown in bold.
2.3 Clustering and visualization
Onto2Vec representations cannot only be used to compute semantic similarity or form part of supervised models but can also provide the foundation for visualization and unsupervised clustering. The ability to identify sets of biological entities that are more similar to each other within a dataset can be used for clustering and identifying groups of related biological entities. We visualized the GO-based vector representations of proteins generated by Onto2Vec. Since the Onto2Vec representations are of a high dimensionality, we applied the t-distributed Stochastic Neighbor Embedding (t-SNE) dimensionality reduction (Maaten and Hinton, 2008) to the vectors and represented 10 000 randomly chosen enzyme proteins in Figure 4 (see Section 5.7 for details).
Fig. 4.

t-SNE visualization of 10, 000 enzyme vectors color-coded by their first level EC category (1, 2, 3, 4, 5 or 6)
The visual representation of the enzymes shows that the proteins are separated and form different functional groups. To explore what kind of information these groups represent, we identified the EC number for each enzyme and colored the enzymes in six different groups depending on their top-level EC category. We found that some of the groups that are visually separable represent mainly enzymes within a single EC top-level category. To quantify whether Onto2Vec similarity is representative of EC categorization, we applied k-means clustering (k = 6) to the protein representations. We evaluated cluster purity with respect to EC top-level classification and found that the purity is 0.42; when grouping enzymes based on their second-level EC classification (k = 62), cluster purity increases to 0.60.
3 Discussion
3.1 Ontologies as graphs and axioms
We have developed Onto2Vec, a novel method for learning feature vectors for entities in ontologies. There have been several recent related efforts that use unsupervised learning to generate dense feature vectors for structured and semantically represented data. Notably, there is a large amount of work on knowledge graph embeddings (Bordes et al., 2013; Nickel et al., 2016a; Perozzi et al., 2014; Ristoski and Paulheim, 2016), i.e. a set of feature learning methods applicable to nodes in heterogeneous graphs, such as those defined by linked data (Bizer et al., 2009). These methods can be applied to predict new relations between entities in a knowledge graph, perform similarity-based predictions, reason by analogy, or in clustering (Nickel et al., 2016b). However, while some parts of ontologies, such as their underlying taxonomy or partonomy, can naturally be expressed as graphs in which edges represent well-defined axiom patterns (Hoehndorf et al., 2010; Smith et al., 2005), it is challenging to represent the full semantic content of ontologies in such a way (Rodríguez-García and Hoehndorf, 2018).
It is possible to materialize the implicit, inferred content of formally represented knowledge bases through automated reasoning, and there is a long history in applying machine learning methods to the deductive closure of a formalized knowledge base Bergadano (1991) and Valiant (1985). Similar approaches have also been applied to knowledge graphs that contain references to classes in ontologies (Alshahrani et al., 2017). However, these approaches are still limited to representing only the axioms that have materialization in a graph-based format. Onto2Vec is, to the best of our knowledge, the first approach that applies feature learning to arbitrary OWL axioms in biomedical ontologies and includes a way to incorporate an ontology’s deductive closure in the feature learning process. While Onto2Vec can be used to learn feature representations from graph-structures (by representing graph edges as axioms or triples), the opposite direction is not true; in particular axioms involving complex class expressions, axioms involving disjointness and axioms involving object property restrictions are naturally included by Onto2Vec while they are mostly ignored in feature learning methods that rely on graphs alone.
3.2 Toward ‘trainable’ semantic similarity measures
Another related area of research is the use of semantic similarity measures in biology. Onto2Vec generates feature representations of ontology classes or entities annotated with several ontology classes, and we demonstrate how to use vector similarity as a measure of semantic similarity. In our experiments, we were able to almost match the performance of an established semantic similarity measure (Resnik et al., 1999) when using cosine similarity to compare proteins. It is traditionally challenging to evaluate semantic similarity measures, and their performances differ between biological problems and datasets (Kulmanov and Hoehndorf, 2017; Lord et al., 2003; Pesquita et al., 2008a; Pesquita et al., 2009). The main advantage of Onto2Vec representations is their ability to be used in trainable similarity measures, i.e. problem- and dataset-specific similarity measures generated in a supervised way from the available data. The training overcomes a key limitation in manually created semantic similarity measures: the inability to judge a priori how each class and relation (i.e. axiom) should contribute to determining similarity. For example, for predicting protein–protein interactions, it should be more relevant that two proteins are active in the same (or neighboring) cellular component than that they both have the ability to regulate other proteins. Trainable similarity measures, such as those based on Onto2Vec, can identify the importance of certain classes (and combinations of classes) with regard to a particular predictive task and therefore improve predictive performance significantly.
Furthermore, Onto2Vec does not only determine how classes, or their combinations, should be weighted in a similarity computation. Semantic similarity measures use an ontology as background knowledge to determine the similarity between two (sets of) classes; how the ontology is used is pre-determined and constitutes the main distinguishing feature among semantic similarity measures (Pesquita et al., 2009). Since Onto2Vec vectors represent both an entity’s annotations and (parts of) the ontology structure, the way in which this structure is used to compute similarity can also be determined in a data-driven way through the use of supervised learning; it may even be different between certain branches of an ontology. We demonstrate that supervised measures outperform binary representations, which shows that combining ontology-based annotations and the ontology structure in a single representation has clear advantages.
4 Conclusions
Onto2Vec is a method that combines neural and symbolic methods in biology and demonstrates significant improvement over state-of-the-art methods. There is now an increasing interest in the integration of neural and symbolic approaches to artificial intelligence (Besold et al., 2017). In biology and biomedicine, where a large amount of symbolic structures (ontologies and knowledge graphs) are in use, there are many potential applications for neural-symbolic systems (Hoehndorf and Queralt-Rosinach, 2017).
The current set of methods for knowledge-driven analysis (i.e. analysis methods that specifically incorporate symbolic structures and their semantics) in biology is limited to ontology enrichment analysis (Subramanian et al., 2005), applications of semantic similarity (Pesquita et al., 2009), and, to a lesser degree, network-based approaches (Dutkowski et al., 2013). With Onto2Vec, we introduce a new method in the semantic analysis toolbox, specifically targeted at computational biology and the analysis of datasets in which ontologies are used for annotation. While we already demonstrate how Onto2Vec representations can be used to improve predictive models for protein–protein interactions, additional experiments with other ontologies will likely identify more areas of applications. We expect that future research on neural-symbolic systems will further extend our results and enable more comprehensive analysis of symbolic representations in biology and biomedicine.
5 Materials and methods
5.1 Dataset
We downloaded the gene ontology (GO) in OWL format from the GO Consortium Website (http://www.geneontology.org/ontology/) on September 13, 2017. We obtained the GO protein annotations from the UniProt-GOA website (http://www.ebi.ac.uk/GOA) on September 26, 2017. We filtered all automatically assigned GO annotations (with evidence code IEA and ND) which results in GO annotations.
We obtained the protein–protein interaction networks for both yeast (S.cerevisiae), and human (H.sapiens) from the STRING database (Szklarczyk et al., 2017) (http://string-db.org/) on September 16, 2017. The human protein dataset contains 19 577 proteins and 11 353 057 interactions while the yeast dataset contains 6392 proteins and 2 007 135 interactions. We extracted Enzyme Commission (EC) number annotations for 10 000 proteins from Expasy (Gasteiger et al., 2003) (ftp://ftp.expasy.org/databases/enzyme/enzyme.dat) on October 4, 2017.
5.2 Automated reasoning
We used the OWL API version 4.2.6 (Horridge et al., 2007) to process the GO in OWL format (Gene Ontology Consortium, 2013). Our version of GO contains 577 454 logical axioms and 43 828 classes. We used the HermiT reasoner (version 1.3.8.413) (Shearer et al., 2008) to infer new logical axioms from the asserted ones. We used HermiT as it supports all OWL 2 DL axioms and has been optimized for large ontologies (Shearer et al., 2008). These optimizations make HermiT relatively fast that is particularly helpful when dealing with ontologies of the size of GO. We infer three types of axioms: subsumption, equivalence and disjointness, resulting in 80 133 new logical axioms that are implied by GO’s axioms and materialized through HermiT.
5.3 Representation learning using Word2Vec
We treated an ontology as a set of axioms, each of which constitutes a sentence. To process the axioms syntactically, we used the Word2Vec (Mikolov et al., 2013a, b) methods. Word2Vec is a set of neural-network based tools that generate vector representations of words from large corpora. The vector representations are obtained in such a way that words with similar contexts tend to be close to each other in the vector space.
Word2Vec can use two distinct models: the continuous bag of word (CBOW), which uses a context to predict a target word, and the skip-gram model that tries to maximize the classification of a word based on another word from the same sentence. The main advantage of the CBOW model is that it smooths over a lot of the distributional information by treating an entire context as one observation, while the skip-gram model treats each context-target as a new observation, which works better for larger datasets. The skip-gram model has the added advantage of producing higher quality representation of rare words in the corpus (Mikolov et al., 2013a,b). Here, we chose the skip-gram architecture since it meets our need to produce high quality representations of all biological entities occurring in our large corpus, including infrequent ones. Formally, given a sequence of training words ω1, ω2,…, ωT, the skip-gram model aims to maximize the following average log likelihood:
| (1) |
where c is the size of the training context, T is the size of the set of the training words and ωi is the i-th training word in the sequence. We identified an optimal set of parameters of the skip-gram model through limited gridsearch on the following parameters: the size of the output vectors on the interval [50–250] using a step size of 50, the number of iterations on the interval [3–5] and negative sampling on the interval [2–5] using a step size of 1. Table 4 shows the parameter values we used for the skip-gram in our work.
Table 4.
Parameter we use for training the Word2Vec model
| Parameter | Definition | Default value |
|---|---|---|
| sg | Choice of training algorithm (sg=1: skip-gram; sg=0: CBOW) | 1 |
| size | Dimension of the obtained vectors | 200 |
| min_count | Words with frequency lower than this value will be ignored | 1 |
| window | Maximum distance between the current and the predicted word | 10 |
| iter | Number of iterations | 5 |
| negative | Whether negative sampling will be used and how many ‘noise words’ would be drawn | 4 |
5.4 Similarity
We used cosine similarity to determine similarity between feature vectors generated by Onto2Vec. The cosine similarity, cossim, between two vectors A and B is calculated as follows:
| (2) |
where is the dot product of A and B.
We used Resnik’s semantic similarity measure (Resnik et al., 1999) as the baseline for comparison. Resnik’s semantic similarity measure is widely used in biology (Pesquita et al., 2009). It is based on the notion of IC that quantifies the specificity of a given class in the ontology. The IC of a class c is defined as the negative log likelihood, , where p(c) is the probability of encountering an instance or annotation of class c. Given this definition of IC, Resnik similarity is formally defined as:
| (3) |
where cMICA is the most informative common ancestor of c1 and c2 in the ontology hierarchy, defined as the common ancestor of c1 and c2 with the highest IC value. In addition to Resnik’s similarity we also compare to three other semantic similarity measures: Lin’s measure (Lin et al., 1998), Jiang and Conrath measure (Jiang and Conrath, 1997) and measure (Pesquita et al., 2008b). Lin’s similarity measure is defined as:
| (4) |
Jiang and Conrath similarity () uses the same components used in Lin’s similarity but with a different formulation:
| (5) |
sim_GIC measure is different than the three previously defined measures in the sense that it calculates the similarity between entities instead of concepts. Given entities e1 and e2, their pairwise similarity according to is the following:
| (6) |
where is the set of ontology concepts that both A and B are annotated with, while is the union of all concepts that A and B are annotated with (not just the shared concepts). Resnik’s, Lin’s and Jiang andConrath similarity measures only measure the similarity between two ontology classes. We applied the BMA method (Azuaje et al., 2005) to compute the similarity between two sets of classes using these measures. For two biological entities e1 and e2, the BMA is defined as:
| (7) |
where S1 is the set of ontology concepts that e1 is annotated with, S2 is the set of concepts that e2 is annotated with, and is the similarity value between concept c1 and concept c2, which could have been calculated using Resnik similarity or any other semantic similarity measure (e.g. cosine similarity).
5.5 Supervised learning
We used supervised learning to train a similarity measure between two entities that is predictive of protein-protein interactions. We applied our method to two datasets, one for protein–protein interactions in yeast and another in human. We filtered the STRING database and kept only proteins with experimental annotations, which is a total of 18 836 proteins in the human dataset and 6390 proteins in the yeast dataset. We randomly split each dataset into 70% and 30% for training and testing, respectively. The positive pairs are all those reported in the STRING database, while the negative pairs are randomly sub-sampled among all the pairs not occurring in STRING, in such a way that the cardinality of the positive set and that of the negative set are equal for both the testing and the training datasets.
We used logistic regression, SVMs and ANNs to train a classifier for protein-protein interactions. We trained each of these methods by providing a pair of proteins (represented through their feature vectors) as input and predicting whether the pair interacts or not. The output of each method varies between 0 and 1, and we used the prediction output as a similarity measure between the two inputs.
Logistic regression does not require any selection of parameters. We used the SVM with a linear kernel and sequential minimal optimization. Our ANN structure is a feed-forward network with four layers: the first layer contains 400 input units; the second and third layers are hidden layers which contain 800 and 200 neurons, respectively; and the fourth layer contains one output neuron. We optimized parameters using a limited manual search based on best practice guidelines (Hunter et al., 2012). We optimized the ANN using binary cross entropy as the loss function.
In addition to binary classification, we also trained multi-class classifiers to predict the type of interaction between two types of proteins. We used a multi-class SVM as well as ANNs; the parameters we used are identical to the binary classification case, except that we used an ANN architecture with more than one output neuron (one for each class). We implemented all supervised learning methods in MATLAB.
5.6 Evaluation
The receiver operating characteristic (ROC) curve is a widely used evaluation method to assess the performance of prediction and classification models. It plots the true-positive rate (TPR or sensitivity) defined as against the false-positive rate (FPR or specificity) defined as , where TP is the number of true positives, FP is the number of false positives and TNis the number of true negatives (Fawcett, 2006). We used ROC curves to evaluate protein–protein interaction prediction of our method and baseline methods, and we reported the area under the ROCAUC as a quantitative measure of classifier performance. In our evaluation, the TP value is the number of protein pairs occurring in STRING regardless of their STRING confidence score and which have been predicted as interacting. The FP value is the number of protein pairs that have been predicted as interacting but do not appear in STRING. And the TN is the number of protein pairs predicted as non-interacting and which do not occur in the STRING database.
5.7 Clustering and visualization
For visualizing the ontology vectors we generated, we used the t-SNE (Maaten and Hinton, 2008) method to reduce the dimensionality of the vectors to two dimensions and plotted the vectors in the 2D space. t-SNE is similar to principal component analysis but uses probability distributions to capture the non-linear structure of the data points, which linear dimensionality reduction methods, such as PCA, cannot achieve (Maaten and Hinton, 2008). We used a perplexity value of 30 when applying t-SNE.
The k-means algorithm is used to cluster the protein vectors, and we quantitatively measured the quality of these clusters with respect to EC families using cluster purity. Cluster purity is defined as:
| (8) |
where N is the total number of data points, is the set of clusters, and is the set of classes which is in this case the set of EC families. Since there are six first-level EC categories, the number of classes in this case is six and the number of clusters used in k-means is also set to six.
Supplementary Material
Acknowledgement
The authors thank Ms. V.K. and Mr. M.K. for helpful discussions.
Funding
The research reported in this publication was supported by the King Abdullah University of Science and Technology (KAUST) Office of Sponsored Research (OSR) under award [no. FCC/1/1976-04, FCC/1/1976-06, URF/1/3450-01 and URF/1/3454-01].
Conflict of Interest: none declared.
References
- Alshahrani M. et al. (2017) Neuro-symbolic representation learning on biological knowledge graphs. Bioinformatics, 33, 2723–2730. [DOI] [PMC free article] [PubMed] [Google Scholar]
- Ashburner M. et al. (2000) Gene ontology: tool for the unification of biology. Nat. Genet., 25, 25–29. [DOI] [PMC free article] [PubMed] [Google Scholar]
- Azuaje F. et al. (2005) Ontology-driven similarity approaches to supporting gene functional assessment. In Proceedings of the ISMB’2005 SIG meeting on Bio-ontologies, pp. 9–10.
- Bergadano F. (1991) The problem of induction and machine learning. In Proceedings of the 12th International Joint Conference on Artificial Intelligence - Volume 2, IJCAI’91, pp. 1073–1078. Morgan Kaufmann Publishers Inc., San Francisco, CA, USA.
- Besold T.R. et al. (2017) Neural-symbolic learning and reasoning: a survey and interpretation. CoRR, abs/1711.03902.
- Bizer C. et al. (2009) Linked data - the story so far. Int. J. Seman. Web Inform. Syst., 5, 1–22. [Google Scholar]
- Bodenreider O. (2008) Biomedical ontologies in action: role in knowledge management, data integration and decision support. Yearbook Med. Informatics, 17, 67.. [PMC free article] [PubMed] [Google Scholar]
- Bordes A. et al. (2013) Translating embeddings for modeling multi-relational data In: Burges C.J.C.et al. (eds.) Advances in Neural Information Processing Systems 26, Curran Associates, Inc, pp. 2787–2795. [Google Scholar]
- Boudellioua I. et al. (2017) Semantic prioritization of novel causative genomic variants. PLOS Comput. Biol., 13, e1005500–e1005521. [DOI] [PMC free article] [PubMed] [Google Scholar]
- Dutkowski J. et al. (2013) A gene ontology inferred from molecular networks. Nature Biotechnology, 31, 38–45. [DOI] [PMC free article] [PubMed] [Google Scholar]
- Fawcett T. (2006) An introduction to ROC analysis. Pattern Recogn. Lett., 27, 861–874. [Google Scholar]
- Gasteiger E. et al. (2003) Expasy: the proteomics server for in-depth protein knowledge and analysis. Nucleic Acids Res., 31, 3784–3788. [DOI] [PMC free article] [PubMed] [Google Scholar]
- Gene Ontology Consortium. (2013) Gene ontology annotations and resources. Nucleic Acids Res., 41, D530–D535. [DOI] [PMC free article] [PubMed] [Google Scholar]
- Gottlieb A. et al. (2011) PREDICT: a method for inferring novel drug indications with application to personalized medicine. Mol. Syst. Biol., 7, 496.. [DOI] [PMC free article] [PubMed] [Google Scholar]
- Grau B. et al. (2008) Owl 2: the next step for owl. Web Seman., 6, 309–322. [Google Scholar]
- Harispe S. et al. (2015) Semantic Similarity from Natural Language and Ontology Analysis. Morgan & Claypool Publishers, San Rafael, USA.
- Hill D.P. et al. (2008) Gene ontology annotations: what they mean and where they come from. BMC Bioinformatics, 9, S2.. [DOI] [PMC free article] [PubMed] [Google Scholar]
- Hoehndorf R. et al. (2010) Relations as patterns: bridging the gap between obo and owl. BMC Bioinformatics, 11, 441.. [DOI] [PMC free article] [PubMed] [Google Scholar]
- Hoehndorf R. et al. (2015) The role of ontologies in biological and biomedical research: a functional perspective. Brief. Bioinformatics, 16, 1069–1080. [DOI] [PMC free article] [PubMed] [Google Scholar]
- Hoehndorf R., Queralt-Rosinach N. (2017) Data science and symbolic ai: synergies, challenges and opportunities. Data Sci., 1, 27–38. [Google Scholar]
- Horridge M. et al. (2007) Igniting the owl 1.1 touch paper: the owl api. In OWLED, Vol. 258, pp. 6–7.
- Hunter D. et al. (2012) Selection of proper neural network sizes and architectures—a comparative study. IEEE Trans. Indus. Informatics, 8, 228–240. [Google Scholar]
- Jiang J.J., Conrath D.W. (1997) Semantic similarity based on corpus statistics and lexical taxonomy. In: Proceeding of the Int'l. Conference on Research in Computational Linguistics, pp. 19–33. The Association for Computational Linguistics and Chinese Language Processing (ACLCLP), Taipei, Taiwan.
- Kulmanov M., Hoehndorf R. (2017) Evaluating the effect of annotation size on measures of semantic similarity. J. Biomed. Sem., 8, 7.. [DOI] [PMC free article] [PubMed] [Google Scholar]
- Lin D. et al. (1998) An information-theoretic definition of similarity. In Icml, Vol. 98, pp. 296–304.
- Lord P.W. et al. (2003) Investigating semantic similarity measures across the gene ontology: the relationship between sequence and annotation. Bioinformatics, 19, 1275–1283. [DOI] [PubMed] [Google Scholar]
- Maaten L. v d., Hinton G. (2008) Visualizing data using t-SNE. J. Mach. Learn. Re., 9, 2579–2605. [Google Scholar]
- Mikolov T. et al. (2013a) Distributed representations of words and phrases and their compositionality. CoRR, abs/1310.4546.
- Mikolov T. et al. (2013b) Efficient estimation of word representations in vector space. CoRR, abs/1301.3781.
- Nickel M. et al. (2016a) Holographic embeddings of knowledge graphs. In Proceedings of the Thirtieth AAAI Conference on Artificial Intelligence, AAAI’16, AAAI Press, pp. 1955–1961.
- Nickel M. et al. (2016b) A review of relational machine learning for knowledge graphs. Proc. IEEE, 104, 11–33. [Google Scholar]
- Perozzi B. et al. (2014) Deepwalk: Online learning of social representations. In Proceedings of the 20th ACM SIGKDD International Conference on Knowledge Discovery and Data Mining, KDD ’14, ACM, New York, NY, USA, pp. 701–710.
- Pesquita C. et al. (2008a) Metrics for GO based protein semantic similarity: a systematic evaluation. BMC Bioinformatics, 9, S4.. [DOI] [PMC free article] [PubMed] [Google Scholar]
- Pesquita C. et al. (2008b) Metrics for go based protein semantic similarity: a systematic evaluation. In BMC bioinformatics, Vol. 9, p. S4. BioMed Central. [DOI] [PMC free article] [PubMed]
- Pesquita C. et al. (2009) Semantic similarity in biomedical ontologies. PLoS Comput. Biol., 5, e1000443.. [DOI] [PMC free article] [PubMed] [Google Scholar]
- Resnik P. et al. (1999) Semantic similarity in a taxonomy: an information-based measure and its application to problems of ambiguity in natural language. J. Artif. Intell. Res.(JAIR), 11, 95–130. [Google Scholar]
- Ristoski P., Paulheim H. (2016) Rdf2vec: Rdf graph embeddings for data mining. In International Semantic Web Conference, Springer, pp. 498–514.
- Robinson P.N. et al. (2014) Improved exome prioritization of disease genes through cross-species phenotype comparison. Genome Res., 24, 340–348. [DOI] [PMC free article] [PubMed] [Google Scholar]
- Rodríguez-García M.Á., Hoehndorf R. (2018) Inferring ontology graph structures using owl reasoning. BMC Bioinformatics, 19, 7.. [DOI] [PMC free article] [PubMed] [Google Scholar]
- Shearer R. et al. (2008) Hermit: a highly-efficient owl reasoner. In OWLED, Vol. 432, pp. 91.
- Smith B. et al. (2005) Relations in biomedical ontologies. Genome Biol., 6, R46.. [DOI] [PMC free article] [PubMed] [Google Scholar]
- Smith B. et al. (2007) The OBO Foundry: coordinated evolution of ontologies to support biomedical data integration. Nat. Biotech., 25, 1251–1255. [DOI] [PMC free article] [PubMed] [Google Scholar]
- Sokolov A. et al. (2013) Combining heterogeneous data sources for accurate functional annotation of proteins. BMC Bioinformatics, 14(Suppl 3), S10.. [DOI] [PMC free article] [PubMed] [Google Scholar]
- Subramanian A. et al. (2005) Gene set enrichment analysis: a knowledge-based approach for interpreting genome-wide expression profiles. Proc. Natl. Acad. Sci. USA, 102, 15545–15550. [DOI] [PMC free article] [PubMed] [Google Scholar]
- Szklarczyk D. et al. (2017) The string database in 2017: quality-controlled protein—protein association networks, made broadly accessible. Nucleic Acids Res., 45, D362–D368. [DOI] [PMC free article] [PubMed] [Google Scholar]
- Valiant L.G. (1985) Deductive learning. In Proceedings of a Discussion Meeting of the Royal Society of London on Mathematical Logic and Programming Languages, Upper Saddle River, NJ, USA, Prentice-Hall, Inc, pp. 107–112.
- W3C OWL Working Group (2009) Owl 2 web ontology language: Document overview. Technical report, W3C http://www.w3.org/TR/owl2-overview/.
Associated Data
This section collects any data citations, data availability statements, or supplementary materials included in this article.