

Abstract
Motivation
Tumor tissue samples often contain an unknown fraction of stromal cells. This problem is widely known as tumor purity heterogeneity (TPH) was recently recognized as a severe issue in omics studies. Specifically, if TPH is ignored when inferring co-expression networks, edges are likely to be estimated among genes with mean shift between non-tumor- and tumor cells rather than among gene pairs interacting with each other in tumor cells. To address this issue, we propose Tumor Specific Net (TSNet), a new method which constructs tumor-cell specific gene/protein co-expression networks based on gene/protein expression profiles of tumor tissues. TSNet treats the observed expression profile as a mixture of expressions from different cell types and explicitly models tumor purity percentage in each tumor sample.
Results
Using extensive synthetic data experiments, we demonstrate that TSNet outperforms a standard graphical model which does not account for TPH. We then apply TSNet to estimate tumor specific gene co-expression networks based on TCGA ovarian cancer RNAseq data. We identify novel co-expression modules and hub structure specific to tumor cells.
Availability and implementation
R codes can be found at https://github.com/petraf01/TSNet.
Supplementary information
Supplementary data are available at Bioinformatics online.
1 Introduction
The tumor microenvironment is composed of cancerous as well as non-cancerous cells such as stromal, immune and other types of tissue cells. As shown by different studies (Aran et al., 2015), the fraction of tumor cells is very heterogeneous across different tumor samples, with the exception of few studies where tumor cells were carefully isolated by laser capture microdissection (LCM) (Emmert-Buck et al., 1996). However, LCM is often not practical for large scale proteogenomic studies, and therefore, tumor purity heterogeneity (TPH) remains a common issue in current omic studies. Given the biological differences across tumor- and non-tumor cells, TPH could have profound impact on omics data analyses. Therefore, tumor sample heterogeneity requires considerable attention for the analysis and result interpretation in omics studies.
Several methods have been proposed to estimate the fraction of tumor cells in clinical tumor samples by using next-generation sequencing data (Gong and Szustakowski, 2013; Larson and Fridley, 2013; Ma and Zhang, 2013; Su et al., 2012), gene expression microarray data (Ahn et al. 2013; Bolen et al. 2011; Erkkilä et al. 2010; Shen-Orr et al., 2010; Shoemaker et al., 2012; Venet et al., 2001; Yoshihara et al., 2013), high-throughput DNA sequencing data (Oesper et al., 2013), DNA copy number array data (Carter et al., 2012; Van Loo et al., 2010) and DNA methylation data (Benelli et al., 2018). Recently, Aran et al. (2015) compared multiple different methods in estimating tumor purity for 21 different cancer types studied by the Cancer Genome Atlas (TCGA) (The Cancer Genome Atlas Network, 2012). These methods include ESTIMATE, an algorithm which derives tumor purity based on microarray data; and ABSOLUTE (Carter et al., 2012), a computational method that infers tumor purity and malignant cell ploidy directly from analysis of somatic DNA copy number alterations (CNAs). As shown, the tumor purity estimates from the CNA and RNA based methods resulted in similar levels of purity for most cancer types.
Network tools have been extensively utilized to identify biological mechanisms underlying different diseases (Friedman et al., 2000, 2008; Hofree et al., 2013; Schäfer and Strimmer, 2005; Wang et al., 2014). Different methods for network inference include Bayesian networks (Friedman et al., 2000) and Gaussian graphical models (GGMs) (Friedman et al., 2008; Schäfer and Strimmer, 2005). Unfortunately, in current approaches for network inference, TPH has not been taken into account. Analysis ignoring large variation of tumor purity might lead to artifacts without meaningful biological interpretation. For instance, connecting edges are likely to be estimated among genes with mean shifts between non-tumor and tumor cells instead of gene pairs regulating each other in tumor cells. In this article, we bridge this gap by developing a new statistical method—Tumor Specific Net (TSNet)—to build tumor-cell specific networks by adequately accounting for TPH in network inference.
TSNet is based on GGMs which have been extensively utilized for network inference in many studies. GGM examines the interaction among random variables through pairwise conditional correlations. Specifically, two variables (nodes) are connected if and only if they are conditionally dependent given the rest of the variables. There are many recent works on applying high-dimensional GGMs under sparsity and/or structural assumptions to infer gene co-expression networks (Friedman et al., 2008; Meinshausen and Bühlmann, 2006; Schäfer and Strimmer, 2005; Yuan and Lin, 2007), including our previous works (Cheng et al., 2014; Danaher et al., 2014; Li et al., 2013; Peng et al., 2010; Wang et al., 2011). However, none of these methods take into consideration TPH in inference.
In this article, we propose TSNet for constructing tumor-cell specific gene co-expression networks based on expression data (of genes or proteins) by modeling the observed expression profile as a mixture of expressions from different cell types and directly incorporating tumor purity percentage. As we demonstrated in our extensive simulation studies, the inferred co-expression networks based on methods ignoring TPH hardly have any overlap with the true network. On the other hand, after properly modeling TPH, our proposed method, TSNet, can reveal significant portion of the true network at reasonable false discovery rate .The rest of the paper is organized as follows: in Section 2, we describe the statistical model of TSNet. In Section 3, we outline an EM algorithm for model fitting. In Section 4, we performed extensive simulation studies to compare the performance of TSNet and the standard graphical lasso which estimates a single network from mixed expression data. In Section 5, we apply TSNet to TCGA ovarian cancer RNA-seq data. TSNet was utilized to estimate tumor purity as well as co-expression networks for cancerous and non-cancerous cells. As shown, TSNet results in tumor purity which correlates to leukocytes signatures (Aran et al., 2015) better than other existing methods. In addition, we show that the cancerous network from TSNet reveals more insights than the one estimated via standard graphical lasso which does not consider TPH.
2 TSNet model
2.1 Model
In this section, we introduce—TSNet—a new method for co-expression network construction which takes into account TPH. Similarly to other models accounting for TPH (Ahn et al., 2013), TSNet models the observed gene-expression as a linear combination of the expression in tumor- and non-tumor cells. Let be the observed expression profiles of N samples and G genes/proteins. For the gth gene, denote its underlying (unobserved) expression levels in the tumor- and non-tumor cells of the nth tumor sample as and , respectively. Let the observed expression level be modeled as a linear combination of expressions in the tumor and non-tumor cells as follows:
| (1) |
with πn being the tumor purity fraction of the nth tumor sample. Besides the estimation of tumor purity percentage, we are interested in characterizing the dependence structure across genes in tumor- and non-tumor components. For this purpose, gene dependence structure for both tumor- and non-tumor cells is modeled via a GGM as follows:
| (2) |
In practice, tumor purity fractions can be estimated using other data types such as DNA copy number profiles of the same set of tumor samples (Carter et al., 2012). However, as shown by Aran et al. (2015), DNA and RNA data results in similar purity levels for several cancer types, and therefore, expression data can be directly utilized to estimate both tumor purity and co-expression networks. Let us assume that a prior estimate of tumor purity is available from other independent sources. Specifically, let us denote the prior estimate of tumor purity for the nth sample as hn and assume that with and for some positive parameter δ. By assumption, hn is an unbiased estimator of the true level of purity πn with and .
2.2 Estimation
Our goal is to infer GGMs for tumor- and non-tumor cells from mixed expression data. Mathematically, this goal can be achieved by learning the inverse of the covariance matrices for tumor- and non-tumor cells, i.e. and , respectively. The high dimensionality of the parameter space requires the adoption of some penalization on the inverse of the covariance matrices. Assuming independence between and , the estimation process is the solution of the following maximization problem:
| (3) |
where is the vector of the parameters of interest; is the vector of gene expression for the nth observed sample; is the penalty function; and are the log likelihood of the observed expression profile and tumor purity percentage estimate, respectively. For penalty function, we adopt the l1 norm which is defined as: with being tuning parameters which control the levels of sparsity of the inferred networks.
3 Expectation-maximization algorithm
If and were observed, maximum likelihood estimates of and could be directly obtained by the graphical lasso algorithm (Friedman et al., 2008). The latent (unobserved) nature of and requires the adoption of the Expectation-Maximization (EM) algorithm. Specifically, the EM algorithm summarizes into the following steps:
- E-Step: Given the current estimates of the model parameters, i.e. , we calculate
- M-step: We find which is the solution to the following
In particular, given is in the form of a penalized Gaussian log-likelihood in , and therefore, its maximization can be solved by the graphical lasso algorithm (Friedman et al., 2008). The conditional densities of and δ are not in closed form, and therefore, their update needs to be done using numerical optimization. In order to save computational time, we adopt a strategy where first an estimate of and δ is derived by only considering the marginal distribution of individual genes. Once that the tumor purity has been derived, we carry out the estimation of .
3.1 Estimate tumor purity
In this section, we show how to obtain stable estimates of and δ by considering the marginal distribution of individual genes, i.e. ignoring the covariance structure. Specifically, let genes be independently distributed as:
with being the G dimensional identity matrix. Given the equation in (1), can be written as and, therefore, the joint log-likelihood becomes a function of latent variables and observed variables . Given this likelihood function, we carry out an EM algorithm to estimate and δ which can be summarized in the following two steps:
E-step: Derive the expectation of the log-likelihood with respect to the latent variable given the observed variable , i.e. .
M-step: Sample each parameter , δ, , σYand σZ conditioning to other parameters via the Expectation Conditional Maximization (ECM) algorithm (Meng and Rubin, 1993).
More details about the ECM algorithm can be found in Supplementary Section S1.
3.2 Estimation of covariance matrices
Treating as fixed and equal to the estimate obtained in Section 3.1, we estimate the parameters in . Again, the estimation of mixture parameter will be carried out via the ECM algorithm.
- E-step: As shown in Supplementary Section S1, this step can be implemented by estimating the conditional expectation of the following quadratic form
with being a positive symmetric matrix. - M-step: In this step we need to maximize the following penalized expected log-likelihood function:
with . As shown in Supplementary Section S1, this step can be summarized as follows:(4) - Compute the maximum likelihood estimate of and .
- Compute the maximum likelihood estimate of and using function glasso available in R Cran (Friedman et al., 2008).
More details about these steps can be found in Supplementary Section S1.
4 Synthetic data analysis
In this section, we compared TSNet and the standard graphical lasso based on several synthetic data examples. Following the strategy illustrated by (Peng et al., 2009), tumor and normal networks were generated. Specifically, each network was obtained as the union of sub-networks involving non-overlapping and equally sized set of genes. Each sub-network contained 250 genes, and was randomly sampled from a given distribution (more details can be found in Supplementary Section S2). Based on the simulated network topology, covariance matrices and were simulated in the same way as (Danaher et al., 2014). Then, latent variables and were drawn from a Gaussian with parameters and , respectively. For the nth sample, purity level πn was sampled from a Beta distribution with mean 0.6 and variance 0.04 to mimic the purity level in 896 TCGA breast cancer samples (Supplementary Fig. S1) which was estimated using ABSOLUTE (Carter et al., 2012). As prior value of tumor purity hn, a noisy version of true purity πn was utilized. In particular, hn was randomly sampled from a Beta distribution with parameters and , with δ being the parameter controlling the variance of the distribution. Finally, observations were obtained using the following identity .
4.1 Tumor purity estimation
In this section, we assess the ability of TSNet in recovering the true value of tumor purity. As mentioned in Section 2, the prior estimate of tumor purity hn is assumed to be a function of the true tumor purity πn, i.e. with δ being the parameter controlling the variance of the distribution. Given a network topology involving 1000 genes, for each value of , 10 independent datasets involving 200 observations each were generated. For each dataset, tumor purity was estimated utilizing the marginal model illustrated in Section 3.1.
Figure 2 shows the correlation between the estimated purity and the corresponding true value for different values of δ. As δ increases, the prior estimate of purity hn becomes more correlated with the true purity πn. However, as shown by Figure 2, the correlation between estimated purity and true purity remains close to one for any value of δ. This result shows the ability of our model to recover the true value of purity even when the prior estimate of purity poorly correlates with the true value. It is important to notice that, for this synthetic data example, the true and estimated model for the prior estimate of tumor purity hn were assumed to be the same. However, Supplementary Figure S2 shows that good estimation performance can be obtained even in the case of model misspecification.
Fig. 2.
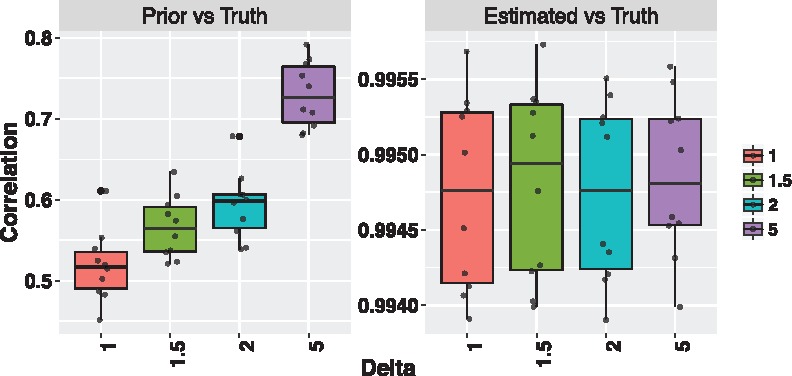
Correlation between prior estimate and true purity (left plot) and correlation between estimated and true purity (right plot) for each value of δ
Fig. 1.
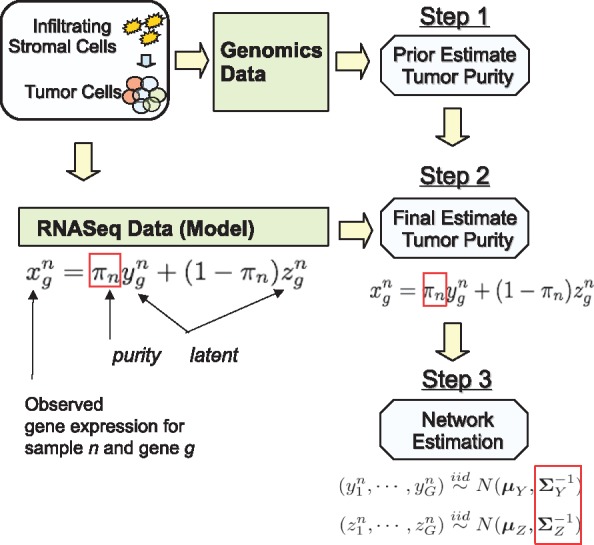
Schematic of TSNet Algorithm. Step 1: Derive a prior estimate of tumor purity from existing RNA and DNA data such as RNAseq data, Methylation Data and CNV Data. Step 2: Derive a final estimate of tumor purity from RNAseq Data using TSNet and considering the tumor purity from Step 1 as prior estimate. Step 3: Given the tumor purity estimate at Step 2, estimate the co-expression networks for the normal and tumor components
4.2 Network estimation
In this section, TSNet was compared to the standard graphical lasso (Friedman et al., 2008) which estimates only one network based on the observed mixture data . We will investigate the performance of the two models in the case of partially overlapping tumor and non-tumor networks as well as independently generated networks. To facilitate the explanation, we will refer to the network from tumor cell as tumor network and the network from non-tumor cell as normal network. In addition, the standard graphical lasso will be referred to as mixNet. mixNet and TSNet were compared by counting the number of false positive and true positive edges in estimating tumor and normal networks. In particular, the standard graphical lasso only results in one estimated network that is then utilized as both tumor and normal networks for evaluation purposes. In order to adequately compare the two methods, for each simulation scenario, 10 independent datasets were generated. For all simulation scenarios, the value of δ was set equal to one.
4.2.1 Partially overlapping normal and tumor networks
In this section, we considered partially overlapping normal and tumor networks. Intuitively, for partially overlapping networks, we would expect the standard graphical lasso to deliver better performance compared to the case of independently generated networks. For the comparison, we consider networks involving 1000 nodes which were obtained as the union of four sub-networks involving disjoint sets of genes. Each sub-network contained 250 genes and was randomly sampled from the power law degree distribution. As shown by Supplementary Figure S3, two of the sub-networks were considered to be the same between the two networks.
Networks were estimated using different penalty parameters for both TSNet and the standard graphical lasso. Let ρy and ρz be the penalty parameters of TSNet for tumor and normal networks, respectively. For each penalty parameters combination , covariance matrices for tumor and normal components were estimated using TSNet. Similarly, the standard graphical lasso was implemented for different values of the penalty parameter. Receiver operating characteristic curves (ROC) curves were generated by varying the value of the penalty parameters of mixNet and TSNet which control the size of the estimated networks (more details about the choice of penalty parameters can be found in Supplementary Section S2). For this comparison, we considered two simulation scenarios involving different number of observations, i.e. N = 200 and N = 400. For each data scenario, mixNet and TSNet were implemented for each of the 10 replicates. Figure 3a shows the average of the ROC curves obtained for the 10 different replicates. As the number of observations increases from N = 200 to N = 400, both models result in more true positive edges. However, TSNet outperforms mixNet in terms of false positive and power (true positive) under both scenarios.
Fig. 3.

Performance of mixNet and TSNet evaluated on synthetic data for partially overlapping tumor and normal networks and independently generated tumor and normal networks. (a, b) Average of ROC curves over 10 different replicates involving 1000 genes for different sample size, i.e. (N = 200, N = 400) resulting from mixNet and TSNet. ROC curves were obtained by varying penalty parameters which control the dimension of the estimated co-expression networks. (c) Boxplot of true-positive rate and false positive rate over 10 replicates for the model minimizing the Bayesian information criteria. Performance of both mixNet and TSNet are evaluated for simulation scenarios involving different number of genes (p = 500, p = 1000) and different number of samples (N = 200, N = 400)
4.2.2 Independently generated tumor-specific and normal-specific networks
Contrary to the previous simulation scenario, in this section, no overlapping structure was forced between the two networks. Specifically, we consider networks involving p nodes which were obtained as the union of four sub-networks involving different set of genes. Specifically, each sub-network was randomly sampled from the power law degree distribution (Supplementary Fig. S3 shows the topology of the networks generated). Figure 3b shows ROC for simulation scenarios involving different number of samples, i.e. (N = 200) and (N = 400). For all simulation scenarios, TSNet resulted in higher true positive edges at the same false positive rates. Again, TSNet delivered better performance as the sample size increased from N = 200 to N = 400 (as shown in Supplementary Fig. S4, similar to performance were obtained using a different network topology).
Figure 3c shows the rate of true positive and false positive for the best model selected via Bayesian information criteria (BIC) (further details can be found in Supplementary Section S2). As shown, TSNet resulted in higher true positive rates and lower false positive rates for all simulation scenarios. For a fixed sample size (N = 200), the two algorithms resulted in higher false positive for smaller network dimension p = 500. Similarly, for a fixed network dimension (p = 1000), both algorithms resulted in higher true positive rates as the sample size increased from N = 200 to N = 400. The computational time of different synthetic data experiments is reported in Supplementary Section S2.
To further assess the advantage of TSNet, in Supplementary Section S2, we compared TSNet with a two-step method in which, the mixed expression matrix is first deconvoluted into tumor and non-tumor components using Demix—a well known deconvolution method (Ahn et al., 2013), and then co-expression networks for tumor and non-tumor components are derived using the standard graphical lasso. As shown, TSNet outperforms this two-step approach even in case of model misspecification.
5 TCGA ovarian cancer data
5.1 Data
We applied TSNet to construct co-expression networks from TCGA RNAseq data of 251 ovarian cancer samples (The Cancer Genome Atlas Network, 2012). The level three RNAseq data was downloaded from firehose (GDAC Broad. Firehose) and was quantile normalized using the R package limma (Smyth, 2004). To better assure the quality of the inferred networks, we reduced the dimension of the gene space by focusing on the 1000 genes with the highest variation across tumor samples and six genes (i.e. TP53, BRCA1, RB1, NF1, GABRA6 and CDK12) which were previously identified as key players in TCGA ovarian studies.
5.2 Tumor purity estimation
In this section, tumor purity percentage estimates from TSNet were compared with those from ESTIMATE (Yoshihara et al., 2013) and ABSOLUTE (Carter et al., 2012), two well known algorithms for tumor purity estimation. To compare different methods, we considered the methylation based tumor purity percentage estimates inferred using the fraction of leukocytes in tumor tissue (Aran et al., 2015) as the golden standard. In addition, when TSNet was applied to infer tumor purity percentages, we considered the same 282 stromal and immune genes which were used by ESTIMATE (Yoshihara et al., 2013). As prior choice for TSNet inference, we utilized the tumor purity percentage inferred via ESTIMATE. As shown by Figure 4, the tumor purity percentage estimates from TSNet correlates slightly better with the methylation based tumor purity than the other two methods, suggesting that TSNet provides robust tumor purity estimates as good as, if not better than, the existing methods. In addition, the result of TSNet on this dataset is not sensitive to the choice of prior inputs (i.e. ). As shown by the Supplementary Figure S5, the output of TSNet is rather consistent, no matter whether we use tumor purity estimates from ESTIMATE, or ABSOLUTE as prior.
Fig. 4.
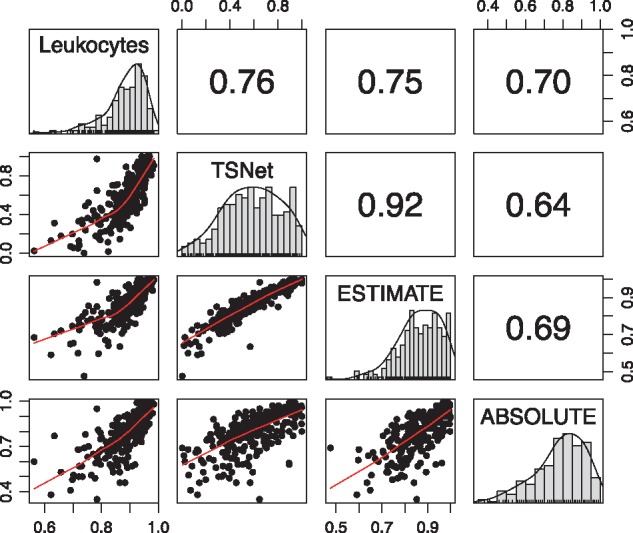
Pearson’s correlation of tumor purity from TSNet, ABSOLUTE (Carter et al., 2012) and ESTIMATE (Yoshihara et al., 2013) with methylation-based estimates of the fraction of leukocytes in tumor tissue
5.3 Co-expression network estimation
In this section, we compare the performance of TSNet and the standard graphical lasso (Friedman et al., 2008) in estimating co-expression networks for TCGA ovarian cancer data. For simplicity, the tumor- and non-tumor networks from TSNet will be referred to as TSNet-tumor and TSNet-normal, while the network from the standard graphical lasso will be referred to as mixNet. For both mixNet and TSNet, co-expression networks were estimated for different values of penalty parameters (further information can be found in Supplementary Section S3). Since applying BIC to TSNet and mixNet on this data resulted in networks with dramatic different sizes (Supplementary Section S3), to facilitate the comparison between these two methods, we adopted a different strategy by deriving a consensus network based on a series of inferred network models of different dimensions (further details can be found in Supplementary Section S3). Following this new strategy, we obtained the final TSNet-tumor, TSNet-normal and mixNet networks which contained 707, 793 and 993 edges, respectively. It is important to notice that mixNet is expected to infer edges between two genes differentially expressed between tumor- and non-tumor cells as well as edges specific to tumor or non-tumor cells. Therefore, it is expected that mixNet would contain more edges compared with TSNet-tumor and TSNet-normal.
Figure 5a illustrates the major network component (with the highest number of nodes) in TSNet-tumor. To facilitate the comparison between TSNet-tumor and mixNet, edges shared between the two networks and those specific to TSNet-tumor were highlighted in different colors. The proportion of edges in TSNet-tumor overlapping with TSNet-normal and mixNet were 18% and 48%, respectively. The small overlap between TSNet-tumor and TSNet-normal is expected, as the biological processes activated in the tumor and non-tumor cells might be dramatically different.
Fig. 5.

(a) Biggest independent component in TSNet-tumor network. The number of edges specific to TSNet-tumor network is 366 (red); while the number of edges shared with mixNet network is 341 (blue). (b) Hub genes (i.e. highly connected node) in TSNet-networks (TSNet-tumor and TSNet-normal) which are poorly connected in mixNet network. For each gene, the red bar shows the number of connecting edges in TSNet-tumor plus the number of connecting edges in TSNet-normal divided by the sum of total number of edges of the two networks; while the blue bar shows the number of connecting edges in mixNet network divided by the total number of edges in the network. (c) Enriched pathways in the second-order neighborhood of tumor repressor HIC1 for TSNet-tumor and TSNet-normal. Enrichment analysis was carried out using the software Enrichr (Chen et al., 2013)
5.3.1 Novel disease genes detected by TSNet but not by mixNet
To assess whether TSNet could help to recover tumor specific biological activities that cannot be detected by mixNet, Figure 5b shows the degree of the top 10 mostly connected genes in TSNet networks which were poorly connected in mixNet. These genes include the tumor suppressor HIC1 (Zheng et al., 2012), the voltage-gated calcium gene CACNA1I (Phan et al., 2017), the lymphocyte-specific member of the tumor necrosis factor TNFRSF13B (Block et al., 2014) and NOS2, a gene involved in antitumoral activities (Burke et al., 2017). All these genes have been demonstrated to play an important role in cancer (Block et al., 2014; Burke et al., 2017; Phan et al., 2017; Zheng et al., 2012). In particular, HIC1 is a tumor suppressor which cooperates with TP53 in the regulation of apoptosis (Markowski et al., 2015) and is often methylated in ovarian tumors (Rathi et al., 2002; Strathdee et al., 2001). It is well known that DNA double-strand breaks activates the tumor-repressor HIC1 to regulate DNA repair (Dehennaut et al., 2013), and the importance of DNA repair has been demonstrated in most human cancers (Khanna and Jackson, 2001). Interestingly, in our analysis, HIC1 is not only a hub-gene in TSNet-tumor but also a hub-gene in TSNet-normal. Further investigation of HIC1 neighbors in TSNet-tumor and TSNet-normal suggests that this gene is actually involved in different biological processes in these two networks. In fact, as shown by Figure 5c, the second-order neighborhood of HIC1 in TSNet-tumor is enriched of pathways such as ‘Reactome p53-Independent DNA Damage Response Homo sapiens’, ‘Reactome Cytokine Signaling in Immune system Homo sapiens’ and ‘Reactome Antigen processing: Ubiquitination & Proteasome degradation’. On the other hand, the second order neighborhood of HIC1 in TSNet-normal resulted in ribosomal related pathways such as ‘Eukaryotic Translation Initiation Homo sapiens’, immune related pathways such as ‘CD22 mediated BCR regulation’ and microenvironment related pathways such as ‘Collagen formation Homo sapiens’. These results suggest that HIC1 is involved in DNA repair pathways as well as show its involvement in the interaction with the tumor microenvironment. Indeed, HIC1 was recently shown to be a novel regulator of intestinal immune homeostasis (Burrows et al., 2017); and it has been demonstrated that the microenvironment also influenced HIC1 expression in tumor cells (Zheng et al., 2012).
5.3.2 Pathway enrichment of highly connected genes
For pathway analysis, we started with two pathways, ‘Stromal genes’ and ‘Kegg ECM Receptor Interaction’, which are expected to be more active in non-tumor tissues than in tumor cells, as a substantial portion of non-tumor tissues are stromal tissues which are primarily made of extracellular matrix (Giussani et al., 2015). Herein, the full list of Stromal genes were obtained from (Yoshihara et al., 2013). To assess the connectivity levels of genes from these two pathways in different networks, Figure 6a shows the normalized number of connecting edges of genes from these two gene sets in different networks. Note, to account for differences in network dimensionality, the number of connecting edges of a gene was normalized according to the total number of edges contained in the network. As shown, genes in ‘Kegg ECM Receptor Interaction’ and ‘Stromal genes’ are much more connected in TSNet-normal than in TSNet-tumor, which nicely matches our expectation that these genes are more active in non-tumor cells than in tumor cells. This result suggests the ability of TSNet to identify tumor- and non-tumor cell specific signals. On the other hand, it is important to notice that many stromal-related genes are highly connected in mixNet. This result is also expected since mixNet tends to connect genes that are differentially expressed between tumoral- and non-tumoral cells.
Fig. 6.

Pathway enrichment of hub-structure. (a) Degree plot for two enriched pathways in mixNet and TSNet-Normal, i.e. ‘Kegg ECM Receptor Interaction’ and stromal genes. The degree of gene gj in a given network is defined as the number of connecting edges of gene gj. To allow comparison across different networks, degrees have been normalized by dividing them for the total number of edges in the network. (b) Number of enriched categories for TSNet-Tumor, TSNet-Normal and mixNet networks. List of pathways enriched in TSNet-tumor but not in mixNet and vice versa
We then screen for pathways enriched with well-connected genes in each network. For this analysis, we considered MSigDB Canonical (Liberzon et al., 2011) and Hallmark (Liberzon et al., 2015) pathways. In particular, we focused on 442 MSigDB pathways containing at least 5 of the 1004 genes utilized in our analysis. For each pathway, we compare the degree distribution of genes in the pathway to that not in the pathway, and we implemented a weighted Kolmogorov–Smirnov (KL) statistics (Subramanian et al., 2005). In order to assess significance and control for multiple comparison, a permutation-based technique was utilized (further information can be found in Supplementary Section S3). Figure 6b shows the number of enriched categories for each network. As shown, TSNet-networks overall result in more enriched categories than mixNet-network. In addition, pathways enriched in TSNet-tumor but not in mixNet includes ‘Kegg ERBB Signaling pathways’, ‘Hallmark DNA Damage’, ‘Biocarta MAPK pathway’ and tumor-related pathways such as ‘Kegg Endometrial Cancer’, ‘Kegg Thyroid Cancer Pathway’ and ‘Kegg Melanoma Pathway’. These results imply the potential advantage of TSNet over mixNet in detecting important tumor related biological activities.
5.3.3 Pathway enrichment of topological structure
In addition, we performed a pathway enrichment analysis based on network topological structures by following the strategy illustrated by Zhu et al. (2008) (further details on the enrichment analysis can be found in Supplementary Section S3). For this analysis, we considered the 442 MSigDB pathways utilized above. Figure 7a shows the number of enriched categories for each network. As shown by the Venn diagram, TSNet-networks result in slightly more enriched pathways than mixNet. This result suggests the ability of TSNet to deliver more biological insights than a network which does not adequately take into account TPH. In addition, Figure 7b and c list some TOP pathways which are enriched in TSNet-tumor but not in mixNet or vice versa. As shown, the TOP enriched pathways in TSNet-tumor include DNA-damage pathways such as ‘Reactome DNA Repair’, ‘Reactome Cell Cycle Checkpoints’ and ‘Nucleotide Excision Repair’; and other important signaling pathways related to cancer, i.e. ‘Kegg MAPK Signaling Pathway’ (Burotto et al., 2014) and ‘Signaling by TGF Beta Receptor Complex’ (Francis-Thickpenny et al., 2001). On the other hand, the TOP enriched pathways in mixNet are extracellular matrix related such as ‘Kegg ECM Receptor Interaction’, ‘Reactome Collagen Formation’ and ‘Pid Integrin1 Pathway’. This result again suggests a more favorable performance of TSNet when compared to the standard graphical lasso in detecting tumor cell related biological process.
Fig. 7.

Pathway enrichment of topological structure. (a) Number of enriched pathways at 1% false discovery rate cut-off for TSNet-tumor, TSNet-normal and mixNet networks. (b) Top enriched pathways in TSNet-tumor which are not enriched in mixNet. (c) Top enriched pathways in mixNet which are not enriched in TSNet-tumor
6 Discussion
In this article, we introduced TSNet—a new algorithm for the estimation of gene co-expression networks based on high dimensional gene expression profiles. The key novelty of TSNet is that it takes into account TPH, an important issue in bulk sample profiling based genomic studies, to construct both tumor- and normal-specific gene networks. Through extensive synthetic data examples, we demonstrated the superior performance of TSNet compared with the graphical lasso—a standard method which has been extensively utilized for constructing gene co-expression networks. One problem of network inference is the low power caused by the small sample size and high number of parameters in the model.
After applying TSNet to the RNAseq data of 251 TCGA ovarian tumor samples, we constructed two gene co-expression networks for the tumor- and non-tumor tissues, respectively. We found that many genes that were highly connected in TSNet-networks while poorly connected in the network derived using the standard graphical lasso were known cancer related genes. In particular, the leading gene of this type, HIC1, had a high number of edges in both the TSNet-tumor and TSNet-normal networks. Further investigation of HIC1 neighbors in TSNet-tumor and TSNet-normal revealed that this gene was involved in different biological processes in the tumor- and non-tumor components. In fact, the neighborhood of HIC1 in TSNet-tumor was enriched of DNA damage pathways such as ‘Reactome p53 independent DNA damage response’; while the neighborhood in TSNet-normal was enriched of ribosomal and immune system related pathways. These findings were well supported by the recent literatures on HIC1, which serves as a good ‘proof-of-principle’ example on how TSNet based analyses can provide useful biological insights. In addition, we conducted pathway analyses based on network topologies as well as degree distributions of the inferred networks. We observed that highly connected genes and network neighbors in TSNet-tumor were enriched of DNA damage pathways such as ‘Reactome DNA Repair’ and other cancer related signaling pathways such as ‘Kegg MAPK Signaling Pathway’ and ‘Kegg ERBB Signaling Pathway’; while those in TSNet-normal were enriched of stromal genes and extracellular matrix pathways. These results again illustrate the capability of TSNet to accurately characterize biological activities specific to tumor- and non-tumor tissues.
In network analysis, replicating results using independent datasets might be challenging due to two main reasons. The first reason is the lack of power in estimating the true underlying network (covariance structure). In fact, when applying the same algorithm to different datasets, different aspects of the true biological mechanism might be detected. Second, different datasets might be subjected to different experimental noises, which might affect the performance of the algorithm. In order to assess how the performance of TSNet is affected by experimental noises we carried out an experiment where white noises were added to the original gene-expression matrix. As shown in the Supplementary Section S3, although network inference is more affected by experimental noise than tumor purity estimation, TSNet could recover most of the network edges and hub-structure of the original tumor and non-tumor networks when different levels of noises were added.
As future work, we would like to extend TSNet to take into account tumor-cells heterogeneity. It is well known that tumor cells are a mixture of different types of cells whose concentration can vary dramatically across different tumor samples. One issue in handling three or more cell types is the lack of power in estimating multiple co-expression networks. One possibility to address this issue might be borrowing information across different sub-groups when estimating co-expression networks (covariance structure) of different cell types (Danaher et al., 2014).
Funding
This work was supported in part through the computational resources and staff expertise provided by the Department of Scientific Computing at the Icahn School of Medicine at Mount Sinai. The results presented in Section 5 are based upon ovarian cancer data generated by the TCGA Research Network: http://cancergenome.nih.gov/. This work was supported by the National Cancer Institute’s Clinical Proteomic Tumor Analysis Consortium (CPTAC), https://proteomics.cancer.gov/programs/cptac and National Institute of Health [grant U24 CA210993; R01 GM108711, U01 CA214114 and R01 CA189532 to F.P. and P.W.] J.P. was supported by NIH 1R01EB021707, NSF DMS-1148643.
Conflict of Interest: none declared.
Supplementary Material
References
- Ahn J. et al. (2013) Demix: deconvolution for mixed cancer transcriptomes using raw measured data. Bioinformatics, 29, 1865–1871. [DOI] [PMC free article] [PubMed] [Google Scholar]
- Aran D. et al. (2015) Systematic pan-cancer analysis of tumour purity. Nat. Commun., 6, 8971. [DOI] [PMC free article] [PubMed] [Google Scholar]
- Benelli M. et al. (2018) Tumor purity quantification by clonal DNA methylation signatures. Bioinformatics. doi: 10.1093/bioinformatics/bty011. [DOI] [PMC free article] [PubMed] [Google Scholar]
- Block M.S. et al. (2014) Variation in nf-κb signaling pathways and survival in invasive epithelial ovarian cancer. Cancer Epidemiol. Biomarkers Prev., 23, 1421–1427. [DOI] [PMC free article] [PubMed] [Google Scholar]
- Bolen C.R. et al. (2011) Cell subset prediction for blood genomic studies. BMC Bioinformatics, 12, 258.. [DOI] [PMC free article] [PubMed] [Google Scholar]
- Broad Institute TCGA Genome Data Analysis Center. (2016) Firehose stddata__2016_01_28 run. Broad Institute of MIT and Harvard. doi:10.7908/C11G0KM9.
- Burke A.J. et al. (2017) Inflammation and nitrosative stress effects in ovarian and prostate pathology and carcinogenesis. Antioxid. Redox Signal., 26, 1078–1090. [DOI] [PubMed] [Google Scholar]
- Burotto M. et al. (2014) The MAPK pathway across different malignancies: a new perspective. Cancer, 120, 3446–3456. [DOI] [PMC free article] [PubMed] [Google Scholar]
- Burrows K. et al. (2017) The transcriptional repressor HIC1 regulates intestinal immune homeostasis. Mucosal Immunol., 10, 1518. [DOI] [PubMed] [Google Scholar]
- Carter S.L. et al. (2012) Absolute quantification of somatic DNA alterations in human cancer. Nat. Biotechnol., 30, 413–421. [DOI] [PMC free article] [PubMed] [Google Scholar]
- Chen E.Y. et al. (2013) Enrichr: interactive and collaborative HTML5 gene list enrichment analysis tool. BMC Bioinformatics, 14, 128.. [DOI] [PMC free article] [PubMed] [Google Scholar]
- Cheng J. et al. (2014) Sparse ising models with covariates. Biometrics, 70, 943.. [DOI] [PMC free article] [PubMed] [Google Scholar]
- Danaher P. et al. (2014) The joint graphical lasso for inverse covariance estimation across multiple classes. J. R. Stat. Soc. Series B Stat. Methodol., 76, 373–397. [DOI] [PMC free article] [PubMed] [Google Scholar]
- Dehennaut V. et al. (2013) DNA double-strand breaks lead to activation of hypermethylated in cancer 1 (HIC1) by sumoylation to regulate DNA repair. J. Biol. Chem., 288, 10254–10264. [DOI] [PMC free article] [PubMed] [Google Scholar]
- Emmert-Buck M.R. et al. (1996) Laser capture microdissection. Science, 274, 998–1001. [DOI] [PubMed] [Google Scholar]
- Erkkilä T. et al. (2010) Probabilistic analysis of gene expression measurements from heterogeneous tissues. Bioinformatics, 26, 2571–2577. [DOI] [PMC free article] [PubMed] [Google Scholar]
- Francis-Thickpenny K.M. et al. (2001) Analysis of the TGF β functional pathway in epithelial ovarian carcinoma. Br. J. Cancer, 85, 687.. [DOI] [PMC free article] [PubMed] [Google Scholar]
- Friedman J. et al. (2008) Sparse inverse covariance estimation with the graphical lasso. Biostatistics, 9, 432–441. [DOI] [PMC free article] [PubMed] [Google Scholar]
- Friedman N. et al. (2000) Using Bayesian networks to analyze expression data. J. Comput. Biol., 7, 601–620. [DOI] [PubMed] [Google Scholar]
- Giussani M. et al. (2015) Tumor-extracellular matrix interactions: identification of tools associated with breast cancer progression. Semin. Cancer Biol., 35, 3–10. [DOI] [PubMed] [Google Scholar]
- Gong T., Szustakowski J.D. (2013) Deconrnaseq: a statistical framework for deconvolution of heterogeneous tissue samples based on mRNA-seq data. Bioinformatics, 29, 1083–1085. [DOI] [PubMed] [Google Scholar]
- Hofree M. et al. (2013) Network-based stratification of tumor mutations. Nat. Methods, 10, 1108.. [DOI] [PMC free article] [PubMed] [Google Scholar]
- Khanna K.K., Jackson S.P. (2001) DNA double-strand breaks: signaling, repair and the cancer connection. Nat. Genet., 27, 247.. [DOI] [PubMed] [Google Scholar]
- Larson N.B., Fridley B.L. (2013) Purbayes: estimating tumor cellularity and subclonality in next-generation sequencing data. Bioinformatics, 29, 1888–1889. [DOI] [PMC free article] [PubMed] [Google Scholar]
- Li S. et al. (2013) Bootstrap inference for network construction. Ann. Appl. Stat., 7, 391.. [DOI] [PMC free article] [PubMed] [Google Scholar]
- Ma X., Zhang X. (2013) A mixture model for expression deconvolution from RNA-seq in heterogeneous tissues. BMC Bioinformatics, 14, 220.. [DOI] [PMC free article] [PubMed] [Google Scholar]
- Liberzon A. et al. (2011) Molecular signatures database (MSigDB) 3.0. Bioinformatics, 27, 1739–1740. [DOI] [PMC free article] [PubMed] [Google Scholar]
- Liberzon A. et al. (2015) The molecular signatures database hallmark gene set collection. Cell Syst., 1, 417–425. [DOI] [PMC free article] [PubMed] [Google Scholar]
- Markowski J. et al. (2015) Expression of the tumor suppressor gene hypermethylated in cancer 1 in laryngeal carcinoma. Oncol. Lett., 9, 2299–2302. [DOI] [PMC free article] [PubMed] [Google Scholar]
- Meinshausen N., Bühlmann P. (2006) High-dimensional graphs and variable selection with the lasso. Ann. Stat., 34, 1436–1462. [Google Scholar]
- Meng X.-L., Rubin D.B. (1993) Maximum likelihood estimation via the ECM algorithm: a general framework. Biometrika, 80, 267–278. [Google Scholar]
- Oesper L. et al. (2013) Theta: inferring intra-tumor heterogeneity from high-throughput DNA sequencing data. Genome Biol., 14, R80.. [DOI] [PMC free article] [PubMed] [Google Scholar]
- Peng J. et al. (2009) Partial correlation estimation by joint sparse regression models. J. Am. Stat. Assoc., 104, 735–746. [DOI] [PMC free article] [PubMed] [Google Scholar]
- Peng J. et al. (2010) Regularized multivariate regression for identifying master predictors with application to integrative genomics study of breast cancer. Ann. Appl. Stat., 4, 53–77. [DOI] [PMC free article] [PubMed] [Google Scholar]
- Phan N.N. et al. (2017) Voltage-gated calcium channels: novel targets for cancer therapy. Oncol. Lett., 14, 2059–2074. [DOI] [PMC free article] [PubMed] [Google Scholar]
- Rathi A. et al. (2002) Methylation profiles of sporadic ovarian tumors and nonmalignant ovaries from high-risk women. Clin. Cancer Res., 8, 3324–3331. [PubMed] [Google Scholar]
- Schäfer J., Strimmer K. (2005) A shrinkage approach to large-scale covariance matrix estimation and implications for functional genomics. Stat. Appl. Genet. Mol. Biol., 4, [DOI] [PubMed] [Google Scholar]
- Shen-Orr S.S. et al. (2010) Cell type–specific gene expression differences in complex tissues. Nat. Methods, 7, 287–289. [DOI] [PMC free article] [PubMed] [Google Scholar]
- Shoemaker J.E. et al. (2012) CTen: a web-based platform for identifying enriched cell types from heterogeneous microarray data. BMC Genomics, 13, 460.. [DOI] [PMC free article] [PubMed] [Google Scholar]
- Smyth G.K. (2004) Linear models and empirical Bayes methods for assessing differential expression in microarray experiments. Stat. Appl. Genet. Mol. Biol., 3, 1–25. [DOI] [PubMed] [Google Scholar]
- Strathdee G. et al. (2001) Primary ovarian carcinomas display multiple methylator phenotypes involving known tumor suppressor genes. Am. J. Pathol., 158, 1121–1127. [DOI] [PMC free article] [PubMed] [Google Scholar]
- Su X. et al. (2012) Purityest: estimating purity of human tumor samples using next-generation sequencing data. Bioinformatics, 28, 2265–2266. [DOI] [PMC free article] [PubMed] [Google Scholar]
- Subramanian A. et al. (2005) Gene set enrichment analysis: a knowledge-based approach for interpreting genome-wide expression profiles. Proc. Natl. Acad. Sci. USA, 102, 15545–15550. [DOI] [PMC free article] [PubMed] [Google Scholar]
- The Cancer Genome Atlas Network (2012) Comprehensive molecular portraits of human breast tumours. Nature, 490, 61–70. [DOI] [PMC free article] [PubMed] [Google Scholar]
- Van Loo P. et al. (2010) Allele-specific copy number analysis of tumors. Proc. Natl. Acad. Sci. USA, 107, 16910–16915. [DOI] [PMC free article] [PubMed] [Google Scholar]
- Venet D. et al. (2001) Separation of samples into their constituents using gene expression data. Bioinformatics, 17, S279–S287. [DOI] [PubMed] [Google Scholar]
- Wang P. et al. (2011) Learning networks from high dimensional binary data: an application to genomic instability data. Biometrics, 67, 164–173. [DOI] [PMC free article] [PubMed] [Google Scholar]
- Wang B. et al. (2014) Similarity network fusion for aggregating data types on a genomic scale. Nat. Methods, 11, 333.. [DOI] [PubMed] [Google Scholar]
- Yoshihara K. et al. (2013) Inferring tumour purity and stromal and immune cell admixture from expression data. Nat. Commun., 4, 2612. [DOI] [PMC free article] [PubMed] [Google Scholar]
- Yuan M., Lin Y. (2007) Model selection and estimation in the Gaussian graphical model. Biometrika, 94, 19–35. [Google Scholar]
- Zheng J. et al. (2012) Signification of hypermethylated in cancer 1 (HIC1) as tumor suppressor gene in tumor progression. Cancer Microenviron., 5, 285–293. [DOI] [PMC free article] [PubMed] [Google Scholar]
- Zhu J. et al. (2008) Integrating large-scale functional genomic data to dissect the complexity of yeast regulatory networks. Nat. Genet., 40, 854–861. [DOI] [PMC free article] [PubMed] [Google Scholar]
Associated Data
This section collects any data citations, data availability statements, or supplementary materials included in this article.