

Abstract
Key points
We investigated the excitation–contraction coupling mechanisms in small pulmonary veins (SPVs) in rat precision‐cut lung slices.
We found that SPVs contract strongly and reversibly in response to extracellular ATP and other vasoconstrictors, including angiotensin‐II and endothelin‐1.
ATP‐induced vasoconstriction in SPVs was associated with the stimulation of purinergic P2Y2 receptors in vascular smooth muscle cell, activation of phospholipase C‐β and the generation of intracellular Ca2+ oscillations mediated by cyclic Ca2+ release events via the inositol 1,4,5‐trisphosphate receptor.
Active constriction of SPVs may play an important role in the development of pulmonary hypertension and pulmonary oedema.
Abstract
The small pulmonary veins (SPVs) may play a role in the development of pulmonary hypertension and pulmonary oedema via active changes in SPV diameter, mediated by vascular smooth muscle cell (VSMC) contraction. However, the excitation–contraction coupling mechanisms during vasoconstrictor stimulation remain poorly understood in these veins. We used rat precision‐cut lung slices and phase‐contrast and confocal microscopy to investigate dynamic changes in SPV cross‐sectional luminal area and intracellular Ca2+ signalling in their VSMCs. We found that the SPV (∼150 μm in diameter) contract strongly in response to extracellular ATP and other vasoconstrictors, including angiotensin‐II and endothelin‐1. ATP‐induced SPV contraction was fast, concentration‐dependent, completely reversible upon ATP washout, and inhibited by purinergic receptor antagonists suramin and AR‐C118925 but not by MRS2179. Immunofluorescence showed purinergic P2Y2 receptors expressed in SPV VSMCs. ATP‐induced SPV contraction was inhibited by phospholipase Cβ inhibitor U73122 and accompanied by intracellular Ca2+ oscillations in the VSMCs. These Ca2+ oscillations and SPV contraction were inhibited by the inositol 1,4,5‐trisphosphate receptor inhibitor 2‐APB but not by ryanodine. The results of the present study suggest that ATP‐induced vasoconstriction in SPVs is associated with the activation of purinergic P2Y2 receptors in VSMCs and the generation of Ca2+ oscillations.
Keywords: small pulmonary veins, pulmonary circulation, calcium signaling, ATP
Key points
We investigated the excitation–contraction coupling mechanisms in small pulmonary veins (SPVs) in rat precision‐cut lung slices.
We found that SPVs contract strongly and reversibly in response to extracellular ATP and other vasoconstrictors, including angiotensin‐II and endothelin‐1.
ATP‐induced vasoconstriction in SPVs was associated with the stimulation of purinergic P2Y2 receptors in vascular smooth muscle cell, activation of phospholipase C‐β and the generation of intracellular Ca2+ oscillations mediated by cyclic Ca2+ release events via the inositol 1,4,5‐trisphosphate receptor.
Active constriction of SPVs may play an important role in the development of pulmonary hypertension and pulmonary oedema.
Introduction
Small pulmonary veins (SPVs) are being increasingly recognized for their role within the physiology and pathophysiology of the pulmonary circulation. Alterations of vascular tone in pulmonary veins may be of significant importance for the development of cardiovascular diseases, including pulmonary oedema (PE) and pulmonary hypertension (PH). Because constriction of SPVs increases hydrostatic pressure in the adjacent pulmonary capillaries, it is conceivable that vein constriction and the consequent increase in capillary fluid extravasation could result in PE. For example, one study showed that endotoxin increased contraction of intrapulmonary veins and augmented the filtration pressure in the pulmonary capillaries leading to PE in pigs (Persson et al. 2011). On the other hand, although changes in pulmonary artery structure and function during the development of PH have been extensively described, there is an increasing awareness of defective pulmonary venous tone in PH. Particularly, SPVs have been implicated in the pathogenesis of post‐capillary PH during veno‐occlusive disease, capillary haemangiomatosis, left heart dysfunction and extrinsic main pulmonary vein obstruction (Tuder et al. 2007; Gopalan et al. 2012). However, the functional alterations of each cell type within the vein associated with lung disease involving SPVs, in particular those in the vascular smooth muscle cells (VSMCs), are unknown.
The pulmonary veins respond strongly to local vasoconstrictors and vasodilators. An early study (Brody & Stemmler, 1968) characterized the differential changes in vascular resistance of pulmonary arteries, capillaries and veins in response to intravascular infusion of vasoactive stimulus in the isolated, perfused and ventilated dog lung lobe. It was concluded that serotonin caused constriction and isoproterenol relaxation of both pulmonary arteries and veins, whereas histamine caused constriction only in veins. Later, measurements of capillary red blood cell concentration in the isolated dog lung confirmed that serotonin and histamine caused constriction of pulmonary veins, whereas alveolar hypoxia caused constriction only in pre‐capillary pulmonary arteries (Glazier & Murray, 1971). Subsequently, studies in ring preparations of isolated pulmonary arteries and veins of different size (diameter greater than 200 μm) from sheep showed that veins contracted strongly in response to endothelin and thromboxane A2 mimetic agonist U46619 (Kemp et al. 1997). More recently, the reactivity of peripheral pulmonary arteries and SPVs (diameter lower than 200 μm) to several cardiovascular agents was investigated in precision‐cut lung slices (PCLS) prepared from guinea pigs (Rieg et al. 2011). These studies showed that SPVs responded stronger than small arteries to α1‐agonists and β2‐agonists, whereas only the SPVs contracted in response to vasopressin and angiotensin II. These findings suggest that the pulmonary veins may play an important role in the regulation of pulmonary blood flow in health and disease.
The cellular mechanisms involved in the excitation–contraction coupling in SPVs exposed to different physiological vasoconstrictors are poorly understood. In the lung, nucleotides are released from many cells, including endothelial cells, VSMCs and airway epithelial cells under physiological and pathological conditions (Lazarowski et al. 2003; Muller et al. 2017). Particularly, the release of ATP has been found to be elevated in certain pulmonary diseases (Rich et al. 2003; Idzko et al. 2007, 2014; Lommatzsch et al. 2010; Helenius et al. 2015) and it is a co‐transmitter released with noradrenaline from perivascular adrenergic nerves in pulmonary veins (Kummer, 2011). Extracellular ATP binds to nucleotide membrane receptors, including purinergic type 2 (P2) receptors, to induce a number of cellular responses, including vasoconstriction (Rubino & Burnstock, 1996). However, the effects of ATP on SPV contraction and the mechanisms that couple an ATP stimulus to VSMC contraction in SPVs have not yet been investigated. In the present study, we used PCLS and confocal and phase‐contrast video microscopy to investigate, for the first time, dynamic changes in SPV contraction and in [Ca2+]i within VSMCs in the rat SPV. The results obtained suggest that extracellular ATP stimulates P2Y2 receptors in VSMCs to cause persistent Ca2+ oscillations and robust SPV contraction.
Methods
Ethical approval
All animal experiments were approved by the Institutional Animal Care & Use Committee of Texas Tech University Health Sciences Centre and by the ‘Comité de Bioética sobre Investigación en Animales’ of the Faculty of Medicine, University of Chile. Animal care and experiments conform to the guidelines of The Journal of Physiology (Grundy, 2015).
Reagents
All general reagents were obtained from either Thermo Fisher Scientific (Thermo Fisher Scientific Inc., Waltham, MA, USA) or Sigma‐Aldrich (St Louis, MO, USA). ATP and suramin were purchased from Alexis Biochemicals (Lausen, Switzerland) and adenosine‐5'‐O‐(3‐thiphosphate) were obtained from Biolog‐Life Science Institute (Bremen, Germany). Angiotensin II, ADP and UTP were obtained from Sigma‐Aldrich. Endothelin‐1 and the inhibitors 2‐APB, U‐73122 and U‐73343 were purchased from Enzo Life Sciences (Farmingdale, NY, USA). The inhibitor ryanodine (free of dehydro‐ryanodine) was obtained from Ascent Scientific (Bristol, UK) and P2Y receptors inhibitors MRS2179 (N6‐methyl‐2'‐deoxyadenosine‐3',5'‐bisphosphate) and AR‐C118925 were obtained from Tocris Bioscience (Tocris Bioscience, St Louis, MO, USA). Oregon Green 488 BAPTA‐1, AM was purchased from Thermo Fisher Scientific.
Preparation of rat PCLS
Rat PCLS were prepared by modifying the procedures used for the preparation of mouse PCLS (Perez & Sanderson, 2005b; Perez‐Zoghbi et al. 2010). Sprague–Dawley rats (weighing 160–250 g) were killed with an i.p. injection of pentobarbital sodium (Fatal‐Plus; Vortech, Inc., Fallston, MD, USA) and the chest area was soaked with 70% ethanol. Subsequently, the chest cavity was opened, the trachea exposed and cannulated, and the lungs were inflated in situ with ∼10 mL of warm (37°C) 2% low‐melting point agarose in Hank's balanced salt solution supplemented with 20 mm Hepes buffer (pH 7.40) (sHBSS). The inferior vena cava was clamped and ∼2–4 mL of 6% gelatin in sHBSS was injected into the right ventricle of the heart to fill the pulmonary blood vessels. The agarose and gelatin were solidified by cooling the lungs with a cotton ball soaked in ice‐cold sHBSS and maintaining the rat body at 4°C for 30 min. The lungs and heart were removed from the animal and held in ice‐cold sHBSS for 30 min. The left lung was separated, trimmed near the main bronchus to create a base and cut in two small pieces. Each lung piece was transferred to the specimen syringe tube of a tissue slicer (Compresstome VF‐300; Precisionary Instruments, San Jose, CA, USA) with the lobe base sitting on the tube. The lung lobe was embedded first into ∼0.1 mL of 2% agarose and then fully covered with 6% gelatin. After the agarose and gelatin solidified, the block was cut into serial sections of 150 μm starting at the peripheral edge of the lung lobe. The entire procedure was performed in a safety cabinet under sterile conditions. PCLS were observed on an inverted phase‐contrast microscope and checked for the presence of veins cut in transverse section. PCLS containing SPVs were maintained in low‐glucose Dulbecco's modified eagle medium (Invitrogen, Carlsbad, CA, USA) supplemented with 1 × antibiotic solution containing l‐glutamine, penicillin and streptomycin (Thermo Fisher Scientific) at 37°C and 10% CO₂ in a cell culture incubator for 8–16 h before use. For the experiments, only PCLS that contained SPVs with a lumen diameter of between 80 and 200 μm fully attached to the surrounding lung parenchyma were used.
Immunofluorescence
The PCLS were washed four times with phosphate‐buffered saline (PBS) in a 24 well plate and fixed with 500 μL of ice‐cold acetone (100%) for 30 min at –20°C. Fixed PCLS were washed three times with PBS for 3 min each and incubated for 1 h at room temperature (RT) with blocking solution containing bovine serum albumin (BSA) (1%) and Triton X‐100 (0.2%) in PBS. Subsequently, the PCLS were rinsed with PBS (three times for 3 min each) and exposed to specific primary antibodies: (i) anti‐smooth muscle α‐actin (Santa Cruz Biotechnology); (ii) anti‐P2Y2 receptor (Alomone Labs, Jerusalem, Israel); and (iii) anti‐P2Y4 receptor (Santa Cruz Biotechnology), all diluted 1:1000 in PBS supplemented with BSA (1%) and Triton X‐100 (0.05%), for 2 h at RT. Then, the PCLS were rinsed with PBS and incubated with FITC‐ and Alexa fluor 633‐conjugated secondary antibodies diluted 1:400 in PBS supplemented with BSA (1%) and Triton X‐100 (0.05%) for 1 h at RT in the dark. Finally, the PCLS were washed with PBS and mounted using mounting medium glycerol: PBS, 9:1 and maintained at 4°C until analysis by confocal microscopy.
Measurement of pulmonary SPV contraction
SPVs were identified in the PCLS using phase‐contrast microscopy as the large blood vessels surrounded by alveolar parenchyma and located anatomically distant from the airways. The airways were readily recognized because they are characterized by the presence of epithelial cells with beating cilia. The airways were excluded from the present study. For our experiments, we selected SPVs in cross‐section with a clear open lumen and completely attached to the alveolar parenchyma. The PCLS were placed at the centre of a 22 × 40 mm cover‐slip in a custom‐made perfusion chamber and held in place with a small sheet of nylon mesh. A small hole was cut in the mesh and centred over the selected SPV. A second 11 × 30 mm cover‐slip, edged with silicone grease, was placed over the mounted PCLS to create a thin rectangular chamber. The PCLS was perfused by adding solution at one end of the chamber and removing it by suction at the opposite end by means of a gravity‐fed, computer‐controlled perfusion system. The volume of the chamber (∼100 μl) and the perfusion rate (∼800 μl min−1) were maintained constant for the duration of each experiment. The chamber was placed on the stage of an inverted phase‐contrast microscope (Diaphot TMD; Nikon, Tokyo. Japan) and PCLS were imaged with a 10× objective. Digital images (640 × 488 pixels) were recorded to a hard drive in time‐lapse (0.5 Hz) using a CCD camera (KP‐M1A; Hitachi, Tokyo, Japan), frame grabber (Picolo; Euresys, Angleur, Belgium) and image acquisition software (Video Savant; IO Industries, London, ON, Canada). The area of the SPV lumen was calculated from each image using a custom‐written script in Video Savant, allowing the lumen to be distinguished from the the surrounding tissue by means of a series of image‐processing functions, including filtering, smoothing, grey‐scale thresholding and binarization, followed by calculation of the lumen cross‐sectional area by pixel summation. The lumen area was normalized to the area before stimulation using Excel (Microsoft Corp., Redmond, WA, USA) and the changes in lumen area were plotted vs. time using Origin (Microcal, Malvern, UK). Most SPV contraction experiments were performed at RT. However, to investigate whether SPV contractile responses to ATP are different at 37°C, we warmed the perfusion solutions in a controlled‐temperature water bath placed next to the imaging set‐up and used a peristaltic pump to superfuse the PCLS in the microscope chamber. The temperature of the perfusion solution was monitored with a thermometer and the settings of the water bath were adjusted to deliver the perfusion solutions at 37°C.
Measurements of intracellular Ca2+
Approximately 10–12 PCLS were incubated for 50 min at 30°C in 2 ml of sHBSS supplemented with 20 μm Oregon Green 488 BAPTA‐1 acetoxymethyl ester (Invitrogen) dissolved in 20 μL of dry dimethyl sulphoxide (DMSO) plus 5 μL of 20% Pluronic F‐127 in DMSO. PCLS were then transferred to 2 mL of sHBSS and incubated for 50 min at 30°C to allow for de‐esterification of the acetoxymethyl group. PCLS were mounted in the perfusion chamber as described previously and fluorescence imaging was performed with a custom‐made video‐rate confocal microscope (Sanderson & Parker, 2003). The sample was illuminated with a 488 nm laser beam and fluorescence emission (510–530 nm) was collected with a photomultiplier tube (PMT C7950; Hamamatsu Photonics, Hamamatsu City, Japan) and frame grabber (Alta‐AN; BitFlow, Woburn, MA, USA). Images were recorded at 15 Hz using Video Savant. Changes in fluorescence intensity were analysed by selecting regions of interest (ROI) ranging from 25 to 49 μm2. Average fluorescence intensities of an ROI were obtained, frame‐by‐frame, using a custom‐written script designed to track the ROI within a VSMC as it moved with contraction. Final fluorescence values were expressed as a fluorescence ratio (F/F 0) normalized to the initial fluorescence (F 0). Line‐scan analysis of images was performed by extracting a line of pixels from each image and placing them sequentially to form a time sequence in a single image. All experiments were performed at RT.
Statistical analysis
Statistical values are expressed as the mean ± SEM. Student's t test or the Mann–Whitney U test were used to evaluate the significance between means from two or more groups, respectively.
Online supporting information
The videos consisting of sequences of phase‐contrast or confocal fluorescence images were produced with Video Savant.
Results
Structural organization and contractile responses of SPVs in rat PCLS
A SPV and other lung tissue structures were identified in a PCLS with low‐magnification phase‐contrast microscopy (Fig. 1 A). The structure with the biggest cross‐sectional luminal area (lumen area hereafter) corresponds to a peripheral airway that is characterized by the presence of ciliated epithelia (with beating cilia) lining the airway lumen. Two blood vessels were observed in the PCLS: a small pulmonary artery that was localized next to the airway and a SPV that was localized distal to the airway–artery pair and surrounded by alveolar parenchyma. The identification of these blood vessels in the PCLS is in accordance with the anatomical association between arteries and airways and the distal location of SPVs from airways in the lung (Hislop, 2002; Townsley, 2012). At higher magnification, the SPV was observed with an open lumen delimited by a thin wall and surrounded by alveolar parenchyma. The walls of a SPV were characterized by abundant VSMCs, which were revealed by immunostaining with a specific antibody against SMC type α‐actin (Fig. 1 A, inset). Rat SPVs were free of the cardiomyocytes that are normally found in larger pulmonary veins of rat and human lungs (Hashizume et al. 1998; Michelakis et al. 2001; Hosoyamada et al. 2010) but are present in the SPVs of mouse lungs (Rietdorf et al. 2014, 2015).
Figure 1. Localization and contractile responses of SPVs in rat PCLS.

A, phase contrast image of a PCLS at low magnification showing a SPV, alveolar parenchyma (Al), a bronchiole airway (Aw) and a small pulmonary artery (SPA); inset: confocal scanning image of a SPV at higher magnification to show the immunolocalization of VSMCs (green) surrounding the SPV lumen (L) using specific smooth muscle α‐actin antibody. B, representative phase‐contrast images showing a SPV in a PCLS before stimulation (resting) and after stimulation with 50 μm ATP (2), isotonic solution containing 50 mm KCl (3), 100 nm Ang II (4) and 20 nm ET‐1 (5) obtained at the times indicated by the numbers in the trace in (C). C, dynamic changes in SPV luminal area during PCLS superfusion with the vasoconstrictors at the times indicated by the bars at the top of the trace. Washout of vasoconstrictors was performed by HBSS superfusion. SPV constriction (reduction in SPV lumen area) in response to ATP and KCl was sustained in the presence of stimuli and the SPV relaxed upon stimuli washout. By contrast, SPV contraction in response to Ang II was transient, showing relaxation before Ang II washout. SPV contraction in response to ET‐1 persisted after ET‐1 washout. Representative experiment of 12 SPVs in different PCLS from five rats. [Color figure can be viewed at http://wileyonlinelibrary.com]
To determine the contractile responsiveness of SPVs, we superfused PCLS sequentially with four physiologically relevant vasoconstrictors: ATP, membrane depolarization with isotonic 50 mm KCl containing sHBSS (KCl), angiotensin II (Ang II) and endothelin‐1 (ET‐1) and then measured SPV contraction as the changes in SPV lumen area with phase‐contrast video microscopy (Fig. 1 B and C; see also Supporting information, Video S1). All vasoconstrictors caused a reduction of SPV lumen area (SPV contraction) compared to the lumen area in the resting state (Fig. 1 B). However, there were differences in the magnitude and kinetics of the responses induced by each vasoconstrictor (Fig. 1 C). In response to 50 μM ATP, SPVs contracted and reduced their lumen by 59 ± 5% (n = 12) at 60 s after the onset of the contraction. ATP‐induced SPV contraction was sustained during the presence of the stimulus. ATP removal by sHBSS superfusion caused an increase in SPV lumen area (SPV relaxation) back to the resting level. Stimulation with KCl induced a reduction in SPV lumen area of 44% ± 8% (n = 12) after 5 min of stimulation and KCl washout induced complete relaxation. The subsequent stimulation with 100 nm Ang II induced a transient SPV contraction with a maximum reduction in lumen area of 30 ± 4% (n = 11) at 45 s after the onset of contraction but rapid relaxation despite continuous superfusion with Ang II. During Ang II washout, the SPV continued relaxing slowly and its lumen area was ∼10% higher area than the initial resting area after a 10 min washout. Finally, stimulation with 20 nm ET‐1 induced a SPV contraction that was characterized by a strong and prolonged decrease in lumen area, which reached 86 ± 5% (n = 7) after 5 min of ET‐1 perfusion. By contrast to the other vasoconstrictors, the SPV did not relax during 10 min of ET‐1 washout. These experiments were performed at RT because increasing the temperature to 37°C was reported to have no significant effects on the magnitude and kinetics of airway contractile responses to agonists in previous studies using PCLS (Bai & Sanderson, 2009; Bai et al. 2009). However, to confirm that SPV contractile responses to ATP are similar at the physiological temperature of 37°C and at RT, we superfused PCLS with solutions maintained at 37°C. We found that 50 μm ATP caused an 82.1 ± 1.8% (n = 3) reduction of the SPV luminal area at 37°C, suggesting that, at this temperature, ATP induces a stronger SPV contraction than at RT.
Extracellular ATP activates P2Y2 receptors in VSMCs of SPV
To investigate the mechanism of SPV contraction induced by extracellular ATP, we first used immunological and pharmacological approaches to characterize the membrane receptors involved. Figure 2 A shows the immunolocalization of purinergic P2Y2 receptors in the VSMCs of the SPV, as indicated by a prominent positive staining of these vessels with P2Y2 antibody and co‐localization with SMC α‐actin antibody staining (Fig. 2 Aa–Ad). This contrasts with P2Y4 immunofluorescence that produced a weak and diffuse staining in the lung tissue and an absence of co‐localization with SMC α‐actin (Fig. 2 Ae–Ah). Subsequently, we investigated the sensitivity of the contractile responses of SPV to ATP and compared it with that induced by other nucleotides known to activate purinergic receptors (Fig. 2 B and C). Upon stimulation with increasing ATP concentrations in the range 0–1000 μm, SPV reduced the lumen area from 100% to ∼10% (Fig. 2 B). The concentration–response curve shows that SPV contraction was initiated at ∼10 μM ATP, reached a near maximal contraction of 77% at ∼100 μM ATP, and had a half‐maximal effective concentration (EC50) of 28.5 ± 1.1 μm (Fig. 2 C). To examine whether ATP hydrolysis was necessary for contraction, SPVs were stimulated with the non‐hydrolysable ATP analogue ATPγ‐S. The concentration–response curve for ATPγ‐S shows that SPV contraction was initiated at 1 μm, reached a maximum contraction of 89% at 10 μm, and had an EC50 of 2.5 ± 0.4 μm for ATPγ‐S. These results suggest that ATP hydrolysis was not required for SPV contraction and that the affinity of SPV was ∼10 times higher for ATPγ‐S than for ATP, supporting the hypothesis that P2Y2 receptors mediate the contractile response because ATPγ‐S is known to have higher potency than ATP for P2Y receptors. Alternatively, hydrolysis of ATP could account for an apparent lower affinity of the SPV to ATP. However, because the PCLS were continuously superfused with the vasoconstrictors during the stimulation time, we consider that ATP hydrolysis by enzymes in the tissue slice had a minimal effect on the change in ATP concentration of the continuously superfused solution. The SPV responded to UTP stimulation with a sensitivity similar to that of ATP (EC50 was 16.4 ± 1.3 μm for UTP) (Fig. 2 C). This result is also compatible with the activation of P2Y2 receptors in the SPV because UTP and ATP are known to activate these receptors with similar potencies (Ralevic & Burnstock, 1998). Finally, ADP also induced SPV contraction but was the nucleotide with lower potency (EC50 was 117.0 ± 1.1 μm), which is in accordance with P2Y2 activation because ADP activates P2Y2 receptors with a lower potency than ATP and UTP (Ralevic & Burnstock, 1998). Finally, we investigated the effect of known inhibitors of purinergic receptors on ATP‐induced SPV contraction (Fig. 2 D and E). The addition of suramin (300 μm) to SPVs pre‐contracted with ATP induced a slow‐rate but strong SPV relaxation (Fig. 2 D). Subsequent suramin washout showed a reversibility, although the SPV re‐contracted only partially in the continuous presence of ATP. Statistical analysis shows that 10 min of suramin superfusion caused 62% of SPV relaxation (the airway remained 38% contacted) (Fig. 2 E), suggesting that ATP‐induced SPV contraction is mediated by activation of a purinergic receptor. In similar experiments, we found that ATP‐induced SPV contraction was resistant to MRS2179 (an inhibitor of P2Y1 receptors) but strongly inhibited (i.e. the SPV relaxed) by AR‐C118925 (a selective P2Y2 receptor antagonist) (Fig. 2 E). Altogether, these experiments suggest that P2Y2 receptors mediate the contractile response of SPVs to extracellular ATP.
Figure 2. Immunolocalization of P2Y2 receptors in VSMCs in SPVs and their functional activation and inhibition by purinergic mediators.
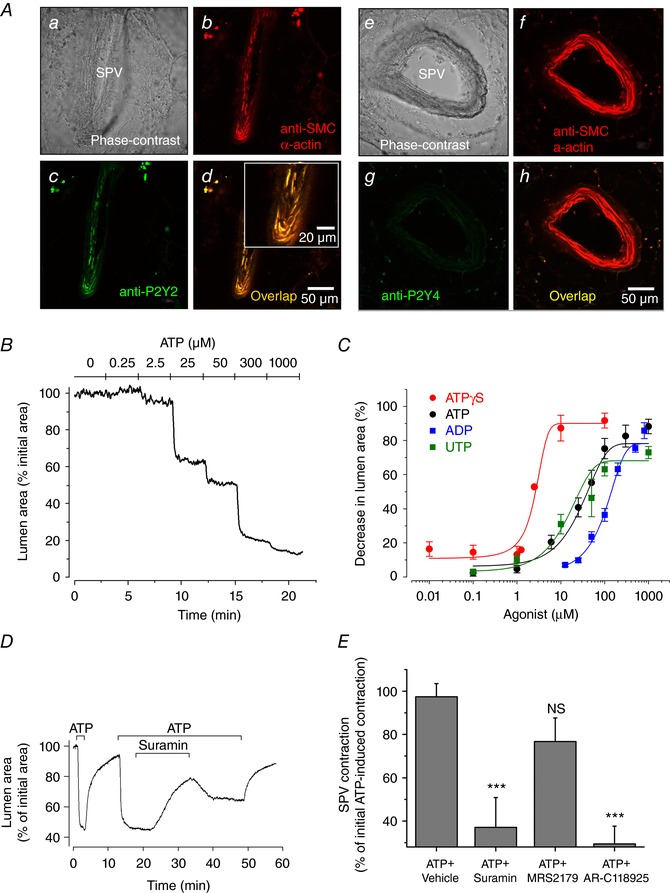
A, immunofluorescence showing the co‐localization of P2Y2 receptors with SMC α‐actin in VSMCs within a SPV (Aa–Ad) and absence of P2Y4 receptors (Ae–Ah). B, representative experiment showing the change in SPV lumen area with respect to time, in response to stimulation with increasing ATP concentrations (0 to 1000 μm). C, summary of SPV contraction induced by different purinergic receptor nucleotide agonists. SPV contraction in PCLS was obtained from experiments as shown in (B) and is expressed as the decrease in SPV lumen area after 5 min of nucleotide addition. Each point represents the mean ± SEM of five experiments from three rats. The data points were fitted with Boltzmann functions and the estimated effective concentration fifty (EC50) values were 2.5 ± 0.4 μm for ATPγ‐S, 16.4 ± 1.3 μm for UTP, 28.5 ± 1.1 μm for ATP and 117 ± 1.1 μm for ADP. D, representative experiment showing SPV contraction in response to ATP (50 μm) and relaxation after subsequent addition of suramin (300 μm). E, summary of the effect of purinergic receptor antagonists suramin, MRS2179 (10 um) and AR‐C118925 (10 um) on ATP induced SPV contraction. Suramin and MRS2179 were superfused for 15 min and AR‐C118925 for 30 min, in experiments similar to that shown in (D). The data are expressed as the mean ± SEM (n = 8 from four rats) of the contraction obtained at the end of the addition of ATP + inhibitor with respect to the initial pre‐contraction induced by ATP as shown in (D). ***P < 0.01 with respect to ATP + vehicle (Mann–Whitney U test). [Color figure can be viewed at http://wileyonlinelibrary.com]
Role of phospholipase C (PLC)‐β on ATP‐induced SPV contraction
P2Y2 receptors are G‐protein coupled receptors that relay extracellular signals by activating Gq‐dependent PLC‐β at the plasma membrane. To test whether ATP‐induced SPV contraction depends on PLC‐β activation, we investigated the effects of both PLC‐β inhibitor U73122 and its inactive analogue U73343 (Fig. 3 A and B). These drugs were used at 10 μm because, at this concentration, U73122 produces a submaximal inhibition of vasoconstriction in systemic arteries by inhibiting PLC‐β (Kuang et al. 2017). The maximal ATP‐induced SPV contractions obtained in the presence of U73343 and U73122 were 74.7 ± 14.0% and 9.3 ± 4.7% (n = 8) of the control, respectively, showing that PLC‐β inhibition blocks SPV contraction to ATP. To further test the specificity of our treatment with U73122 with respect to inhibition of PLC‐β‐dependent vasoconstriction, we investigated whether a similar exposure of PCLS to 10 μm U73122 affects the SPV contraction induced by 50 mm KCl (a vasoconstrictor acting via a non‐PLC pathway). By contrast to the strong inhibition of ATP‐induced SPV contraction caused by 10 μm U73122, this treatment had no significant effect on KCl‐induced SPV contraction (n = 5). These results suggest that PLC‐β activation is required for ATP‐induced SPV contraction. PLC‐β activation results in the synthesis of inositol 1,4,5‐trisphosphate (InsP3) and diacylglycerol, which is followed by the release of Ca2+ from sarcoplasmic reticulum (SR) intracellular stores to increase the cytosolic Ca2+ concentration ([Ca2+]i) to a level necessary for the activation of smooth muscle contraction. Alternatively, ATP could activate purinergic P2X receptors to induce extracellular Ca2+ influx and vasoconstriction (Burnstock, 2007). To discard this possible mechanism, we investigated the effect of extracellular Ca2+ removal (Fig. 3 C). Superfusion of PCLS with ATP in sHBSS with 1.8 mm Ca2+ induced SPV contraction that was sustained until ATP was removed. In the absence of extracellular Ca2+, stimulation with ATP also induced SPV contraction, indicating that P2X activation and Ca2+ influx was not required for vasoconstriction in SPV, as well as supporting our previous results indicating the activation of P2Y2 receptors, PLC‐β and intracellular Ca2+ release. Furthermore, in the absence of extracellular Ca2+, the SVP contraction was transient, suggesting that Ca2+ influx is also activated during ATP stimulation but is only necessary to refill intracellular Ca2+ stores and sustain SPV contraction.
Figure 3. Effect of PLC inhibitor analogues and extracellular Ca2+ on ATP‐induced SPV contraction.

A, representative experiment showing ATP‐induced SPV contraction in the absence of PLC inhibitor and in the presence of PLC inactive (U73343 10 μm) and active (U73122 10 μm) inhibitor analogues. B, summary of the effect of the PLC inactive and active inhibitor analogues on ATP‐induced SPV contraction. The data are expressed as the mean ± SEM (n = 6 from three rats) of the percentage of maximal ATP‐induced SPV contraction in the absence of PLC inhibitor. ***P < 0.001; NS, not significant (one‐way ANOVA followed by Tukey's comparison). C, representative experiment showing SPV contraction in response to ATP (50 μm) in sHBSS and in Ca2+‐free sHBSS (0‐Ca2+). SPV contraction was sustained or transient in the presence or absence of extracellular Ca2+, respectively. The trace is presentative of eight experiments from different slices from five rats.
Ca2+ signalling in SPV SMCs induced by ATP
We next characterized Ca2+ signalling in VSMCs underlying ATP‐induced SPV contraction (Fig. 4). VSMCs alone with endothelial cells (ECs) lining the SPV lumen were readily visualized in Oregon green‐BAPTA‐1/AM loaded PCLS using a confocal microscope (Fig. 4 A). There were no changes in the fluorescence intensity within these cells during continuous superfusion of the slices with sHBSS. Upon stimulation with 50 μm ATP, we observed a rapid increase in fluorescence in both VSMCs and ECs. The increase in EC fluorescence was sustained with a small variation in intensity over the time that ATP was superfused. By contrast, the Ca2+ signal in VSMCs was characterized by an initial increase in fluorescence (F/F 0) from 1.0 to 3.1 ± 0.1 that was immediately followed by oscillations with an amplitude of 1.2 ± 0.6 and a frequency of 2.2 ± 0.1 cycles min–1 (n = 19) (Fig. 4 B; see also Supporting information, Video S2). These Ca2+ oscillations persisted with an approximately constant frequency and amplitude when in the presence of ATP and ceased shortly after ATP was removed. Concomitant with the increase in [Ca2+]i and initiation of the Ca2+ oscillations, VSMCs contracted and the SPV lumen area decreased (Fig. 4 B). We measured a delay of 3 ± 0.3 s (n = 16) between the initial increase in [Ca2+]i in the SMC and the initialization of the SPV contraction. ATP‐induced Ca2+ oscillations were asynchronous and took place at variable frequencies in adjacent SPV VSMCs (Fig. 4 C; see also Supporting information, Video S2). Ca2+ oscillations were characterized by increases in [Ca2+]i that propagated along single VSMCs as Ca2+ waves (Fig. 4 D; see also Supporting information, Video S2). The propagation velocity of the Ca2+ waves was 17 ± 1.6 μm s−1 (n = 8 VSMCs from two rats). Ca2+ oscillations in ECs were never observed (Fig. 4 C; see also Supporting information, Video S2); however, the robust [Ca2+]i response suggests that the endothelium in SPVs is functionally intact and responsive to ATP stimulation in the PCLS.
Figure 4. Ca2+ signalling in SPV SMCs induced by ATP.

A, fluorescence confocal image of a SPV loaded with the intracellular Ca2+ indicator Oregon green‐BAPTA‐1/AM showing VSMCs and ECs lining the SPV lumen. B, simultaneous changes in [Ca2+]i in a VSMC (top trace) and SPV contraction (bottom trace) during stimulation with ATP (50 μm). The changes in [Ca2+]i are expressed as the ratio (F/F 0) of fluorescence measured in a small square region (49 μm2) within a VSMC (white square in A). SPV contraction is expressed as the change in lumen area of the imaged SPV region. The experiment is representative of 12 experiments from different slices from four rats. C, line‐scan plot from a region across the wall of the SPV (indicated by dotted line a in A) showing ATP‐induced Ca2+ oscillations (vertical white lines) in two VSMC. D, line‐scan plot from a region along the longitudinal axis of a single VSMC (indicated by dotted line b in A) showing the Ca2+ wave propagation associated with the Ca2+ oscillations (vertical white lines).
The mechanism of ATP‐induced Ca2+ oscillations in VSMCs in SPVs
ATP‐induced stimulation of P2Y2 purinergic receptors and PLC‐β activation leads to an increase in InsP3 synthesis and the consequent release of intracellular Ca2+ by sensitized InsP3 receptors (InsP3R) in the SR. In addition, ryanodine receptors in the SR may contribute to the intracellular Ca2+ release process. To investigate the role of these Ca2+ release channels in the ATP‐induced Ca2+ oscillations in SPV VSMCs and SPV contraction, we first evaluated the effects of the InsP3R inhibitor 2‐APB (Fig. 5 A–C). Because 2‐APB is also known to inhibit Ca2+ influx via store‐operated Ca2+ channels at the plasma membrane, we avoided this possible effect by removing the extracellular Ca2+ in our experiments. In the absence of extracellular Ca2+ and in the presence of 2‐APB, the ATP‐stimulated Ca2+ signal consisted of a single, low amplitude transient signal that rapidly returned to the basal level (Fig. 5 A). This response significantly contrasted with the few Ca2+ oscillations of high amplitude observed in Ca2+ free sHBSS in the absence of 2‐APB. In addition, the transient SPV contraction induced by ATP in the absence of extracellular Ca2+ was significantly inhibited by 2‐APB (Fig. 5 B and C). These results suggest that inhibition of InsP3R with 2‐APB inhibited ATP‐induced Ca2+ release and SPV contraction. However, in our experiments, 2‐APB did not completely block the Ca2+ signalling and contraction induced by ATP, most probably because the incubation period with 2‐APB was short (∼3 min). This is consistent with our previous PCLS studies demonstrating that 2‐APB under these conditions partially inhibited the Ca2+ oscillations and contraction triggered by intracellular InsP3 photorelease from caged InsP3 (Castro‐Piedras & Perez‐Zoghbi, 2013).
Figure 5. Effect of InsP3R inhibitor 2‐APB and RyR inhibitor ryanodine on ATP‐induced Ca2+ oscillations and SPV contraction.

A, Ca2+ signalling in a SPV SMC induced by ATP (50 μm) in slices incubated for ∼2 min in Ca2+‐free sHBSS with 2‐APB (100 μm) and subsequently without 2‐APB as labelled above the trace. The result shows inhibition of Ca2+ oscillations by 2‐APB in the absence of extracellular Ca2+. Data are representative of 10 experiments from different slices from six rats. B, ATP‐induced SPV contraction in Ca2+‐free sHBSS without and with 2‐APB (100 μm), showing the inhibition of SPV contraction by 2‐APB in the absence of extracellular Ca2+. C, summary of the effect of 2‐APB on ATP‐induced SPV contraction in the absence of extracellular Ca2+. Data are the maximal ATP‐induced SPV contraction in Ca2+‐free sHBSS without and with 2‐APB (numbers in parenthesis in B) divided by the SPV contraction in response to pre‐stimulation with ATP in sHBSS with 1.8 mm Ca2+ (not shown). Error bars denote SEM (n = 8 from five rats). **P < 0.001 (paired t test). D, Ca2+ oscillations induced by ATP in a SPV SMC in the presence of ryanodine (50 μm). Ca2+ oscillations persisted in the presence of ryanodine. E, SPV contraction in response to ATP (50 μm) before and after incubation with ryanodine (100 μm) during 30 min. SPV contraction persisted in the presence of ryanodine and the SPV relaxed after ATP washout by sHBSS perfusion. F, summary of the effect of ryanodine on ATP‐induced SPV contraction in experiments similar to those shown in (E). Error bars indicate the SEM (n = 4 from two rats); NS, not significant (paired t test).
We next used the ryanodine receptor (RyR) inhibitor ryanodine to investigate the role of RyR on ATP‐induced Ca2+ signalling and SPV contraction (Fig. 5 D–F). The addition of ryanodine (50 μm) to ATP stimulated SPVs for up to 4 min had no effect on Ca2+ oscillations (Fig. 5 D). Neither the frequency (2.0 ± 0.1 cycles min–1, n = 5, three rats), nor the amplitude (1.6 ± 0.1, n = 5, three rats) of the Ca2+ oscillations in the presence of ryanodine was significantly different from the Ca2+ oscillations in the absence of ryanodine. Similarly, ATP‐induced SPV contraction was not affected by incubation of PCLS for 30 min with 100 μm ryanodine, despite SPVs being observed to relax normally after ATP removal (Fig. 5 E and F). These results suggest that RyRs do not participate in ATP‐induced Ca2+ signalling and SPV contraction. Together, these results suggest that ATP‐induced Ca2+ oscillations in SPV SMCs are mediated by Ca2+ release via InsP3Rs and not through RyRs.
Discussion
We used phase‐contrast and confocal video microscopy to investigate, in rat PCLS, the mechanisms of VSMC contraction in SPVs (∼150 μm in diameter) during stimulation with extracellular ATP. Collectively, our results show that ATP caused robust, sustained, and reversible SPV contraction. This contraction was mediated by activation of purinergic P2Y2 receptors in SPV VSMCs, activation of PLC‐β, and the generation of persistent Ca2+ oscillations, which were mediated by cyclic intracellular Ca2+ release via InsP3R. This is the first demonstration of the mechanism of excitation–contraction coupling in SPVs during purinergic agonist stimulation and the first description of the intracellular Ca2+ signalling associated with vasoconstriction in VSMCs within SPVs in lung tissue slices.
Extracellular ATP has been known to affect the pulmonary circulation for a very long time. However, the vasoactive properties of ATP in the lung are complex and not fully understood. ATP responses vary in different locations of the pulmonary circulation, as well as under different physiological conditions and in lung diseases. In healthy animals, infusion of ATP in the blood stream was shown to increase pulmonary arterial pressure and pulmonary vascular resistance and produce vasoconstriction of pulmonary vessels (Emmelin & Feldberg, 1948; Reeves et al. 1967; Mentzer et al. 1975). These results were confirmed in isolated and perfused lung preparations (Hauge et al. 1966). However, when the pulmonary vascular tone was elevated either by infusing a vasoconstrictor such as 5‐HT, or by ventilating the lungs with hypoxic gas to induce hypoxic pulmonary vasoconstriction, the subsequent infusion of ATP resulted in vasodilatation of the pulmonary vessels and a decreased pulmonary arterial pressure (Rudolph et al. 1959; Neely et al. 1989; Fineman et al. 1990). In fetal animals, pulmonary blood flow is very low and pulmonary vascular resistance is elevated as a result of lung hypoxia. Infusion of ATP in fetal lung decreases pulmonary vascular resistance and increases pulmonary blood flow (Konduri et al. 1992; Crowley, 1997; Konduri & Mital, 2000). Furthermore, it has been suggested that ATP and adenosine mediate the pulmonary vasodilatation that occurs at birth in response to an increase in oxygen in the lungs and blood (Konduri et al. 1993, 1997) and that these effects of ATP are mediated by purinergic P2Y receptors in the endothelium of pulmonary arteries (Konduri et al. 2004). In pulmonary hypertension patients and animal models, infusion of ATP (and adenosine) decreased pulmonary arterial pressure and pulmonary vascular resistance (Brook et al. 1994). Interestingly, i.v. administration of adenosine in pulmonary hypertension patients has been shown to lower pulmonary arterial resistance but increase pulmonary capillary wage pressure (Nussbacher et al. 1995), suggesting opposing vasoactive effects in pulmonary arteries (vasodilatation) and pulmonary veins (vasoconstriction). In general, ATP infusion in the pulmonary circulation induces vasoconstriction in normal, low‐tone pulmonary vessels but induces vasodilatation when pulmonary vascular resistance has been elevated by a physiological stimulus or during disease. Endothelial cells are probably the first responders and mediators of the vascular responses to increases in luminal ATP (either by infusion administration or by release from blood cells), as demonstrated by experimental removal of the endothelium from vascular preparations (Baek et al. 2008). By contrast, ATP may directly interact with VSMC receptors when it is released by cells in the intima, including perivascular nerves and extravasated inflammatory cells (Inoue & Kannan, 1988). It is important to emphasize that, in the PCLS preparation, both endothelial and VSMCs can be stimulated directly by ATP and other vasoactive substances in the perfusion solution.
Using rat PCLS, we show that SPVs contracted and strongly reduced their cross‐sectional luminal area in response to vasoconstrictors that are physiologically relevant to the pulmonary circulation, including ATP, ANG II and ET‐1, as well as in response to high K+ isotonic solutions known to cause plasma membrane depolarization in VSMCs. This result is compatible with the hypothesis that SPVs participate in the active control of the pulmonary blood flow and pulmonary capillary pressures under normal and pathological situations and supports early work in the isolated lung lobe suggesting that these small pulmonary veins respond to vasoactive neurotransmitters to regulate regional pulmonary vascular resistance (Brody & Stemmler, 1968; Glazier & Murray, 1971). Importantly, as a result of evidence indicating that extracellular ATP is increased in several lung diseases, including during inflammatory and hypoxic conditions (Rich et al. 2003; Idzko et al. 2007, 2014; Cicko et al. 2010; Lommatzsch et al. 2010; Muller et al. 2017), the focus of our work was on the mechanisms involved in ATP‐induced SPV contraction.
In the present study, we developed a unique approach combining several strategies that allowed us to experimentally expose PCLS to various vasoconstrictors, drugs and controlled conditions, at the same time as monitoring physiological responses in SPVs. This approach incorporated: (i) the preparation of rat PCLS preserving the natural structure of the SPV in the lung tissue, including their connections to the lung parenchyma and the preservation of the recoil forces against which the VSMCs contract, and also maintaining dilated SPVs when they are not actively contracting; (ii) the use of customized microscopic techniques that allow the automatic superfusion of PCLS with different solutions following a pre‐programmed schedule; (iii) the sequential collection of phase‐contrast images or fluorescence images with an adequate spatial and temporal resolution; (iv) the use of customized imaging analysis techniques to determine dynamic changes in SPV cross‐sectional luminal area and in intracellular Ca2+ concentration in individual VSMCs; and (v) the use of immunofluorescence in the PCLS to detect the expression of specific purinergic receptors and smooth muscle proteins. A similar approach has been used previously to investigate contraction and Ca2+ signalling in small airways and intrapulmonary arteries (Bergner & Sanderson, 2002; Perez & Sanderson, 2005a, b; Bai & Sanderson, 2006). Thus, in the present study, we have extended the use of PCLS to investigate contraction and Ca2+ signalling in VSMCs in SPVs.
The SPVs were easily identified in rat PCLS because the intrapulmonary veins are surrounded by alveolar parenchyma and are separated from the arteries and airways that branch together, as occurs in human lung tissue (Townsley, 2012). Additionally, we tested for the presence of SMC α‐actin in the PCLS indicating the presence of a smooth muscle layer in the wall of SPV (Fig. 1), in agreement with the well‐known presence of VSMC layers in the wall of rat and human SPVs (Hislop & Reid, 1973; Hashizume et al. 1998; Hosoyamada et al. 2010). The presence of substantial VSMCs in the SPV wall highlights the relevance of studying the vasoactivity of SPV and the excitation–contraction coupling mechanisms.
ATP and nucleotide responses are initiated by activation of two families of purinergic P2 receptors: (i) the ionotropic P2X receptors, which are membrane cation channels that allow extracellular Ca2+ influx, or (ii) the metabotropic P2Y receptors, which are G‐protein coupled receptors that activate Ca2+ release from intracellular stores (Burnstock, 2017). The two families of purinergic receptors comprise several members, including P2X: 1–7 and P2Y: 1, 2, 4, 6 and 11–14 receptors. However, it is unknown which receptor mediates the contractile responses of the SPV. Our results strongly suggest that ATP stimulation of SPV contraction involves the activation P2Y2 receptors because: (i) P2Y2, but not P2Y4 receptors, were immunolocalized in the SPV and co‐localized with smooth muscle α‐actin immunostaining; (ii) the sensitivity of SPV contraction to the nucleotides ATP, ATPyS, UTP and ADP is compatible with the known potency profile of recombinant and native P2Y2 receptors for these nucleotides (Ralevic & Burnstock, 1998); (iii) ATP‐induced SPV contraction was inhibited by suramin (a non‐specific purinergic receptor antagonist) and by AR‐C118925 (a specific P2Y2 receptor antagonist) (Rafehi et al. 2017) but was resistant to MRS2179 (a specific P2Y1 receptor antagonist) (Boyer et al. 1998); (iv) ATP‐induced SPV contraction was inhibited by PLC‐β specific antagonist U73122; and (v) activation of SPV contraction was accompanied by Ca2+ release from intracellular stores via InsP3R and Ca2+ oscillations in the VSMC and was activated in the absence of extracellular Ca2+. The last two points are indicative of the intracellular signalling cascade known to be activated by metabotropic P2Y receptors that couple to Gq/11 transducing (i.e. P2Y receptor subtypes 1, 2, 4 and 6) and discard the possibility of P2X receptors as mediators of vasoconstriction in the SPV. This last conclusion contrasts with the vast experimental evidence suggesting that P2X receptors mediate vasoconstriction in most systemic (non‐pulmonary) blood vessels (Burnstock & Ralevic, 2014; Burnstock, 2017), although, more recently, P2Y receptors have also been implicated in vasoconstriction (Haanes et al. 2016; Kauffenstein et al. 2016). We discarded the participation of P2Y1 in the SPV because P2Y1 receptors are more sensitive to ADP than ATP (Burnstock & Ralevic, 2014) and we found that ADP was less potent than ATP and UTP. Furthermore, ATP‐induced SPV contraction was resistant to P2Y1 specific inhibitor MRS2179. We discarded the participation of P2Y4 and P2Y6 receptors because these are more sensitive to UTP than ATP (Burnstock & Ralevic, 2014), in contrast to our observation that these two nucleotides are equipotent for SPV contraction, which in turn is in agreement with P2Y2 receptors having similar sensitivities to UTP and ATP (Burnstock & Ralevic, 2014). Altogether, our results support the hypothesis that P2Y2 receptors mediate the contractile responses of SPV to extracellular ATP.
The classic descriptions of vasoconstrictor‐ and agonist‐induced increases in intracellular Ca2+ in a variety of cells, including SMCs, consist of an initial spike followed by a plateau. This activity contrasts with the Ca2+ signals that we observed in single VSMC of the SPV in the PCLS. As shown in Fig. 4, ATP induced repetitive Ca2+ oscillations that propagated throughout the VSMC as intracellular Ca2+ waves. These Ca2+ oscillations were caused by intracellular Ca2+ release because they also occurred in the absence of extracellular Ca2+. Similar Ca2+ oscillations have been reported in small intrapulmonary arteries in PCLS (Perez & Sanderson, 2005a; Perez‐Zoghbi & Sanderson, 2007), in some preparations of systemic arteries such as pressurized systemic arteries (Miriel et al. 1999; Mauban et al. 2001) and also in airway SMCs in different tissue preparations from a wide variety of species from rodents to human (Sieck et al. 1997; Bergner & Sanderson, 2002; Perez & Sanderson, 2005b; Ressmeyer et al. 2010). Furthermore, in small pulmonary arteries and peripheral airways, we also observed Ca2+ oscillations when contraction was stimulated with KCl to induced membrane depolarization, although these oscillations had different kinetics, occurred at lower frequencies and were dependent on extracellular Ca2+ influx (Perez & Sanderson, 2005a). The suggestion is that Ca2+ oscillations characterize the Ca2+ signalling of ‘intact’ tissues such as PCLS when these are investigated with systems that have adequate spatial and temporal resolution to resolve the fast changes in intracellular Ca2+ characterizing the Ca2+ oscillations in individual SMCs. Accordingly, we used a video‐rate confocal microscope that allowed the acquisition of fluorescence images of PCLS at rates of 15 frames s–1 or faster. Such work confirms that Ca2+ oscillations are the signalling feature characterizing the Ca2+ signal in SMCs in a variety of vessels, including the SPV.
The mechanism of Ca2+ oscillations in VSMCs of the SPV was addressed using 2‐APB and ryanodine, which inhibit intracellular Ca2+ release via InsP3R and RyR, respectively. We found that ATP‐induced Ca2+ oscillations and SPV contraction were inhibited by 2‐APB but not by ryanodine, suggesting that InsP3R but not RyR mediate intracellular Ca2+ release. Our studies with 2‐APB were performed in the absence of extracellular Ca2+ to discard possible non‐specific effects of 2‐APB on Ca2+ influx via plasma membrane channels, as described previously (Gregory et al. 2001). Furthermore, we have used short incubation periods with 100 μm 2‐APB (∼3 min) because we found that these conditions resulted in specific inhibition (although not complete blockage) of the Ca2+ signalling and contraction activated by photorelease of intracellular InsP3 from caged‐InsP3 in peripheral airways in PCLS (Castro‐Piedras & Perez‐Zoghbi, 2013). By contrast, ryanodine did not inhibit ATP‐induced Ca2+ oscillations and SPV contraction. We have used short (∼4 min) and long (30 min) incubation periods with ryanodine (50 and 100 μm) in the present study, although neither of these conditions resulted in inhibition of SPV responses to ATP. The ryanodine incubation conditions used in the present study should be adequate to block Ca2+ oscillations if these were driven by RyRs because, in previous studies, we and others found that the Ca2+ signalling and contraction stimulated by 10 mm caffeine (a well‐known stimulus that results in Ca2+ release from ryanodine receptors) in peripheral airways was completely inhibited by 3 min of incubation with ryanodine (50 μm) and caffeine (10 mm) (Bai & Sanderson, 2006). Altogether, our results suggest that ATP‐induced Ca2+ oscillations in SPVs are mediated by cyclic Ca2+ release events via InsP3R but not RyR.
In conclusion, we found that the SPVs contract robustly in response to extracellular ATP and also to other vasoconstrictors relevant to the pulmonary circulation, including Ang II, ET‐1 and membrane depolarization with KCl. The SPV contraction induced by ATP was dependent on the stimulation of P2Y2 metabotropic receptors, activation of PCL‐β, the release of intracellular Ca2+ and the generation of Ca2+ oscillations mediated by InsP3R in the SR of the VSMC. Our results suggest that SPVs may play an important role in the active regulation of pulmonary vascular resistance in health and disease.
Additional information
Competing interests
The authors declare that they have no competing interests.
Author contributions
All authors have approved the final version of the manuscript submitted for publication and agree to be accountable for all aspects of the work. All persons designated as authors qualify for authorship and all those who qualify for authorship are listed. M.H. designed experiments, performed experiments, analysed data, created final figures, wrote the manuscript. M.F. performed experiments. J.F.P‐Z. designed experiments, performed experiments, analysed data, created final figures, wrote the manuscript.
Funding
This work was supported by grants from the American Heart Association (11SDG5670050) and the American Lung Association (RG‐196192‐N) to JFPZ and by grants from FONDECYT‐Chile (1140468) and from University of Chile (ENL029/2017) to MH.
Supporting information
Disclaimer: Supporting information has been peer‐reviewed but not copyedited.
Video S1: SPV contraction induced by vasoconstrictors.
Video S2: ATP‐induced Ca2+ oscillations in SPV VSMCs.
Biographies
Mauricio Henriquez recieved his PhD in Biomedical Sciences from the University of Chile. He joined Dr A. F. Quest's Laboratory at the University of Chile for his first postdoctoral position to investigate the role of purinergic receptors in cell death. His second postdoctoral position was in Dr J. F. Perez‐Zoghbi's Laboratory in Texas Tech University where he studied cell physiology of the pulmonary vascular tone. Currently, he is an Assistant Professor and Director of the Laboratory of Bronchovascular Dynamics & Lung Damage at the Institute of Biomedical Sciences, Faculty of Medicine, University of Chile.

Jose F. Perez‐Zoghbi obtained his PhD at the Instituto Venezolano de Investigaciones Científicas in Venezuela and then joined the laboratory of Dr M. Sanderson at UMASS Medical School for a postdoctoral position in cell physiology. He was an Assistant Professor of the Department of Cell Physiology & Molecular Biophysics in Texas Tech University Health Sciences Center. Recently, he joined the Department of Anaesthesiology at Columbia University in New York City.
Edited by: Laura Bennet & Fernando Santana
References
- Baek EB, Yoo HY, Park SJ, Kim HS, Kim SD, Earm YE & Kim SJ (2008). Luminal ATP‐induced contraction of rabbit pulmonary arteries and role of purinoceptors in the regulation of pulmonary arterial pressure. Pflugers Arch 457, 281–291. [DOI] [PubMed] [Google Scholar]
- Bai Y, Edelmann M & Sanderson MJ (2009). The contribution of inositol 1,4,5‐trisphosphate and ryanodine receptors to agonist‐induced Ca(2+) signaling of airway smooth muscle cells. Am J Physiol Lung Cell Mol Physiol 297, L347–L361. [DOI] [PMC free article] [PubMed] [Google Scholar]
- Bai Y & Sanderson MJ (2006). Modulation of the Ca2+ sensitivity of airway smooth muscle cells in murine lung slices. Am J Physiol Lung Cell Mol Physiol 291, L208–L221. [DOI] [PubMed] [Google Scholar]
- Bai Y & Sanderson MJ (2009). The contribution of Ca2+ signaling and Ca2+ sensitivity to the regulation of airway smooth muscle contraction is different in rats and mice. Am J Physiol Lung Cell Mol Physiol 296, L947–L958. [DOI] [PMC free article] [PubMed] [Google Scholar]
- Bergner A & Sanderson MJ (2002). Acetylcholine‐induced calcium signaling and contraction of airway smooth muscle cells in lung slices. J Gen Physiol 119, 187–198. [DOI] [PMC free article] [PubMed] [Google Scholar]
- Boyer JL, Mohanram A, Camaioni E, Jacobson KA & Harden TK (1998). Competitive and selective antagonism of P2Y1 receptors by N6‐methyl 2'‐deoxyadenosine 3',5'‐bisphosphate. Br J Pharmacol 124, 1–3. [DOI] [PMC free article] [PubMed] [Google Scholar]
- Brody JS & Stemmler EJ (1968). Differential reactivity in the pulmonary circulation. J Clin Invest 47, 800–808. [DOI] [PMC free article] [PubMed] [Google Scholar]
- Brook MM, Fineman JR, Bolinger AM, Wong AF, Heymann MA & Soifer SJ (1994). Use of ATP‐MgCl2 in the evaluation and treatment of children with pulmonary hypertension secondary to congenital heart defects. Circulation 90, 1287–1293. [DOI] [PubMed] [Google Scholar]
- Burnstock G (2007). Purine and pyrimidine receptors. Cell Mol Life Sci 64, 1471–1483. [DOI] [PMC free article] [PubMed] [Google Scholar]
- Burnstock G (2017). Purinergic signaling in the cardiovascular system. Circ Res 120, 207–228. [DOI] [PubMed] [Google Scholar]
- Burnstock G & Ralevic V (2014). Purinergic signaling and blood vessels in health and disease. Pharmacol Rev 66, 102–192. [DOI] [PubMed] [Google Scholar]
- Castro‐Piedras I & Perez‐Zoghbi JF (2013). Hydrogen sulphide inhibits Ca2+ release through InsP3 receptors and relaxes airway smooth muscle. J Physiol 591, 5999–6015. [DOI] [PMC free article] [PubMed] [Google Scholar]
- Cicko S, Lucattelli M, Muller T, Lommatzsch M, De Cunto G, Cardini S, Sundas W, Grimm M, Zeiser R, Durk T, Zissel G, Boeynaems JM, Sorichter S, Ferrari D, Di Virgilio F, Virchow JC, Lungarella G & Idzko M (2010). Purinergic receptor inhibition prevents the development of smoke‐induced lung injury and emphysema. J Immunol 185, 688–697. [DOI] [PubMed] [Google Scholar]
- Crowley MR ( 1997). Oxygen‐induced pulmonary vasodilation is mediated by adenosine triphosphate in newborn lambs. J Cardiovasc Pharmacol 30, 102–109. [DOI] [PubMed] [Google Scholar]
- Emmelin N & Feldberg W (1948). Systemic effects of adenosine triphosphate. Br J Pharmacol Chemother 3, 273–284. [DOI] [PMC free article] [PubMed] [Google Scholar]
- Fineman JR, Crowley MR & Soifer SJ (1990). Selective pulmonary vasodilation with ATP‐MgCl2 during pulmonary hypertension in lambs. J Appl Physiol (1985) 69, 1836–1842. [DOI] [PubMed] [Google Scholar]
- Glazier JB & Murray JF (1971). Sites of pulmonary vasomotor reactivity in the dog during alveolar hypoxia and serotonin and histamine infusion. J Clin Invest 50, 2550–2558. [DOI] [PMC free article] [PubMed] [Google Scholar]
- Gopalan D, McCann C, Sheares K & Screaton N (2012). Imaging in pulmonary hypertension, part 3: small vessel diseases. Postgrad Med J 88, 397–406. [DOI] [PubMed] [Google Scholar]
- Gregory RB, Rychkov G & Barritt GJ (2001). Evidence that 2‐aminoethyl diphenylborate is a novel inhibitor of store‐operated Ca2+ channels in liver cells, and acts through a mechanism which does not involve inositol trisphosphate receptors. Biochem J 354, 285–290. [DOI] [PMC free article] [PubMed] [Google Scholar]
- Grundy D (2015). Principles and standards for reporting animal experiments in The Journal of Physiology and Experimental Physiology. J Physiol 593, 2547–2549. [DOI] [PMC free article] [PubMed] [Google Scholar]
- Haanes KA, Spray S, Syberg S, Jorgensen NR, Robaye B, Boeynaems JM & Edvinsson L (2016). New insights on pyrimidine signalling within the arterial vasculature – different roles for P2Y2 and P2Y6 receptors in large and small coronary arteries of the mouse. J Mol Cell Cardiol 93, 1–11. [DOI] [PubMed] [Google Scholar]
- Hashizume H, Tango M & Ushiki T (1998). Three‐dimensional cytoarchitecture of rat pulmonary venous walls: a light and scanning electron microscopic study. Anat Embryol (Berl) 198, 473–480. [DOI] [PubMed] [Google Scholar]
- Hauge A, Lunde PK & Waaler BA (1966). Vasoconstriction in isolated blood‐perfused rabbit lungs and its inhibition by cresols. Acta Physiol Scand 66, 226–240. [DOI] [PubMed] [Google Scholar]
- Helenius MH, Vattulainen S, Orcholski M, Aho J, Komulainen A, Taimen P, Wang L, de Jesus Perez VA, Koskenvuo JW & Alastalo TP (2015). Suppression of endothelial CD39/ENTPD1 is associated with pulmonary vascular remodeling in pulmonary arterial hypertension. Am J Physiol Lung Cell Mol Physiol 308, L1046–L1057. [DOI] [PubMed] [Google Scholar]
- Hislop A & Reid L (1973). Structural changes in the pulmonary arteries and veins in tetralogy of Fallot. Br Heart J 35, 1178–1183. [DOI] [PMC free article] [PubMed] [Google Scholar]
- Hislop AA (2002). Airway and blood vessel interaction during lung development. J Anat 201, 325–334. [DOI] [PMC free article] [PubMed] [Google Scholar]
- Hosoyamada Y, Ichimura K, Koizumi K & Sakai T (2010). Structural organization of pulmonary veins in the rat lung, with special emphasis on the musculature consisting of cardiac and smooth muscles. Anat Sci Int 85, 152–159. [DOI] [PubMed] [Google Scholar]
- Idzko M, Ferrari D & Eltzschig HK (2014). Nucleotide signalling during inflammation. Nature 509, 310–317. [DOI] [PMC free article] [PubMed] [Google Scholar]
- Idzko M, Hammad H, van Nimwegen M, Kool M, Willart MA, Muskens F, Hoogsteden HC, Luttmann W, Ferrari D, Di Virgilio F, Virchow JC Jr & Lambrecht BN (2007). Extracellular ATP triggers and maintains asthmatic airway inflammation by activating dendritic cells. Nat Med 13, 913–919. [DOI] [PubMed] [Google Scholar]
- Inoue T & Kannan MS (1988). Nonadrenergic and noncholinergic excitatory neurotransmission in rat intrapulmonary artery. Am J Physiol Heart Circ Physiol 254, H1142–H1148. [DOI] [PubMed] [Google Scholar]
- Kauffenstein G, Tamareille S, Prunier F, Roy C, Ayer A, Toutain B, Billaud M, Isakson BE, Grimaud L, Loufrani L, Rousseau P, Abraham P, Procaccio V, Monyer H, de Wit C, Boeynaems JM, Robaye B, Kwak BR & Henrion D (2016). Central role of P2Y6 UDP receptor in arteriolar myogenic tone. Arterioscler Thromb Vasc Biol 36, 1598–1606. [DOI] [PMC free article] [PubMed] [Google Scholar]
- Kemp BK, Smolich JJ & Cocks TM (1997). Evidence for specific regional patterns of responses to different vasoconstrictors and vasodilators in sheep isolated pulmonary arteries and veins. Br J Pharmacol 121, 441–450. [DOI] [PMC free article] [PubMed] [Google Scholar]
- Konduri GG, Bakhutashvili I, Frenn R, Chandrasekhar I, Jacobs ER & Khanna AK (2004). P2Y purine receptor responses and expression in the pulmonary circulation of juvenile rabbits. Am J Physiol Heart Circ Physiol 287, H157–H164. [DOI] [PubMed] [Google Scholar]
- Konduri GG, Gervasio CT & Theodorou AA (1993). Role of adenosine triphosphate and adenosine in oxygen‐induced pulmonary vasodilation in fetal lambs. Pediatr Res 33, 533–539. [DOI] [PubMed] [Google Scholar]
- Konduri GG & Mital S (2000). Adenosine and ATP cause nitric oxide‐dependent pulmonary vasodilation in fetal lambs. Biol Neonate 78, 220–229. [DOI] [PubMed] [Google Scholar]
- Konduri GG, Mital S, Gervasio CT, Rotta AT & Forman K (1997). Purine nucleotides contribute to pulmonary vasodilation caused by birth‐related stimuli in the ovine fetus. Am J Physiol Heart Circ Physiol 272, H2377–H2384. [DOI] [PubMed] [Google Scholar]
- Konduri GG, Theodorou AA, Mukhopadhyay A & Deshmukh DR (1992). Adenosine triphosphate and adenosine increase the pulmonary blood flow to postnatal levels in fetal lambs. Pediatr Res 31, 451–457. [DOI] [PubMed] [Google Scholar]
- Kuang SJ, Qian JS, Yang H, Rao F, Chen XY, Zhang MZ, Shan ZX, Lin QX, Xue YM, Wu SL, Jiang L, Chen CB & Deng CY (2017). The enhancement of TXA2 receptors‐mediated contractile response in intrarenal artery dysfunction in type 2 diabetic mice. Eur J Pharmacol 805, 93–100. [DOI] [PubMed] [Google Scholar]
- Kummer W ( 2011). Pulmonary vascular innervation and its role in responses to hypoxia: size matters! Proc Am Thorac Soc 8, 471–476. [DOI] [PubMed] [Google Scholar]
- Lazarowski ER, Boucher RC & Harden TK (2003). Mechanisms of release of nucleotides and integration of their action as P2X‐ and P2Y‐receptor activating molecules. Mol Pharmacol 64, 785–795. [DOI] [PubMed] [Google Scholar]
- Lommatzsch M, Cicko S, Muller T, Lucattelli M, Bratke K, Stoll P, Grimm M, Durk T, Zissel G, Ferrari D, Di Virgilio F, Sorichter S, Lungarella G, Virchow JC & Idzko M (2010). Extracellular adenosine triphosphate and chronic obstructive pulmonary disease. Am J Respir Crit Care Med 181, 928–934. [DOI] [PubMed] [Google Scholar]
- Mauban JR, Lamont C, Balke CW & Wier WG (2001). Adrenergic stimulation of rat resistance arteries affects Ca(2+) sparks, Ca(2+) waves, and Ca(2+) oscillations. Am J Physiol Heart Circ Physiol 280, H2399–H2405. [DOI] [PubMed] [Google Scholar]
- Mentzer RM, Jr. , Rubio R & Berne RM (1975). Release of adenosine by hypoxic canine lung tissue and its possible role in pulmonary circulation. Am J Physiol 229, 1625–1631. [DOI] [PubMed] [Google Scholar]
- Michelakis ED, Weir EK, Wu X, Nsair A, Waite R, Hashimoto K, Puttagunta L, Knaus HG & Archer SL (2001). Potassium channels regulate tone in rat pulmonary veins. Am J Physiol Lung Cell Mol Physiol 280, L1138–L1147. [DOI] [PubMed] [Google Scholar]
- Miriel VA, Mauban JR, Blaustein MP & Wier WG (1999). Local and cellular Ca2+ transients in smooth muscle of pressurized rat resistance arteries during myogenic and agonist stimulation. J Physiol 518, 815–824. [DOI] [PMC free article] [PubMed] [Google Scholar]
- Muller T, Fay S, Vieira RP, Karmouty‐Quintana H, Cicko S, Ayata K, Zissel G, Goldmann T, Lungarella G, Ferrari D, Di Virgilio F, Robaye B, Boeynaems JM, Blackburn MR & Idzko M (2017). The purinergic receptor subtype P2Y2 mediates chemotaxis of neutrophils and fibroblasts in fibrotic lung disease. Oncotarget 8, 35962–35972. [DOI] [PMC free article] [PubMed] [Google Scholar]
- Neely CF, Kadowitz PJ, Lippton H, Neiman M & Hyman AL (1989). Adenosine does not mediate the pulmonary vasodilator response of adenosine 5'‐triphosphate in the feline pulmonary vascular bed. J Pharmacol Exp Ther 250, 170–176. [PubMed] [Google Scholar]
- Nussbacher A, Arie S, Kalil R, Horta P, Feldman MD, Bellotti G, Pileggi F, Ellis M, Johnson WH, Camarano GB & Kass DA (1995). Mechanism of adenosine‐induced elevation of pulmonary capillary wedge pressure in humans. Circulation 92, 371–379. [DOI] [PubMed] [Google Scholar]
- Perez‐Zoghbi JF, Bai Y & Sanderson MJ (2010). Nitric oxide induces airway smooth muscle cell relaxation by decreasing the frequency of agonist‐induced Ca2+ oscillations. J Gen Physiol 135, 247–259. [DOI] [PMC free article] [PubMed] [Google Scholar]
- Perez‐Zoghbi JF & Sanderson MJ (2007). Endothelin‐induced contraction of bronchiole and pulmonary arteriole smooth muscle cells is regulated by intracellular Ca2+ oscillations and Ca2+ sensitization. Am J Physiol Lung Cell Mol Physiol 293, L1000–L1011. [DOI] [PubMed] [Google Scholar]
- Perez JF & Sanderson MJ (2005a). The contraction of smooth muscle cells of intrapulmonary arterioles is determined by the frequency of Ca2+ oscillations induced by 5‐HT and KCl. J Gen Physiol 125, 555–567. [DOI] [PMC free article] [PubMed] [Google Scholar]
- Perez JF & Sanderson MJ (2005b). The frequency of calcium oscillations induced by 5‐HT, ACH, and KCl determine the contraction of smooth muscle cells of intrapulmonary bronchioles. J Gen Physiol 125, 535–553. [DOI] [PMC free article] [PubMed] [Google Scholar]
- Persson BP, Boels PJ, Lovdahl C, Rossi P, Arner A & Oldner A (2011). Endotoxin induces differentiated contractile responses in porcine pulmonary arteries and veins. J Vasc Res 48, 206–218. [DOI] [PubMed] [Google Scholar]
- Rafehi M, Burbiel JC, Attah IY, Abdelrahman A & Muller CE (2017). Synthesis, characterization, and in vitro evaluation of the selective P2Y2 receptor antagonist AR‐C118925. Purinergic Signal 13, 89–103. [DOI] [PMC free article] [PubMed] [Google Scholar]
- Ralevic V & Burnstock G (1998). Receptors for purines and pyrimidines. Pharmacol Rev 50, 413–492. [PubMed] [Google Scholar]
- Reeves JT, Jokl P, Merida J & Leathers JE (1967). Pulmonary vascular obstruction following administration of high‐energy nucleotides. J Appl Physiol 22, 475–479. [DOI] [PubMed] [Google Scholar]
- Ressmeyer AR, Bai Y, Delmotte P, Uy KF, Thistlethwaite P, Fraire A, Sato O, Ikebe M & Sanderson MJ (2010). Human airway contraction and formoterol‐induced relaxation is determined by Ca2+ oscillations and Ca2+ sensitivity. Am J Respir Cell Mol Biol 43, 179–191. [DOI] [PMC free article] [PubMed] [Google Scholar]
- Rich PB, Douillet CD, Mahler SA, Husain SA & Boucher RC (2003). Adenosine triphosphate is released during injurious mechanical ventilation and contributes to lung edema. J Trauma 55, 290–297. [DOI] [PubMed] [Google Scholar]
- Rieg AD, Rossaint R, Uhlig S & Martin C (2011). Cardiovascular agents affect the tone of pulmonary arteries and veins in precision‐cut lung slices. PLoS ONE 6, e29698. [DOI] [PMC free article] [PubMed] [Google Scholar]
- Rietdorf K, Bootman MD & Sanderson MJ (2014). Spontaneous, pro‐arrhythmic calcium signals disrupt electrical pacing in mouse pulmonary vein sleeve cells. PLoS ONE 9, e88649. [DOI] [PMC free article] [PubMed] [Google Scholar]
- Rietdorf K, Masoud S, McDonald F, Sanderson MJ & Bootman MD (2015). Pulmonary vein sleeve cell excitation‐contraction‐coupling becomes dysynchronized by spontaneous calcium transients. Biochem Soc Trans 43, 410–416. [DOI] [PubMed] [Google Scholar]
- Rubino A & Burnstock G (1996). Evidence for a P2‐purinoceptor mediating vasoconstriction by UTP, ATP and related nucleotides in the isolated pulmonary vascular bed of the rat. Br J Pharmacol 118, 1415–1420. [DOI] [PMC free article] [PubMed] [Google Scholar]
- Rudolph AM, Kurland MD, Auld PA & Paul MH (1959). Effects of vasodilator drugs on normal and serotonin‐constricted pulmonary vessels of the dog. Am J Physiol 197, 617–623. [DOI] [PubMed] [Google Scholar]
- Sanderson MJ & Parker I (2003). Video‐rate confocal microscopy. Methods Enzymol 360, 447–481. [DOI] [PubMed] [Google Scholar]
- Sieck GC, Kannan MS & Prakash YS (1997). Heterogeneity in dynamic regulation of intracellular calcium in airway smooth muscle cells. Can J Physiol Pharmacol 75, 878–888. [PubMed] [Google Scholar]
- Townsley MI (2012). Structure and composition of pulmonary arteries, capillaries, and veins. Compr Physiol 2, 675–709. [DOI] [PMC free article] [PubMed] [Google Scholar]
- Tuder RM, Marecki JC, Richter A, Fijalkowska I & Flores S (2007). Pathology of pulmonary hypertension. Clin Chest Med 28, 23–42, vii. [DOI] [PMC free article] [PubMed] [Google Scholar]
Associated Data
This section collects any data citations, data availability statements, or supplementary materials included in this article.
Supplementary Materials
Disclaimer: Supporting information has been peer‐reviewed but not copyedited.
Video S1: SPV contraction induced by vasoconstrictors.
Video S2: ATP‐induced Ca2+ oscillations in SPV VSMCs.