Abstract
A new method for SNP analysis based on the detection of pyrophosphate (PPi) is demonstrated, which is capable of detecting small allele frequency differences between two DNA pools for genetic association studies other than SNP typing. The method is based on specific primer extension reactions coupled with PPi detection. As the specificity of the primer-directed extension is not enough for quantitative SNP analysis, artificial mismatched bases are introduced into the 3′-terminal regions of the specific primers as a way of improving the switching characteristics of the primer extension reactions. The best position in the primer for such artificial mismatched bases is the third position from the primer 3′-terminus. Contamination with endogenous PPi, which produces a large background signal level in SNP analysis, was removed using PPase to degrade the PPi during the sample preparation process. It is possible to accurately and quantitatively analyze SNPs using a set of primers that correspond to the wild-type and mutant DNA segments. The termini of these primers are at the mutation positions. Various types of SNPs were successfully analyzed. It was possible to very accurately determine SNPs with frequencies as low 0.02. It is very reproducible and the allele frequency difference can be determined. It is accurate enough to detect meaningful genetic differences among pooled DNA samples. The method is sensitive enough to detect 14 amol ssM13 DNA. The proposed method seems very promising in terms of realizing a cost-effective, large-scale human genetic testing system.
INTRODUCTION
Single nucleotide polymorphisms (SNPs) are the most frequent form of sequence variation among individuals and may be responsible for a number of heritable diseases. As approximately one nucleotide in every 1000 bases is estimated to differ between any two copies in the human chromosome, more than 3 000 000 SNPs may be present in the whole human genome (1). Some of these may be the causative factors of serious diseases. It is necessary to analyze a tremendous number of individual DNA samples at various loci to clarify the relationships between SNPs and diseases. Consequently, an extremely efficient technology for screening large numbers of SNPs in samples from many patients and with high throughput, relative ease, low cost and high accuracy will be required for both basic research and routine diagnostic testing. Many methods have been developed as attempts to achieve these goals, including electrophoresis (2,3), the amplification refractory mutation system (ARMS) (4), Invader (5,6), 5′-nuclease TaqMan (7,8), dynamic allele-specific hybridization (DASH) (9), molecular beacon probes (10), mass spectrometry (11,12), pyrosequencing (13–15), DNA chips (16,17), electric field-controlled nucleic acid hybridization (18,19), electrocatalysis (20) and bead technology (21,22). Each method has its advantages and disadvantages, and these have been covered in several reviews (23–26). Most of these methods are for typing one SNP or multiple SNPs for one individual at a time. To associate SNPs with diseases, we have to analyze multiple SNPs for large numbers of patient samples and control samples. This will be a time-consuming and laborious task. An alternative method is to quantitatively investigate pooled DNA samples (17,27).
When the frequency of a given allele within the population is very low, such as ≤1%, this will represent a rare case and should be considered individually. Here targets should be those that appear more frequently. An allele that appears with a frequency of <5% is likely, in most circumstances, to be of very minor importance in its effect on a population. Therefore, polymorphisms that occur with a frequency of at least 5% in normal individuals are usually considered for further analysis when searching for SNPs in genes that might have meaningful associations with diseases (28). To determine this small frequency value in DNA pools with a high degree of accuracy, an approach with a high specificity and reproducibility is necessary.
We propose a method which provides the required accuracy in determining allele frequencies. The method uses specific primer extension reactions coupled with detection of inorganic pyrophosphate (PPi) by a bioluminometric method in which luciferin and luciferase are employed. The primer extension produces a long strand of complementary DNA as well as a lot of PPi which can be easily detected by bioluminometric methods. The key points in the technology are how to improve the specificity of primer extension (switching of extension reactions according to allele species) and to reduce background signals caused by contaminant PPi in the reagents and by thermal decomposition of dNTPs at high extension temperatures. A specific primer extension can be controlled by a match or mismatch at the 3′-terminus of the primer which is hybridized to the target. This technique is frequently used to distinguish a variant from the wild-type. Switching of the primer extension reaction by nucleotide variations must be accurately controlled for SNP typing. The switching characteristics are improved by repeated extension reactions (ARMS; 4) or by modifying the primer sequences. We have successfully used DNA primers that contain mismatched bases near their 3′-termini to reduce false positive signals in selective primer extension reactions (29). In the work presented here we use this technology to increase the switching characteristics of primer extension. Bioluminescence assay, which is based on detecting the PPi released during incorporation of dNTP into the template, has been used successfully in pyrosequencing (13) as well as in a form of antibody assay in which a dendritic DNA is used as the label (30). However, endogenous contaminant PPi in reagents must be removed to obtain high sensitivity.
After artificially introducing a mismatched base into the 3′-terminal region of the primer and optimizing the conditions of reaction for PPi assay, the method becomes applicable to highly accurate determination of allele frequency. Here we report on the characteristics of the method and the experimental conditions for determination of allele frequency.
PRINCIPLE
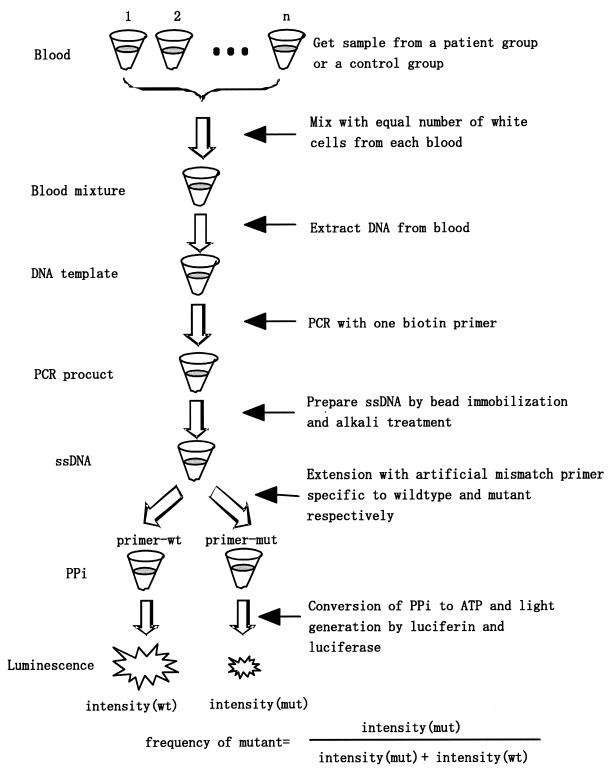
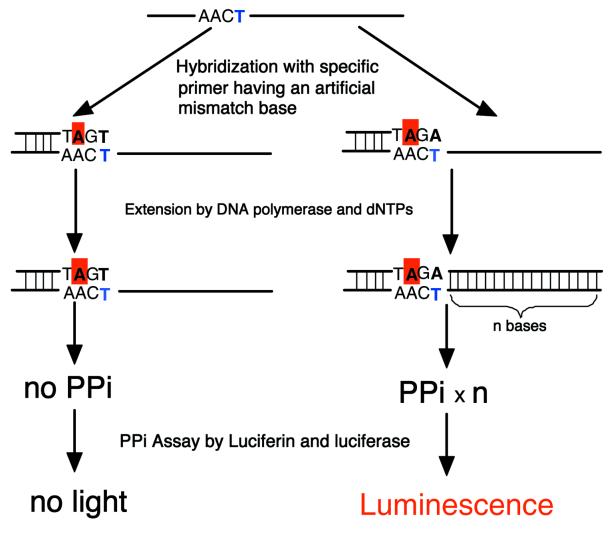
The principle of allele frequency determination is shown in Figure 1, where two specific primers are used to discriminate wild-type and mutant DNA. In the first step, genomic DNA gathered from multiple patients (or from control subjects) is equally mixed prior to preparation of the DNA samples. The mixed DNA is then amplified by PCR followed by single-strand DNA separation, for which a bead technology is used. Finally, the sample is divided into two equal aliquots and one of the two primers is then added. After a primer-directed polymerase extension with all four deoxynucleotides, PPi is produced if the 3′-terminus of the specific primer is complementary to the base in the template. The released PPi can be converted to ATP with adenosine 5′-phosphosulfate (APS) and ATP sulfurylase. A luciferin and luciferase assay can then be used to detect the ATP. When there is a mismatch in the primer–template duplex at the 3′-terminus of the primer, either no PPi or a very small amount of PPi is released. The match or mismatch at the 3′-terminus of the primer–DNA duplex thus acts as a switch in DNA strand extension. The signal intensities obtained from the two aliquots can be used to determine the frequency of the alleles. However, the switching characteristics of the primer for starting the extension reaction are not perfect; mismatched primer extension frequently occurs. Such reactions make it difficult to correctly determine frequencies of alleles. To minimize the occurrence of false positive signals, a mismatched nucleotide is artificially introduced into the 3′-terminal region of each specific primer employed in the strand extension, as shown in Figure 2. In order to prevent mismatch extension, the artificial mismatched nucleotide in the primer is designed so that it is the same as the nucleotide at the corresponding position of the template. Since a single potential mutation site exists on both strands, the accuracy of the allele frequency at a site can be improved by analyzing the two complementary strands. As strand extension proceeds by several hundreds steps at a time, the amount of PPi produced is more than two orders of magnitude greater than that produced in pyrosequencing. A small amount of DNA can thus be used for the analysis of SNPs.
Figure 1.
The principles of allele frequency assay using PPi detection coupled with strand extension of two primers specific to the allele. Only matched primers can be extended to produce PPi. The PPi is then used to emit bioluminescence.
Figure 2.
A mismatch base artificially introduced into primers at the third position from the 3′-terminus improved the switching characteristics of primer extension reactions. To detect the mutant or wild-type DNAs, two extension reactions are carried out and the emissions were compared to determine the heterozygosity or allele frequency.
This approach is called bioluminometric assay using a modified primer extension reaction (BAMPER).
MATERIALS AND METHODS
Chemicals
Platinum Taq DNA polymerase was purchased from Gibco BRL Life Technologies (Grand Island, NY). Polyvinylpyrrolidone (PVP), dNTPs and QuantiLum recombinant luciferase (95%) were purchased from Promega (Madison, WI). Sodium pyrophosphate decahydrate (PPi), ATP sulfurylase, apyrase VI, bovine serum albumin (BSA), d-luciferin, inorganic pyrophosphatase (PPase) and APS were purchased from Sigma (St Louis, MO). Dynabeads M-280 Streptavidin (2.8 µm i.d.) was from Dynal (Oslo, Norway). All solutions were prepared in deionized and sterilized water. Sodium 2′-deoxyadenosine 5′-O-(1-triphosphate) (dATPαS) was from Amersham Pharmacia Biotech. Other chemicals were commercially available extra-pure grade.
Degradation of endogenous PPi contamination in reagents
Before PPi detection, a reduction in endogenous PPi in reagents was necessary in BAMPER because apyrase, which is used to degrade dNTPs and ATP in pyrosequencing, was not included in the reaction mixture for BAMPER. Reagents such as dNTPs and ATP sulfurylase generally contain a lot of endogenous PPi. To obtain high sensitivity, PPase was used to degrade endogenous PPi before the nucleotide incorporation reaction. To remove PPi in dNTPs, 50 µl of 10 mM dNTPs containing 25 mM magnesium acetate tetrahydrate and 5 mM Tris–acetate, pH 7.7, was incubated with 0.4 U PPase for 30 min at room temperature. Excess PPase was removed by ultrafiltration through a centrifugal filter tube with a nominal molecular weight cut-off of 10 000 (Millipore, Japan). To remove PPi in the PPi detection mixture, PPase was directly added to the solution before adding APS and the solution was incubated for 30 min at room temperature.
Primer and target sequences
All the oligonucleotides were synthesized and purified by Amersham Pharmacia Biotech (Hokkaido, Japan). A partial sequence of the P53 gene (exon 8) was synthesized and used as a model target, called P53-A. The sequence was 5′-CTTTCTTGCGGAGATTCTCTTCCTCTGTGCGCCGGTCTCTCCCAGGACAGGCACAAACACGCACCTCAAAGCTGTTCCGTCCCAGTAGATTACCA-3′. To investigate the primer extension characteristics, we prepared four target DNAs which were denoted P53-C, P53-T, P53-G and P53-A. Their sequences were identical except for the base species at the polymorphic site position 55 (underlined). As P53-T is the mutant of P53-A, they are termed P53Mut and P53Wt, respectively, here. The primers specific to each template described above were 5′-AACAGCTTTGAGGTGCGTGTTN-3′ (N = A, C, T or G). To prevent mismatch primer extension, an artificial mismatched base was introduced into the terminal region of each primer. To optimize the position of the artificially mismatched base in each primer, primer extension reactions were carried out with various primers having an artificial mismatched base in a different position from the 3′-terminus, whose sequences were the same as the primers described above except for the artificial mismatched base. For determining the allele frequency of a site, the complementary strand of P53Wt was also analyzed; the specific primer for this strand was 5′-GGTCTCTCCCAGGACAGGCTCN-3′ (N = T or A). M13 mp18 single-strand DNA (0.2 µg/µl), purchased from Takara (Shiga, Japan), was used as the template DNA to evaluate the sensitivity. The extension primer for M13 was 5′-TGTAAAACGACGGCGAG-3′.
Real sample preparation by PCR
Genome DNA was extracted from blood (supplied by volunteers in our laboratory) using DNAzol reagent (Gibco BRL, Life Technologies). DNA fragments used for SNP detection were amplified from the genomic DNA by PCR with a PTC-225 thermocycler system (MJ Research, MA) according to the following procedure: denaturation at 94°C for 2 min, followed by 35 cycles of 94°C for 30 s, 57°C for 60 s and 72°C for 1 min, with a final incubation at 72°C for 5 min. The primers for amplifying the P53 exon 8 fragment were 5′-biotin-gtcctgcttgcttacctcgcttagt-3′ and 5′-acctgatttccttactgcctcttgc-3′. The PCR products were purified using a QIAquick PCR purification kit (Qiagen, Hilden, Germany). After purification and quantification, the single-strand DNA was trapped on streptavidin-coated magnetic Dynabeads M280 and then recovered using 0.1 M NaOH.
Allele-specific extension reactions
A thermostable DNA polymerase without exonuclease activity was used for the allele-specific extension reaction. The reaction mixtures contained 50 mM KCl, 20 mM Tris–HCl pH 8.4, 1.5 mM MgCl2, 50 µM dNTPs, 50 nM SNP primers, 0.05 U/µl Platinum Taq DNA polymerase and synthetic oligonucleotides or PCR products. Each reaction mixture of 10 µl was incubated at 95°C for 30 s, 57°C for 30 s and 72°C for 1 min in a PTC-225 thermocycler (MJ Research). Finally the product was kept on ice before the PPi assay.
PPi detection
The detection of PPi produced in the DNA polymerase reaction was carried out by a method similar to that reported by Ronaghi et al. except for the use of apyrase (13). The reaction volume was 75 µl, containing 0.1 M Tris–acetate pH 7.7, 2 mM EDTA, 10 mM magnesium acetate, 0.1% BSA, 1 mM dithiothreitol, 2 µM APS, 0.4 mg/ml PVP, 0.4 mM d-luciferin, 200 mU/ml ATP sulfurylase and 3 µg/ml luciferase. As described above, endogenous PPi was removed by incubating the mixture with PPase for 30 min before adding APS.
Experimental apparatus
The intensity of bioluminescence was measured using a luminometer made in our laboratory consisting of a side-on photomultiplier tube (R6355; Hamamatsu Photonics, Shizuoka-ken, Japan), an amplifier (AMP; NF Corp., Yokohama, Japan), a power supply (Matsusada Precision, Japan) and a Hitachi D-2500 recorder (Hitachi, Tokyo, Japan). The data was acquired with LABVIEW software (National Instruments, Austin, TX).
RESULTS AND DISCUSSION
Modification of primers and their switching characteristics
To improve the switching characteristics of specific primers, a single base of each primer was modified to create an artificial mismatch in the primer–DNA duplex in the 3′-terminal region of the primer. This modification of the primers improved the switching characteristics of primer extension according to the match or mismatch at the 3′-terminus. The switching characteristics in terms of primer extension reactions were evaluated with a template DNA containing a partial sequence of the human P53 gene (exon 8). The base type at the polymorphic site is A for wild-type DNA and T for mutant DNA. These are referred to as P53Wt and P53Mut, respectively. Four groups of primers were prepared. Each group contained four primers with the four possible terminal bases. Their 3′-termini are at the nucleotide position where a mutation can be observed. The first group had no modification in the terminal region. The other three groups contained a modification to cause an artificial mismatch in the primer–DNA duplexes at the second, third and fourth nucleotide positions from the 3′-termini of the primers, respectively.
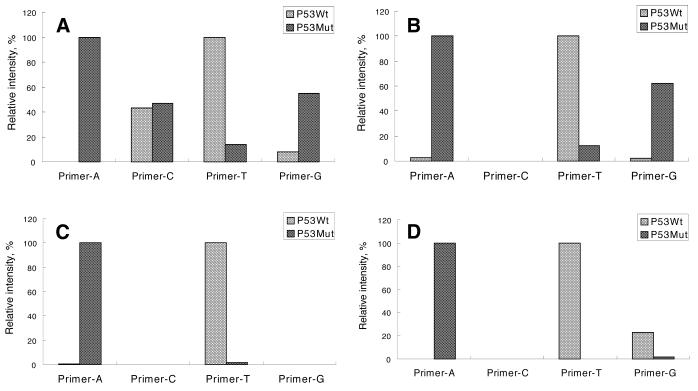
Whether or not mismatch primer extension occurs depends on the DNA polymerase as well as on the annealing temperature used in the extension step. In general, higher temperatures are preferred, as they prevent mismatch primer extension. However, mismatch extension frequently occurs even at a high temperature such as 55°C. The artificial mismatch which we introduced at the third position from the 3′-terminus of the primer prevents mismatch primer extension. As shown in Figure 3, mismatch primer extension, which otherwise produced a signal as strong as several tenths of the matched signal, was decreased to a few percent of the matched signal by the artificial introduction of a mismatched base into the third position from the 3′-terminus of the primer. Only the matched primers produced large signals resulting from strand extension. The primer extension reactions can thus be controlled by the match or mismatch, at the 3′-terminus of the primer, with the template DNA. This switching characteristic in strand extension reactions is very accurate and is reliable enough to distinguish between wild-type and mutant DNAs. The ratios of mismatch extension products to match extension products were 0.66% for primer A, which matched with P53Mut, and 1.4% for primer T, which matched with P53Wt, as shown in Figure 3C. This technique is thus successful as an accurate way of determining the frequencies of alleles.
Figure 3.
Comparison of primer extensions for wild-type and mutant targets. In (A) there is no artificial mismatch base in the primer; while in (B)–(D) an artificial mismatch base has been placed at the second, third and fourth positions from the 3′-terminus of the primer, respectively. The sequences of primers A, C, T and G were the same except for the base at the 3′-terminus. The concentrations of template, primers and each dNTP were 25 nM, 50 nM and 50 µM, respectively. The injection volume of the sample was 1 µl, which includes 25 fmol template. The intensities shown were normalized so that the maximum value in each figure is 100.
The data in Table 1 show that this sharp switching characteristic is not dependent on the mutated base of the target. To confirm the switching characteristics of primers in DNA strand extension reactions, the results for all four possible bases at the polymorphic site were investigated using synthesized P53 gene fragments. We refer to these as P53-A, P53-C, P53-T and P53-G, respectively, according to the base in the allele. It was possible to perfectly control all primer extension reactions by the terminal base match or mismatch, as long as specific primers with an artificial mismatched base at the third position from the 3′-terminus were used. The results are listed in Table 1. As a small amount of strand extension from mismatched primers occurred, a calibration curve should be used to obtain an exact allele frequency. More recently it has been reported that extension from a mismatched primer can be minimized by adding single-stranded DNA-binding protein (SSB) to the extension solution (31).
Table 1. Relative abundances of extension products by match or mismatch at the 3′-termini of primers.
| Template |
|
Primer A |
Primer C |
Primer T |
Primer G |
| P53-A | Modified primer | 0.7 ± 0.3 | 0.0 ± 0.2 | 100.0 ± 0.0 | 0.0 ± 0.1 |
| Unmodified primer | 0.0 ± 0.1 | 43.5 ± 0.2 | 100.0 ± 0.0 | 7.9 ± 0.5 | |
| P53-C | Modified primer | 0.2 ± 0.1 | 0.4 ± 0.2 | 3.5 ± 0.3 | 100.0 ± 0.0 |
| Unmodified primer | 28.5 ± 0.4 | 1.0 ± 0.5 | 28.0 ± 0.2 | 100.0 ± 0.0 | |
| P53-T | Modified primer | 100.0 ± 0.0 | 0.2 ± 0.1 | 1.4 ± 0.2 | 0.0 ± 0.3 |
| Unmodified primer | 100.0 ± 0.0 | 47.2 ± 0.3 | 13.9 ± 0.4 | 54.8 ± 0.3 | |
| P53-G | Modified primer | 0.0 ± 0.2 | 100.0 ± 0.0 | 4.4 ± 0.3 | 2.8 ± 0.3 |
| Unmodified primer | 0.3 ± 0.2 | 100.0 ± 0.0 | 41.3 ± 0.5 | 2.5 ± 0.1 |
The switching by modified primers was almost perfect while undesirable strand extension reactions occurred with unmodified primers. The test samples were synthetic human P53 fragments each containing a different base, A, C, T or G, at the polymorphic site, with the four variants named P53-A, P53-C, P53-T and P53-G (n = 2), respectively. Modified means that a mismatched base was artificially introduced into the primer at the third position from the 3′-terminus; unmodified means that the primer did not include such a base. The data was normalized to the maximum intensity in a set of four experiments (primers A, C, T and G) as 100.
Factors determining levels of background signals and the sensitivity of detection
If, in the present experiment, it were possible to use an ATP-degrading enzyme such as apyrase (as used in pyrosequencing), any endogenous PPi would be effectively degraded in the presence of APS and ATP sulfurylase, which would make highly sensitive detection of newly produced PPi possible. Unfortunately, this approach is not applicable to the present system because having the degradation of PPi proceeding in competition with the PPi assay reaction would affect quantitative SNP determination. However, a reduction in the amount of endogenous PPi remains very important in the realization of accurate allele frequency measurements. There are several possible sources of background signals. The reagents include a lot of PPi as a contaminant. Exogenous PPi is also produced by the thermal decomposition of dNTPs during the extension reactions. Furthermore, the APS used to convert PPi to ATP, and dATP, is a substrate of the luciferin–luciferase reaction. These background signals are produced through the following reactions.
APS + ATP sulfurylase luciferin + luciferase
PPi (reagent contaminant) ――――→ ATP ――――→ hv
luciferin + luciferase
APS ――――→ hv
Δ APS + ATP sulfurylase luciferin + luciferase
dNTP → dNMP + PPi ――――→ ATP ――――→ hv
luciferin + luciferase
dATP ――――→ hv
In pyrosequencing with a commercial pyrosequencer, ∼1 pmol of sample is required. The present experiment consumed only 10 fmol, which is two orders of magnitude smaller than the quantity required for the current pyrosequencing method. When 10 fmol of template DNA was used to produce 55 base complementary strands, a signal intensity of ∼100 mV was obtained in the present detection system. Background signals could be made very much smaller than this value by taking the following steps.
To analyze the components which affect bioluminometric measurement, various reagents were added to the bioluminometric detection system in a step-by-step fashion. The base solution contained luciferin, luciferase, template DNAs and polymerase. Even without adding other reagents such as ATP sulfurylase, the solution emitted a photo signal of 1.5 mV, which indicated that the reagents contained small amounts of endogenous ATP. By adding APS and ATP sulfurylase to the above solution, the background signal produced by endogenous PPi was evaluated as 146 mV, which included the contribution from the APS. As well as the contaminants in these reagents, solutions of dNTPs were found to contain a lot of endogenous PPi. As APS is an analog of ATP, it also reacts directly with luciferin to emit a photon, as has been reported previously (32). Although dATP was a strong background source by reacting directly with luciferin to emit a photon, this was overcome by using dATPαS instead of dATP in BAMPER, a step that has previously been reported in work on pyrosequencing (13,33).
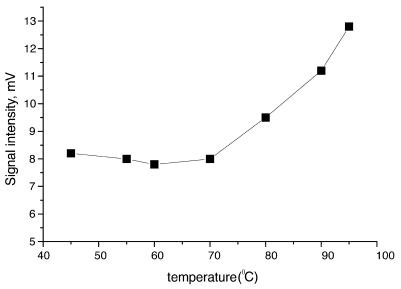
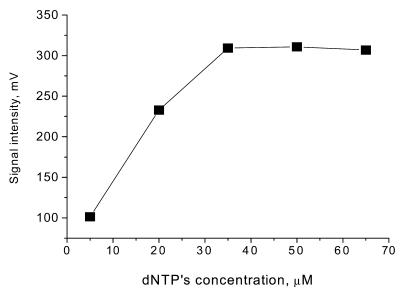
In general, DNAs produced by a PCR process include a lot of PPi as well as unreacted dATP. This leads to a large background signal in a subsequent luminometric assay. PPi is produced by PCR and the thermal decomposition of dNTPs in the process of producing template DNA. This PPi and the dNTPs were removed by taking the following steps. The template DNA was initially purified using a QIAquick PCR purification kit. Single-stranded DNA was then prepared by a bead technology. Both endogenous PPi and residual dATP in PCR products were efficiently removed by the purification and bead washing procedures. As commercially available dNTP solutions contain large amounts of endogenous PPi, this PPi should be degraded using PPase, as described in Materials and Methods. Exogenous PPi is also produced by thermal decomposition of dNTPs. As such thermal decomposition will occur in the BAMPER process, we investigated this problem by heating a dNTP mixture to different temperatures for 2 min as shown in Figure 4. Little decomposition of the dNTPs was seen below 70°C, but this decomposition increased at higher temperatures. The use of a thermostable DNA polymerase requires a hot start where the reaction mixture is heated to 95°C. As decomposition of dNTPs is unavoidable in this case, reductions in the reaction time at high temperature and in the amounts of dNTPs present were both necessary as ways of reducing the amount of dNTP decomposition products and thus the levels of background signals. Therefore, a short reaction time of 30 s at 95°C and a reduced amount of dNTPs were used. To optimize this reduced amount of dNTPs, an experiment was carried out to determine the relationship between the amount of dNTPs and the bioluminescence signal intensity produced by DNA extension reactions with 50 nM P53Wt, as shown in Figure 5. This indicated that the amount of PPi produced with 50 nM template DNA was unchanged with a dNTP concentration >35 µM. So 50 µM of each of the dNTPs was a suitable concentration in this case. Since the amount of dNTPs was dependent on the amount of template used and the extension base length, we were able to adjust the amount of template on the basis of its extension base length. A concentration of 10–50 nM template P53Wt with an extension base length of 54 was appropriate for routine analysis, so 50 µM each dNTP with 50 nM template, P53Wt, was enough in most cases. This was about one-quarter of the amount of dNTPs used in the normal PCR protocol. The blank signal was decreased from 95 to 10 mV by this optimization. The background of the solution for detecting PPi was reduced to 6.5 mV by using PPase to degrade the PPi. This value was small enough to allow the detection of 10 fmol target DNA.
Figure 4.
Signal intensity change from decomposition of dNTPs for 2 min at various temperatures. The concentration of each dNTP was 20 nM.
Figure 5.
Signal intensity of 50 nM template at different concentrations of dNTPs. In the extension step the concentrations of template (P53Wt) and of primer were 50 and 100 nM, respectively. One microliter was injected for the determination. The concentration of each dNTP was the same.
In BAMPER the addition of PPase to the reaction solution as an agent for degrading endogenous PPi is very important for reducing the background level. To prevent PPase degrading the PPi produced by the extension reaction, only a small amount of PPase was added. The amount of PPase was so small that the reaction solution had to be incubated for ∼30 min to remove all of the endogenous PPi before adding APS to the solution. In this case it is not necessary to worry about the side-effects of PPase on PPi detection, because the PPi produced by the polymerase reaction was instantly and completely converted into ATP by ATP sulfurylase and APS before its degradation by the PPase present in the reaction mixture. This addition of PPase had no effect on the signal intensity produced by ATP, but significantly reduced the background level that arises from contaminant PPi in the reagents.
The background level produced by APS was linearly proportional to its concentration. Therefore, a small concentration of APS was preferable in terms of decreasing the level of the background signal. When a sufficient amount of luciferin was present in the reaction mixture, the signal intensity stayed constant at APS concentrations >1.5 µM. In the present experiment 2 µM APS was used in the SNP assay, and this produced a background signal level of 2.5 mV. With a fixed amount of APS, this background signal was stable during detection and it was thus easy to subtract it from the observed signals to obtain a reliable signal from the extension reaction.
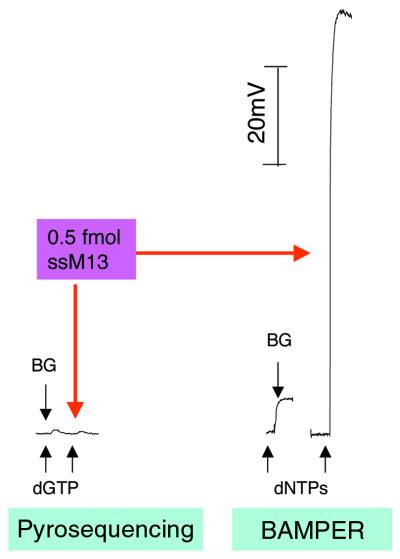
The reduction in the amount of residual PPi and optimization of the reaction conditions allowed us to obtain a high degree of sensitivity of detection. For extension of a 54 base strand, the lower detection limit was 0.27 ± 0.02 fmol and the quantitative limit was 0.83 ± 0.05 fmol. This indicated that 10 fmol of a short strand of DNA, such as 200 bases, would be enough for routine SNP analysis. When a long DNA was used as template, the sensitivity of detection was improved. For example, for ssM13, with an extension length of 6289 bp, the lower detection limit was 14 amol. This is the most important advantage of BAMPER. It is impossible to detect 0.5 fmol ssM13 by pyrosequencing, while the signal produced with the same amount of ssM13 template in BAMPER was very strong. This is shown in Figure 6, where the same instrument was used for both forms of measurement. Although the intensity of the signal did not increase in linear proportion to base length, it did increase quite a lot. For a long strand of DNA the extension reaction might be incomplete, which is not good for quantitative determination. However, applying primer extension to a long strand of DNA is still useful in terms of highly sensitive detection of SNPs.
Figure 6.
Comparison of signal intensities obtained with the prototype instrument in two different modes, pyrosequencing and BAMPER. The experimental conditions were the same, except that apyrase was not used in BAMPER. The sample was 0.5 fmol ssM13. BG indicates the background signal level.
A simple instrument for BAMPER
The instrument for use in BAMPER may be very simple because it does not require iterative addition of four different dNTPs. While we have made a small device coupled to a photo-multiplier for BAMPER, a commercially available bioluminometer would also be suitable. Precise control of reagent injection is not necessary in BAMPER because a one-shot injection is enough to add the detection solution. The reaction volume was 10–40 µl for SNP typing, with both the prototype BAMPER device and a commercial bioluminometer. The amount of sample required for SNP typing can be decreased by reducing the reaction volume. For example, 10 fmol PPi, which corresponds to <100 amol target DNA (when, for example, the extension length is 100 bases), was successfully detected in a 500 nl solution with a good signal-to-noise ratio by BAMPER.
SNP typing and allele frequency analysis
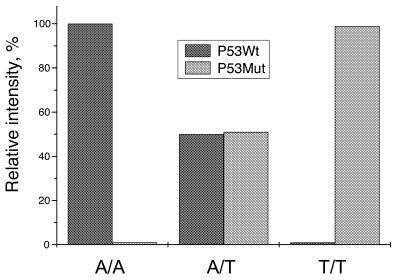
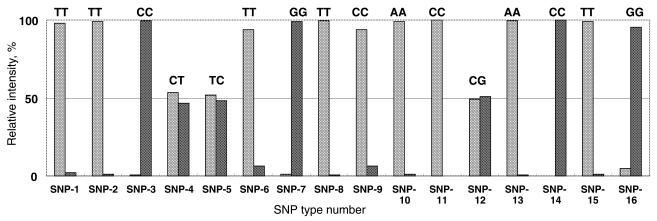
SNP typing as well as allele frequency analysis were carried out with genomic DNA from our colleagues and with synthesized DNA. Typing one SNP for a homozygous or a heterozygous sample is the simplest case of allele frequency analysis. To start with, samples containing P53Wt, P53Mut and an equimolar mixture of P53Wt and P53Mut were analyzed, and the results are shown in Figure 7. The bioluminescence intensities obtained with the two specific primers were normalized to the total intensity. The results were almost as expected, which indicates that the method is applicable to SNP typing of a small amount of sample. In order to confirm the applicability of BAMPER to various SNPs, 16 polymorphic sites in human genomic DNA extracted from blood were investigated. As shown in Figure 8, all of the SNPs were accurately typed. The results are listed in Table 2 and coincide with the sequencing results obtained by gel-based electrophoresis. Although some of the priming regions contained GC-rich sequences, these tests showed that BAMPER was effective for typing all the SNPs analyzed in this study. In some cases mismatch extension still occurred, but the relative proportion was <10% of the matched extensions, proving the usefulness of artificial introduction of a mismatched base into the primer. For example, the proportion of mismatch extensions for SNP16 was ∼40% when such an artificial mismatched base was not introduced. The reproducibility of BAMPER analysis results was very good. For SNP-13 the whole SNP typing process, including PCR, preparation of single-stranded DNA, the bead washing process and BAMPER detection, was repeated eight times in parallel and the relative standard deviation was 3.8% (n = 8).
Figure 7.
A bioluminescence assay with modified primer extension reactions for genotyping. Targets containing A (P53Wt) and T (P53Mut) at the polymorphic site were used. For homo-templates it was only possible to extend one primer. However, both primers extended for a hetero-template.
Figure 8.
Results of using BAMPER to type 16 SNPs. The intensity was normalized to the total intensity. The details of each SNP, including the corresponding gene name, mutation point and specific primers are given in Table 2.
Table 2. SNPs used for the evaluation and typing analyses.
| SNP code |
Gene name |
SNP |
Specific primer sequencea |
Typing by BAMPER |
Typing by GEb |
| SNP-1 | Angiotensin II type 1 receptor | A1166C | aattctgaaaagtagctTaT/G (30) | T/T | T/T |
| SNP-2 | Aldosterone synthase | Lys173Arg | gttctgcagcaccttctAcT/C (50) | T/T | T/T |
| SNP-3 | Paraoxonasel | Arg192Gln | caaatacatctcccaggTtT/C (40) | C/C | C/C |
| SNP-4 | Methylenetetrahydrofolate reductase | C677T | gagaaggtgtctgcgggTgC/T (65) | C/T | C/T |
| SNP-5 | Methionine synthase | D919G | cttgagagactcataatCgT/C (40) | T/C | T/C |
| SNP-6 | Cholesteryl ester transfer protein | Ile405Val | gaaacagtctttggtgtTaT/C (35) | T/T | T/T |
| SNP-7 | Peroxisome proliferator-activated receptor γ | Pro12Ala | ctgatcccaaagttggtCgC/G (55) | G/G | G/G |
| SNP-8 | Glutathione S-transferase P1 | Ile105Val | ttggtgtagatgagggaCaT/C (45) | T/T | T/T |
| SNP-9 | Angiotensinogen | G –6A | caacggcagcttcttccGcC/T (60) | C/C | C/C |
| SNP-10 | eNOS | T –786C | ggctgaggcagggtcagGcA/G (75) | A/A | A/A |
| SNP-11 | Prothrombin | G20210A | cactgggagcattgaggGtC/T (60) | C/C | C/C |
| SNP-12 | 8-Oxyguanin DNA glycosylase | Ser326Cys | agtgccgacctgcgccaTtC/G (65) | C/G | C/G |
| SNP-13 | P53 gene (exon 8) | Cys275Ser | aacagctttgaggtgcgtgAtA/T (45) | A/A | A/A |
| SNP-14 | P53 gene (exon 8) | Pro278His | aggtgcgtgtttgtgcctgAcA/C (59) | C/C | C/C |
| SNP-15 | P53 gene (exon 8) | Arg282Trp | tgtgcctgtcctgggagagTcT/C (64) | T/T | T/T |
| SNP-16 | P53 gene (exon 8) | Arg283His | gcctgtcctgggagagaccgCcA/G (74) | G/G | G/G |
aThe two capital letters at the 3′-terminus of the primer are the specific bases of the SNP type, while the third capital letter is the artificially mismatched base. The number in parentheses represents the GC content in the probe. The sequences of PCR primers are available on request.bGE is SNP typing by gel-based electrophoresis.
As it would have been difficult to obtain real samples for an allele frequency study, synthetic wild-type and mutant P53 DNAs mixed in various ratios were used. Reactions with the two primers were carried out for each sample. The allele frequencies of P53Mut (T allele) in the artificially prepared samples were 0.02, 0.05, 0.1 and 0.7. The wild-type allele was A. As shown in Table 3, the correlation between the estimated allele frequencies and those observed for the artificially prepared DNA was very high, at r2 = 0.9999. The measurements were repeated four times and the results were highly reproducible. The largest uncertainty in frequency determination was estimated to be 0.9% for a frequency <10%. This is enough to distinguish differences between the allele frequencies of two groups in terms of medical characteristics. There may be some difficulty with accuracy in applying the method to determining allele frequencies of <5%. However, those frequencies that are <5% are likely to be of very minor importance and are usually not considered for further analysis, as has been discussed by Nigel Spurr (28).
Table 3. Comparison of calculated and observed allele frequencies for synthesized pooled DNA samples (four independent measurements were carried out to estimate the error rates, n = 4).
| Known allele frequencya | 0.020 | 0.050 | 0.100 | 0.700 |
| Allele frequency observed using strand oneb | 0.021 ± 0.001 | 0.045 ± 0.008 | 0.095 ± 0.009 | 0.691 ± 0.010 |
| Allele frequency observed using strand twob | 0.017 ± 0.003 | 0.057 ± 0.004 | 0.098 ± 0.006 | 0.698 ± 0.009 |
| Average allele frequencyc | 0.019 ± 0.003 | 0.051 ± 0.008 | 0.096 ± 0.002 | 0.694 ± 0.005 |
The artificial pools were constructed by mixing different ratios of synthesized wild-type and mutant P53 DNA in one tube directly.
aFrequency = concentration of P53Mut/(concentration of P53Mut + concentration of P53Wt).
bFrequency = intensity produced by primer A complementary to P53Mut/(intensity produced by primer A + intensity produced by primer T complementary to P53Wt). Frequency was obtained by calibration with samples having known frequencies of 0, 0.30, 0.50, 0.90 and 1.0. Calibration was carried out using a regression line and the allele frequency was obtained by the regression equation. Strands one and two are complementary.
cThe average frequencies were obtained from strands one and two.
The complementary strand was also analyzed using two other specific primers to obtain a reliable frequency value. The observed allele frequencies in pooled DNA samples for both P53 strands were compared with estimated values, and are listed in Table 3. The observed allele frequencies were consistent for both strands, which indicated that the results obtained were reliable and that frequency analysis of one strand would be enough to determine the allele frequency in practical applications.
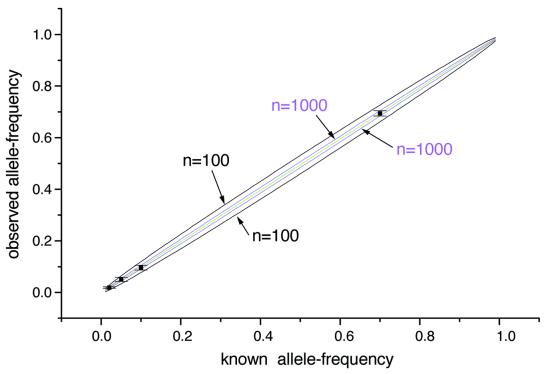
For allele frequency analysis the accuracy of pipetting operations as well as the number of samples in a pool must be carefully considered. The expected sampling error can be expressed as √[f(1 – f)/2n], where f is the allele frequency of one of the two alleles and n is the sample size (34). The calculated errors due to sampling (sampling error) at different allele frequencies for n = 100 and n = 1000 are shown as the black and purple lines in Figure 9, respectively. It was found that when the sample size is smaller than 1000, the sampling error is greater than the standard deviation of the measurement (measurement error) at each allele frequency, as shown in Figure 9. On the other hand, the measurement error, which is small and independent of the number of samples, becomes dominant in allele frequency determination for large sample sizes such as n > 1000. To obtain a reliable allele frequency, a large sample size (n) is necessary.
Figure 9.
Comparison of sampling errors (black and purple lines) and measurement errors (error bars) at different allele frequencies. Sample sizes were 100 for the black line and 1000 for the purple line, respectively. The green line was drawn by the regression equation obtained using the observed allele frequency and the known allele frequency. The error bar represents the measurement error described in Table 3.
CONCLUSION
Although the utility of specific primer extension and the high sensitivity of detection of PPi for SNP analysis had previously been pointed out, the work reported in this paper has successfully demonstrated that a combination of these two technologies provides a very powerful tool for frequency analysis of SNPs and determination of allele frequencies. The approach requires at least two primers for the analysis of one SNP and the artificial introduction of a mismatched nucleotide into the primers. This should not be too much trouble in most cases. The measurement of 48 samples using a 96-well plate (or 192 samples if a 384-well plate is used) is complete within 1 min. As detection in real time is not necessary, the primer extension reactions followed by ATP production as well as the reactions of ATP with luciferin can be carried out outside the detection system. It is also possible to simultaneously carry out all of the reactions for multiple samples in many multi-well plates to be stored for the later measurement. The bottleneck for SNP analysis now lies in the process of preparing the sample DNA. If this is overcome, a high throughput, as large as several tens of thousands to 1 000 000 samples per day, will be possible.
The use of multiple PPi production from a single primer extension improved the sensitivity of detection. With the use of dendritic DNA amplification technology, as demonstrated by Capaldi (30) and by which quite a lot of PPi is produced from a primer extension reaction, it will be possible to detect very few copies of the target DNA with the method we have demonstrated and this will significantly reduce running costs and provide a promising new DNA diagnostic application.
Acknowledgments
ACKNOWLEDGEMENTS
We are very grateful to Dr Pal Nyren of Sweden’s Royal Institute of Technology for his helpful information on the pyrosequencing technology. This work was part of a research and development project of the Industrial Science and Technology Program supported by NEDO (the New Energy and Industrial Technology Development Organization of Japan).
References
- 1.Wang D.G., Fan,J.B., Siao,C.J., Berno,A., Young,P., Sapolsky,R., Ghandour,G., Perkins,N., Winchester,E., Spencer,J. et al. (1998) Large-scale identification, mapping and genotyping of single-nucleotide polymorphisms in the human genome. Science, 280, 1077–1082. [DOI] [PubMed] [Google Scholar]
- 2.See D., Kanazin,V., Talbert,H. and Blake,T. (2000) Electrophoretic detection of single-nucleotide polymorphisms. Biotechniques, 28, 710–714, 716. [DOI] [PubMed] [Google Scholar]
- 3.Schmalzing D., Belenky,A., Novotny,M.A., Koutny,L., Salas-Solano,O., El-Difrawy,S., Adourian,A., Matsudaira,P. and Ehrlich,D. (2000) Microchip electrophoresis: a method for high-speed SNP detection. Nucleic Acids Res., 28, e43. [DOI] [PMC free article] [PubMed] [Google Scholar]
- 4.Newton C.R., Graham,A., Heptinstall,L.E., Powell,S.J., Summers,C., Kalsheker,N., Smith,J.C. and Markham,A.F. (1989) Analysis of any point mutation in DNA. The amplification refractory mutation system (ARMS). Nucleic Acids Res., 17, 2503–2516. [DOI] [PMC free article] [PubMed] [Google Scholar]
- 5.Lyamichev V., Mast,A.L., Hall,J.G., Prudent,J.R., Kaiser,M.W., Takova,T., Kwiatkowski,R.W., Sander,T.J., de Arruda,M., Arco,D.A., Neri,B.P. and Brow,M.A. (1999) Polymorphism identification and quantitative detection of genomic DNA by invasive cleavage of oligonucleotide probes. Nat. Biotechnol., 17, 292–296. [DOI] [PubMed] [Google Scholar]
- 6.Hall J.G., Eis,P.S., Law,S.M., Reynaldo,L.P., Prudent,J.R., Marshall,D.J., Allawi,H.T., Mast,A.L., Dahlberg,J.E., Kwiatkowski,R.W., de Arruda,M., Neri,B.P. and Lyamichev,V.I. (2000) Sensitive detection of DNA polymorphisms by the serial invasive signal amplification reaction. Proc. Natl Acad. Sci. USA, 97, 8272–8277. [DOI] [PMC free article] [PubMed] [Google Scholar]
- 7.Jeffreys A.J., MacLeod,A., Tamaki,K., Neil,D.L. and Monckton,D.G. (1991) Minisatellite repeat coding as a digital approach to DNA typing. Nature, 354, 204–209. [DOI] [PubMed] [Google Scholar]
- 8.Whitcombe D., Brownie,J., Gillard,H.L., McKechnie,D., Theaker,J., Newton,C.R. and Little,S. (1998) A homogeneous fluorescence assay for PCR amplicons: its application to real-time, single-tube genotyping. Clin. Chem., 44, 918–923. [PubMed] [Google Scholar]
- 9.Howell W.M., Jobs,M., Gyllensten,U. and Brookes,A.J. (1999) Dynamic allele-specific hybridization. A new method for scoring single nucleotide polymorphisms. Nat. Biotechnol., 17, 87–88. [DOI] [PubMed] [Google Scholar]
- 10.Tyagi S., Bratu,D.P. and Kramer,F.R. (1998) Multicolor molecular beacons for allele discrimination. Nat. Biotechnol., 16, 49–53. [DOI] [PubMed] [Google Scholar]
- 11.Sauer S., Lechner,D., Berlin,K., Lehrach,H., Escary,J.L., Fox,N. and Gut,I.G. (2000) A novel procedure for efficient genotyping of single nucleotide polymorphisms. Nucleic Acids Res., 28, e13. [DOI] [PMC free article] [PubMed] [Google Scholar]
- 12.Fei Z. and Smith,L.M. (2000) Analysis of single nucleotide polymorphisms by primer extension and matrix-assisted laser desorption/ionization time-of-flight mass spectrometry. Rapid Commun. Mass Spectrom., 14, 950–959. [DOI] [PubMed] [Google Scholar]
- 13.Ronaghi M., Uhlen,M. and Nyren,P. (1998) A sequencing method based on real-time pyrophosphate. Science, 281, 363–365. [DOI] [PubMed] [Google Scholar]
- 14.Nyren P., Karamohamed,S. and Ronaghi,M. (1997) Detection of single-base changes using a bioluminometric primer extension assay. Anal. Biochem., 244, 367–373. [DOI] [PubMed] [Google Scholar]
- 15.Ahmadian A., Gharizadeh,B., Gustafsson,A.C., Sterky,F., Nyren,P., Uhlen,M. and Lundeberg,J. (2000) Single-nucleotide polymorphism analysis by pyrosequencing. Anal. Biochem., 280, 103–110. [DOI] [PubMed] [Google Scholar]
- 16.Schmalzing D., Belenky,A., Novotny,M.A., Koutny,L., Salas-Solano,O., El-Difrawy,S., Adourian,A., Matsudaira,P. and Ehrlich,D. (2000) Microchip electrophoresis: a method for high-speed SNP detection. Nucleic Acids Res., 28, e43. [DOI] [PMC free article] [PubMed] [Google Scholar]
- 17.Fan J.B., Chen,X., Halushka,M.K., Berno,A., Huang,X., Ryder,T., Lipshutz,R.J., Lockhart,D.J. and Chakravarti,A. (2000) Parallel genotyping of human SNPs using generic high-density oligonucleotide tag arrays. Genome Res., 10, 853–860. [DOI] [PMC free article] [PubMed] [Google Scholar]
- 18.Gilles P.N., Wu,D.J., Foster,C.B., Dillon,P.J. and Chanock,S.J. (1999) Single nucleotide polymorphic discrimination by an electronic dot blot assay on semiconductor microchips. Nat. Biotechnol., 17, 365–370. [DOI] [PubMed] [Google Scholar]
- 19.Sosnowski R.G., Tu,E., Butler,W.F., O’Connell,J.P. and Heller,M.J. (1997) Rapid determination of single base mismatch mutations in DNA hybrids by direct electric field control. Proc. Natl Acad. Sci. USA, 94, 1119–1123. [DOI] [PMC free article] [PubMed] [Google Scholar]
- 20.Boon E.M., Ceres,D.M., Drummond,T.G., Hill,M.G. and Barton,J.K. (2000) Mutation detection by electrocatalysis at DNA-modified electrodes. Nat. Biotechnol., 18, 1096–1100. [DOI] [PubMed] [Google Scholar]
- 21.Chen J., Iannone,M.A., Li,M.S., Taylor,J.D., Rivers,P., Nelsen,A.J., Slentz-Kesler,K.A., Roses,A. and Weiner,M.P. (2000) A microsphere-based assay for multiplexed single nucleotide polymorphism analysis using single base chain extension. Genome Res., 10, 549–557. [DOI] [PMC free article] [PubMed] [Google Scholar]
- 22.Lannone M.A., Taylor,J.D., Chen,J., Li,M.S., Rivers,P., Slentz-Kesler,K.A. and Weiner,M.P. (2000) Multiplexed single nucleotide polymorphism genotyping by oligonucleotide ligation and flow cytometry. Cytometry, 39, 131–140. [PubMed] [Google Scholar]
- 23.Syvanen A.C. (1999) From gels to chips: “minisequencing” primer extension for analysis of point mutations and single nucleotide polymorphisms. Hum. Mutat., 13, 1–10. [DOI] [PubMed] [Google Scholar]
- 24.Landegren U., Nilsson,M. and Kwok,P.Y. (1998) Reading bits of genetic information: methods for single-nucleotide polymorphism analysis. Genome Res., 8, 769–776. [DOI] [PubMed] [Google Scholar]
- 25.Nollau P. and Wagener,C. (1997) Methods for detection of point mutations: performance and quality assessment. IFCC Scientific Division, Committee on Molecular Biology Techniques. Clin. Chem., 43, 1114–1128. [PubMed] [Google Scholar]
- 26.Whitcombe D., Newton,C.R. and Little,S. (1998) Advances in approaches to DNA-based diagnostics. Curr. Opin. Biotechnol., 9, 602–608. [DOI] [PubMed] [Google Scholar]
- 27.Breen G., Harold,D., Ralston,S., Shaw,D. and St Clair,D. (2000) Determining SNP allele frequencies in DNA pools. Biotechniques, 28, 464–466, 468, 470. [DOI] [PubMed] [Google Scholar]
- 28.Campbell D.A., Valdes,A. and Spurr,N. (2000) Making drug discovery a SN(i)P. Drug Discov. Today, 5, 388–396. [Google Scholar]
- 29.Okano K., Uematsu,C., Matsunaga,H. and Kambara,H. (1998) Characteristics of selective polymerase chain reaction (PCR) using two-base anchored primers and improvement of its specificity. Electrophoresis, 19, 3071–3078. [DOI] [PubMed] [Google Scholar]
- 30.Capaldi S., Getts,R.C. and Jayasena,S.D. (2000) Signal amplification through nucleotide extension and excision on a dendritic DNA platform. Nucleic Acids Res., 28, e21. [DOI] [PMC free article] [PubMed] [Google Scholar]
- 31.Ronaghi M. (2000) Improved performance of pyrosequencing using single-stranded DNA-binding protein. Anal. Biochem., 286, 282–288. [DOI] [PubMed] [Google Scholar]
- 32.Hyman E.D. (1988) A new method of sequencing DNA. Anal. Biochem., 174, 423–436. [DOI] [PubMed] [Google Scholar]
- 33.Ronaghi M., Karamohamed,S., Pettersson,B., Uhlen,M. and Nyren,P. (1996) Real-time DNA sequencing using detection of pyrophosphate release. Anal. Biochem., 242, 84–89. [DOI] [PubMed] [Google Scholar]
- 34.Germer S., Holland,M.J. and Higuchi,R. (2000) High-throughput SNP allele-frequency determination in pooled DNA samples by kinetic PCR. Genome Res., 10, 258–266. [DOI] [PMC free article] [PubMed] [Google Scholar]


